ON THE RELEASE OF THE 2018 GRADE 10 JUNIOR SECONDARY CERTIFICATE (JSC) AND GRADE 12 NAMIBIA SENIOR SECONDARY CERTIFICATE (NSSC) HIGHER LEVEL RESULTS
←
→
Page content transcription
If your browser does not render page correctly, please read the page content below

1

                        REPUBLIC OF NAMIBIA
___________________________________________________________________

     MINISTRY OF EDUCATION, ARTS AND CULTURE
____________________________________________________________

                    PRESS STATEMENT

                               By

         Hon. Katrina Hanse-Himarwa, MP
                     Minister

   ON THE RELEASE OF THE 2018 GRADE 10
   JUNIOR SECONDARY CERTIFICATE (JSC)
       AND GRADE 12 NAMIBIA SENIOR
  SECONDARY CERTIFICATE (NSSC) HIGHER
             LEVEL RESULTS

              Issued: 19 December 2018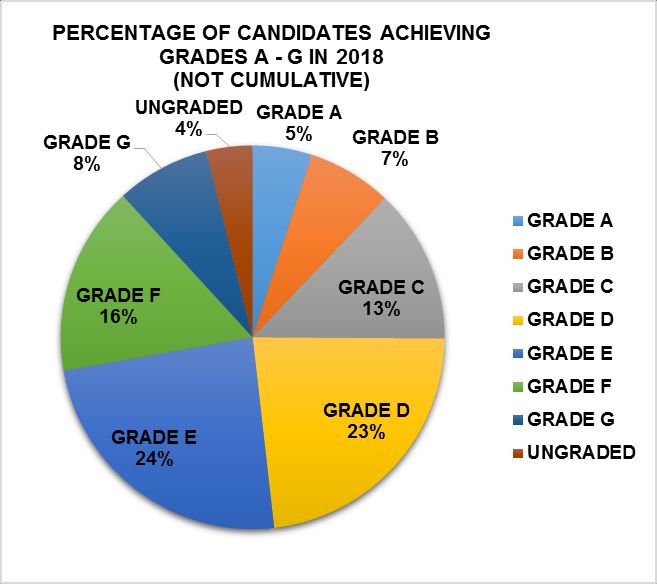
2

Ladies and gentlemen, a very good afternoon to you all,

Once again, as a nation, we have reached that time of the year where the
Ministry of Education, Arts and Culture must account for all the hard work
and investment, put into the 2018 academic year by the learners, teachers,
schools and parents.

The Ministry of Education, Arts and Culture is mandated to provide inclusive
quality education to the learners , hence, it is appropriate to inform the
nation on the outcomes of teaching and learning activities during the 2018
academic year. As the Minister entrusted with this very important task of
providing education to our learners, I have the honour to announce the
results of 2018 Academic year for the Junior Secondary (JSC) level and
Namibia National Senior Secondary High level.

The Ministry takes pride in the team that made this possible despite the
challenges that we faced with as a Ministry of Education. The entire Ministry
and in particular, the Directorate of National Examinations and Assessment,
the Regional Education Directorates, markers, parents and learners are
indeed appreciated and given a round of applause for the smooth
administration of 2018 National Examinations.

Significant strides have been made in the implementation of the revised
curriculum, and therefore the results of this year are surely historic. The
Junior Secondary Certificate is being phased out this year for the full–time
candidates and will be offered for part-time candidates only. This
opportunity is given to the candidates who wish to improve their
performance in 2019.

Against that background, ladies and gentlemen, the Junior Secondary Level
results for the full-time, part-time and NSSC Higher level candidates are to
be announced simultaneously in all the regions on Thursday, 20 December
2018 at 08:00 am. The details of sources where and how results can be
obtained were shared via the media and are also attached to this Press
3

statement. These include the website of the Ministry of Education, Arts and
Culture. In addition to that, the print media as well as short message
services (sms) will avail the results throughout the country.

The Ministry of Education, Arts and Culture relies heavily on the
complementary roles played by the distance education institutions both
public and private; and for that, we extend our appreciation for preparing
the part-time candidates.

Ladies and Gentlemen, allow me to announce the results of Grade 10 full-
time and part-time candidates as well as Grade 12 Higher Level that will be
made public tomorrow in all the fourteen regions.

1.   SUMMARY OF THE RESULTS FOR THE JUNIOR SECONDARY
     CERTIFICATE (JSC) GRADE 10 EXAMINATION FOR FULL–TIME
     CANDIDATES.

 In total fourty four thousand, eight hundred and sixty three (44,863) full-
time Grade 10 candidates sat for the final JSC examination compared to
fourty thousand, five hundred and ninety nine (40,599) of 2017. This shows
an increase of four thousand, two hundred and sixty four (4,264) candidates
representing a 10.5%. The National Junior Secondary Certificate (JSC)
Grade 10 Examination covers 35 subjects and 126 components (papers).

The Ministry kept the maximum points at 23 and F grade as a minimum
symbol in English for admission to Gr.11 in 2019.

Out of fourty four thousand, eight hundred and sixty three (44863)
candidates who sat for the Grade 10 full-time examination in 2018 at 731
schools, twenty three thousand, nine hundred and eleven (23911)
candidates, representing 53.3% have qualified for admission to grade 11 for
2019 compared to twenty two thousand, three hundred and sixty three
(22363), (55.3%) in 2017. The statistics indicate a drop in the performances
of the candidates with 2.0% between 2018 and 2017.
4
The results of the 62 hearing and visually impaired candidates who sat for
the JSC exams will be released together with the rest of the Grade 10
candidates. These candidates wrote at 3 different centers under special
conditions according to their individual requests. As per the decision of the
National Examination, Assessment and Certification Board in March 2015,
promotion requirements for the hearing and visually impaired candidates
have been set at a minimum of 19 points and F grade (symbol) in English.
From the total of 62 visually impaired candidates who sat for the Grade 10
national examinations,19 (30.6%) met the requirement for promotion to
Grade 11 in 2019. One center recorded 78,9% promotion of which 15 out of
19 candidates met the requirement with the highest scorer obtaining 37
points. This is a commendable work and a remarkable achievement which
indicates concerted and genuine efforts by learners with special needs.
Overall, the number of candidates qualifying for admission to Grade 11 in
2019 may increase depending on the performance of part-time candidates
who sat for 2018 National Examinations at registered part- time institutions
such as NAMCOL. Based on the trends over the past years, an estimated
number of 2500 part- time candidates may qualify for admission to Grade
11 in 2019.
2. COMPARISON OF SOME ASPECTS OF THE 2018 GRADE 10
EXAMINATIONS WITH PREVIOUS EXAMINATIONS.
2.1 Annexure A shows some aspects of the 2018 and 2017 JSC
examinations for full- time candidates in all subjects.
2.2 Table 1 gives the percentage of candidates at each grade (symbol)
from the highest grade (A) to the lowest grade (G) over a period of
five years. Therefore, the percentage of candidates appearing under
grade (A) represents those having obtained A grade only, the
percentage under B represents those who obtained B only, the
percentages under C represent those who obtained C only and so on.
(Please note these percentages are not cumulative percentages).5
TABLE 1
GRADE GRADE GRADE GRADE GRADE GRADE GRADE UNGRADED
YEAR
A (%) B (%) C (%) D (%) E (%) F (%) G (%) (%)
2015 5.1 7.3 12.9 23.2 25.8 16.1 6.7 2.9
2016 5.8 7.6 13.1 23.3 26.0 15.8 6.0 2.4
2017 5.3 7.6 13.1 23.4 24.7 15.9 6.9 3.1
2018 5.0 7.1 13.0 23.1 24.0 16.0 7.9 3.9
Differe
-0.3 -0.5 -0.1 -0.3 -0.7 +0.1 +1.0 +0.8
nce*
*Difference between 2018 and 2017
The results show an average drop of 0.4 % for Grades A to E whereas an
increase of 0.1% and 1.0% is observed at grades F and G respectively.
This shows a slight shift towards the F and G grades. The ungraded entries
increased with 0.8% while 96.1% candidates were graded throughout the
nine (9) subjects.
The pie-chart below shows the percentage performance of the candidates
per grade as indicated in the table above.6
2.3 Table 2 gives the comparisons of the 2018 and 2017 results at the
higher (Grades A + B + C), intermediate (Grade D + E), and the lower
(Grades F+G) grade ranges.
TABLE 2
YEAR GRADES A+B+C GRADES D+E GRADES F+G
(%) (%) (%)
2016 26.5 49.3 21.8
2017 26.0 48.1 22.8
2018 25.1 47.1 23.9
Difference over -0.9 -1.0 +1.1
2 years*
It is evident that the shift is slightly to the lower grades than the higher
grades when comparing the performance over the past three years.
2.4 Table 3 gives the cumulative percentages of candidates at the
various grades. The cumulative percentage at a specific grade, e.g. Grade
C, represents the percentages of candidates having obtained a Grade C
and above (Cumulative).7
TABLE 3
UN-
GRADE GRADE GRADE GRADE GRADE GRADE GRADE
YEAR GRADE
A (%) B (%) C (%) D (%) E (%) F (%) G (%)
D (%)
2015 5.1 12.4 25.3 48.5 74.3 90.4 97.1 2.9
2016 5.8 13.4 26.5 49.8 75.8 91.6 97.6 2.4
2017 5.3 12.9 26.0 49.4 74.1 90.0 96.9 3.1
2018 5.0 12.1 25.1 48.2 72.2 88.2 96.1 3.9
Differe
-0.3 -0.8 -0.9 -1.2 -1.9 -1.8 -0.8 +0.8
nce**
The data in table 3 is represented on the below bar chart that shows the
difference in cumulative percentages between 2018 and 2017.
D I F F E R E N C ES I N C U M U L AT I V E
P E R C E N T AG E B E T W E E N 2 0 1 8 AN D
2017
2017 2018
96.9%
96.1%
88.2%
90.0%
74.1%
72.2%
49.4%
48.2%
26.0%
25.1%
12.9%
12.1%
5.3%
5.0%
3.9%
3.1%
It is evident from the above data that the overall performance of the
candidates is slightly poorer with an average drop of 1.1% in A-G grades
when compared to 2017. As a result, the percentage for the ungraded
candidates increased slightly from 3.1% in 2017 to 3.9% in 2018 showing
that the candidates performed poorer this year with 0.8% increase in the
ungraded entries.8
3. COMPARISON OF SOME ASPECTS OF THE 2018 AND 2017 JSC
EXAMINATIONS FOR FULL-TIME CANDIDATES
The ministry analyzed the results in the following compulsory subjects in
order to observe the performance of the learners per region against the
national performance in percentages.
Region Year English Mathema Physical Life Geograp History
s 2nd tics Science Science hy (%)
Languag (%) (%) (%) (%)
e
(%)
||Kharas 2017 53.9 46.0 39.6 38.8 43.5 46.1
2018 51.2 42.2 37.3 37.9 39.6 43.6
Hardap 2017 52.7 42.8 35.2 36.0 40.7 40.2
2018 49.9 39.5 31.1 35.7 36.5 39.2
Khomas 2017 52.9 45.9 39.3 42.1 43.9 48.0
2018 51.4 44.1 38.1 43.1 41.5 46.3
Omaheke 2017 47.5 40.8 35.0 38.1 41.0 43.7
2018 46.2 38.3 33.8 39.2 40.8 41.5
Erongo 2017 54.7 47.7 40.0 43.0 44.2 47.4
2018 51.4 43.0 37.5 42.5 40.0 46.7
Otjozondjupa 2017 52.5 47.9 41.0 42.7 45.4 45.0
2018 49.8 43.7 38.8 41.2 40.7 42.1
Kunene 2017 48.0 50.3 41.2 44.6 46.4 47.4
2018 45.6 46.1 39.0 43.4 44.0 45.6
Omusati 2017 45.9 59.1 49.0 49.2 49.9 51.2
2018 44.8 53.9 47.5 50.1 47.5 46.3
Oshana 2017 47.9 57.1 49.6 47.2 50.1 49.2
2018 47.5 53.5 48.2 48.2 48.0 46.4
Ohangwena 2017 42.6 54.9 46.1 45.8 46.1 47.9
2018 42.5 53.4 45.7 48.1 44.4 46.1
Oshikoto 2017 47.7 60.8 52.0 50.4 52.1 52.2
2018 46.3 54.3 49.3 49.6 48.9 49.2
Kavango West 2017 45.5 47.6 47.8 44.8 45.8 47.8
2018 45.1 47.2 49.3 46.5 42.5 46.7
Kavango East 2017 49.2 52.1 45.3 45.0 47.6 50.2
2018 47.8 48.6 43.9 45.3 44.4 48.9
Zambezi 2017 50.3 48.3 43.6 44.4 43.8 48.2
2018 48.7 45.5 43.5 44.1 42.4 44.1
NATIONAL 2017 48.6 52.1 44.6 45.0 46.4 48.4
2018 47.2 48.8 43.4 45.6 44.1 46.0
The data in the above table indicates a slight drop in performance in all the
subjects except in Life science where an improvement of 0.6% can be9
observed. From the table above, five regions with the highest averaged
mark compared to the national average per subject have been listed.
Eng. 2nd Physical
Mathematics Life Science Geography History
language Science
1 2017 Erongo Oshikoto Oshikoto Oshikoto Oshikoto Oshikoto
2018 Oshikoto and
Erongo/Khomas Oshikoto Kavango Omusati Oshikoto Oshikoto
West
2 2017 //Kharas Omusati Oshana Omusati Oshana Omusati
2018 Kavango
//Kharas Omusati Oshana Oshikoto Oshana
East
3 2017 Kavango
Khomas Oshana Omusati Oshana Omusati
East
2018 Kavango
Otjozondjupa Oshana Omusati Oshana Omusati
West
4 2017 Kavango
Hardap Ohangwena Kavango west Ohangwena Oshana
East
2018 Kavango
Hardap Ohangwena Ohangwena Ohangwena Oshana
West
5 2017 Otjozondjupa Kunene Ohangwena Kavango East Kunene Zambezi
2018 Zambezi Kavango East Kavango East Kavango West Kunene Omusati
The Ministry appreciates the efforts made by respective regions to bring
improvement in specific subjects which will ultimately propel the Ministry to
the next level. The results indicate that the same regions are still performing
better than the others in specific subjects just like last year. However, a drop
in percentages in all the subjects is evident throughout the performance of
the regions.
4. PROVISION FOR GRADE 10 LEARNERS WHO DID NOT MEET THE
ADMISSION REQUIREMENTS TO GRADE 11
As mentioned earlier, this is a historic year, seeing that the current curriculum
is being phased out with this cohort of full- time candidates. However, a last
opportunity will be given to the candidates who did not meet the admission
requirement for Gr.11. Nonetheless, the Ministry would like to encourage
these candidates not to despair but to explore the following options in order10
to further their academic aspirations:
4.1 The NAMCOL remains a highly recognized and relevant
institution for learners to upgrade their subject symbols or
register for three or less subjects for NSSCO. Therefore all
affected learners are encouraged to register for tuition as well
as for examination at this institution and other part-time centers
registered with the Ministry of Education, Arts and Culture in a
timely fashion.
4.2 The Vocational Training Centers through the Namibia Training
Authority is also available as an avenue to further the academic
careers of those who are willing to follow that path.
4.3 Candidates that are 17 years and younger and who wish to
remain in formal schooling may join the new curriculum at
Grade 9 level at the school which he/she attended or elsewhere
and may be admitted provided space is available.
5. GRADE 10 (JSC) PART-TIME CANDIDATES
5.1 A total of 11 222 part-time candidates were registered for JSC
examination at the Namibian College of Open Learning (NAMCOL)
and other various distance education institutions registered with the
Ministry of Education, Arts and Culture.
5.2 Overall when analyzing the accumulative percentages, the results
reflect that part-time candidates performed poorer at higher grades A
– B with (1.6%), C- D with (20.4%) and lower grades E and G stands
at (87.6%). This means that the candidates did not perform well and
shifted more towards the lower grades. In total, the percentage
ungraded is 12.4 for part-time candidates.11
5.4 Comparison of performances in individual subjects (See
Annexure B)
It is noted that part-time candidates obtained a mean mark above 50 in
all African Languages excluding Khoekhoegowab. In other languages,
Afrikaans Second Language is the best performed subject with the
mean mark of 47.7 while Accounting is the subject with the lowest
mean mark of 24.9.
6. RESULTS OF THE NAMIBIA SENIOR SECONDARY CERTIFICATE
(NSSC) GRADE 12 HIGHER LEVEL EXAMINATIONS FOR FULL-
TIME AND PART-TIME CANDIDATES
The Grade 12 examination is taken at two levels namely, NSSC Higher
and Ordinary Levels. At this stage, we will only be releasing the
examination results for NSSC Higher Level. However, the finalization
of the NSSC Ordinary level results (full-time and part-time) is at an
advanced stage and will be released early in January 2019.
A total of seventeen thousand nine hundred and sixty eight (17 968)
candidates, comprising of sixteen thousand nine hundred and thirty
two (16 932) full-time and one thousand and thirty six (1036) part-time
candidates were registered for NSSC Higher Level subjects. The
number of Higher Level candidates increased by one thousand six
hundred and seventy two candidates (1 672) representing (10.3%)
when compared to 2017.
The 2018 results indicate an improved performance at Grades 1, 2 and
3 whereas a slight drop of 0.6% is observed at Grade 4. Only 6.1%
candidates were ungraded in different subjects. The graded entries
decrease with 0.6% from 94.5% to 93.9%between 2017 and 2018.
This year, 85.5% of the part-time candidates were graded in different
subjects.
The results show that 66.0% candidates obtained Grade 3 and better
grade in comparison of 65.8% of the candidates who obtained Grade 3
and better grade in 2017. Grade 3 is a minimum requirement for
admission to Universities. Therefore with the combination of Higher12
Level and Ordinary Level subjects, a significant number of candidates
may qualify for admission to Universities. The Ministry thus encourages
learners who have successfully completed grade 12 to seek admission
for further studies at institutions of higher learning locally, regionally
and internationally.
7. Cambridge Assessment International Education Prize Winners
In order to encourage good performance among learners, Cambridge
Assessment International Education is making the following prizes
available for excellent performances in the NSSC qualifications:
a) A National Open Scholarship for the best overall performance
in NSSC Higher Level (N$2 000-00),
b) Two national prizes for the best performance in six NSSC
Higher Level subjects (one female and one male, N$1 200-00
each) and,
c) Two national prizes for the best performance in five NSSC
Higher Level subjects (one male and one female N$1 200-00
each).
The 2018 prize winners are as follows:
Female Putter Sharzaan (National Open Scholarship for
best overall performance on aggregate score in
NSSC Higher Level)
N$2000.00, Windhoek Gymnasium
Female Diehl Kyana (National prize based on best
performance in six NSSC Higher Level subjects)
N$1200.00, St. Pauls College
Male Kersten Marko (National prize based on best
performance in six NSSC Higher Level subjects)
N$1200.00, Delta Secondary School13
Male Olajide Michael (National prize based on best
performance in five NSSC Higher Level subjects)
N$1200.00, St. Boniface College
Female: Berry Johane (National prize based on best
performance in five NSSC Higher Level subjects)
N$1200.00, Windhoek Gymnasium
10. PERFORMANCES IN INDIVIDUAL SUBJECTS NATIONALLY AND
PER REGION (See Annexures B1 and B2 - B15)
11. SUMMARY AND CONCLUSION
In summary, 53.3% of 2018 candidates who wrote the Grade 10
(JSC) examination met the minimum requirements of 23 points and
an F symbol in English for admission to Grade 11 in 2019. The
overall performance of the candidates is slightly poorer in all the
grades compared to 2017. At Higher Level, the outcome of 66.0% for
Grades 1 to 3 is commendable and the candidates are congratulated
for a job well done.
Although we worked tireless to make the year 2018 a memorable
one, the results unfortunately not meet our expectations.
Nonetheless, every year is a new opportunity for scholars to work
towards a better future. The Ministry urges all the schools with their
staff to do a thorough analysis of the results and come up with ways
of improving the performances in all the subjects for Higher Level
particularly. Equally, as it was done in the past, the Regional
Directors, once Ordinary Level results are released, will have
consultative meetings in their respective regions to deliberate on the
results, quality assurance and specific interventions.
May I take this opportunity to congratulate all the candidates on their
results and wish them a Merry Christmas and a Prosperous 2019. Our
special congratulatory message goes out to all outstanding performers
for their excellent results. The Ministry is hereby encouraging Regional14 Education Directorates to explore measures on how best to improve their results regionally and at school level. I thank you all.
You can also read