On the Use of Sodium Chloride and Calcined Diatomite Sludge as Additives to Improve the Engineering Properties of Bricks Made with a Clay Earth ...
←
→
Page content transcription
If your browser does not render page correctly, please read the page content below
minerals
Article
On the Use of Sodium Chloride and Calcined
Diatomite Sludge as Additives to Improve the
Engineering Properties of Bricks Made with a
Clay Earth from Jun (Granada, Spain)
María Laura Elias 1 and Giuseppe Cultrone 2, *
 1   Laboratorio de Técnicas y Materiales, Facultad de Arquitectura, Diseño y Urbanismo,
     Universidad Nacional del Litoral, Santa Fe S3000, Argentina; mlelias@unl.edu.ar
 2   Departamento de Mineralogía y Petrología, Facultad de Ciencias, Universidad de Granada,
     Granada 18002, Spain
 *   Correspondence: cultrone@ugr.es; Tel.: +34-958240077

 Received: 5 December 2018; Accepted: 17 January 2019; Published: 21 January 2019

 Abstract: Solid bricks manufactured out of clayey earth from a quarry near the city of Granada
 (Spain) were studied and compared with others to which two additives were added during the
 kneading of the raw material: Calcined diatomite sludge and sodium chloride. Samples with and
 without additives were fired at 800 ◦ C, 950 ◦ C, and 1100 ◦ C. New mineral phases were formed
 in the bricks after firing. These included gehlenite, diopside, and plagioclase, which is gradually
 enriched in calcium, and microcline, which is transformed into sanidine. Mullite and molysite also
 appeared in the bricks made with added salt. Porosity increased substantially in the bricks that
 contained diatomite sludge, while the addition of sodium chloride accelerated the mineralogical
 transformations and caused sintering at relatively low temperatures of 800 ◦ C. The bricks became
 more compact and less anisotropic as the firing temperature increased. This behaviour was less
 evident in the bricks with added diatomite sludge, which alters the orientation of the phyllosilicates.
 The bricks fired at 1100 ◦ C had the best physical parameters. However, the bricks with added sodium
 chloride fired at 800 ◦ C reached hygric and compactness values that were at least similar to bricks
 from the other groups fired at 950 ◦ C.

 Keywords: solid bricks; calcined diatomite sludge; sodium chloride; mineralogy; physical changes

1. Introduction
     Bricks are some of the oldest manmade masonry building materials, which is why they are often
found in monuments with great heritage value [1]. For bricks to last, they must have certain physical
and mineralogical properties [2–6]. These properties are undoubtedly related to the composition of the
raw material and the manufacturing process, such that the chemical and mineralogical composition,
the grain size, firing temperature, and the atmosphere (oxidation or reduction) inside the kiln all
have a considerable influence on the porosity, mechanical resistance, and colour of the bricks [7–11].
Bricks are usually made out of local earths, which means that the composition varies from one region
to the next. This also makes them very economical and easy to produce. The brick production process
has changed little over thousands of years. Perhaps the most important change is that today there is
tight control over the different stages of the production process to ensure that a more standardized,
high quality material is obtained. In spite of these controls, worn or damaged bricks can sometimes be
found in new buildings. This may be due to defects in the production process [12]. For this reason,
the brick industry is experimenting with new resources and ideas aimed at improving the properties

Minerals 2019, 9, 64; doi:10.3390/min9010064                                 www.mdpi.com/journal/minerals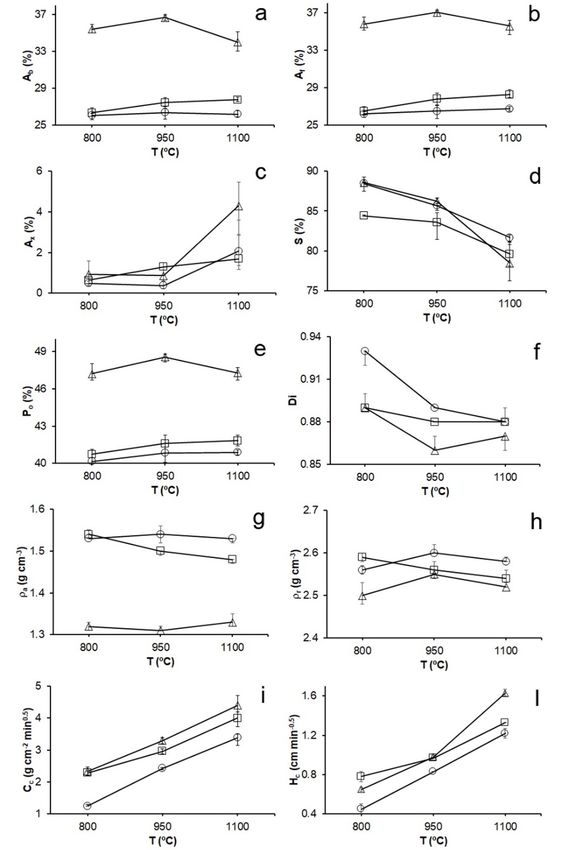
Minerals 2019, 9, 64                                                                                 2 of 22

of the fired product [13]. A significant number of research papers have been written on different
clayey raw materials and their performance in firing tests, with a view to their possible use in the brick
industry [14–17]. Recently, however, researchers have been focusing on the possibility of using waste
products from different industrial activities in the manufacture of building materials, as this would
help deal with the huge amounts of waste produced in this way and the problems associated with
their disposal [18–21]. Waste products of this kind could be used, for example, as additives in the mix
used in the manufacture of bricks. These additives can either perform functions that complement
those of the clayey earth or they can provide new properties for the ceramic paste. Additives are
used to correct the proportions of the tempers, melting agents, and colorants in the original clayey
earth and also to reduce the density of the samples, alter the porous system, and reduce the thermal
conductivity [22]. There is a very varied bibliography about the use of additives in bricks, as well as
various reviews of the literature that present the results in a comparative form [23–27]. Unfortunately,
almost all these cases are specific, often isolated studies, the results of which seem promising, but have
not been transferred to large-scale production.
       The objective of this paper is to assess the potential of diatomite sludge and common salt as
additives in brick production, as little research has so far been done on this issue. There are clear
differences between these two additives in terms of composition, origin, and organic matter content,
differences that will be reflected in the mineralogy and texture of the fired materials. Diatomite is a
sedimentary rock that is formed by the accumulation of skeletons of diatoms, unicellular marine algae
composed of amorphous silica (generally opal). Diatomite is commonly used in the filtration process in
the manufacture of beer, wine, and other liquids after its calcination at between 900 and 1000 ◦ C. At this
temperature, the organic matter in these micro-organisms is burnt and the surface area of the sediment
increases, freeing up space in the porous system. Sodium carbonate is added as a melting agent [28].
After calcination, the most important mineralogical change in the material is the transformation of
opal into cristobalite and quartz [29,30]. During the filtering of the beer, the diatomite traps the yeast
used in the fermentation process plus other particles remaining in the liquid. There are currently
no obvious reuses for this waste product, which means that its application in brickmaking could be
beneficial for both the brick industry and the environment. So far, little research has been done into the
possible reuse of calcined diatomite sludge in the construction industry and, more specifically, in the
manufacture of bricks. The very limited bibliography on additives in the brick production process
analyses the use of natural diatomite [31] or of diatomite mixed with fly ash [32]. These additives cause
changes in the porosity and mechanical properties of the fired materials. Galán Arboledas et al. [33]
observed that higher amounts of calcined diatomite waste led to an increase in the porosity of extruded
bricks and a reduction in their thermal conductivity. However, they did not provide any information
about the mineralogical evolution of the bricks made with the addition of diatomite.
       Halite has a whole variety of applications, ranging from its use in the food sector as a condiment
or preservative to its use in the industry in the production of hydrochloric acid and sodium carbonate,
among other products. This mineral is easily available in nature. However, as with diatomite sludge,
little research has been done on the use of salt as an additive in brick production. Ancient civilizations
perceived some improvements in ceramic production after the clayey earths were kneaded with
seawater [34,35]. From a textural point of view, research has demonstrated that salt acts as a melting
agent at low firing temperatures [36]. Other authors also observed that the addition of 0.5–1% common
salt can inhibit lime-blowing, a problem that arises when carbonates are present in the raw materials,
which can cause the bricks to break or burst [37]. The same authors observed the development of
yellow stains on the surface of the bricks when salt was used, but offered no explanations as to why
these stains appeared.
       There is only very limited data available on the interaction of these additives with bricks and their
potential use in the brick industry, a gap which this research tries to fill. The comparison of results
between bricks made with and without these additives will provide new data about the mineralogical
evolution of fired products, as well as the differences that they give rise to in the porous system,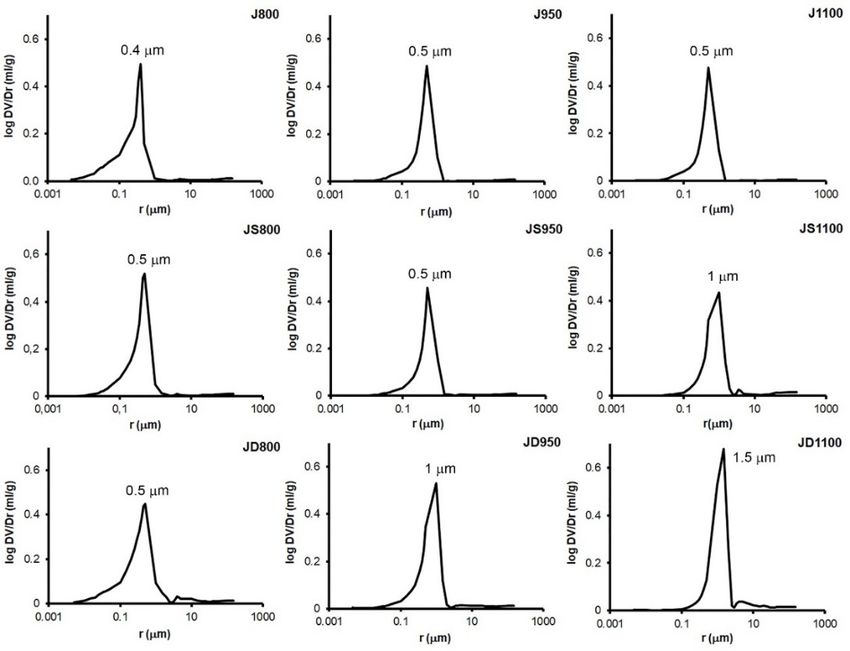
Minerals 2019, 9, 64 3 of 22
compactness, and colour. This will allow us to identify the best (or worst) characteristics of the fired
pieces, thus optimizing their physical properties and reducing production costs due to the need for
smaller amounts of raw material (in the case of calcined diatomite sludge) or lower firing temperatures
(in the case of sodium chloride).
2. Materials and Methods
2.1. Raw Materials, Additives, Preparation, and Firing of the Test Samples
The clayey earth selected for making the bricks comes from the village of Jun, near Granada
(Spain). Geologically speaking, these are grey clays, silts, and sands from the mid-late Turolian Age.
The clays are interspersed with small layers of gypsum, which are increasingly frequent towards the
top of the formation, and occasionally reddish carbonates that are rich in gastropods.
As regards the additives, the diatomite sludge with organic remains (above all barley and corn)
was supplied by the Spanish beer manufacturer, Cervezas Alhambra S.L. (Granada, Spain), which uses
diatomite in the beer filtering process. To reap the maximum environmental benefits, as much sludge
as possible should be added to the mix, providing of course that this does not have a detrimental effect
on the physical quality of the bricks [19]. In previous research [33], a proportion of 10 wt.% diatomite
sludge mixed with clayey earth was found to be the maximum amount that could be added to produce
bricks acceptable to the construction sector. The sodium chloride is edible sea salt produced by the
company, Salinera Española S.A. (Palma de Mallorca, Spain), which is obtained by natural evaporation
of seawater. 30 wt% salt was added to the water used for kneading the clay to analyse possible
improvements in the quality of the fired pieces, such as, for example, greater vitrification. The salt was
dissolved in running water before being used to knead the clayey earth. The salt concentration used in
this work is higher than that used by other authors [37] or than in seawater. The advantage of a higher
concentration is that it enhances the changes to be identified at mineralogical and physical levels.
The bricks were made according to craft techniques. The first stage was to remove the largest
fragments (centimetre size) composed above all of gypsum and carbonates. Then, approximately 1 kg
of clayey earth was mixed with 500 mL of water. This amount was calculated by adding the water little
by little until the paste acquired the necessary consistency for moulding the pieces. The paste was then
put in a wooden mould measuring 15 × 20 × 4 cm3 and was compacted by pressing down initially
with the palm of the hand and later with a rolling-pin. The pastes with and without additives were
taken out of their moulds while still damp and cut with tensor wire to obtain cubic samples with 4 cm
sides and elongated, prism-shaped samples measuring 2 × 4 × 8 cm3 . They were then left outside to
dry for approximately one week until they had lost all the kneading water.
The dried raw bricks were then fired in a Herotec CR-35 electric kiln in an oxidation atmosphere
at 800, 950, and 1100 ◦ C. 950 ◦ C is one of the most commonly used temperatures in brick production.
The other two firing temperatures, one lower than 950 ◦ C and the other higher, were chosen to study
the changes that take place in the mineralogy and the physical properties of the bricks over a range of
300 ◦ C. The temperature was kept constant at 100 ◦ C for 1 h to ensure that there was no moisture left
in any of the raw, unfired pieces. The samples were then heated up to the selected firing temperature
at a heating speed of 2 ◦ C/min. Once this temperature had been reached, it was maintained for 3 h.
Finally, the bricks were left to cool inside the kiln until the next day, with the whole firing-cooling
process lasting about 24 h. When the bricks were taken out of the kiln, they were submerged in water
in order to eliminate possible grains of calcium oxides that could cause them to shatter due to lime
blowing [37].
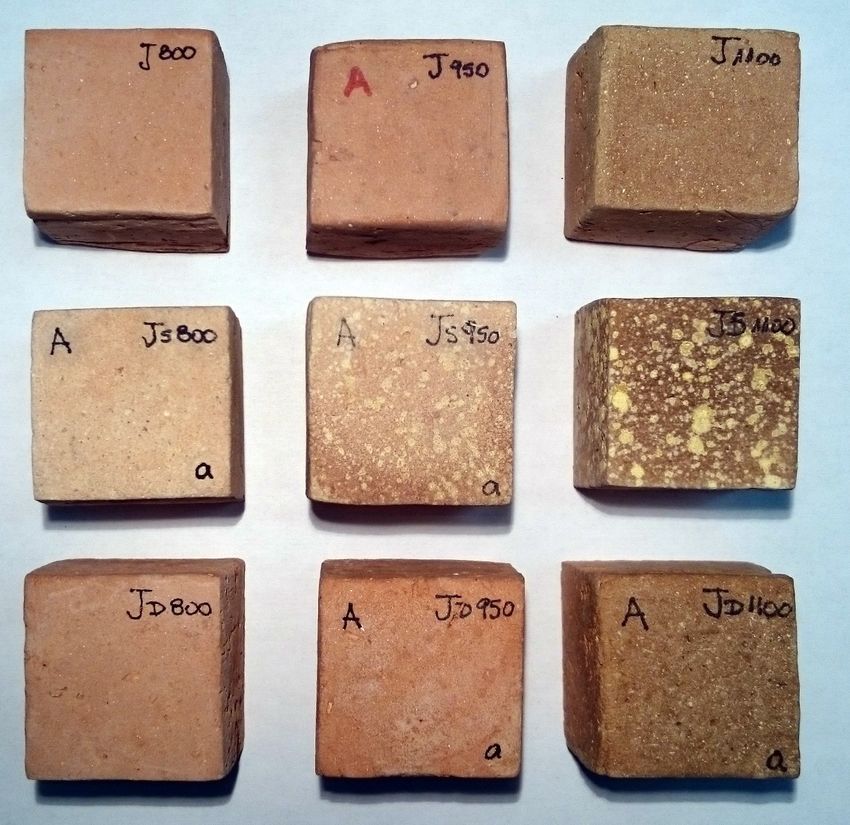
Overall, nine types of bricks were prepared. These were labelled as J, JS, and JD in order to
distinguish samples with no additives (J) from those made with added salt (JS) and those made with
calcined diatomite sludge (JD). Each label is followed by a number (800, 950, or 1100) specifying the
firing temperature in ◦ C.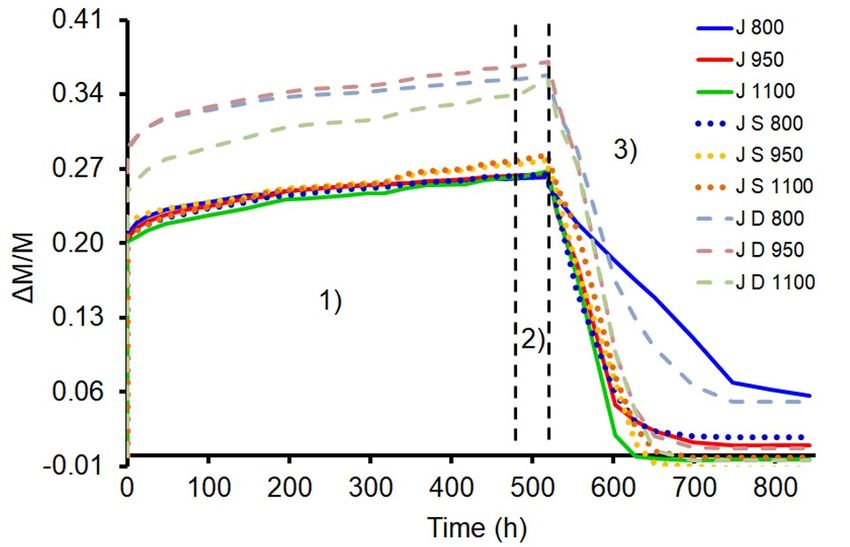
Minerals 2019, 9, 64                                                                               4 of 22

2.2. Analytical Techniques

2.2.1. Chemical and Mineralogical Characterization
      The clayey material and the calcined diatomite sludge were studied using X-ray fluorescence
(XRF). A Philips Magix Pro PW-2440 wavelength dispersive sequential spectrometer with a 4 kV X-ray
generator was used to analyse major and trace elements. Prior to the analysis, 5 g per sample was finely
milled in an agate mortar. The accuracy of the analytical results was evaluated by comparison with
certified values of analysed reference materials [38]. Typical accuracy is higher than 1.5% relative to a
concentration of 10%. Loss on ignition was determined gravimetrically as the weight loss was recorded
between 110 and 1000 ◦ C. The De Jongh model [39] was followed to convert the XRF intensities
into concentrations.
      The identification of the mineral phases in the raw material, the calcined diatomite sludge,
and the bricks with and without additives fired between 800 and 1100 ◦ C was carried out by X-ray
diffraction (XRD) using the disoriented powder method. Samples were milled in an agate mortar
to a particle size of less than 0.053 mm. A Philips X’Pert PRO diffractometer was used with the
following working conditions: CuKα radiation (λ = 1.5405 Å), 45 kV voltage, 40 mA current, 3–60◦ 2θ
explored area, and 0.1 2θs−1 goniometer speed. The interpretation of results was performed using the
XPowderX computer program [40]. Quantitative analysis of the mineral phases was performed using
the non-linear least square method to fit full-profile diffractograms and the results were compared
with standard values in the database. For this task, the program implements the following refinements
and corrections: a) Theoretical mass absorption coefficient of the samples as a function of the chemistry
and density of each phase found in the database sheets; b) pattern intensity ratio (PIR) correction,
initially using the experimental RIR (reference intensity ratio) for each mineral phase contained in the
sample and finally obtaining a PIR value upon full pattern refinement. The American Mineralogist
Crystal Structure Database (AMCSD) was used to identify the mineral phases. An indicative value
of the amorphous versus crystalline phases (a/c) ratio was provided. This ratio is based on the
mean value of the intensities, standard deviation, and area of the crystal reflection [40]. In order to
obtain the mineralogical composition of the grain fraction measuring less than 2 µm, 100 g of the
raw material was submerged in a beaker with deionized water treated with acetic acid (CH3 COOH)
with 1N concentration to eliminate carbonates. This treatment was repeated until the reaction ceased.
The sample was then washed several times to eliminate the acid in the water, and hydrogen peroxide
(H2 O2 ) with a concentration of 20 vol.% was added to eliminate any possible organic matter. After that,
sodium hexametaphosphate was added (5 g/L) to separate any aggregates that might have formed.
The fraction below 2 µm was separated using a Kubota Ks-8000 centrifuge and the oriented aggregate
method was used to study it with X-ray diffraction. Air-dried oriented aggregate (OA) was prepared
for general study. Other aggregates were also prepared: Dissolved with ethylene-glycol (OA + EG) to
detect the presence of smectites and chlorites [41], aggregates dissolved with dimethyl-sulfoxide (OA +
DMSO) to confirm the presence of kaolinite [42], and aggregates heated at 550 ◦ C to destroy kaolinite
and confirm the presence of chlorite.

2.2.2. Physical Characterization
     Mercury intrusion porosimetry (MIP) was used to study the porous system of the bricks using
a Micromeritics Autopore III 9410 apparatus (Norcross, GA, USA). This porosimeter can exert a
maximum pressure of 414 MPa and can identify pores with radii comprised between 0.003 and
360 µm. Freshly cut chips of about 1 cm3 were oven dried for 24 h at 100 ◦ C and then analysed.
Pore size measurements were taken on two fragments of each brick type. The specific surface area
(SSA), open porosity to Hg (PoMIP ), and apparent and real density values (ρaMIP and ρrMIP ) were
also calculated.
     One of the most important aspects to consider when evaluating the durability of construction
materials is their hygric behaviour, i.e., how these materials absorb and evaporate fluids over time.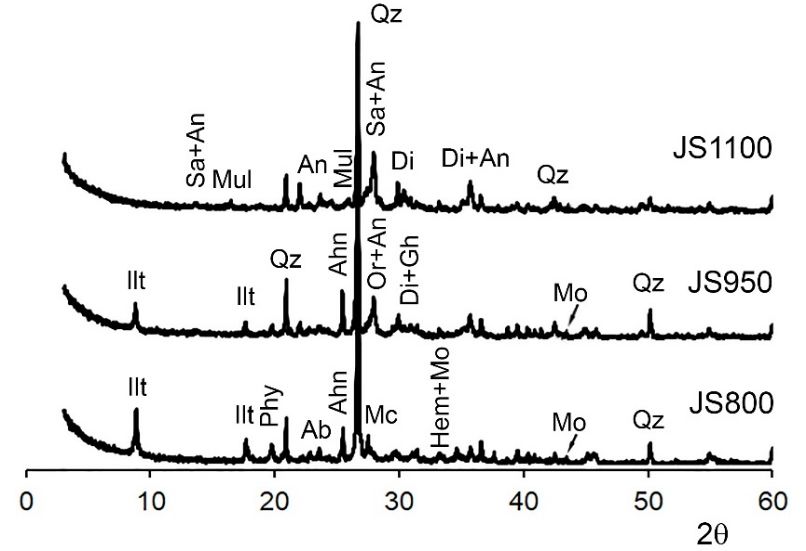
Minerals 2019, 9, 64                                                                                   5 of 22

This is because decay processes are often affected by the flow of water inside the porous system [43].
Water absorption at atmospheric pressure (Ab ) [44] and water absorption under vacuum (Af ) [45] were
measured as follows:
                                               Ml − M0
                                       Ab =              × 100;
                                                  M0
                                              MS − M0
                                       Af =              × 100,
                                                  M0
where M0 is the mass of the dried sample, Ml is the mass of the sample saturated with water
at atmospheric pressure, and MS is the mass of the sample saturated with water under vacuum.
The drying index (Di) was determined as follows [46]:
                                                    R tf
                                                     t0    f ( Mt )dt
                                           Di =                         ,
                                                      MS × t f

where Mt represents the decreasing water weight content as a function of time and t0 and tf are,
respectively, the start and end times for the test. A capillary test [47] was carried out to determine the
capillarity coefficient (Cc ) and the capillarity height (Hc ) [45] as follows:

                                                    Mt − M0
                                             Cc =      √ ;
                                                     A t
                                                        h
                                                 Hc = √
                                                          t

where Mt is the amount of water absorbed at time t, A is the surface of the sample in contact with the
water, and h is the height of the water rise by capillarity at time t.
     These tests enabled us to ascertain the degree of pore interconnection (Ax ) [48], the saturation
coefficient (S), apparent (ρa ) and real densities (ρr ), and open porosity (Po ) [49]. These parameters were
calculated as follows:
                                                    A f − Ab
                                            Ax =               × 100;
                                                        Af
                                                 M48h − M0
                                           S =                 × 100;
                                                  MS − M0
                                                       M0
                                           ρa =                × 100;
                                                  MS − M H
                                                       M0
                                           ρr =                × 100;
                                                  M0 − M H
                                                   MS − M0
                                           Po =                × 100,
                                                  MS − M H
where M48h is the mass of the sample after 48 h immersion in water at atmospheric pressure and MH is
the mass of the sample saturated with water under vacuum and weighed in water.
      Cubic samples were used for absorption-drying tests and prism-shaped samples for the capillarity
test. Even though the UNE-EN 1925 norm [47] requires the use of cubic samples in the capillary test,
elongated samples (twice as long) were used to better measure the capillarity height, given the rapid
ascent of water in these materials. Hygric tests were performed under controlled thermo-hygrometric
conditions (T = 18 ◦ C and RH = 35%) using deionized water. Three samples from each brick group
were analysed.
      Of the various available techniques for determining the physical properties of bricks, ultrasounds
and spectrophotometry are particularly attractive because they are not destructive. The compactness
of the bricks was measured using a Control 58-E4800 ultrasonic pulse velocity tester with a resolution
of 0.1 µm, 54 kHz transducers, and a contact surface of 3 cm in diameter under controlled temperature
and hygrometric conditions (20 ◦ C and relative humidity of 35%). An ultrasound eco-gel (Transonic
Gel, Telic S.A., Barcelona, Spain) was used to obtain a good coupling between the transducers and the
brick surfaces. The propagation velocity of the P waves was measured using the transmission method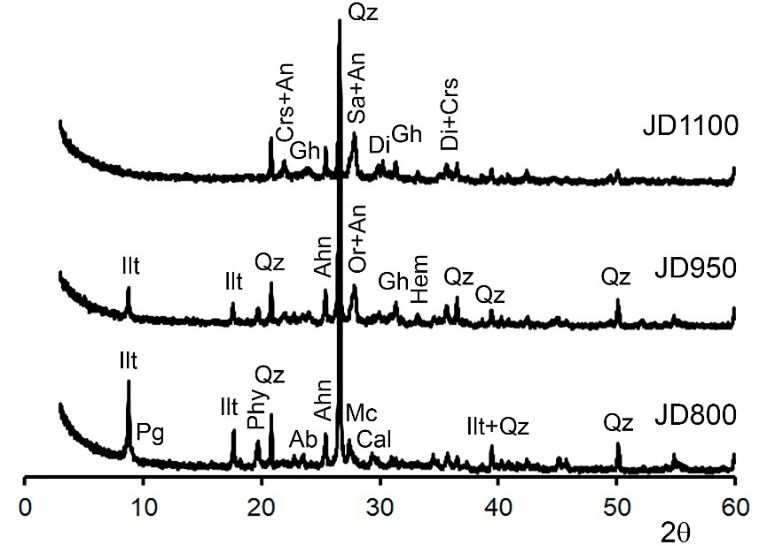
Minerals 2019, 9, 64                                                                                                         6 of 22

in accordance with the ASTM D2845 standard [50] on dry cubic samples in three orthogonal directions:
VP1 is the velocity perpendicular to the compaction plane of the raw material in the wooden box and
VP2 and VP3 are the velocities parallel to it. The structural (∆M) and relative anisotropies (∆m) were
calculated as follows [51]:
                                                      2VP1
                                   ∆M = 1 −                    × 100;
                                                  VP2 + VP3
                                               2(VP2 − VP3 )
                                      ∆m =                   × 100,
                                                VP2 + VP3
     Three samples per brick type were tested.
     The colour of the bricks was determined by spectrophotometry in accordance with the UNE-EN
15886 standard [52] in order to quantify any changes produced by additives or firing temperatures.
A Konica-Minolta CM-700d spectrophotometer (Tokyo, Japan) was used for this purpose. The working
conditions were: A circular measurement area of 8 mm diameter, D65 illuminant, 10◦ vision angle,
SCI/SCE mode, and light radiation range between 400 and 700 nm. The CIELab system was used
to calculate the lightness (L*, which varies from 0 to 100) and chromatic (a* and b*, which vary from
−60 to +60) parameters. The spectrophotometer performs an auto averaging of two values on the
measurement area. Six measurements were made for each brick type. In order to verify the possible
effects of the additives on the colour, the colours of the samples made with and without additives were
compared by measuring the colour difference. The colour difference, ∆E, was calculated as follows:
                                            q
                                                              2                 2                 2
                                   ∆E =           L1∗ − L2∗        + a1∗ − a2∗        + b1∗ − b2∗

where L1∗ , a1∗ , and b1∗ are the lightness and chromaticity values for the bricks without additives and L2∗ ,
a2∗ , and b2∗ are those for bricks with additives.

3. Results

3.1. Raw Materials and Additives
     The clayey earth from Jun is composed above all of silica and alumina and appreciable amounts
of calcium and iron. The diatomite sludge is mainly composed of silica and small amounts of alumina,
calcium, iron, and sodium. The loss on ignition (LOI) is 10% in the clayey earth and 15% in the
diatomite sludge. The LOI values may be due to the likely presence of carbonates in the clayey earth
and of organic matter in the sludge (Table 1).

      Table 1. Chemical analysis of major oxides (in wt%) and trace elements (in ppm) in the clayey earth
      raw material from Jun and the calcined diatomite sludge. LOI = loss on ignition.

       Sample          SiO2     Al2 O3   Fe2 O3     MnO        MgO         CaO         Na2 O    K2 O     TiO2     P2 O5   LOI
        Raw            49.27    16.92     5.69      0.07           2.50     9.65        0.99    2.98      0.67    0.14    10.39
      Diatomite        66.77     5.45     2.75      0.04           1.59     3.00        2.27    1.12      0.34    0.48    15.71
                        Zr        V       Cr         Co             Ni      Cu          Zn       Ga       Ba       As     Mo
        Raw            201.10   168.10   97.80      21.80          44.90   24.80       85.30    18.30    423.60   24.30   4.30
      Diatomite         79.90   194.90   136.60      3.20          62.70   216.50      273.30    4.30    448.90    7.40   8.70
                        Nb       Pb       Rb         Sb             Sr      Th           U          Y
        Raw            18.20    18.50    105.10     0.60       782.60       7.30        0.30    19.80
      Diatomite         5.80    22.30     32.90     1.50        75.60       7.30        6.60    14.60

    In mineralogical terms, the clayey earth is composed above all of quartz and phyllosilicates
and smaller quantities of calcite, dolomite, plagioclases, and K-feldspars (Figure 1a and Table 2).
Gypsum was also identified. This sulphate is quite common in this soil and was formed in the Granada
depression during the Turolian Age due to processes of chemical precipitation and evaporation of
water from lacustrine environments [53]. The clay fraction is composed of illite, kaolinite, chlorite,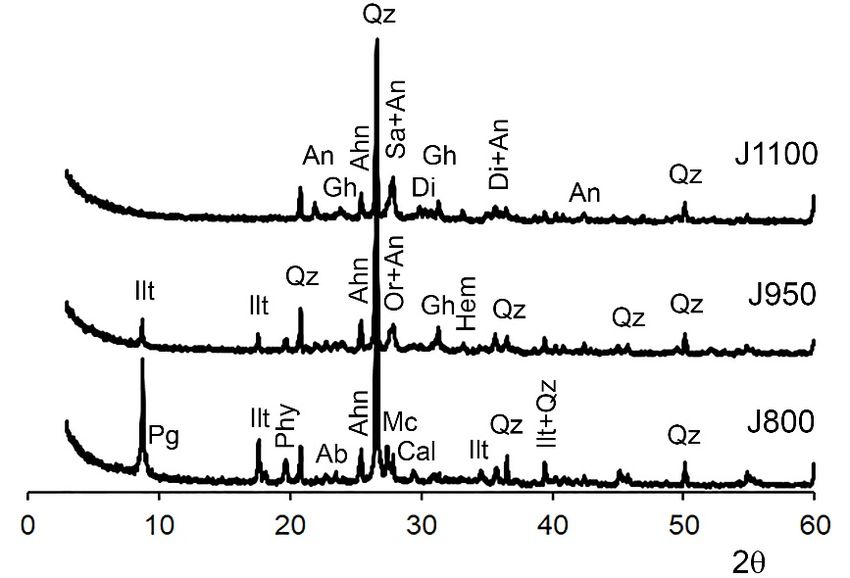
Minerals 2019, 9, 64                                                                                                           7 of 22

smectites, and paragonite (Figure 1b). After treatment with ethylene glycol, the displacement of the
reflection (001) of the smectites shifted from 14 Å to 17 Å, approximately, was observed. This indicates
that smectites can expand, leaving the reflection (001) of the chlorite (previously masked by the
smectites) more visible. The presence of kaolinite was confirmed using dimethyl sulfoxide, by the
displacement of the reflection (001) to 11.2 Å. Finally, heating to 550 ◦ C destroyed both the smectites
and the kaolinite, leaving the reflections of illite, chlorite, and paragonite visible (Figure 1b). Paragonite
is an unusual clay mineral, which is produced by the transport of metamorphic minerals originally
from  Sierra2019,
    Minerals  Nevada
                  9, x FOR[54].
                           PEER REVIEW                                                               7 of 21

      Figure    1. 1.
           Figure    X Xray
                          raydiffraction
                               diffraction patterns   forthe
                                           patterns for   theraw
                                                               raw    material
                                                                   material    from
                                                                            from  Jun Jun   (a), oriented
                                                                                       (a), oriented        aggregates
                                                                                                      aggregates   from thefrom
      the clay
           clayfraction
                  fraction(b)(b)
                               andand   calcined
                                    calcined       diatomite
                                              diatomite  sludgesludge   (c). Oriented
                                                                 (c). Oriented aggregatesaggregates    are: (OA),
                                                                                            are: Air-dried   Air-dried    (OA),
                                                                                                                    solvated
      solvated     with ethylene-glycol
           with ethylene-glycol              (OAsolvated
                                     (OA + EG),    + EG), solvated     with dimethyl-sulfoxide
                                                            with dimethyl-sulfoxide     (OA + DMSO), (OAheated
                                                                                                          + DMSO),at 550heated
                                                                                                                          °C
      at 550    ◦
           (OA C     (OALegend
                  + 550).   + 550).(mineral
                                       Legend    (mineral
                                              symbols   aftersymbols
                                                               Whitneyafter   Whitney
                                                                         and Evans   [55]):and
                                                                                            Qz Evans    [55]):
                                                                                                = quartz,       Qz =Gp
                                                                                                          Ilt = illite;  quartz,
                                                                                                                            =
      Ilt =gypsum;
            illite; GpCal= gypsum;
                             = calcite;Cal
                                        Dol= calcite; Dol =Hem
                                             = dolomite;      dolomite;  Hem =Chl
                                                                   = hematite;   hematite;   Chl =Kln
                                                                                     = chlorite;    chlorite; Kln = kaolinite;
                                                                                                       = kaolinite;    Fsp =
      Fsp feldspar/plagioclase
            = feldspar/plagioclase       (in general);
                                    (in general); Sme =Sme    = smectite;
                                                         smectite;         Pg = paragonite;
                                                                    Pg = paragonite;            Crs = cristobalite.
                                                                                      Crs = cristobalite.

    3.2. Mineralogy of Fired Bricks
         The mineralogy of the fired samples is similar to that resulting from high temperature
    metamorphic processes in which the high speed at which the minerals are heated causes extreme
    reactions, preventing stable phases from developing and favouring the presence of metastable
    phases [56].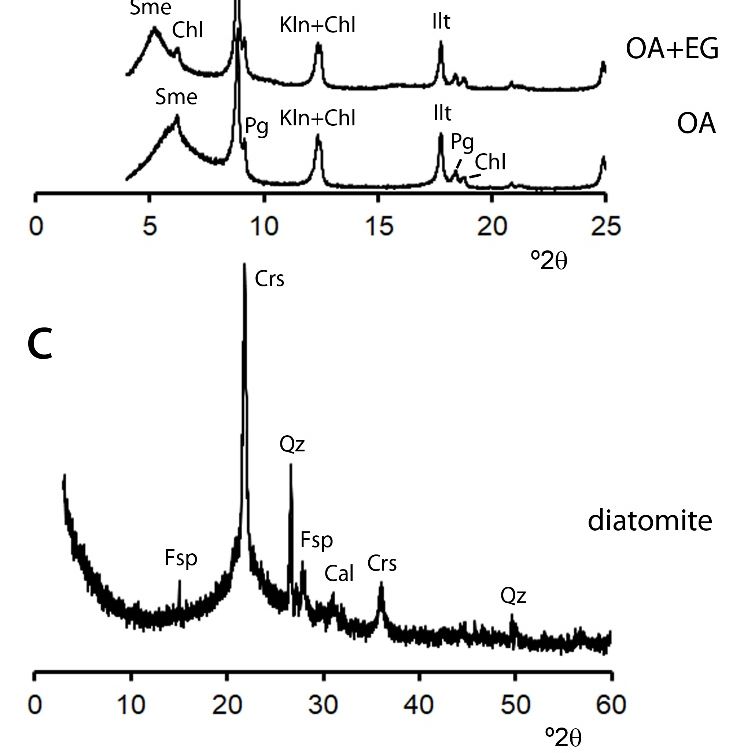
Minerals 2019, 9, 64                                                                                              8 of 22

     The mineralogy of the diatomite sludge was also studied. It is mainly composed of cristobalite,
as well as quartz, calcite, and albite (Figure 1c). In fact, in chemical terms, this sludge was rich in
amorphous silica while also having appreciable amounts of calcium (which led to the formation of
calcite) and of aluminium and sodium (which enabled the crystallization of albite). As mentioned
earlier, sodium carbonate is normally added during the diatomite calcination process as a melting
agent. The curve followed by the diffractogram suggests a substantial amount of the amorphous phase.

3.2. Mineralogy of Fired Bricks
     The mineralogy of the fired samples is similar to that resulting from high temperature
metamorphic processes in which the high speed at which the minerals are heated causes extreme
reactions, preventing stable phases from developing and favouring the presence of metastable
phases [56].
     The samples without additives fired at 800 ◦ C are composed above all of quartz, K-feldspars,
and plagioclases (Table 2 and Figure 2). Of the different carbonates identified in the raw material,
dolomite is no longer present although there is a small reflection of the calcite at 3.03 Å. The types
and concentrations of phyllosilicates also diminish, leaving only the dehydroxylated phases of illite
and paragonite (Table 2 and Figure 2). At 950 ◦ C, the calcite and paragonite also disappear and the
concentrations of illite are reduced. New mineral phases begin to develop at this temperature as a
result of the reaction between carbonates and silicates. These include gehlenite and plagioclase, which
is now anorthitic due to its enrichment in calcium (Table 2 and Figure 2).

      Table 2. Mineralogical composition of the raw material (raw), bricks without additives (J), and with
      added sodium chloride (JS) and calcined diatomite sludge (JD) fired at 800 ◦ C, 950 ◦ C, and 1100 ◦ C.
      Qz = quartz (789); Ilt/Ms =illite/muscovite (2013); Chl/Kln = chlorite/kaolinite (4285); Pg = paragonite
      (8408); Cal = calcite (98); Dol = dolomite (86); Gp = gypsum (4651); Anh = anhydrite (5117); Hem =
      hematite (143); Mc = microcline (5216); Or = orthoclase (313); Sa = sanidine (18062); Ab = albite (536);
      An = anorthite (370); Gh = gehlenite (5090); Di = diopside (1334); Mul = mullite (1059); Crs = cristobalite
      (10750); Mo = molysite (12857); a/c = amorphous/crystal relationship. AMCSD codes are indicated in
      brackets after each mineral name. Mineral abbreviations after Whitney and Evans [55].

         Title         Raw     J800    J950     J1100     JS800     JS950    JS1100    JD800    JD950    JD1100
          Qz           36.11   35.74   35.93     24.41    40.56     32.15    25.83     35.97     32.61    23.61
       Ilt/Ms           9.60    9.87    7.84               8.36      3.22               7.99      6.53
       Chl/kln          3.81
          Pg            6.38   7.00                        5.95                         5.68
         Cal            4.65   1.44                                                     2.36
         Dol            1.35
         Gp            6.08
         Anh                   8.99    12.99     11.01    13.08     12.88              10.29     9.92     10.25
        Hem                            0.81      1.55     1.55      1.33      1.23     0.74      1.37     0.87
         Mc            17.90   22.97                      17.37                        24.87
          Or                           7.39                         7.79                         9.32
          Sa                                     4.23                        11.65                         4.84
          Ab           14.12   13.99                      11.81                        11.38
         An                            29.37     49.07              33.48    47.51               35.66    49.33
          Gh                            5.67     4.40               2.00      1.33                3.72    3.60
          Di                                     5.32               6.20      8.56                        6.10
         Mul                                                                 3.10
         Crs                                                                            0.72     0.88      1.40
         Mo                                               1.32      0.96     0.78
         a/c           0.038   0.042   0.069     0.106    0.055     0.068    0.088     0.051     0.064    0.118

      The gehlenite may be formed by the following reaction between illite and calcite:

                                        illite     calcite       gehlenite
                                                                                                                     (1)
              2KAl2 (Si3 Al)O10 (OH)2 + 6CaCO3 → 3Ca2 Al2 SiO7 + 3SiO2 + K2 O + 2H2 O + 6CO2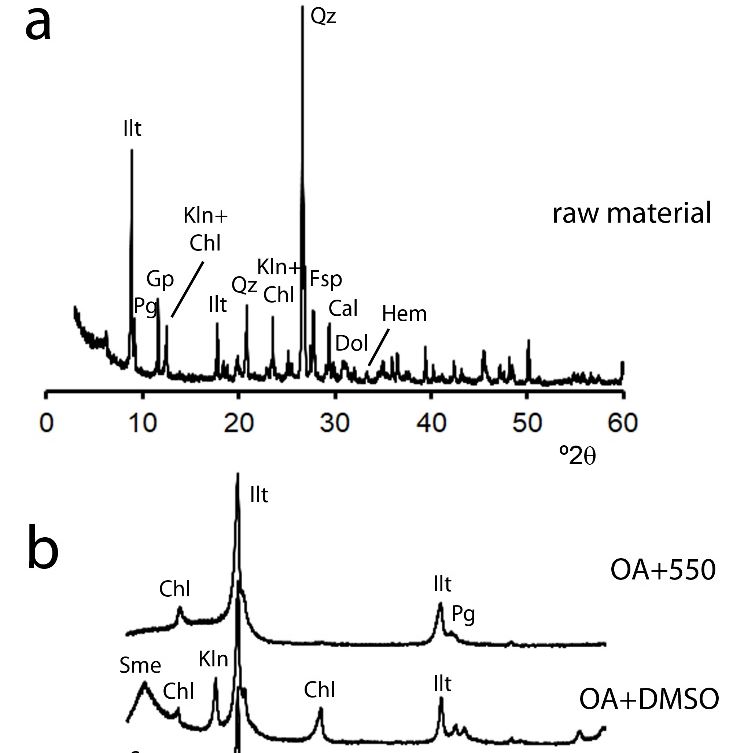
Minerals 2019, 9, 64 9 of 22
or by the reaction on the contact edges between potassium feldspar and calcite:
K-feldspar calcite gehlenite
(2)
2KAlSi3 O8 + 2CaCO3 → Ca2 Al2 SiO7 + 5SiO2 + K2 O + 2CO2
Anorthite may appear after the reaction of calcite with quartz and potassium feldspar as follows:
calcite quartz K-feldspar anorthite
(3)
CaCO3 + 2SiO2 + 2KAlSi3 O8 → CaAl2 Si2 O8 + K2 O + 6SiO2 + CO2
At 1100 ◦ C there is a considerable increase in anorthite, while the orthoclase is transformed into
the most stable high temperature polymorph, sanidine. The diopside formed by the reaction between
quartz
Mineralsand
2019,dolomite alsoREVIEW
9, x FOR PEER appears: 9 of 21
dolomitedolomite
quartzquartz diopside
diopside (4)
CaMg(CO3 )2 + 2SiO2 → CaMgSi2 O6 + 2CO2 (4)
CaMg(CO3)2 + 2SiO2 → CaMgSi2O6 + 2CO2
As the firing temperature increases, hematite starts developing due to the crystallization of the
As the firing temperature increases, hematite starts developing due to the crystallization of the
iron present in the raw material.
iron present in the raw material.
The concentration of the quartz diminishes above all at 1100 ◦ C (Table 2) as the edges of the grains
The concentration of the quartz diminishes above all at 1100 °C (Table 2) as the edges of the
of this mineral react with the carbonates to form calcium and magnesium silicates. The fired bricks
grains of this mineral react with the carbonates to form calcium and magnesium silicates. The fired
normally contain anhydrite due to the presence of gypsum in the raw material.
bricks normally contain anhydrite due to the presence of gypsum in the raw material.
Figure 2.
Figure 2. XXray
raydiffraction
diffraction patterns
patternsof bricks without
of bricks additives
without (J) fired
additives at 800at°C,
(J) fired 950◦ C,
800 and◦1100
°C,950 °C.
C, and
1100 ◦
Legend: Qz = quartz,
C. Legend: Ilt = illite/muscovite;
Qz = quartz, Pg = paragonite;
Ilt = illite/muscovite; Phy: phyllosilicates
Pg = paragonite; (in general);
Phy: phyllosilicates Cal =
(in general);
calcite;
Cal Ahn =Ahn
= calcite; anhydrite; Hem =Hem
= anhydrite; hematite; Mc = microcline;
= hematite; Or = orthoclase;
Mc = microcline; Sa = sanidine;
Or = orthoclase; Sa =Ab = albite;
sanidine;
Ab
An==albite; An =Gh
anorthite; anorthite; Gh =Digehlenite;
= gehlenite; Di Minerals
= diopside. = diopside. Minerals abbreviations
abbreviations after Whitney after
andWhitney and
Evans [55].
Evans [55].
The samples that contain sodium chloride and diatomite sludge behave similarly to the samples
The samples
without additivesthat
in contain sodium
the evolution ofchloride and diatomite
the mineral sludge
phases (Table behave
2 and similarly
Figures 3 andto4).
theThe
samples
small
without additives
differences in the evolution
are manifested of the mineral
in an increase phases (Tableof2K-feldspar
in the concentration and Figuresat 3950
andand4). 1100
The °C.
small
As
differences are manifested in an increase in the concentration of K-feldspar at 950 and 1100 ◦ C.
happens with the samples without additives, an increase in the concentration and the calcium
As happens with
enrichment the samples
of plagioclases canwithout additives,
be observed as theanfiring
increase in the concentration
temperature increases. The andphyllosilicates
the calcium
enrichment of plagioclases can be observed as the firing temperature increases. The
undergo a similar process, with a progressive decline in the illite/muscovite, until they disappear phyllosilicates
undergo a similar
completely between process, with
950 and 1100a °C,
progressive decline in
while paragonite canthe illite/muscovite,
only until they
be detected in traces up todisappear
800 °C. In
completely between 950chloride, ◦
and 1100theC,decline
while paragonite canofonly be detected in traces up°C,
to 800 ◦
the presence of sodium in the amount quartz begins earlier at 950 whenC.it
is consumed in the reaction with the dolomite to form diopside (Table 2).
As the firing temperature increases, there is a constant increase in the proportion of the
amorphous phase compared to the crystalline phase in all the samples (with and without additives)
(a/c, Table 2). This suggests that the samples are undergoing vitrification. It is important to bear in
mind that the a/c ratio in JD samples is due not only to the vitrification of samples, but also to the
amorphous phase (organic matter) present in the diatomite sludge (see background noise of XRDMinerals 2019, 9, 64 10 of 22
In the presence of sodium chloride, the decline in the amount of quartz begins earlier at 950 ◦ C, when it
is consumed in the reaction with the dolomite to form diopside (Table 2).
As the firing temperature increases, there is a constant increase in the proportion of the amorphous
phase compared to the crystalline phase in all the samples (with and without additives) (a/c, Table 2).
This suggests that the samples are undergoing vitrification. It is important to bear in mind that the
a/c ratio in JD samples is due not only to the vitrification of samples, but also to the amorphous
phase (organic matter) present in the diatomite sludge (see background noise of XRD pattern in
Figure 1c and LOI value in Table 1). The a/c ratio values indicate that the samples with sodium
chloride start vitrifying earlier than the others. Indeed, as NaCl is a low temperature melting agent,
Stimmell et al. [35] observed that it reduced the temperature at which sintering and vitrification of the
bricks began at 800 ◦ C. The mineralogy also undergoes more profound changes, bringing forward the
appearance of diopside to 950 ◦ C and increasing its concentration at 1100 ◦ C. Mullite only appears
in this group of bricks (Table 2 and Figure 3). On this question, Cultrone et al. [36] observed greater
development of newly formed phases in the presence of sodium chloride even when this salt had been
added to the bricks in very low concentrations (0.5%). Mullite is formed at 1100 ◦ C, replacing the
illite/muscovite (epitaxial replacement according to Rodríguez Navarro et al. [57]) in line with the
following reaction:
Minerals 2019, 9, x FOR PEER REVIEW 10 of 21
illite quartz mullite K-feldspar
illite quartz mullite K-feldspar (5)
3KAl2 (Si3 Al)O10 (OH)2 + 2SiO2 → Al6 Si2 O13 + 3KAlSi3 O8 + 3H2 O
(5)
3KAl2(Si3Al)O10(OH)2 + 2SiO2 → Al6Si2O13 + 3KAlSi3O8 + 3H2O
Another mineral phase that was identified exclusively in the samples with sodium chloride was
Another mineral phase that was identified exclusively in the samples with sodium chloride was
molysite (FeCl3 ), a chloride that is rarely found in bricks and is more typical of volcanic fumaroles.
molysite (FeCl3), a chloride that is rarely found in bricks and is more typical of volcanic fumaroles.
This seems to be related with the appearance of unusual yellowy-green halos on the surface of the
This seems to be related with the appearance of unusual yellowy-green halos on the surface of the
samples. According to Stimmell et al. [35], who had observed similar marks on bricks made with
samples. According to Stimmell et al. [35], who had observed similar marks on bricks made with
seawater, the sodium chloride interacts with the clayey matrix, forming HCl. This acid then reacts
seawater, the sodium chloride interacts with the clayey matrix, forming HCl. This acid then reacts
with the hematite in the matrix, forming iron chloride. These halos are most likely to be found in the
with the hematite in the matrix, forming iron chloride. These halos are most likely to be found in the
places with the highest Cl concentrations, i.e., where the halite crystals were present.
places with the highest Cl concentrations, i.e., where the halite crystals were present.
Figure 3. X ray diffraction patterns of bricks with added sodium chloride (JS) fired at 800 ◦ C, 950 ◦ C, and
Figure 3. X ray diffraction patterns of bricks with added sodium chloride (JS) fired at 800 °C, 950 °C,
1100 ◦ C. Legend: Qz = quartz, Ilt = illite/muscovite; Phy: phyllosilicates (in general); Ahn = anhydrite;
and 1100 °C. Legend: Qz = quartz, Ilt = illite/muscovite; Phy: phyllosilicates (in general); Ahn =
Hem = hematite; Mc = microcline; Or = orthoclase; Sa = sanidine; Ab = albite; An = anorthite; Gh =
anhydrite; Hem = hematite; Mc = microcline; Or = orthoclase; Sa = sanidine; Ab = albite; An =
gehlenite; Di = diopside; Mul = mullite; Mo = molysite. Minerals abbreviations after Whitney and
anorthite; Gh = gehlenite; Di = diopside; Mul = mullite; Mo = molysite. Minerals abbreviations after
Evans [55].
Whitney and Evans [55].
In the samples made with diatomite, traces of cristobalite can be observed at 800 and 950 °C
with higher concentrations at 1100 °C (Table 2 and Figure 4). The increase in temperature produced
the same silicates (gehlenite, anorthite, diopside) observed previously in other bricks.Figure 3. X ray diffraction patterns of bricks with added sodium chloride (JS) fired at 800 °C, 950 °C,
and 1100 °C. Legend: Qz = quartz, Ilt = illite/muscovite; Phy: phyllosilicates (in general); Ahn =
anhydrite;
Minerals 2019, 9, 64 Hem = hematite; Mc = microcline; Or = orthoclase; Sa = sanidine; Ab = albite; An 11 = of 22
anorthite; Gh = gehlenite; Di = diopside; Mul = mullite; Mo = molysite. Minerals abbreviations after
Whitney and Evans [55].
In the samples made with diatomite, traces of cristobalite can be observed at 800 and 950 ◦ C with
Inconcentrations
higher the samples made
at 1100 ◦ Cdiatomite,
with traces
(Table 2 and of cristobalite
Figure can beinobserved
4). The increase at 800
temperature and 950the
produced °C
with higher concentrations at 1100 °C (Table 2 and Figure 4). The increase in temperature
same silicates (gehlenite, anorthite, diopside) observed previously in other bricks. produced
the same silicates (gehlenite, anorthite, diopside) observed previously in other bricks.
◦ C,
Figure
Figure 4.4. XXray
raydiffraction
diffractionpatterns
patternsofofbricks
bricks with
withadded
addedcalcined diatomite
calcined sludge
diatomite (JD)(JD)
sludge fired at 800
fired at 800
950 ◦ C, and 1100 ◦ C. Legend: Qz = quartz, Ilt = illite/muscovite; Pg = paragonite; Phy: phyllosilicates
°C, 950 °C, and 1100 °C. Legend: Qz = quartz, Ilt = illite/muscovite; Pg = paragonite; Phy:
(in general); Cal
phyllosilicates (in=general);
calcite; Ahn
Cal == calcite;
anhydrite;
Ahn Hem = hematite;
= anhydrite; HemMc = microcline;
= hematite; Mc = Or = orthoclase;
microcline; Or =
Sa = sanidine;
orthoclase; Sa Ab = albite;Ab
= sanidine; An==albite;
anorthite;
An =Gh = gehlenite;
anorthite; Gh = Di = diopside;
gehlenite; Di = Crs = cristobalite.
diopside; Minerals
Crs = cristobalite.
abbreviations after Whitney
Minerals abbreviations afterand Evansand
Whitney [55].Evans [55].
3.3. Porous System
The shape of the porometric curves and the height of the main peak are similar to those found
in modern brick production [58]. The MIP test showed that the bricks had a unimodal pore size
distribution with the maximum peak of pores at around 1 µm (Figure 5). This peak shifts towards
larger pores as the firing temperature increases, although the said shift is almost imperceptible in
the case of bricks without additives, as can be seen in the porometric curves (from 0.4 µm at 800 ◦ C
to 0.5 µm at 950 and 1100 ◦ C). The shift is more pronounced in samples with added NaCl (from 0.5
µm at 800 ◦ C to 1 µm at 1100 ◦ C) and above all, in those with added diatomite sludge (from 0.5 µm
at 800 ◦ C to 1.5 at 1100 ◦ C). This means that both additives cause alterations in the porous system.
The greatest alterations take place with the addition of diatomite sludge, and above all at the highest
firing temperature. However, as can be seen in Figure 5, the first six curves (J and JS) are similar, which
means that the differences described above are probably not very significant.
While the largest pores generally increase in number from 800 ◦ C to 1100 ◦ C, the smallest pores
fall in number due to the decline in specific surface area (see Table 3 for SSA and pore range of less
than 0.1 µm). This happens constantly and in all types of brick. The reduction of SSA is more evident
in JS bricks because, as commented earlier, sodium chloride is a low temperature melting agent and
causes alterations in the texture of the bricks at 800 ◦ C. In fact, if one compares the results in Table 3,
at 800 ◦ C, the specific surface area of JS bricks is slightly less than 3 m2 /g, while in the other two
groups, SSA is well above 5 m2 /g. This indicates that the porous system of the bricks undergoes
greater changes in the presence of sodium chloride. These differences are less pronounced at 950 ◦ C
when the other two brick groups also begin to vitrify. However, even at 1100 ◦ C, the JS bricks still
show the lowest SSA values (Table 3). These results are important because a lower specific surface area
means that the material is less exposed to pollutants and other decay agents [59]. The highest open
porosity values were obtained in JD bricks, mainly because of the combustion and subsequent loss
of the organic matter present in the diatomite sludge. These bricks reached open porosity values of
45–46%, substantially higher than those for J and JS bricks (PoMIP , Table 3). Open porosity is a crucial
parameter, together with specific surface area and pore size distribution, for assessing the durability ofMinerals 2019, 9, x FOR PEER REVIEW 11 of 21
3.3. Porous System
Minerals 2019, 9, 64 12 of 22
The shape of the porometric curves and the height of the main peak are similar to those found
in modern brick production
porous materials [58].is The
[58,60]. There MIP an
normally test showed
inverse thatbetween
relation the bricks had and
porosity a unimodal
durabilitypore
[61]. size
distribution with the maximum peak of pores at around 1 µm (Figure 5). This
These results suggest that the addition of 10% in weight of diatomite sludge can have negative effects peak shifts towards
larger
onpores as the firing
the durability temperature
of bricks. However,increases,
in general,although the said
all the bricks shiftporous
are very is almost imperceptible
because the methodin the
case of
ofproduction
bricks withoutused additives, as can
in this research be seen inimitates
(handmade) the porometric
traditional curves
methods(from 0.4 μm
rather thanatindustrial
800 °C to 0.5
μm at 950 and 1100 °C). The shift is more pronounced in samples with added NaCl (from
processes (i.e., pressed or extruded) in which porosity values of around 20% are usual [62]. Real 0.5 μm at
density
values
800 °C μm
to 1 (ρrMIPat, 1100
Table°C)
3) were similarall,
and above in all
in the samples
those and were
with added characteristic
diatomite sludge of(from 0.5 μm at of
the mineralogy 800 °C
a clayey earth rich in quartz and phyllosilicates. The lowest values were measured
to 1.5 at 1100 °C). This means that both additives cause alterations in the porous system. The greatest in samples with
diatomite because 3 ), a mineral phase that is only found in
alterations take placeof with
the low density
the additionof cristobalite (2.32 g/cm
of diatomite sludge, and above all at the highest firing
JD bricks (Table 2). The lowest apparent density value (ρ , Table 3) was again obtained by JD bricks,
temperature. However, as can be seen in Figure 5, theaMIP first six curves (J and JS) are similar, which
which is normal since they were the most porous.
means that the differences described above are probably not very significant.
Figure 5. Pore size distribution curves for bricks with and without additives fired at 800, 950, and
Figure 5.◦Pore size distribution curves for bricks with and without additives fired at 800, 950, and
1100 C. Pore radius (in µm) versus log (DV/Dr) (in mL/g). The radius at the maximum peak
1100 °C. Pore radius (in μm) versus log (DV/Dr) (in mL/g). The radius at the maximum peak is
is indicated.
indicated.
Table 3. Results of MIP test on brick samples with and without additives fired at 800, 950, and 1100 ◦ C.
SSAthe
While = specific
largestsurface
poresarea (m2 /g); ρincrease
generally aMIP = apparent (g·cm−800
densityfrom
in number
3 ); ρ
°C = 1100
rMIPto real density
°C, the(g·cm −3 );
smallest pores
PoMIP = open porosity (%); relative porosity distribution (%) according to pore size ranges (10 µm).
than 0.1 µm). This happens constantly and in all types of brick. The reduction of SSA is more evident
in JS bricks because,SSA as commented
ρaMIP earlier,
ρrMIP sodiumPoMIPchloride
10 agent and
causes alterations
J800 in5.85
the texture
1.49of the bricks
2.41 at 800
38.32°C. In 19.41
fact, if one77.02
compares the results
1.50 2.07in Table 3,
J950 2.27 1.47 2.44 39.75 7.19 89.47 2 1.10 2.24
at 800 °C,J1100
the specific
2.09
surface area of 2.51
1.48
JS bricks 40.86
is slightly6.45
less than 3 m /g, while
90.80 0.78
in the
1.97
other two
groups, SSAJS800is well2.98
above 51.45
m /g. This
2 2.47indicates
41.42that the porous86.96
8.93 system of2.03the bricks
2.08undergoes
JS950 1.77 1.46 2.51 41.75 5.80 89.68 1.93 2.59
greater changes in the presence of sodium chloride. These differences are less pronounced at 950 °C
JS1100 1.12 1.39 2.45 43.36 2.13 78.66 13.57 5.64
when theJD800other two5.48
brick groups
1.29 also begin
2.41 to vitrify.
46.43 However,
14.65 even
75.54 at 1100 °C,
6.32 the JS
3.49bricks still
JD950 2.10 1.23 2.25 45.25 5.12 81.19 9.36
show the lowest SSA values (Table 3). These results are important because a lower specific surface 4.33
JD1100 1.32 1.28 2.31 44.83 1.45 43.41 48.40 6.75
area means that the material is less exposed to pollutants and other decay agents [59]. The highest
open porosity values were obtained in JD bricks, mainly because of the combustion and subsequent
loss of the organic matter present in the diatomite sludge. These bricks reached open porosity values
of 45–46%, substantially higher than those for J and JS bricks (PoMIP, Table 3). Open porosity is a
crucial parameter, together with specific surface area and pore size distribution, for assessing theJS800 2.98 1.45 2.47 41.42 8.93 86.96 2.03 2.08
JS950 1.77 1.46 2.51 41.75 5.80 89.68 1.93 2.59
JS1100 1.12 1.39 2.45 43.36 2.13 78.66 13.57 5.64
JD800 5.48 1.29 2.41 46.43 14.65 75.54 6.32 3.49
Minerals 2019, 9, 64 JD950 2.10 1.23 2.25 45.25 5.12 81.19 9.36 4.33 13 of 22
JD1100 1.32 1.28 2.31 44.83 1.45 43.41 48.40 6.75
Thehygric
The hygrictests
testsshow
showhowhowsome
someparameters
parametersobtained
obtainedwithwiththis
thistechnique
techniqueare
areinfluenced
influencedby
bybrick
brick composition, while others depend more on the firing temperature. The water absorption
composition, while others depend more on the firing temperature. The water absorption curves, for curves,
for example,
example, showshow
two two clearly
clearly defined
defined groups
groups (Figure
(Figure 6),6), alreadyidentified
already identifiedbybyMIP:
MIP: One
One group
groupcontains
contains the
the bricks made with diatomite sludge (JD) and the other contains the bricks made without additives
bricks made with diatomite sludge (JD) and the other contains the bricks made without additives (J) and
(J) and with sodium chloride (JS). J and JS absorb a similar amount of water, substantially less than JD.
with sodium chloride (JS). J and JS absorb a similar amount of water, substantially less than JD. One hour
One hour after starting the test, J and JS had reached a 20% absorption level, while JD was already
after starting the test, J and JS had reached a 20% absorption level, while JD was already between 25%
between 25% and 30%, depending on the firing temperature of the bricks (Figure 6).
and 30%, depending on the firing temperature of the bricks (Figure 6).
Figure 6. 1) Water absorption at atmospheric pressure, 2) water absorption under vacuum and 3)
Figure 6. 1) Water absorption at atmospheric pressure, 2) water absorption under vacuum and 3) drying
drying curves for bricks without additives (J), with added sodium chloride (S) and with added calcined
curves for bricks without additives (J), with ◦added sodium chloride (S) and with added calcined
diatomite sludge (D) fired at 800, 950, and 1100 C. Weight variation (∆M/M) versus time (in hours).
diatomite sludge (D) fired at 800, 950, and 1100 °C. Weight variation (ΔM/M) versus time (in hours).
At the end of the water absorption test at atmospheric pressure, the group of bricks that had
absorbed the least water was J (Ab is around 26%, Figure 7a), closely followed by JS (Ab ranges
approximately between 26% and 27.8%), while JD showed the highest Ab values (between 34% and
36.7%). The differences between the three brick groups observed after the water absorption test at
atmospheric pressure remained after the water absorption test under vacuum (Af , Figure 7b) and
clearly indicate that the addition of diatomite alters the hygric behaviour of bricks.At the end of the water absorption test at atmospheric pressure, the group of bricks that had
absorbed the least water was J (Ab is around 26%, Figure 7a), closely followed by JS (Ab ranges
approximately between 26% and 27.8%), while JD showed the highest Ab values (between 34% and
36.7%). The differences between the three brick groups observed after the water absorption test at
Minerals 2019, 9, 64 14 of 22
atmospheric pressure remained after the water absorption test under vacuum (Af, Figure 7b) and
clearly indicate that the addition of diatomite alters the hygric behaviour of bricks.
Figure 7. Hygric parameters of brick samples made without additives (open circle), with added sodium
Figure 7. Hygric parameters of brick samples made without additives (open circle), with added
chloride (open square) and with added calcined diatomite sludge (open triangle) fired at 800, 950 and
sodium chloride (open square) and with added calcined diatomite sludge (open triangle) fired at 800,
1100 ◦ C. (a) Water absorption at atmospheric pressure (Ab , in %); (b) water absorption under vacuum
950 and 1100 °C. (a) Water absorption at atmospheric pressure (Ab, in %); (b) water absorption under
(Af , in %); (c) saturation coefficient (S, in %); (d) degree of pore interconnection (Ax ); (e) drying index
vacuum (Af, in %); (c) saturation coefficient (S, in %); (d) degree of pore interconnection (Ax); −(e)
(Di); (f) open porosity (Po , in %); (g) apparent density (ρa , in g cm−3 ); (h) real density (ρr , in g·cm 3 );
drying index (Di); (f) open porosity (P−o2, in %); (g) apparent density (ρa, in g cm-3); (h) −
real density (ρr ,
(i) capillarity coefficient (Cc , in g·cm min ); (l) capillarity height (Hc , in cm·min 0.5 ). Error bars
0.5
in g·cm−3); (i) capillarity coefficient (Cc, in g·cm−2 min0.5); (l) capillarity height (Hc, in cm·min−0.5). Error
indicate maximum and minimum values.
bars indicate maximum and minimum values.
The high water absorption capacity of the JD brick group is potentially dangerous for its durability,
since the water that flows inside a porous material may contain soluble salts that can crystallize in
capillaries, generating fissures or fractures that cause irreparable damage [63,64]. The saturation
coefficient (S, Figure 7c) falls as the firing temperature increases and the degree of interconnectionMinerals 2019, 9, 64 15 of 22
between the pores worsens (Ax , Figure 7d). The latter parameter is related to the tortuous nature of the
porous system. As the difference between the values for water absorption at atmospheric pressure
(Ab ) and water absorption under vacuum (Af ) increases, so Ax increases; in other words, it becomes
more difficult for water to circulate inside the material [48]. These results indicate that the increase in
temperature helps modify the porous system with the development of the vitreous phase and as a
result reduces communication between the pores. This hypothesis confirms the MIP data that showed
a shift in the maximum pore size peak towards higher sizes and the reduction of specific surface area
values (see Figure 5 and Table 3). On this question, Cultrone et al. [9] demonstrated the existence
of a direct relationship between the development of vitrification in bricks and the reduction of pore
interconnectivity. The XRD results also highlighted an increase in the amount of the amorphous phase
in line with the increase in the firing temperature in all the groups of bricks (a/c, Table 2). The drying
index (Di) is another key hygric parameter because porous materials are less durable when water is
retained inside them over long periods [65]. Di is quite similar in all the samples with only minimal
variations according to the firing temperature (Figure 7e). The only exception is J800, which is the
slowest sample to dry (see the slope of the drying curve in Figure 6 and the Di value in Figure 7e).
Note that J800 is the sample that retained the most water at the end of the drying test followed by
JD800 (Figure 6). This is probably because these samples had the largest amounts of small pores of
less than 0.1 µm (Table 3), the last ones to lose water, which may cause local stresses and cracking [66].
The capillarity test shows an analogous trend to that of water absorption. In fact, the two parameters
obtained from this test, the capillary coefficient and the capillary rise height (Cc and Hc , respectively,
Figure 7i,l), clearly indicate that in all the bricks, water rises more quickly as the firing temperature
increases. The open porosity (Po , Figure 7f) values again show the influence of brick composition in the
porous system, especially in the bricks made with diatomite sludge. It is important to remember that
this additive has intrinsic porosity that may have increased the capacity of JD bricks to absorb more
water and reach higher porosity values than the other bricks. These values are similar to those obtained
in the MIP test. The ρr value determined by the hygric test is always higher than that calculated using
MIP and is closer to the density of the mineral phases identified by XRD (Table 2). In fact, ρr ranges
between 2.5 and 2.6 g/cm3 , close to the density of quartz (2.66 g/cm3 ) and K-feldspar (2.56 g/cm3 ).
The lowest ρr value was again measured in JD samples because of the presence of the low-density
mineral, cristobalite, as mentioned earlier in the description of the MIP results. J and JD bricks show a
similar trend with lower ρr values at 800 ◦ C compared to those at 950 ◦ C and 1100 ◦ C. This is probably
due to the Ca-enrichment of plagioclases (ρr albite is 2.61 g/cm3 , while that of anorthite is 2.76 g/cm3 ).
Instead, JS shows a gradual reduction in ρr from 800 ◦ C to 1100 ◦ C. This can be attributed in part to
the reduction in anhydrite (ρr is 2.95 g/cm3 ), which disappears at 1100 ◦ C. Moreover, JS registers a
gradual decrease in hematite (5.25 g/cm3 ) and molysite (2.91 g/cm3 ), while in J and JD, there is an
increase in hematite after 800 ◦ C. In general, the small differences observed between the MIP and
hygric tests are due to the limitations of each experimental technique, which use different liquids
and intrusion pressures. In addition, MIP only considers pores with cylindrical geometry and can
erroneously interpret the size of “ink-bottle-shaped” pores [67].
3.4. Ultrasounds
In all the samples, the lowest velocity is always VP1 due to the position of the phyllosilicates
perpendicular to the direction of propagation of the ultrasound waves (Table 4). The phyllosilicates
acquired this orientation during the preparation of the test samples due to the pressure exerted when
the clayey earth is placed inside the wooden mould. The difference between VP1 and the other two
velocities falls as the firing temperature increases, above all at 1100 ◦ C, when the samples are more
vitrified and the lamina shape of the crystals is partially lost, so reducing the anisotropy of the pieces
(∆M, Table 4). The comparison of the P-wave velocities in the three orthogonal directions therefore
allowed us to verify and confirm the vitrification of bricks in line with the increase in the firing
temperature, as had already been deduced by the XRD, MIP, and hygric tests. VP2 and VP3 obtainedMinerals 2019, 9, 64 16 of 22
similar values, a fact confirmed by their low relative anisotropy values (∆m, Table 4). Exceptions are
the samples made with diatomite sludge, which suggests that this additive helps to alter the texture of
the bricks (i.e., it modifies the porous system and the orientation of the phyllosilicates). In fact, the
total anisotropy of JD samples shows no clear trend, indicating that this additive is randomly oriented
inside the bricks and the firing temperature does not help to homogenize the texture (∆M, Table 4).
For their part, the results for the J and JS groups show that there is an inverse relationship between
the anisotropy and the vitrification of the samples, a fact that could be indirectly deduced by the a/c
ratio (XRD, Table 2). In fact, JS has a lower ∆M value than J when fired at 800 ◦ C because of the high
vitrification of bricks with added sodium chloride. JS maintains lower anisotropy at 950 ◦ C (and higher
vitrification), but at 1100 ◦ C, the higher a/c value measured in J samples (Table 2) favours a lower
degree of anisotropy than JS. The bricks without additives showed the highest velocity values, reaching
2400 m/s at 1100 ◦ C, while in the bricks made with added salt or diatomite sludge, the maximum
velocity was 2200 m/s (Table 4). This velocity is reached in bricks made with salt at 800 ◦ C, another
demonstration of the effect of salt as a low-temperature melting agent. When one looks at the mean
velocity of P waves (Vp , Table 4), an increase in velocity or, in other words, in compactness can be
observed as the firing temperature rises. This increase takes place more gradually when no additives
are used. JS and JD follow this trend particularly between 950 and 1100 ◦ C when the samples are
vitrifying (and NaCl does not have the same influence as at 800 ◦ C). The VP values are in line with
those measured in other bricks fired at similar temperatures [68], mostly when no additives are present.
Brick compactness (and mechanical resistance) can therefore vary considerably depending on the type
of additive and the percentage added to the clayey material [25]. No comparative data were found
in the literature for bricks made with sodium chloride, and although Galán Arboledas et al. [33] had
researched the use of diatomite sludge, a comparison with their findings was complicated by the
fact that they measured the bending strength instead of the ultrasound velocities and because they
followed a different brick manufacturing procedure (extrusion instead of manual).
Table 4. Speed of ultrasonic wave propagation (in m/s), mean velocity (Vp , in m/s), structural (∆M),
and relative (∆m) anisotropies (in %) of bricks with and without additives fired at 800, 950, and 1100 ◦ C.
VP1 , VP2 , and VP3 are the ultrasound velocities measured in three orthogonal directions.
VP1 VP2 VP3 Vp ∆M ∆m
J800 1625 2342 2339 2102 30.56 0.12
J950 1789 2338 2337 2155 23.47 0.07
J1100 2181 2438 2392 2337 9.69 1.91
JS800 1660 2212 2234 2036 25.32 0.97
JS950 1668 1943 1967 1859 14.69 1.21
JS1100 1804 2054 2002 1953 11.02 2.58
JD800 1610 1972 2051 1877 19.96 3.91
JD950 1514 2046 1835 1798 21.99 10.85
JD1100 1796 2102 2228 2042 17.03 5.83
3.5. Colour
Colour is a very important parameter, given that a change in the colour of the bricks can have a
negative effect on the image of the building being constructed or restored. Slight variations in colour
are not easily perceived by the human eye, which means that the colour measurement techniques
are important for ensuring reliable results for evaluation purposes [69]. There are no important
colour differences between the unfired samples without additives and those made with added sodium
chloride and only very slight differences with those made with diatomite sludge (Table 5). As the salt is
dissolved in the kneading water, it does not alter the colour of the pieces when they dry. The diatomite,
however, is added in the form of solid particles in a concentration of 10% in weight compared to the
raw material. The result is that the unfired samples made with this additive are slightly less luminous
and have a slightly higher chromaticity. After firing, a reduction in the chromaticity (a* and b*) andYou can also read