ONGC ADAPTING TO SHIFTING GOVERNMENT PRIORITIES: AN ASSESSMENT OF THE PERFORMANCE AND STRATEGY OF INDIA'S
←
→
Page content transcription
If your browser does not render page correctly, please read the page content below
PROGRAM ON ENERGY AND
          SUSTAINABLE DEVELOPMENT

                                                     Working Paper
                                                         #91
                                                      April 2010

A DAPTING TO S HIFTING G OVERNMENT P RIORITIES : A N
A SSESSMENT OF THE P ERFORMANCE AND S TRATEGY OF I NDIA ’ S
ONGC
VARUN RAI

FREEMAN SPOGLI INSTITUTE FOR INTERNATIONAL STUDIES
About the Program on Energy and Sustainable Development
The Program on Energy and Sustainable Development (PESD) is an international,
interdisciplinary program that studies how institutions shape patterns of energy
production and use, in turn affecting human welfare and environmental quality. PESD
research examines issues including effective policies for addressing climate change, the
role of national oil companies in the world oil market, the emerging global coal market,
business models for carbon capture and storage, adaptation of wholesale electricity
markets to support a low-carbon future, and how modern energy services can be supplied
sustainably to the world’s poorest regions.

The Program, established in September 2001, includes a global network of scholars—
based at centers of excellence on six continents—in law, political science, economics and
engineering. It is part of the Freeman Spogli Institute for International Studies at
Stanford University.

PESD gratefully acknowledges substantial core funding from BP and EPRI.

                  Program on Energy and Sustainable Development
                           Encina Hall East, Room E415
                                Stanford University
                             Stanford, CA 94305-6055
                              http://pesd.stanford.edu

22 April 2010                                2                              PESD WP #91
About the National Oil Company Platform
While the role of the state is declining in nearly every sector of world economic activity,
in hydrocarbons the pattern is quite different. State-controlled oil companies—so-called
national oil companies (NOCs)— remain firmly in control over the vast majority of the
world's hydrocarbon resources. Some NOCs are singular in their control over their home
market; others engage in various joint ventures or are exposed to competition. PESD’s
study on National Oil Companies focuses on fifteen NOCs: Saudi Aramco, NIOC
(National Iranian Oil Co), KPC (Kuwait Petroleum Co), PDVSA (Petróleos de
Venezuela) , ADNOC (Abu Dhabi National Oil Company), NNPC (Nigerian National
Petroleum Co), PEMEX, Gazprom , Sonatrach, CNPC, Petrobras, Petronas, ONGC,
Sonangol, and Statoil.
These enterprises differ markedly in the ways they are governed and the tightness of their
relationship with government. NOCs also vary in their geological gifts, as some are
endowed with prodigious quantities of "easy" oil while others must work harder and
apply highly advanced technologies; some have sought gas, which requires different
skills and market orientation than oil, while others stay focused on liquids. These case
studies explore whether and how these and other factors actually explain the wide
variation in the performance of NOCs.
About the Author
Varun Rai is a research fellow in the Program on Energy and Sustainable Development
at Stanford University. His research focuses on technologies and policies for carbon
capture and storage (CCS), technological innovation and diffusion, the technology and
energy policy of India, and climate change policy.
Varun received his Ph.D. and MS in Mechanical Engineering from Stanford with
specialization in energy systems and technologies. He holds a Bachelor's degree in
Mechanical Engineering from the Indian Institute of Technology (IIT) Kharagpur. Varun
was a Global Economic Fellow in 2009 and a Salzburg Global Seminar Fellow in 2008.
22 April 2010 3 PESD WP #911. INTRODUCTION AND OVERVIEW The state‐owned company Oil and Natural Gas Corporation Limited (ONGC) is India’s largest company devoted to exploration and production (E&P). Founded in 1956, ONGC has seen a remarkable growth in the last five decades. In 2007‐08, ONGC group’s total production of oil and oil‐equivalent gas (o+oeg) was about 60 million metric tonnes per annum (MMTPA) or 1.2 million barrels per day, thus accounting for nearly 80% of India’s oil and gas (O&G) production. In 2007 Energy Intelligence Top 100 ranked ONGC at 31 among global oil and gas companies. ONGC’s evolution is a remarkable story of how state‐owned firms respond and adapt to shifts in owner (government) priorities, which in turn are strongly influenced by macroeconomic and political conditions. Historically, ONGC has been the Government of India’s (GoI’s) trusted custodian of India’s oil and gas reserves. As such, ONGC enjoyed a near monopoly in this sector for nearly four decades (1955‐1995), during which good luck and easy oil elevated ONGC to stardom. During those years ONGC also functioned as the de facto regulator of the oil and gas sector. The oil ministry (the government ministry in charge of the sector) depended heavily on ONGC for coordinating activities in the sector. But changing economic priorities and soaring domestic demand for oil and gas in India have significantly changed the dynamic of ONGC’s relationship with the government in many ways. Through a series of reforms since the mid 1990s, the Government of India has increasingly tried to maintain an arm’s length relationship with ONGC. ONGC is exposed to more competition in the sector than ever before and it has also lost its regulator status, which is now a separate arm within the government. This paper attempts to unpack the dynamic of the government‐ONGC relationship. Focusing specifically on how government ownership and control has influenced ONGC’s performance and strategy, this paper makes four main arguments. 22 April 2010 4 PESD WP #91
First, ONGC exists, just as with NOCs in many other countries, because of a legacy of
suspicion about outsiders. It performed well when it was tasked with things that were
not that difficult and when it had help for the more difficult ventures, such as frontier
E&P and development.

Two factors were critical in the Indian government’s decision to put a state‐owned
company (ONGC) in charge of India’s O&G exploration and production (E&P) efforts: the
government’s socialist bent; and fears of opportunism of the international oil companies
(IOCs). In the years following India’s independence in 1947 a large fraction of India’s
production was under government ownership, reflecting the strong bias of the GoI for a
Socialist‐like development of India.    Additionally, by the mid 1960s GoI’s fears of
possible opportunistic behavior of the IOCs seemed to be justified, as there was
increasing evidence of unfair products pricing internationally by the IOCs. The past
baggage of imperial control and fears of opportunistic behavior of the IOCs convinced
GoI to have government ownership of oil and gas E&P.

The GoI set up ONGC in 1956 to lead India’s indigenous E&P efforts, but the
breakthrough for India’s indigenous oil plans and ONGC came from Russia. Russia
transferred technology and equipment to kick start ONGC’s exploration work. In the
1970s ONGC and its Russian partners began exploration in offshore areas and soon
found the giant Mumbai High field in February 1974. The subsequent years, from 1975
and 1990, were ONGC’s golden era. Production went up from 4.5 MMT (O+OEG) in
1974‐75 to nearly 48 MMT (O+OEG) in 1989‐90. Starting barely from 450 employees at
formation in 1956, ONGC swelled to over 47,000 employees by 1990.

Second, ONGC has run into trouble as it matured, and the roots of its troubles are
mainly in its interactions with the GoI and secondarily in its management.

The years of expanding production masked severe and growing performance problems
emerged at ONGC. Among other problems, financial profligacy, organizational and
planning difficulties, declining reserves, and the deteriorating health of producing fields

22 April 2010                                 5                              PESD WP #91
brought much flak and negative attention to ONGC in the 1990s. These troubles became
more apparent with India’s foreign exchange crisis in 1991. The crisis forced a fiscal
probity on the Indian government that also required a fresh look at the ownership and
management of state enterprises.

ONGC’s performance and strategy largely owe to its interactions with the government.
The rule‐based monitoring and regulated rate‐of‐return mechanisms (until the late
1990s) that the GoI has employed for ONGC have led to serious financial and corporate
culture atrophy at ONGC. The most harmful impact of using indirect and pre‐established
(ex ante) rules to monitor ONGC’s performance is the lack of a performance‐based
incentive structure, which is at the heart of ONGC’s inefficiencies.

Being a government company ONGC has been exposed to political demands and
exigencies to a significant degree. Those demands focus on managing ONGC’s free cash
flow in an ad hoc and politicized way, but from time to time the government (or
powerful individuals in government) attempt to reassert direct government control on
ONGC. The government has charged multiple government oversight agencies with
auditing ONGC’s accounts and verifying the transparency of business dealings of ONGC.
The process for selecting ONGC’s chairman‐cum managing director (CEO‐equivalent)
and the Board of Directors is also prone to political interference. Those demands were
more direct and stifling pre‐reforms (before the mid 1990s).

As the GoI’s preferences and methods of controls have shifted over time, ONGC has
adapted its strategy to pacify those demands. For the most part, ONGC’s response has
been reactionary. Working within the incentive structure and constraints that
government ownership and control entails, ONGC has tried to adopt strategies that not
only serve the GoI’s demands but also preserves its (ONGC’s) corporate freedom.

Third, a slew of reforms instituted since the mid 1990s have fundamentally changed the
landscape of the E&P sector in India and the dynamic of government‐ONGC relationship.
Targeted at improving corporate governance, enhancing competition in E&P, and

22 April 2010                                 6                          PESD WP #91
eliminating price controls, those reforms have had a mixed impact on ONGC’s
performance and strategy. They also highlight the difficulties the GoI has had in
encouraging higher efficiencies in ONGC and the oil and gas sector.

In efforts to improve corporate governance of ONGC, in 1999 the GoI accorded ONGC a
Navratna status, which gave ONGC a wide range of financial and organizational
independence from the government. Subsequently, ONGC’s stock‐listing in 2004 has
also contributed to reducing government influence over and interference with ONGC’s
corporate affairs.

One of the most important results of the GoI’s reform efforts has been the introduction
of competition in E&P through the New Exploration and Licensing Policy (NELP). The
NELP has certainly weakened ONGC’s monopoly status in the upstream sector. By
bringing more competition to the sector, the NELP has also enabled the greater use of
benchmarks and industry standards for monitoring ONGC’s performance.

But the impact of competition on ONGC’s performance is significantly diluted by the
large free cash flow at ONGC’s disposal. High oil prices in the international markets since
2002 and the successful adoption of a market‐oriented pricing scheme for crude oil in
India have sent ONGC’s revenues and profits soaring. Distribution of large dividends
and concessions by ONGC seems to be largely influenced by the GoI’s motive to take
away any extra cash that cannot be productively employed by ONGC. Yet, ONGC is debt‐
free and has significant cash reserves, which gives it enough leeway to employ its own
resources in a range of projects without having the need to go through close scrutiny of
third parties and the financial markets.

Fourth, given the deep interconnects of the oil and gas sector with India’s political
economy, fixing the oil and gas sector essentially entails fixing the larger political
economy within which the sector is embedded. Uncertain government policies and
continued government intervention in politically sensitive matters (such as petroleum
pricing) have stymied critical components of the reform process. The situation is

22 April 2010                                 7                              PESD WP #91
exacerbated by insider dealings and favoritism by the government, including with
private companies as the beneficiaries. That the GoI’s reform efforts have been limited
in impact is a manifestation of the fact that those reforms have often tried to address
issues specific to the oil and gas sector without also reforming the larger system. By
design, such partial reform will fail to enhance the efficiency and performance of the
sector.

The rest of the paper is organized as follows. Section 2 provides an overview of the
origins and operations of ONGC. Section 3 discusses how ONGC’s relationship and
interactions with the government influence ONGC’s performance and strategy. Finally,
Section 4 presents the conclusions of the study and offers some insights for improving
the efficiency and performance of ONGC and also of India’s oil and gas sector.

2. THE ORIGINS AND OPERATIONS OF ONGC

2.1.      Formation and Initial Years of ONGC (1947-1970)

Two factors were critical in the GoI’s decision to assume full control of the oil industry
by the end of the 1960s. First, at the time of India’s independence in 1947 there was a
clear bias in favor of government ownership of industries of strategic importance. Since
India’s independence, the energy sector in India—notably oil and gas, coal, and
electricity industries—has largely been organized through SOEs, which operate (even
today) in tightly regulated price regimes. India’s first Prime Minister, Jawaharlal Nehru,
himself was convinced of the increasingly greater role the State would play in India’s
development. Second, there was suspicion about outsiders. The dominant thinking,
based on India’s past experience, was that foreign investments end up meddling in
national politics, and, in general, are detrimental to the national development. At the
time of independence, the small amount of petroleum products used in the country was
imported from the Abadan island refinery in Iran, which was owned by the British Anglo‐
Iranian Oil Company (AIOC), and was marketed in India by the American companies
Standard Vacuum and Caltex, and the British company Burmah Shell. These three oil‐

22 April 2010                                8                              PESD WP #91
marketing companies then had monopoly distribution rights. By the mid 1960s the GoI’s
fears of possible opportunistic behavior of the IOCs seemed to be justified, as there was
increasing evidence of unfair products pricing internationally by the IOCs. India’s hostile
relations with its largest neighbors, China and Pakistan, made it very uncomfortable in
leaving so much market power with the IOCs, who were not averse to using that power
to boost profits.

Importance of oil in India was recognized early on. A pre‐independence sub‐committee
on power and fuel emphasized the importance of liquid fuel for India’s defense and
development. When the Industrial Policy Resolution of 1948 was revised in 1956 to
grant equal status to the private sector vis‐à‐vis the public sector, mineral oil was placed
in the Schedule A, a list of industries to be exclusively developed under the State. This
was a clear indication of that the government considered oil a matter of strategic
national importance.

2.1.1. Disappointing Results of India’s First Engagement with the IOCs

Unlike many other countries who built national oil companies by nationalizing existing
operations, in India the logic of state ownership applied to building new firms, as there
wasn’t much industry in place already. But developing oil single‐handedly was fraught
with huge financial risks. There was very little, if any, experience within the GoI about
the politics and economics of the oil industry. Despite reservations about foreign
participation in oil exploration and production, the high perceived risks of the oil
business pushed the government to engage the IOCs. In the early 1950s the GoI started
negotiations with Standard Vacuum (Stanvac) for oil exploration in the Bengal Basin.
Preliminary survey of this area indicated high chances of large quantities of oil, both on
the Indian and the East Pakistani side of the border. The possibility of Pakistan taking
the lead on oil exploration in the area hastened the GoI to start oil exploration in the
Bengal Basin. The agreement with Stanvac was finalized in December 1953 granting
Stanvac exploration rights to 10,000 square miles in the Bengal Basin. The GoI made
generous concessions to clinch the exploration agreement. High depreciation rates of

22 April 2010                                  9                              PESD WP #91
80% and above were permitted for equipments within the first year. Depletion
allowances and write‐off provisions against the company’s oil‐marketing business were,
as found in later investigations, unjustifiably generous compared with similar
agreements elsewhere in the world.1

The first round of interactions of independent India with the IOCs was disappointing at
best. While Indian geologists had assessed the need for two‐dozen wells to be drilled by
Stanvac in the Bengal Basin, Stanvac drilled only seven wells there between 1953 and
1957. The GoI ended up sharing over 60% of the losses from the operations instead of
the 25% that was planned at initiation. There was virtually no cost to Stanvac, as it
wrote‐off the losses against its revenue from the marketing business. From Stanvac’s
perspective there was not much incentive to take unnecessary risks in the Bengal Basin
given the cheap oil in West Asia. But this was not in line with the GoI’s plans, which
wanted to quickly develop India’s domestic resources. The experience with Stanvac
underscored that GoI had little ability, on its own, to steer development of the oil
industry unless it was more firmly in control.

Mistrust of the IOCs was blowing up also due to increasing evidence of unfair
petroleum‐products pricing. Investigations by the GoI into the products pricing by the
IOCs found that to earn higher profits these prices were padded up with unreasonable
freight and insurance charges linked to the Mexican Gulf prices even though the crude
was imported from the Persian Gulf. Neither did the IOCs take into account the
discounts they obtained at the source of supply for the crude oil they purchased.
“Tricks” like this allowed the IOCs to sell the imported products at a hefty profit—by
using questionable accounting practices the IOCs had managed to earn profits in the
high 20s% against the initial 7.5% that they had sought.2 Moreover, when faced with
these allegations the IOCs issued a veiled threat to cut off supply of products, that too at
a time when India was at the brink of war with China around 1960. This progression of

1
    K.D. Malaviya and the Evolution of India’s Oil Policy, Kaul, H.N., Allied Publishers, 1991.
2
    K.D. Malaviya and the Evolution of India’s Oil Policy, Kaul, H.N., Allied Publishers, 1991.

22 April 2010                                           10                                   PESD WP #91
events brought GoI’s worst fears of IOC opportunism to life, and more than ever,
solidified its resolution to bring all aspects of the oil industry under firm state‐control.
2.1.2. Push for Government Ownership and Russian Help
Amid all this, K. D. Malaviya, first the deputy minister and then the minister of the
Natural Resources and Scientific Research (NR&SR) ministry, was pushing hard for an
indigenous oil program. Malaviya strongly supported a state‐run oil industry in India.
The breakthrough for Malaviya and India’s indigenous oil plans came from Russia. The
Russians were very keen not only to help India develop its oil industry but also in
developing overall relationships between the two countries. This was hardly surprising
given the aura of the Cold War and the Sino‐Soviet tensions of that time. In 1956, India
bought several rigs from Rumania and Russia, a move that further strengthened Indo‐
Russian ties in oil, and also in the heavy engineering industry in general. A unique
feature of these purchases was that India was allowed to pay Russia in Indian rupees,
which Russia could use to buy Indian products. Thus, in effect a modern barter system
came to be employed. This came as a huge relief for India that was already reeling under
the pressure to meet its prior foreign exchange commitments. Interestingly, the Russian
assistance also brought in more willingness of the West to assist India in the oil industry,
but that was limited, in some ways, by how much foreign exchange India could provide.
In any case, arrival of the Russian help was a boon for ONGC: “[I]t broke the monopoly
of the big oil companies [for supply of equipment to India]…[and] India got the
equipment along with the know‐how.”3
2.1.3. ONGC as a Government Department: Focus on Rules and Regulations
With the support of two senior geologists at the geological survey of India (GSI),
Malaviya succeeded in establishing the Oil and Natural Gas (ONG) division as a
department in the Ministry of NR&SR in October 1955. Purpose of this department was
the exploration and production of oil and the learning and acquisition of the techniques
3
K.D. Malaviya and the Evolution of India’s Oil Policy, Kaul, H.N., Allied Publishers, 1991.
22 April 2010 11 PESD WP #91of the oil industry.4 On the recommendations of a high‐level Russian team and the revised Industrial Policy Resolution of 1956 the ONG division was raised to the status of a commission in August 1956, and became the Oil and Natural Gas Commission (ONGC). The commission, though it still had limited financial powers, had a much wider scope of operations including surveying, exploration, and advising to the GoI. This was the beginning of the present day Oil and Natural Gas Corporation (ONGC). Being a government department also meant that ONGC’s activities were subject to burdensome red tape. The government paid all of ONGC’s Rs. 343 crores5 equity capital. Besides, financial requirements of ONGC were met through annual appropriations from the revenues deposited in the treasury.6 Accordingly, government rules, regulations, and procedures were closely followed to monitor financial prudence of ONGC’s operations. ONGC was directly responsible to the parliament for day‐to‐day operations and decision making authority lay with the bureaucrats who ran the department but had limited or no technical knowledge of oil business. This restricted the flexibility that ONGC needed to develop its operations. But perhaps the most lasting impression on ONGC of being a government department was on its organizational culture: “Initially, when the ONGC was functioning as a government department, it failed to inculcate work culture and create initiatives among employees, which [is] an essential input for improving efficiency of an organization.”7 Seeing that ONGC was finding it difficult to behave strategically and flexibly, the government reformed the enterprise as a public corporation by the ONGC Act 1959. But in reality ONGC had very limited financial and operational autonomy even as a public corporation. Government advisors and appointees to ONGC often were in clash with 4 K.D. Malaviya and the Evolution of India’s Oil Policy, Kaul, H.N., Allied Publishers, 1991. 5 1 Crore = 10 million. 6 Public Sector Reforms in India, Singh, A.B. and Singh, A., A.P.H. Publishing Corporation, New Delhi, 2004. 7 Public Sector Reforms in India, Singh, A.B. and Singh, A., A.P.H. Publishing Corporation, New Delhi, 2004. 22 April 2010 12 PESD WP #91
ONGC’s governing board. Bureaucrats in the ministry, working with the politicians,
ensured that ONGC remained entangled in red tape.

2.1.4. E&P Activities

ONGC made its first sizeable discovery of oil in 1958 in the (onshore) Cambay basin in
the western state of Gujrat. Through the 1960s ONGC explored mostly in onland basins
and made a string of discoveries in the Cambay basin (Cambay, Ankleshwar, Kalol,
Sanand, North Kadi etc.) and in the Assam‐Arakan Fold Belt in the country’s eastern
region (Galeki, Lakwa, Rudrasagar etc.).8 By 1970 ONGC’s crude oil production had
reached 3.5 MMTPA.

2.2.    Discovery of Mumbai High: ONGC Comes of Age (1970-1990)

In the 1970s ONGC began exploration also in offshore areas. Working with Russian
explorers, ONGC discovered the giant Mumbai High field in February 1974, and
production from Mumbai High started in 1976.9 The rapid development of Mumbai High
was remarkable even by international standards of those days. Besides the Russian help
in exploration and later in development, two factors contributed to the Mumbai High
success. First, the French IOC CFP‐Total was also deeply associated in the initial
development of Mumbai High. That association imparted much needed technical
expertise and training to ONGC. Second, the GoI and the Prime Minister at that time
(Indira Gandhi) fully supported a fast and efficient development of Mumbai High under
ONGC. That was largely motivated by the need to reduce pressure on foreign exchange
by cutting the oil import bill. The GoI brought in as ONGC’s chairman Mr. N.B. Prasad,
who was a true technocrat. Previously Prasad had been at India’s Atomic Energy
Commission, where he was associated with the country’s nuclear program. With the
GoI’s support, during Prasad’s tenure best practices in E&P were promoted at ONGC.

8
  (i) ONGC History (http://www.ongcindia.com/history.asp) (ii) Sharma, N.C., “History of Seismic
Prospecting In ONGC - A Chronological Sketch of Events”, Geohorizons, January 2002/1.
9
  These fields were originally named Bombay High. Later when the city of Bombay was renamed to
Mumbai that change was also reflected in the name of the fields. For consistency, throughout this study we
use Mumbai High.

22 April 2010                                         13                                  PESD WP #91
Further, association with the Russians and CFP‐Total charged ONGCians with a
meticulous technical culture. Under Prasad’s leadership ONGC became a focused, goal‐
oriented company.

Subsequently, the years between 1975 and 1990 were ONGC’s golden years. Total oil
and oil‐equivalent gas production went up from 4.5 MMTPA in 1974‐75 to nearly 48
MMTPA in 1989‐90. Thanks to ONGC’s production, India’s crude‐oil import dependency
(ratio of imports to consumption) dropped from 65% in 1974‐75 to 38% in 1989‐90,
even as consumption increased nearly three‐fold over the same period to 55 MMTPA.
ONGC also grew dramatically in size. Starting from just 450 employees at formation in
1956, ONGC swelled to over 47,000 employees by 1990.

ONGC’s rapid success during these years was timely for India, as it helped reduce the
import bill for oil. Since independence India had embarked on an agenda of self‐reliance
in economic affairs. This agenda intensified post‐1965. Among other policies, the
government imposed significant trade barriers, supported a heavily subsidized capital‐
intensive industry in the public sector, and ran a tight licensing regime for businesses.
When the world was hit by spiraling high oil prices starting in 1973 following OPEC’s oil
embargo, India’s economy was nearly in shambles. Per‐capita GDP grew at an average
of less than 1% between 1965 and 1980 and foreign debt and interest payments were
dangerously high.10 These repressive and insular macroeconomic policies made India’s
balance of payment situation precarious during this period: “India’s debt servicing
obligations have been showing a progressive increase during recent years and have
absorbed about 20‐25 per cent of the country’s annual export earnings thereby
impinging on the country’s ability to deploy the external resources…for financing vital
import needs”.11 Correspondingly, foreign exchange was of paramount significance to

10
  India’s Political Economy: 1947-2004, Frankel, F.R., 2nd Ed., Oxford University Press, 2005.
11
  “Foreign Trade and The Balance of Payments”, Indian Economic Survey, 1975-76. Accessed at:
http://indiabudget.nic.in/es1975-
76/7%20Foreign%20Trade%20and%20The%20Balance%20of%20Payments.pdf

22 April 2010                                      14                                  PESD WP #91
the government. In a much politicized process, every year the Finance Ministry allocated
available foreign exchange on a priority basis to select sectors.

Efforts were made on all fronts to manage the tough foreign‐exchange situation.
Reducing imports of crude oil and petroleum products were top on the list, as those
imports alone formed 26% of the import bill in 1975‐76.12 Rapid development of
Mumbai High and other fields and a greater emphasis on exploration to increase
domestic reserves appeared to the GoI as an obvious step in reigning in the tough
foreign exchange situation.

As the balance of payment and foreign‐exchange situation of India remained quite poor
during 1975‐1990, the overarching policy goal remained focused on increasing domestic
exploration and production of oil. To support ONGC in rapidly developing Mumbai High
the capital outlay in the Fifth Five‐Year Plan (1975‐1980) was increased to Rs. 1056
crores as compared to Rs. 420 crores in the Draft Fifth Plan. Subsequent Five‐year plans
also allocated significant capital to finance ONGC’s plans (Table 1).

Table 1: Capital outlay allocated for ONGC in five‐year plans between 1975 and 1990.

Plan Period               5th Plan (1975‐1980) 6th Plan (1980‐1985) 7th Plan (1985‐1990)
Capital Outlay
                                    1056                     2853.6                    8752.7
(in Rs. Crores)

Source: Planning Commission, Government of India. 1 Crore = 10 million.

Loans from international crediting agencies, particularly the World Bank, were
instrumental in financing ONGC’s foreign exchange needs, but also in broadly supporting
development of oil and gas infrastructure in India. Table 2 shows the external assistance
that ONGC received for development of the Mumbai High fields. A complete list of
external assistance to India’s oil and gas sector between 1975 and 1991 is presented in
Appendix A.5.

12
  “Foreign Trade and The Balance of Payments”, Indian Economic Survey, 1975-76. Accessed at:
http://indiabudget.nic.in/es1975-
76/7%20Foreign%20Trade%20and%20The%20Balance%20of%20Payments.pdf

22 April 2010                                        15                                PESD WP #91
Table 2: External assistance received by ONGC for development of the Mumbai High fields
Project Donor Year of Approval Amount
Bombay High I World Bank 1977 US$150 million
Bombay High II World Bank 1980 US$400 million
Bombay Offshore I Japan (OECF) 1979 ¥6.2 billion
Bombay Offshore II Japan (OECF) 1979 ¥8.6 billion
Source: “Report and Recommendation for the Gandhar Field Development Project”, Asian Development
Bank, 1991.
By the late 1980s ONGC had become the shining star of the public sector. Starting from
just a few hundred barrels of oil per day (bopd) production in 1976‐77, at its peak
(between 1984‐85 and 1990‐91) production from Mumbai High reached over 400,000
bopd. Had it not been for ONGC’s increasing crude‐oil production, the foreign‐exchange
situation would have been worse given that oil demand in India grew at nearly 7%
annually between 1975 and 1990. (Absent ONGC, India’s foreign reserves crisis of 1991
might have happened a decade earlier. It is interesting to speculate whether that would
have ushered in the country’s economic reforms earlier, or if the country was not ready
for such innovation until other factors were in place in the early 1990s.) Thanks to
Mumbai High, ONGC became the role‐model of indigenously nurtured, self reliant
government company that was successfully delivering energy security to the nation.
And because of the difficulties in opening the countries oil fields to outside bidders,
ONGC faced no competition and thus there was no sense of whether the firm actually
performed well.
2.3. From Spoiled Kid to Shunned Step Child: Crisis and Reforms
(1991-1998)
2.3.1. ONGC’s Problems at Mumbai High
Amidst adulation from all sides and the pressure to produce as rapidly as possible,
ONGC had pushed its luck too far. In 1990 ONGC started having problems with the
Mumbai High field. Flogging (overproduction) of several production wells caused erratic
22 April 2010 16 PESD WP #91behavior of the hydrocarbon reservoir. In consultation with ONGC and an international
consultant, a government committee recommended to immediately stop production
from the flogged wells (90 in total) in order to build reservoir pressure. The problem was
so severe that the government accepted the recommendations. The deputy oil minister
Satish Kumar Sharma stressed that the action was necessary “so that the reservoir is not
permanently damaged.”13 The shut downs resulted in 30% reduction in ONGC’s crude oil
production, which came down from 21.7 MMT in 1989‐90 to 15.38 MMT in 1993‐94
(Table 3).
Table 3: Declining crude oil production in early 1990s. Numbers in million metric tonnes.
1989‐90 1990‐91 1991‐92 1992‐93 1993‐94
21.71 20.38 18.96 15.75 15.38
Source: http://www.indiastat.com
2.3.2. Neelam Fields
ONGC started development of the Neelam fields off India’s west coast in 1989. By the
time the development project was completed in 1994 reservoir issues similar to
Mumbai High had erupted (but not due to flogging). Grossly inaccurate technical
planning of the Neelam fields led to a production peak in 1994‐95 instead of ONGC’s
predictions of a several years long production plateau at 4.5 MMTPA (Table 4). An audit
report found that despite the availability of 3‐D data and data processing technology,
ONGC had used old 2‐D seismic data (taken between 1977 and 1984) to prepare the
technological scheme for the field development program. Shortly after, 3‐D data
analysis reports completed in March 1991 found that the reservoir was steeper than
originally thought, which suggested lesser reserves than predicted by the 2‐D reserves.14
13
Speech by Captain Satish Kumar Sharma, Parliament of India, 1993. Accessed at:
http://parliamentofindia.nic.in/ls/lsdeb/ls10/ses6/0111039302.htm
14
“Avoidable Expenditure on Creation of Excess Capacity”, Report by Comptroller and Auditor General of
India, 2001. Accessed at: http://www.cag.gov.in/reports/commercial/2001_book4/chapter6.htm
22 April 2010 17 PESD WP #91Table 4: Projected and actual oil production from ONGC’s Neelam fields
Oil Rate
1992‐93 1993‐94 1994‐95 1995‐96 1996‐97 1997‐98
(MMTPA)
Projected 0.5044 0.379 4.485 4.5 4.5 4.5
Actual 0.54 0.6 3.81 3.54 2.29 1.92
Source: “Avoidable Expenditure on Creation of Excess Capacity”, Report by Comptroller and Auditor
General of India, 2001. Accessed at:
http://www.cag.gov.in/reports/commercial/2001_book4/chapter6.htm
2.3.3. Financial Crisis of 1991 and Foreign Loans: Origins of Oil Sector Reforms in
India
The problems at Mumbai High coincided with India’s foreign‐exchange crisis of 1991. By
late 1980s India’s delicate balance‐of‐payment situation had snowballed to disastrous
proportions as India came on the heels of defaulting on international debt repayments.
Special assistance loans of $150 million each from World Bank and ADB (see Appendix
A.5) helped India avert the crisis.
The crisis opened the floodgate of reforms in India. Some of these reformist ideas were
already in place but they were finally successful because reform‐oriented bankers held
the country hostage. The oil and gas sector, which at that point was dominated by state‐
owned companies, was one of the top items that the World Band and the ADB
emphasized for introducing reforms and increasing private participation. The World
Bank and the ADB required India to improve economic efficiency through “support for
structural reforms, promotion of competition, and private sector participation”15 as a
precondition for providing the assistance loans and a separate $350 million loan from
World Bank for ONGC’s gas flaring reduction projects. With no other choice left, the
government acquiesced to these demands.16 It was the outside banks that devised the
main strategic reforms. With inputs and advice from the banks, the GoI took the lead on
implementing the proposed reform measures. It is noteworthy that the GoI has
15
Program Performance Audit on the Hydrocarbon Sector Program Loan, Asian Development Bank,
January 2001.
16
Reports of the Comptroller and Auditor General of India, 1996. Accessed at:
http://www.cag.gov.in/reports/commercial/1996_book5/chapter1.htm
22 April 2010 18 PESD WP #91continued its reform efforts in the oil and gas sector even after the engagement of the banks on this issue has waned. That is a manifestation of a pro‐reform mindset of the GoI, partly motivated by the tremendous economic benefits of the broader economic reforms in India since 1991. A detailed description of the progress on these reforms is presented in Sections 3.1‐3.4. The Hydrocarbon Sector Plan (HSP) loan was approved by ADB in December 1991 with the main objective “to promote accelerated exploration and development of domestic hydrocarbon resources through increased participation of the private sector and enhanced operational efficiency of public sector enterprises.”17 The program loan of $250 million was planned to be disbursed in two tranches of $125 million each; the first tranche was disbursed by February 1992. The second tranche, planned for closing on 30 June 1995, was cancelled when it became clear that the GoI could not meet one of the key covenants of the loan, namely the divestment of 20% of the GoI’s equity in ONGC. 2.3.4. Oil Sector Policy Changes: New Rules of the Game Among other things, pushing for the introduction of the New Exploration and Licensing Policy (NELP) was perhaps the one of the most important contributions of the ADB HSP. The NELP envisioned expanding exploration in geologically challenging areas requiring huge risk capital and cutting‐edge technologies by increasing competition in the E&P sector and attracting private capital. In the pre‐NELP era, India had provisions that allowed private companies to search for oil. But those efforts to attract private capital to the sector were not successful, as the bidding provisions were opaque and covered only small areas. The NELP envisioned changing all that. Under the NELP, which India instituted in 1998, all new exploration acreage is offered only through an open‐for‐all competitive bidding process. Importantly, the state‐owned firms (ONGC and OIL) are also required to compete for these new exploration areas. The NELP allows 100% foreign direct investment (FDI) and offers improved contractual terms to make business 17 Program Performance Audit on the Hydrocarbon Sector Program Loan, Asian Development Bank, January 2001. 22 April 2010 19 PESD WP #91
in the oil sector attractive in India. Further, under the NELP the Directorate General of
Hydrocarbons (DGH; the upstream technical regulator) replaced ONGC as the overseer
of the exploration blocks, bids, and the associated exploration work.

Before the first NELP round in 1999, only 15% of the Indian sedimentary basins were
moderately or well explored and 50% were unexplored. NELP has contracted 162 blocks
via six bidding rounds (NELP‐I to VI).18 As a result, in 2006‐07 20% of the sedimentary
basinal area is moderately or well explored, while exploration has been initiated in 44%
of the remainder areas. Participating companies have committed to invest over $8
billion in these blocks.19 During NELP‐VII, bidding for which closed in June 2008, the
ministry of petroleum and natural gas (MoPNG) offered another 57 oil and gas blocks.
Of those 45 blocks received bids, and finally contracts were signed for 41 blocks in
December 2008. Overall, the actual investments from NELP‐VII auctions are expected to
be about $1.5 billion, in contrast with the initial hopes for $3.5 billion.20

2.4.    Adapting to the New Rules (1999-2008)

The wave of reforms and policy changes started in the aftermath of the 1991 economic
crisis have significantly changed the conditions under which ONGC was used to
operating. amid rising import bill and import dependency of crude oil, the GoI has been
increasingly vocal in asking ONGC to improve performance and production. Further,
with the NELP ONGC has lost its status as the GoI’s de facto regulator of the oil and gas
sector and has also lost the right to preferential access to acreages.

2.4.1. Pressure from Rising Imports

Rapidly growing imports have put tremendous pressure on the GoI to increase domestic
production. In 2007 India consumed 2.8 million bopd,21 making it the fifth largest
consumer of oil in the world. It imported over 76.7% of its crude oil requirements in

18
   Annual Report 2006-07, Directorate General of Hydrocarbons (DGH), Government of India.
19
   “India to attract $4 bn in oil exploration”, www.rediff.com, 13 December 2007.
20
   “44 blocks awarded under NELP VII”, The Hindu, 21 November 2008.
21
   1 Million Metric Tonnes Per Annum (MMTPA) ~ 20,000 bopd.

22 April 2010                                      20                                PESD WP #91
2006‐07, compared with about 43.4% in 1995‐96 and 31.7% in 1985‐86. The rapid
increase in oil import dependency has occurred because of a dramatic growth in India’s
oil demand since 1995, while domestic production has remained flat around 0.66 million
bopd (Figure 1). As shown in Figure 2, over 70% of India’s crude oil imports come from
Middle East countries, which are geographically close and thus favored suppliers.

Figure 1: Crude oil import and production in India. Note: 1 MMTPA ~ 20,000 bopd.
Source: Petroleum Planning and Analysis Cell (PPAC), Ministry of Petroleum and Natural Gas, India, and
IndiaStats.com.

Figure 2: India’s crude oil imports in 2007 by source.
Source: EIA, March 2009. Accessed at: http://www.eia.doe.gov/emeu/cabs/India/Full.html

22 April 2010                                        21                                  PESD WP #91
Due to both increased demand and prices and a booming domestic refining industry,
India spent about $68 billion to import crude oil in 2007‐8 (Figure 3).22 Earnings from
exported petroleum products (Figure 4)—notably naphtha, petrol, and diesel—partly
reduced that burden: the net oil import bill was about $57 billion in 2007‐08.23 As in the
past, the substantial burden on India’s trade position and foreign exchange from crude
oil imports is a key reason why the GoI continues to emphasize greater domestic
exploration and production.

Figure 3: Indian import bill for crude oil.
Source: Petroleum Planning and Analysis Cell (PPAC) and Ministry of Petroleum and Natural Gas,
Government of India.

Figure 4: Import and export of petroleum products by India. Note that only data for petroleum products is
reported here; that does not include crude oil. Thus, as this figure shows, India is a net exporter of
petroleum products.
 Source: Petroleum Planning and Analysis Cell (PPAC), Government of India and IndiaStats.com.

22Petroleum Planning and Analysis Cell (PPAC), Ministry of Petroleum and Natural Gas, India.
23
  Close to the Persian Gulf sources of crude, India is well-positioned to become a refining hub; some of its
refinery infrastructure is already oriented entirely for re-export.

22 April 2010                                         22                                    PESD WP #91
2.4.2. Production Plateau and Exploration Troubles

But ONGC’s E&P record has disappointed the GoI on both fronts. ONGC’s yearly
domestic oil production has hovered around 25-30 MMTPA since 1990 (Figure 5) and its
annual gas production too has plateaued near 23 BCM since 1995 (Figure 6). That is,
ONGC’s combined oil and gas production has been stagnant around 50 MMTPA (oil and
oil-equivalent gas). If ONGC’s foreign productions are taken in account, between 2000-
01 and 2006-07 ONGC’s oil and oil-equivalent gas production increased from 49.08
MMTPA to 60.72 MMTPA.

Figure 5: Crude oil production by ONGC, 1960‐2007.
Source: http://www.indiastat.com and Ministry of Petroleum and Natural Gas, Government of India.

Figure 6: Natural gas production by ONGC, 1980‐2007.
Source: http://www.indiastat.com and Ministry of Petroleum and Natural Gas, Government of India.

22 April 2010                                      23                                 PESD WP #91
ONGC’s reserves have also remained flat. As shown in Figure 7, the combined oil and gas
reserves of ONGC stood at 938.8 MMT as of 31 March 2007, increasing somewhat from
857.7 MMT on 31 March 2001. At current levels of production ONGC’s reserve life is
about 15.5 years. In terms of combined oil and gas reserves in 2004 ONGC ranked 32
among global oil and gas companies. It ranked below most other major NOCs (among
others Pemex, Petrobras, and Petrochina), almost at par with StatoilHydro, and ahead of
Sonangol.24

Figure 7: Hydrocarbon reserves of ONGC (Proven reserves).
Source: ONGC Annual Reports.

While declining reserves and the deteriorating health of producing fields brought
negative attention to ONGC in the 1990s, over the last decade ONGC’s biggest
performance troubles have revolved around exploration. Much of that flak has been
spearheaded by the DGH, which has publicly criticized ONGC’s poor performance in the
recent past.25 Until 2000 nearly all of ONGC’s exploration work was either onland or in
shallow water. Since the initiation of the NELP rounds of competitive bidding for
exploration acreage in 1999, India opened up several prospective areas offshore,
especially in deepwater. ONGC and Reliance (separately) won the bids for most of those

24
   Victor, N. M., “On Measuring the Performane of National Oil Companies”, PESD Working Paper #64,
Stanford University, Septermber 2007.
25
   “ONGC pumping more air than oil: DGH”, Moneycontrol.com, 24 November 2004.

22 April 2010                                      24                                PESD WP #91
deepwater blocks. But ONGC’s lack of deepwater capabilities and poor risk management
have significantly impeded ONGC’s deepwater exploration program. A 2006 report of
the DGH showed that of the 47 blocks (including onland and offshore) awarded to ONGC
at that point the company's had not made any discoveries. All the 32 wells that ONGC
drilled in those blocks turned out to be dry.26 As a result, in a few deepwater exploration
blocks for which ONGC was the highest bidder, the DGH recommended to the MoPNG
to not award them to ONGC in view of ONGC’s poor track record in such projects.27

Short‐term focus of the top management and a weak R&D program are at the root of
ONGC’s recent problems in deepwater explorations. Although ONGC has over five
decades of experience in exploration, its expertise and capabilities in oil & gas
exploration are far behind the international level of exploration geosciences and
technologies that most international oil companies and some national oil companies like
Petrobras and StatoilHydro develop and employ.28 During the 1960s and 1970s ONGC
received significant E&P help on technology and equipment from the Russians and ran a
focused R&D program.29 Besides, the major oil & gas discoveries of ONGC (mostly in
1970s and 1980s) were in relatively simple geology, either onland or shallow offshore.
ONGC’s early success in E&P gave it a substantial oil and gas production base by early
1980s. As cash flow from those operations was adequate, ONGC did not have to conduct
much R&D on exploration sciences to stay in business. In the midst of its much
celebrated E&P success through 1980s, ONGC’s focus had already started shifting
towards developing the discovered fields, partly in response to government pressure
(see Sections 2.2 and 2.3). An intensive focus on developing discovered fields and urgent
need to maintain existing production brought ONGC’s exploration and associated R&D
“almost to a halt.”30 More recently, even though ONGC’s yearly expenditure on R&D has

26
   “ONGC pumping more air than oil: DGH”, Moneycontrol.com, 24 November 2004.
27
   “ONGC may be denied NELP blocks”, The Financial Express, 23 November 2006.
28
   PESD interviews
29
   (i) PESD interviews (ii) Sharma, N.C., “History of Seismic Prospecting In ONGC - A Chronological
Sketch of Events”, Geohorizons, January 2002/1.
30
   Modak, S., “Right on Top”, Business India, 30 September - 13 October, 2002. Accessed at:
http://www.ongcindia.com/archives1.asp?fold=archives\oct802&file1=Feature_article&file2=feature_articl
e1.txt

22 April 2010                                      25                                  PESD WP #91
hovered around 0.3% of revenues during 2001 and 2007 (Figure 8), its R&D program31 is
poorly managed and not well targeted to its business. Consequently, ONGC’s
exploration capabilities have significantly eroded since 1990.

Figure 8: R&D expenditure of ONGC.
Source: ONGC Annual Reports.

2.4.3. E&P Strategy

Pressure from the GoI to alleviate the worsening oil supply situation is also evident on
ONGC’s strategy, both domestically as well as internationally. At a strategy meet in 2001
ONGC devised a two‐prong strategy to enhance production and put its exploration
program back on track. Per the strategy, one track would accelerate efforts to find and
produce oil at home. The other would intensify the efforts of ONGC Videsh Limited
(OVL; ONGC’s oversees arm) to find equity oil abroad.

31
  ONGC conducts most of its R&D work through its nine research centers, all of which are independently
managed: Geodata Processing and Interpretation Centre (GEOPIC), Keshav Deva Malaviya Institute of
Petroleum Exploration (KDMIPE), Institute of Drilling Technology (IDT), Institute of Engineering and
Ocean Technology (IEOT), Institute of Management Development (IMD), Institute of Biotechnology &
Geotectonics Studies (INBIGS), Institute of Oil & Gas Production Technology (IOGPT), Institute of
Petroleum Safety, Health & Environment Management, and Institute of Reservoir Studies (IRS). As the
names suggest, each center is allocated the responsibility of a major portion of the E&P value chain. Of
these, GEOPIC and KDMIPE are involved more with research on the exploration side; the others are
focused mostly on oil & gas development and production.

22 April 2010                                        26                                  PESD WP #91
2.4.3.1. Domestic

Domestically, as new production has not come online in the last few years, ONGC’s
strategy has been to monetize marginal fields and to invest in the maintenance and
redevelopment of its declining fields, particularly Mumbai High. These investments have
been obviated by the need to save face domestically amidst rising concerns of dropping
production. Some of these efforts are paying off, at least in the short‐term. After a
lackluster period in the 1990s, reserves replacement (RR) record of ONGC has improved
since 2000 (see Figure 9 and Table 5),32 partly because of reinvigorated exploration
efforts at home and partly because of the successful acquisition of overseas assets
(discussed in detail later). Interestingly, though ONGC has declared a RR ratio of greater
than one in the past several years that has done little to enhance ONGC’s production of
oil or gas. That itself raises questions about the methods of reserve assessment as well
as managerial issues in translating discoveries to production.33

Figure 9: Ultimate reserves accretion by ONGC (3P reserves: Proved+Probable+Possible).
Source: ONGC Annual Reports.

32
   Note though that the data in Figure 8 and Table 5 are based on 3P reserves (proved+probable+possible)
and hence are prone to large uncertainty. See for example, Simmons, M.R., “Proving Proven Reserves are
Proven: An Art Form or a Science?”, February 2005. Accessed at: http://www.simmonsco-
intl.com/files/SPE%20GCS%20Reservoir%20Study%20Group.pdf
33
   PESD interviews.

22 April 2010                                       27                                   PESD WP #91
Table 5: ONGC’s reserves replacement ratio. Reserves‐replacement ratio is defined as the ultimate
reserves added divided by the production during a year
2003‐04 2004‐05 2005‐06 2006‐07 2007‐08
0.65 1 1.1 1.35 1.32
Source: ONGC presentation at the ABN Amro Asian Conference, November 2008.
Besides domestic redevelopment, new exploration has also received renewed interest
from ONGC. Armed with extensive experience in the domestic business environment
and geology, and a very strong cash flow situation (discussed in detail later), ONGC has
bid aggressively for exploration blocks in all the seven NELP rounds that have been held
so far. As a result, ONGC has won over half of all the NELP blocks offered so far.
2.4.3.2. Equity Oil and Gas Abroad: ONGC Videsh Limited (OVL)
In addition to efforts to accelerate domestic E&P, another idea has gathered significant
traction within ONGC: obtaining equity oil abroad. The government also believes that oil
production owned by Indian companies, whether at home or abroad, enhances energy
security by securing supply.34
Leading this quest for oversees assets is ONGC Videsh Limited (OVL), the overseas arm
of ONGC. OVL aims to “tie‐up” 60 MMPTA (1.2 mbd) oil and gas production overseas by
2025. As of 31st March 2007, OVL’s assets had grown to about $4.5 billionmostly in
loans from its parent company, state‐owned ONGCfrom virtually nothing in 2001. By
March 2008 OVL had 38 projects in 18 countries, giving it a proven reserve base of 194.6
MMT (95.7 MMT oil and 98.9 MMT oil‐equivalent gas) and an annual o+oeg production
of 8.8 MMT (Figure 1).35
34
(i) Integrated Energy Policy, Report of the Expert Committee, Planning Commission, Government of
India, April 2006 (ii) Press release on Petroleum minister Mr. Murli Deora’s speech on 14 January 2008.
35
Annual report 2007-08, ONGC Videsh Limited.
22 April 2010 28 PESD WP #91Figure 1: ONGC’s overseas oil and natural gas production. Source: ONGC Annual Reports 2.4.4. Finances Until April 2002 prices of crude oil and petroleum products in India were determined as a weighted average of international prices and the domestic cost of production. But, in line with the HSP’s objective of moving towards market‐determined prices, since April 2002 the GoI has linked the price of crude oil to international prices. That has been a big boost for ONGC’s finances. Like other oil companies with an established production base, high oil prices in the international markets since 2002 have sent ONGC’s revenues and profits soaring (Figures 11 and 12). 22 April 2010 29 PESD WP #91
Figure 11: Financial performance of ONGC during 1995‐2007.
Source: ONGC Annual Reports.

Figure 12: ONGC’s return on assets and sales.
Source: ONGC Annual Reports.

22 April 2010                                      30        PESD WP #91
2.4.5. Financial Efficiency and Project Management

Amid growing pressure to improve performance and production and a stronger‐than‐
ever financial position, ONGC’s financial efficiency continues to be questionable. Its
contracting system (for awarding contract work to outsiders) and project management
of exploration work for the NELP blocks are good examples of the more general problem
of financial inefficiency that runs across ONGC’s operations.

2.4.5.1. Weak Contracting System

ONGC’s poor contracting system—including contract tendering, bidding, award and
performance appraisal—have enabled contractors to escape with poor equipment and
supply deliveries, while leaving the consequent financial risks and losses with ONGC. For
example, in one case a contract was awarded to a financially sick party (with prior
knowledge of the contractors weak financial position), eventually leading to the failure
of ONGC to meet the minimum work program (MWP)‐‐ the exploration work committed
in the production sharing contracts—associated with the contract.36

Even though there is a standard procedure for awarding contracts (the L1 process37),
that process is thoroughly abused by ONGC personnel and contractors for rent‐
seeking.38 A particular strategy is particularly well suited to exploit the L1 process. In this
gaming strategy, first the contractor bids very low to ensure winning the tender. On
grant of the contract, the contractor works in cahoots with ONGC personnel to see that
critical steps of the contract for which ONGC is responsible are not completed on time.
Sometimes ONGC has to pay the contractor for “delays” that hinder work by the
contractor, but often many contracts are renegotiated successfully by contractors after
award because they were poorly framed in the first place!39

36
   ONGC Deepwater Exploration Audit, Report by Comptroller and Auditor General of India, 2008.
37
   In the L1 process bidders must satisfy certain minimum financial and technical criteria. Of the qualifying
bidders, the lowest quote (hence L1) bidders wins the tender.
38
   PESD interviews.
39
   PESD interviews.

22 April 2010                                          31                                    PESD WP #91
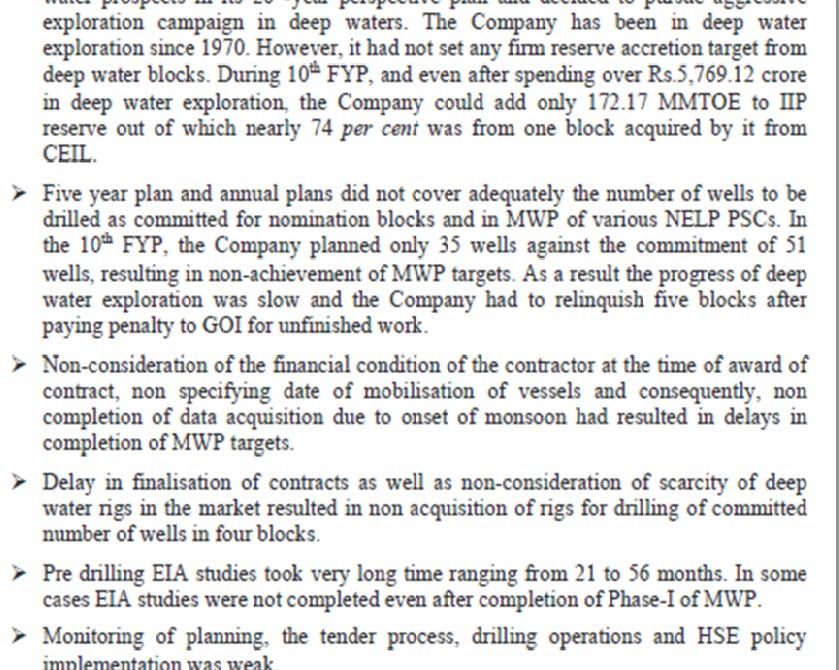
The weak contracting system of ONGC is one of the prime causes for significant project
delays and cost overruns—it takes away from ONGC the main levers of enforcing risk‐
abatement strategies that are industry standards.

2.4.5.2. Poor Planning and Coordination

One of ONGC’s biggest organizational issues relates to overlapping responsibilities
between different functional groups (technical, exploration, onland, and offshore). As a
result there is no single point of responsibility for core exploration and development
activities.

As part of its efforts to benchmark ONGC’s performance since mid 1990s, the MoPNG
has required ONGC to develop five year plans (FYP). The first such ONGC FYP was
prepared during India’s IXth FYP (1997‐2002). Among others, the two main items in the
FYPs are (i) number of wells to be drilled during the period and (ii) targets of reserve
accretion. For the period from 2002‐03 to 2006‐07 (the Xth plan period) ONGC
committed to drill 51 exploration wells, but planned for only 35. This not only highlights
internal coordination issues, but also suggests aggressive bidding by ONGC.40 ONGC’s
aggressive bidding has resulted in a series of shortfalls by ONGC on MWP in various
blocks. In the aftermath ONGC has had to surrender several NELP blocks besides paying
fines to both the DGH and the MoPNG.41

In general, activities needed for the completion of the MWP are not well planned and
clear targets are not set (Figure 13). Poor planning and action for chartering and
mobilizing of vessels for seismic surveys have led to delays in data acquisition and
interpretation in many cases. Under the PSCs for the NELP blocks the contractor needs

40
   This incongruity of the proposed vs. the feasible MWP in bidding for NELP blocks seems to have
escaped the DGH as well, as none of these issues were raised when the blocks were awarded to ONGC.
Although the situation seems to have corrected itself and the DGH is much smarter now, this episode
highlights the weak institutional capability of the DGH in the early years of the NELP (before 2005). To
some extent this is expected as with any new regulatory or monitoring agency. But this episode imparts the
lesson of accepting the existence of information asymmetries suffered by the regulator, especially in the
formative years. One way of avoiding similar events in future—and the DGH has already started doing
so—is to enshrine the accountability of the contractors in the PSCs in unambiguous terms.
41
   ONGC Deepwater Exploration Audit, Report by Comptroller and Auditor General of India, 2008.

22 April 2010                                        32                                   PESD WP #91
You can also read