OP7, a novel influenza A virus defective interfering particle: production, purification, and animal experiments demonstrating antiviral potential ...
←
→
Page content transcription
If your browser does not render page correctly, please read the page content below
Applied Microbiology and Biotechnology (2021) 105:129–146
https://doi.org/10.1007/s00253-020-11029-5

    BIOTECHNOLOGICAL PRODUCTS AND PROCESS ENGINEERING

OP7, a novel influenza A virus defective interfering particle:
production, purification, and animal experiments demonstrating
antiviral potential
Marc D. Hein 1 & Heike Kollmus 2 & Pavel Marichal-Gallardo 3 & Sebastian Püttker 1 & Dirk Benndorf 1,3 & Yvonne Genzel 3 &
Klaus Schughart 2,4,5 & Sascha Y. Kupke 3 & Udo Reichl 1,3

Received: 5 September 2020 / Revised: 14 November 2020 / Accepted: 22 November 2020 / Published online: 4 December 2020
# The Author(s) 2020

Abstract
The novel influenza A virus (IAV) defective interfering particle “OP7” inhibits IAV replication in a co-infection and was
previously suggested as a promising antiviral agent. Here, we report a batch-mode cell culture-based production process for
OP7. In the present study, a seed virus containing standard virus (STV) and OP7 was used. The yield of OP7 strongly depended
on the production multiplicity of infection. To inactivate infectious STV in the OP7 material, which may cause harm in a potential
application, UV irradiation was used. The efficacy of OP7 in this material was preserved, as shown by an in vitro interference
assay. Next, steric exclusion chromatography was used to purify and to concentrate (~ 13-fold) the UV-treated material. Finally,
administration of produced OP7 material in mice did not show any toxic effects. Furthermore, all mice infected with a lethal dose
of IAV survived the infection upon OP7 co-treatment. Thus, the feasibility of a production workflow for OP7 and its potential for
antiviral treatment was demonstrated.

Key points
• OP7 efficacy strongly depended on the multiplicity of infection used for production
• Purification by steric exclusion chromatography increased OP7 efficacy
• OP7-treated mice were protected against a lethal infection with IAV

Keywords Influenza A virus . Antiviral . Defective interfering particles . Cell culture-based production . Steric exclusion
chromatography . Animal experiments . OP7

                                                                             Introduction
* Sascha Y. Kupke
  kupke@mpi-magdeburg.mpg.de                                                 With annual epidemics and occasionally severe pan-
                                                                             demics, influenza A virus (IAV, list of abbreviations,
1
     Bioprocess Engineering, Otto von Guericke University Magdeburg,
                                                                             Table 1) is a major human pathogen. Every year, about
     Magdeburg, Germany                                                      300,000–650,000 deaths are reported worldwide (Iuliano
2
     Department of Infection Genetics, Helmholtz Centre for Infection
                                                                             et al. 2018). The current countermeasures include the use
     Research, Braunschweig, Germany                                         of vaccines and antivirals like oseltamivir and zanamivir
3
     Bioprocess Engineering, Max Planck Institute for Dynamics of
                                                                             (Colman 2009; Oxford 2007; Smith et al. 2006).
     Complex Technical Systems, Magdeburg, Germany                           However, the development and production of vaccines is
4
     University of Veterinary Medicine Hannover, Hannover, Germany
                                                                             a time-consuming process. Moreover, resistances arising
5
                                                                             against current antivirals have been reported and are a
     Department of Microbiology, Immunology and Biochemistry,
     University of Tennessee Health Science Center,
                                                                             general issue (Han et al. 2018; Lackenby et al. 2018),
     Memphis, Tennessee, USA                                                 demonstrating the need for novel treatment modalities.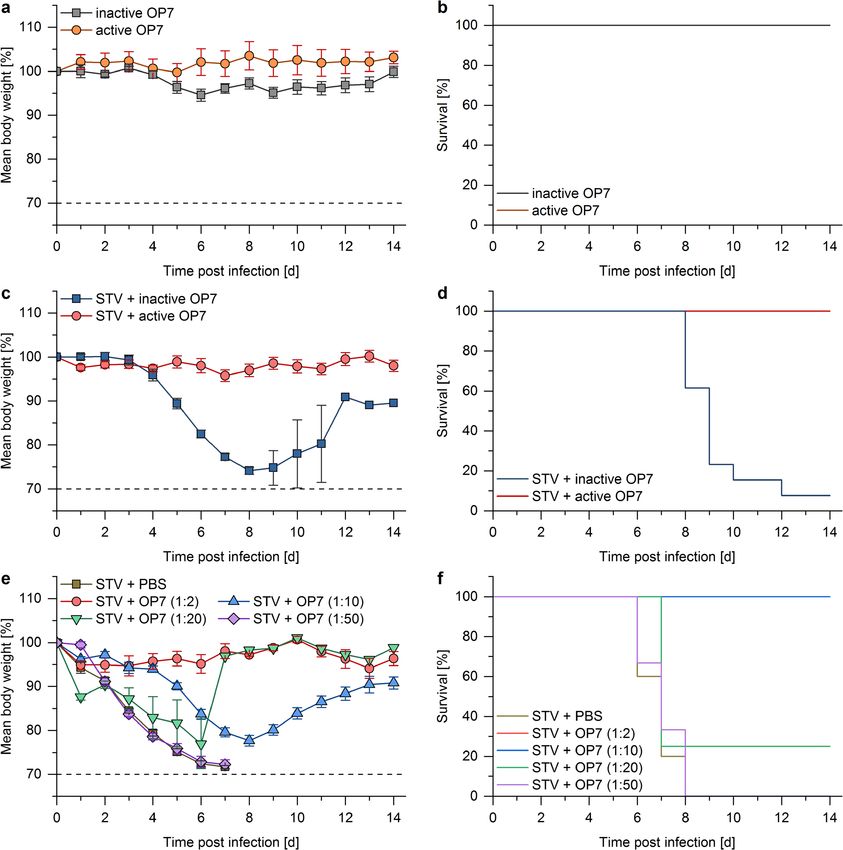
130                                                                                                 Appl Microbiol Biotechnol (2021) 105:129–146

Table 1 List of abbreviations
                                   Abbreviation                      Meaning

                                   DCS                               Differential centrifugal sedimentation
                                   DI                                Defective interfering
                                   DIP                               Defective interfering particle
                                   FFU/mL                            Focus forming units per mL
                                   FL                                Full length
                                   GMEM                              Glasgow minimal essential medium
                                   HA                                Hemagglutinin
                                   hpi                               Hours post infection
                                   IAV                               Influenza A virus
                                   M1 protein                        Matrix protein 1
                                   M1-OP7                            Mutated matrix protein 1
                                   MDCK                              Madin-Darby canine kidney
                                   MOI                               Multiplicity of infection
                                   MS                                Mass spectrometry
                                   NC                                Negative control
                                   OP7                               Overproportional segment 7
                                   PBS                               Phosphate-buffered saline
                                   PFU/mL                            Plaque forming units per mL
                                   PR8                               Influenza virus strain A/PR/8/34
                                   PR8-RKI                           PR8 provided by the Robert Koch Institute Germany
                                   PR8-NIBSC                         PR8 provided by the National Institute for Biological Standards and Control
                                   real-time RT-qPCR                 Real-time reverse transcription-qPCR
                                   RT                                Reverse transcription
                                   SCMA                              Sulfated cellulose membrane adsorbers
                                   SEC                               Size exclusion chromatography
                                   Seg1–8                            Segment 1–8
                                   Segment-specific RT-PCR           Segment-specific reverse transcription-PCR
                                   SPF                               Specific pathogen free
                                   STV                               Standard virus
                                   SXC                               Steric exclusion chromatography
                                   TCID50                            50% tissue culture infective dose
                                   VCC                               Viable cell concentration
                                   vRNA                              Viral RNA

    An approach that was previously suggested is the use of de-          (Frensing et al. 2013; Frensing et al. 2014; Tapia et al. 2019;
fective interfering (DI) particles (DIPs) as an antiviral agent          Von Magnus 1951). One explanation for this interference is the
(Alnaji and Brooke 2020; Dimmock et al. 2008; Scott et al.               shorter DI vRNA, which may amplify faster compared with the
2011a, b; Smith et al. 2016; Zhao et al. 2018). DIPs are naturally       full-length vRNA. Thus, the DI vRNA outcompetes STV repli-
occurring virus mutants that have been observed for most DNA             cation for limited cellular or viral resources (Dimmock and
and RNA viruses. IAV DIPs typically contain a large internal             Easton 2014; Laske et al. 2016; Nayak et al. 1985), which is here
deletion in one of their eight viral RNAs (vRNAs) (Davis et al.          referred to as replication interference. In addition, it was sug-
1980). Thus, DIPs miss the genetic information required for the          gested that DIPs can also interfere with virus replication
synthesis of a full-length protein essential for viral replication       unspecifically, via the enhanced induction of innate immunity
(Huang and Baltimore 1970). Therefore, DIPs are only capable             (Easton et al. 2011).
of replication upon co-infection with an infectious standard virus           Previously, an antiviral effect was shown upon DIP treatment
(STV), compensating for the missing or truncated protein. Yet, in        in mouse and ferret models (Dimmock et al. 2012; Dimmock
such a co-infection scenario, STV replication is inhibited and           et al. 2008; Scott et al. 2011a; Smith et al. 2016). More recent
suppressed, and mainly non-infectious DIPs are released                  results also showed an antiviral effect in mice experiments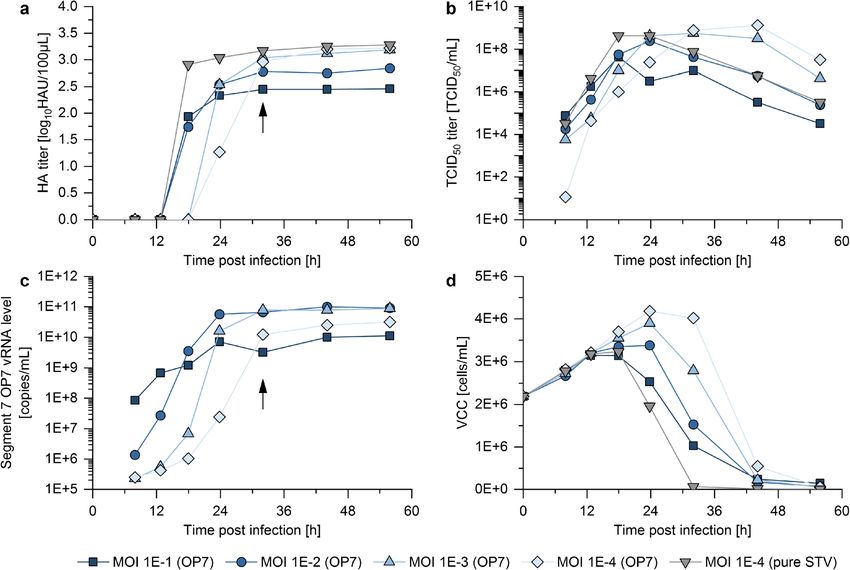
Appl Microbiol Biotechnol (2021) 105:129–146                                                                                     131

through a plasmid-based treatment, which encoded three IAV DI        Next, the produced OP7 material was treated with UV irradi-
genes (Zhao et al. 2018). The interfering effect was directed        ation, to ensure complete STV inactivation while maintaining
against the replication of a diversity of IAV subtypes               a high interfering efficacy, as shown in an in vitro assay.
(Dimmock et al. 2008). Moreover, antiviral effects even against      Subsequently, the material was purified and concentrated
influenza B and pneumovirus replication was shown, likely me-        using membrane-based steric exclusion chromatography
diated by the unspecific stimulation of innate immunity, con-        (SXC). Lastly, animal experiments in a mouse model demon-
ferred by DIP infection (Dimmock and Easton 2015; Easton             strated the anti-IAV activity of OP7.
et al. 2011; Scott et al. 2011a). The interference of IAV DIPs
with a variety of IAV subtypes might indicate that, in contrast to
vaccines, no annual adaptation to the currently circulating virus    Materials and methods
strain would be necessary (Dimmock and Easton 2015). An
additional advantage of DIPs over vaccines is the faster             Cells and viruses
mode of action. More specifically, vaccines induce an
adaptive immune response; therefore, it can take several             An MDCK cell line (ECACC, No. 84121903) adapted to sus-
weeks for full protection. In contrast, DIPs interfere with          pension growth (Lohr et al. 2010) was further adapted to grow
the replication of the pathogen and therefore act                    in Xeno™ medium as described earlier (Bissinger et al. 2019).
immediately.                                                         In this study, the chemically defined medium was used, in-
    Recently, we discovered a novel type of DIP, termed OP7,         stead of the serum free version. MDCK cells were cultivated
in influenza virus strain A/PR/8/34 (PR8) (Kupke et al. 2019).       either in (i) shake flask with 50-mL working volume (125-mL
Instead of a large internal deletion, OP7 contains 37 point          baffled polycarbonate Erlenmeyer Flask, Thermo Fisher
mutations in segment 7 (Seg7) vRNA in relation to the refer-         Scientific, 4116-0125) at 37 °C, 5% CO2 and 185 rpm
ence sequence (from the National Center for Biotechnology            (Multitron Pro, Infors HT; 50-mm shaking orbit) or (ii) a
Information). These point mutations affect the promoter re-          STR with a working volume of 500 mL (DASGIP® Parallel
gions, encoded proteins, and the packaging signal sequence.          Bioreactor System, Eppendorf AG, 76DG04CCBB) at 37 °C,
The OP7 phenotype displays an over-proportional level of             ≥ 40% O2, pH 7.6, and 150 rpm (marine impeller). Viable cell
Seg7 vRNA upon co-infection with STV, intracellularly and            concentration (VCC), cell viability, and cell diameter were
in the released virus particle population. Moreover, OP7 vi-         determined using an automated cell counter (Vi-CELL XR,
rions appear to miss a large proportion of other vRNA seg-           Beckman Coulter, 731050). Adherent MDCK cells from
ments, which may explain its defect in virus replication.            ECACC (No. 84121903) were cultivated in Glasgow mini-
Interestingly, we observed a previously described                    mum essential medium (GMEM) containing 1% peptone
“superpromotor” (Belicha-Villanueva et al. 2012) on Seg7             and 10% fetal bovine serum (cultivation medium) at 37 °C
vRNA of OP7, which might explain the replication interfer-           and 5% CO2.
ence of OP7. Here, the predominant replication and transcrip-           Seed virus titers were determined by a 50% tissue culture
tion of Seg7 OP7 may take away resources, required for STV           infective dose (TCID50) assay using adherent MDCK cells
replication, leading to an enhanced propagation of OP7 over          (Genzel and Reichl 2007). In Table 2, an overview of all seed
STV in a co-infection.                                               viruses used in this study is shown. All experiments with
    OP7 showed strong interference with the replication of           infectious virus were performed in laboratories with biological
IAV in Madin-Darby canine kidney (MDCK) cells and in                 safety level 2 certification and ABSL animal facilities, follow-
human cell lines, as shown in in vitro co-infection experi-          ing the respective safety regulations.
ments. This interference was not only directed against a com-
mon laboratory strain (i.e., PR8). We also demonstrated inter-       Batch-mode production of OP7
ference with very recent and relevant epidemic and pandemic
human IAV strains, which were suggested by the WHO as                The OP7 seed virus used for production (1.3E+8 TCID50/mL,
vaccine strains (until ~2016–2018) (Kupke et al. 2019).              5.60E+10 Seg7 OP7 vRNA copies/mL) was derived from a
Finally, the unspecific stimulation of innate immunity, ob-          single-cell virus isolate (“OP7-2”) as described previously
served upon OP7 co-infection, might even further promote             (Kupke et al. 2019). The virus strain used in these single-cell
the antiviral efficacy. Therefore, OP7 appears to be a very          experiments was IAV PR8 provided by the National Institute
promising candidate for antiviral therapy.                           for Biological Standards and Control (PR8-NIBSC, No. 99/
    In the present study, a small-scale cell culture–based pro-      716). The seed virus for pure STV infections (5.6E+8 TCID50/
cess for the production and purification of highly effective         mL) was adapted to growth in suspension MDCK cells as
OP7 material was established. For production, the interplay          described previously (Bissinger et al. 2019) and originated
of DIPs and STV was assessed by testing a range of multiplic-        from IAV strain PR8 provided by the Robert Koch Institute
ities of infection (MOIs) in order to obtain high OP7 yields.        Germany (PR8-RKI).
132 Appl Microbiol Biotechnol (2021) 105:129–146
Lambertz et al. (2018)
Bissinger et al. (2019)
For production, suspension MDCK cells were centrifuged
Kupke et al. (2019)
(300×g, 5 min, room temperature). The complete medium was
replaced with fresh, chemically defined Xeno™ medium.
Kupke et al.
This work
Reference
VCC was adjusted to 2E+6 cells/mL and trypsin added to a
(2019)
final concentration of 20 U/mL. MOIs were calculated based
on TCID50 titers. Infected cell cultures were incubated at 37
°C, 5% CO2, and 185 rpm. Samples or final products were
centrifuged (3000×g, 10 min, 4 °C) and stored at –80 °C until
Seg7 OP7 vRNA copies/mL
measurement.
Interference assay
To evaluate the interfering efficacy of the produced OP7 ma-
2.20E+10
5.60E+10
terial, an interference assay was used (adapted from (Kupke
et al. 2019)). Here, the OP7-induced reduction in virus titers in
a co-infection with STV was determined. Further, OP7 mate-
–
–
–
–
rial was added with a fixed volume to allow the identification
of production conditions yielding the highest interfering effi-
1.2E+9 (1.2E+8 FFU/mL)
cacy per product volume. First, 6-well plates were seeded with
adherent MDCK cells (1E+6 cells per well) and incubated for
0 (UV-inactivated)
24 h. Before infection, cells were washed twice with
phosphate-buffered saline (PBS). Then, cells were co-
TCID50/mL
infected with infectious STV virus (see Table 2) at a MOI of
10 (based on TCID50 measurements) and 125 μL of produced
1.1E+9
5.8E+8
5.6E+8
1.3E+8
OP7 material. Infection medium (for adherent cells, GMEM
containing 1% peptone and 5 U/mL trypsin) was filled up to a
total volume of 250 μL. After incubation (37 °C, 5% CO2, 1
h), cells were washed with PBS once. Then, 2 mL infection
PR8 (plasmid based)
medium per well was added, and cells were incubated again
(37 °C, 5% CO2, 16 h). Supernatants were analyzed for the
Source virus
PR8-NIBSC
PR8-NIBSC
PR8-NIBSC
hemagglutinin (HA) titer, plaque titer, and vRNAs in the prog-
PR8-RKI
PR8-RKI
eny virions. The obtained HA and plaque titers were then used
for a qualitative comparison.
Virus quantification assays
Control infection (suspension cells)
Interference assay (adherent cells)
The total number of IAV particles was quantified with a hem-
agglutination assay (Kalbfuss et al. 2008). For quantification
of infectious IAV particles, either a TCID50 assay or a plaque
assay was used. TCID50 (Genzel and Reichl 2007) measure-
(suspension cells)
Animal experiments
Animal experiments
ments were used to determine the infectious titer of seed vi-
OP7 production
ruses and the infectious titer of samples of the production
MS analysis
process. Plaque assay measurements were used for evaluation
Purpose
of the interference assay and for the inactivation kinetics after
Overview of seed viruses
UV treatment.
For the plaque assay, 6-well plates were seeded with ad-
herent MDCK cells (0.8E+6 cells per well) and incubated
(37°C, 5% CO2, 48 h). Before infection, cells were washed
Plaque-purified STV
twice with PBS, and the samples were prepared in serial 10-
OP7 seed virus
fold dilutions in infection medium. Of each dilution, 250 μL/
Active OP7
well were incubated (37 °C, 5% CO2, 1 h). Afterward, the
Table 2
Name
supernatant was removed, and the cells were overlaid with
STV
STV
STV
1% agar in infection medium. Incubation (37°C, 5% CO2)Appl Microbiol Biotechnol (2021) 105:129–146 133
was conducted for 4 days. The cells were fixed using metha- Matrix protein 1 analysis
nol and stained with a 0.2% crystal violet solution. After fix-
ation, the plaque count was determined by light microscopy Mass spectrometry (MS) was used to determine the abun-
and expressed as plaque forming units per mL (PFU/mL). dance of mutated and total Matrix protein 1 (M1 protein),
encoded by Seg7 vRNA, in the produced OP7 material.
PCR measurements Before MS measurements, samples were heat inactivated (3
min, 80 °C).
PCR-based approaches were used to analyze genomic vRNAs
of virus particles. The vRNA of samples (supernatant of in- Plaque purified STV generation as reference material
fected cells) was purified using the NucleoSpin® RNA virus
kit (Macherey-Nagel, 740956) according to the manufac- As a negative control (NC), a plaque-purified STV devoid of
turer’s instructions. Segment-specific reverse transcription- OP7 (derived from PR8-NIBSC virus), containing only the
PCR (segment-specific RT-PCR) was used to identify wild-type M1 protein, was used (as described in Kupke et al.
vRNAs containing a deletion (indicating DI vRNAs) for each 2019). Here, plaques from PR8-NIBSC viruses were picked
IAV genome segment. Real-time reverse transcription qPCR and reseeded in three consecutive assays. Obtained viruses
(real-time RT-qPCR) was used to quantify vRNAs of IAV were then multiplied on adherent MDCK cells for the gener-
segment 5 (Seg5), segment 8 (Seg8) and the mutated Seg7 ation of a seed virus. In the present study, the seed virus was
of OP7 (Seg7 OP7). further propagated in adherent MDCK cells (MOI 1E−4, 24
hpi) to generate a larger stock (see Table 2).
Segment-specific RT-PCR Protein precipitation
Reverse transcription (RT) of isolated vRNAs and segment- Briefly, 1.2 mL of sample was added to a 2-mL reaction tube
specific PCR amplification of the resulting cDNAs were per- containing 1 g of silica beads (0.5 mm, Carl Roth, N030.1) and
formed as described previously (Frensing et al. 2013; Kupke lysed using a bead mill (30 min, 30 Hz) with a subsequent centri-
et al. 2019). Briefly, RT was performed in a single reaction fugation step (8000×g, 10 min, room temperature). To a new
using a universal primer, which hybridizes to the conserved 3′ reaction tube, 1 mL of supernatant was transferred, and 1 mL
region of all eight genome segments (Hoffmann et al. 2001). 20% trichloroacetic acid (w/v, Sigma-Aldrich, 99%) was added
For the subsequent PCR, individual primers were used for before the tube was stored for 1 h at 4 °C. Samples were centri-
each genome segment. PCR products were visualized using fuged (16,400×g, 10 min, 4 °C, same for following steps) and
gel electrophoresis and investigated for the presence of short precipitated twice (alternating) with ice-cold acetone (80% v/v,
PCR products, indicating deleted DI vRNAs. VWR, 99.8%) and ethanol (70% v/v, VWR, 99.8%) for 20 min
with subsequent centrifugation after each step. The dried samples
Real-time RT-qPCR were resuspended afterward in 200 μL urea buffer (8 M urea
(Applichem) in 0.1 M Tris–HCl, pH 8.5).
For the real-time RT-qPCR, we used a primer system of a
previously reported method (Kawakami et al. 2011) that al- Tryptic digestion
lows for gene-specific detection of individual IAV vRNA
segments. In vitro generation of the reference standards, RT, For tryptic digestion of the proteins, a slightly modified ver-
real-time qPCR, and the calculation for absolute quantifica- sion of the filter-aided sample preparation protocol
tion of vRNA levels were conducted as described previously (Wisniewski et al. 2009) was used. Briefly, samples were
(Kupke et al. 2019). For the quantification of the mutated loaded on a 1.5-mL reaction tube containing a 10-kDa filter
Seg7 OP7, we designed a new primer combination and gen- unit (Pall Nanosep, VWR, 516-8492) and treated with 40 mM
erated a new reference standard. For this, the S7 OP7 vRNA dithiothreitol (20 min, 300 rpm, 56 °C) and 55 mM
sequence (GenBank accession number: MH085234) was syn- iodacetamide (20 min, 300 rpm, room temperature) with sub-
thesized and cloned into a pMX vector, conducted by GeneArt sequent centrifugation steps (10.000×g, 10 min, room temper-
(Thermo Fisher). Next, the primers used for reference standard ature, same for the following steps). The filter was then
generation were “S7-OP7 Uni for” (AGTAAAAACAGGTA washed once with 100 μL of 8 M urea buffer and thrice with
GATGTTGAAAG) and “S7-OP7 Uni T7 rev” (TAATACGA 5 mM ammonium bicarbonate. For tryptic digestion, 0.2 mL
CTCACTATAGGG AGTAGAAACAAGGTAGTTTT of a trypsin solution (2.5 μg/mL trypsin in ABC buffer; tryp-
TTAC). The tagged primers used for RT are shown in supple- sin MS approved, Serva) was added to the filter. Finally, the
mentary table S1. Primers used for the real-time qPCR are samples were incubated over night at 37 °C and 750 rpm in a
shown in supplementary table S2. thermomixer. After centrifugation, the filter was washed with134 Appl Microbiol Biotechnol (2021) 105:129–146
50 μL extraction buffer (ABC buffer + 5% LC-MS grade UV irradiation
acetonitrile) and 50 μL LC-MS grade water and the flow-
through of all three steps collected and dried in a vacuum Infectious STVs in the produced OP7 material were
centrifuge (Vacuubrand). inactivated using UV light. To expose the produced material
directly to the UV light while keeping a sterile environment, a
Liquid chromatography and MS laminar hood was used (Thermo Fisher Scientific, Safe 2020).
For inactivation, 45 mL produced material was transferred
Dried peptides were resuspended in 20 μL of chromatographic into a tray (250 cm2 surface area) and continually shaken with
mobile phase A (LC-MS-grade water, 0.1% trifluoroacetic acid, a mixer (Duomax 1030, 543-32205-00 Heidolph). This en-
99.9%). Of each sample, 2 μL was injected and separated by an sured a thin film layer (approximately 2 mm) and a homoge-
UltiMate® 3000 nano splitless reversed phase nanoHPLC nous inactivation of the material.
(Thermo Fisher Scientific) equipped with a reversed-phase trap
column (nano trap cartridge, 300 μm i.d. × 5 mm, packed with Innocuity assay
Acclaim PepMap100 C18, 5 μm, 100 Å, nanoViper) and a
reversed-phase separation column (Acclaim PepMap RSLC, For the identification of residual infectious STV in the UV-
C18, 2 μm, 75 μm, 50 cm). The gradient was 5 to 35% mobile irradiated material, an innocuity assay was conducted.
phase B (LC-MS grade acetonitrile, 0.1% formic acid, 99%) over Adherent MDCK cells were cultivated in T75-flasks to a con-
30 min at a flow rate of 0.4 μL/min. The LC was coupled directly fluence of about 80%. After washing, cultivation medium was
to a timsTOF Pro mass spectrometer (Bruker Daltonik GmbH), replaced with 45 mL infection medium. A sample volume of
equipped with a captive spray ionization source operated in pos- 100 μL was added. Cells were incubated for 72 h. Next, 1 mL
itive ion mode with a capillary voltage of 1400 V and 200 °C of the supernatant was transferred to another T75-flask con-
capillary temperature. The mass spectrometer was operated in taining 45 mL of infection medium and incubated for
MRM mode mimicking a SWATH-MS (Gillet et al. 2012) strat- 72 h. Finally, the hemagglutination assay was used to
egy. The scan range for MS1 was 400–1000 m/z with 24 isola- test whether a titer could be detected after the second
tion windows of 26 m/z (1 m/z overlap), resulting in a total cycle passage. Samples were subjected to the innocuity assay
time for a complete scan of the mass range of 3.2 s. The collision in triplicates and a positive control (active PR8-RKI),
energy spanned from 27 to 48 eV (slope = 0.042; intercept = and PBS as negative control was used.
9.45). The scan range for MS2 was 150–2200 m/z.
Data analysis with Skyline Downstream processing of OP7 material
Bruker timsTOF Pro raw files were analyzed using the open- A general overview of the production and purification
source software Skyline (vs. 19.1) (MacLean et al. 2010). workflow for OP7 is shown in supplementary Fig. S1.
Full-scan settings were applied to reflect the SWATH-MS
acquisition parameters described above. Other settings were Sample preparation before capture chromatography
enzyme = trypsin, maximal missed cleavages = 0, structural
modifications = carbamidomethyl (cysteine), isotope label The UV-inactivated virus harvest was clarified by a series of
type = heavy. Quantification of peak areas was based on 2- successive microfiltration steps with regenerated cellulose fil-
fold charged precursor and singly-charged y-ions (y-ion 3 to ter discs with pore sizes of 1.0 μm, 0.45 μm, and 0.2 μm (GE
last ion). Peak borders were manually adjusted. Healthcare) employing a reusable bottle top device (no.
528199-325; VWR) and a vacuum pump. The volume
Estimation of M1-OP7 abundance and proportion to total M1 of the filtered sample after the final 0.2 μm step was
approximately 450 mL. This sample is named “clarified
The point mutations of OP7 in Seg7 vRNA result in the ex- virus harvest” hereafter.
pression of a mutated M1 protein (M1-OP7). To quantify the The host cell DNA in the clarified virus harvest was enzy-
abundance of M1-OP7, a peptide containing one of the OP7 matically digested using an unspecific nuclease (Denarase®,
mutations (EITFYGAK) was measured. For quantification of named “Denarase” hereafter, no. 2DN100KU99; Sartorius
the abundance of total M1, a peptide unaffected by OP7 point Stedim Biotech). The DNA digestion was performed by
mutations (TRPILSPLTK) was measured. For the estimation supplementing the clarified virus harvest with magnesium
of the proportion of M1-OP7 to total M1, the abundance of chloride (no. M8266-1KG; Sigma-Aldrich Chemie GmbH)
M1-OP7 was divided by the respective abundance of total to a final concentration of 2 mM and 50 U/mL of Denarase.
M1. Subsequently, results were normalized to their corre- The sample was incubated at room temperature for 4.5 h under
sponding maximum value. mixing with a magnetic stirrer at 250 rpm.Appl Microbiol Biotechnol (2021) 105:129–146 135
Chromatographic purification 1.385 g/cm3 for the calibration particles, and 1.180 g/cm3 for
IAV. The particle size distribution is displayed as normalized
All chromatography experiments were performed with an weight average in percentage against apparent hydrodynamic
ÄKTA Pure 25 (GE Healthcare) liquid chromatography sys- diameter in nm.
tem. The UV absorbance was monitored at 280 nm, and
virus particles were monitored with a NICOMPTM 380 Formulation
(Particle Sizing Systems) submicron particle analyzer at
632.8 nm. All chromatography experiments were per- The SXC eluate was dialyzed against PBS overnight at 4 °C
formed at room temperature. with a 100-kDa molecular mass cut-off membrane as de-
Virus particles were purified by membrane-based SXC as scribed before (Marichal-Gallardo et al. 2017). The collected
reported previously (Marichal-Gallardo et al. 2017). The SXC sample was spiked with sucrose to a final concentration of 1%,
filter device (hereafter named “column”) consisted of a stack followed by a microfiltration step with a 0.2-μm cellulose
of 1.0 μm regenerated cellulose membranes (no. 10410014; acetate syringe filter (no. 16534————————K;
GE Healthcare) (20 layers; 100 cm2 total surface) fitted into a Sartorius Stedim Biotech) to ensure sterility. This puri-
commercial 25-mm stainless steel filter housing as described fied OP7 material was stored at – 80 °C until evaluation
before. The flow rates used were 5–10 mL/min. in in vitro assays.
SXC-purification was performed in bind-elute mode. Briefly,
(a) Equilibration: the column was washed with 10 column vol- Mouse infections
umes of water followed by 10 column volumes of 8% PEG-
6000, PBS. (b) Sample injection: The clarified virus harvest after For evaluation of the antiviral potential of OP7 in vivo, animal
DNA digestion was mixed in-line to a ratio of 1:1 with a stock experiments in the mouse IAV infection model were
solution consisting of 16% PEG-6000 (no. 81260-5KG; Sigma- performed.
Aldrich Chemie GmbH) and PBS to achieve a final concentra-
tion of 8% PEG-6000 when fed to the SXC column. Sample Challenge virus generation
injection was followed by a wash step with 8% PEG-6000,
PBS until baseline UV absorbance was achieved. (c) Elution: Mouse-adapted IAV PR8 virus was generated by plasmid res-
virus particles were recovered by washing the filter device with cue as described before (Hoffmann et al. 2000; Lambertz et al.
around 20 column volumes of PBS. 2018). For mouse infections, virus was propagated in the cho-
Additionally, analytical-size exclusion chromatography rioallantoic cavity of 10-day-old specific pathogen-free (SPF)
(SEC) was performed with a packed-bed Superdex 200 embryonated chicken eggs (Charles River Laboratories) for
Increase 10/300 GL (no. 17517501; GE Healthcare) column. 48 h at 37 °C, aliquoted and stored at – 80 °C. The titer of
The sample injection volumes ranged 100–500 μL, and the the stock viruses was determined by focus forming unit assay
flow rate was 0.75 mL/min. (FFU/mL) as described (Lambertz et al. 2018) (see Table 2).
The identity of the virus was confirmed by next-generation
Differential centrifugal sedimentation sequencing as described (Lambertz et al. 2018).
Particle size distribution analysis was estimated by differential Infection of mice
centrifugal sedimentation (DCS) as reported previously
(Pieler et al. 2017). A CPS DC24000 UHR disc centrifuge DBA/2JRj (D2-Mx1−/−) mice carrying a non-functional Mx1
was used (CPS Instruments Inc.) at 24,000 rpm with a 4– gene were obtained from Janvier. In our laboratory at the
16% (m/v) sucrose gradient in PBS. The gradient was formed Helmholtz Centre for Infection Research, we generated
by nine 1.6-mL steps with different sucrose concentration D2(B6).A2G-Mx1r/r (D2-Mx1r/r) mice carrying a functional
each, i.e., 16%, 14.5%, 13%, 11.5%, 10%, 8.5%, 7%, 5.5%, Mx1 gene. Here, we backcrossed DBA/2JRj mice for 10 gen-
and 4% sucrose (m/v), with a total volume of 14.4 mL. The erations onto congenic B6.A2G-Mx1r/r mice provided by
gradient quality was evaluated by injecting a 239-nm particle Peter Stäheli, University of Freiburg, Germany, as described
standard (0.3–0.5% solid content, polyvinyl chloride, CPS previously (Shin et al. 2015). All mice were maintained under
Instruments Inc.) directly after generating the gradient. The specific pathogen-free conditions at the Central Animal
gradient was then equilibrated for 10 min, followed by another Facilities of the HZI, Braunschweig. For infection, D2-
injection of a 239-nm particle standard for measurement cal- Mx1r/r mice (female, 8–12 weeks old) were anesthetized by
ibration. Finally, 100 μL of sample (1:1) was injected for the intra-peritoneal injection of ketamine-xylazine solution (5 mg/
size distribution measurements of samples. Additional density mL ketamine, WDT; 1 mg/ml xylazine, CP Pharma; in sterile
parameters for solutions and particles introduced into the cen- 0.9% NaCl, WDT) with a dose adjusted to the individual body
trifuge software were 1.072 g/cm3 for the gradient buffer, weight (200 μL/20 g body weight). For evaluation of OP7136 Appl Microbiol Biotechnol (2021) 105:129–146
toxicity or OP7 antiviral potency, mice were treated with 20 particles. Here, only STV-infected cells (but not OP7-infected
μL solution PBS containing the indicated dose of the tested cells) will produce progeny virions. Therefore, OP7 propaga-
OP7 material and the indicated dose of STV by intranasal tion and interference with virus replication was expected to
application. Subsequently, body weight and survival were cease. To test this supposed dependency of OP7 yield on
monitored for 14 days. In addition to mice that were found MOI, four MOIs ranging from 1E−1 to 1E−4 were investigat-
dead, animals with a body weight loss of more than 30% of the ed in previously optimized shake flask batch cultures
starting body weight were euthanized and recorded as dead. (Bissinger et al. 2019; Genzel et al. 2013; Granicher et al.
2019; Lohr et al. 2010). Suspension MDCK cells in Xeno™
medium were infected with OP7 seed virus. The applied MOI
Results was calculated based on TCID50 measurements of the seed
virus determining the amount of infectious STV particles.
OP7 production yield in batch mode is dependent on VCC, HA titers (indicating total virus particle concentration),
MOI TCID50 titers, and vRNA levels of the mutated Seg7 OP7 of
released virus particles were quantified over time post infec-
A seed virus containing OP7 and STV was used for cell tion (Fig. 1).
culture–based production, since propagation of the apparently Indeed, cell cultures infected at higher MOIs resulted in
defective OP7 relies on STV complementation. On the one lower HA titers compared with those infected at lower MOIs
hand, we expected more STV and DIP co-infections at higher (Fig. 1a), indicating an interfering effect of OP7 on virus
MOIs, likely leading to an enhanced propagation of OP7 over propagation. In line with this observation, maximum TCID50
STV. However, it has to be considered that DIP co-infections titers were lower with higher MOIs (Fig. 1b). The vRNA
also suppress virus replication, which may lead to an overall levels of Seg7 OP7 showed a higher initial level for higher
reduced virus titer (and thus, reduced OP7 yield) at higher MOIs (Fig. 1c); yet, the highest maximum vRNA levels were
MOIs. On the other hand, low MOIs should result in higher reached for infections at a MOI 1E−2 and 1E−3. As a control,
total virus titers, since cells are mostly infected by single virus one cultivation was infected with a pure STV seed (devoid of
Fig. 1 MOI screening for batch-mode production of OP7. Suspension Seg7 OP7 could be detected. The black arrows indicate the chosen har-
MDCK cells were cultivated in Xeno™ medium in shake flask with vest time point (32 hpi) for the following experiments. Illustration in-
50-mL working volume. Cells were then infected in exponential growth cludes results of one experiment. Note that additional cultivations har-
phase at a VCC of 2E+6 cells/mL with OP7 seed virus at different MOIs vested at the same time point showed reproducible results (supplementary
or pure STV at a MOI of 1E−4. The a HA titer, b TCID50 titer, c vRNA table S3)
level of Seg7 OP7, and d VCC are shown. For the pure STV infection, noAppl Microbiol Biotechnol (2021) 105:129–146 137
OP7) at a MOI of 1E−4. As expected, the STV infection interference, reducing the infectious virus titer (determined
showed the fastest decrease in VCC (Fig. 1d), while resulting by plaque assay) by almost four orders of magnitude. A very
in the fasted increase in HA and TCID50 titers. comparable titer reduction was observed for material pro-
For all infections, the TCID50 titer decreased at late process duced at MOI 1E−2 in a stirred tank bioreactor
times, in line with previous findings (Genzel et al. 2010). For (supplementary Fig. S2). Material produced at a MOI of 1E
instance, the infectious virus titer of the pure STV infection −1 or 1E−3 showed a less pronounced titer reduction, and
showed a decrease of approximately three orders of magni- OP7 produced at MOI 1E−4 decreased the plaque titer just
tude from 24 to 56 h post infection (hpi). Since it needs to be marginally. A similar trend could be observed for the reduc-
assumed that OP7 particles may lose biological activity simi- tion in total virus particle release, as indicated by the HA titer.
larly, it was considered to harvest as early as possible. A The observed differences are not as pronounced, as the release
harvest time point of 32 hpi was chosen, where the HA titer of non-infectious OP7 particles also contributes to total virus
and Seg7 OP7 vRNA level roughly reached their respective particle concentrations.
maximum value (Fig. 1a and c, black arrow). At the same The interference of OP7 was further assessed in vRNA
time, TCID50 titers were close to their maximum. TCID50 measurements of the released virus particles using real-time
titer, HA titer, and Seg7 OP7 vRNA level for the different RT-qPCR (Fig. 2b). First, material produced at any MOI in-
MOIs at 32 hpi are shown in supplementary table S3 (produc- duced an OP7 phenotype in the interference assay, indicated
tion replicate 1). Please note that the results shown here in- by an over-proportional level of Seg7 OP7 vRNA, as
clude a single experiment. However, independent production described previously (Kupke et al. 2019). While the
replicates (required for additional experiments described in maximum Seg7 OP7 vRNA levels were comparable,
the following sections) showed reproducible results Seg5 and Seg8 vRNA levels showed a stronger reduc-
(supplementary table S3). Additionally, OP7 material was tion at higher interference.
produced in a stirred tank bioreactor at a MOI 1E-2. Despite To ensure that observed interfering effects were not caused by
the different production systems, very comparable replication conventional DIPs, a segment-specific RT-PCR was performed.
dynamics and maximum virus titers were observed The method was previously used to detect deleted (and short) DI
(supplementary Fig. S2). vRNAs of IAV of segment 1–8 (Seg1–8) in cell culture
In summary, it appears that the MOI strongly affects the (Frensing et al. 2013; Tapia et al. 2019). Figure 2c shows the
yield of OP7 (i.e., Seg7 OP7 vRNA). High MOIs resulted in results for Seg1, Seg2, and Seg3, which are most prone for the
lower virus titers, indicating suppression and interference of formation of conventional DI vRNAs. DI vRNAs were observed
virus production by OP7. On the other side, low MOIs result- neither on these segments nor on the remaining segments
ed in higher total virus particle concentrations. Therefore, in- (supplementary Fig. S3) for material produced at any MOI.
termediate production MOIs (i.e., MOI 1E−2 or 1E−3) seem The point mutations on Seg7 OP7 vRNA also affect the
to allow for high-yield OP7 production due to a good balance coding region, resulting in a mutated M1-OP7 protein, which
between Seg7 OP7 vRNA replication and an acceptable sup- is presumably incorporated into OP7 particles. To investigate
pression of overall virus production. this, MS was used to quantify M1-OP7 (Fig. 2d). Here, M1-
OP7 was quantified by measuring the abundance of a frag-
Interfering efficacy of the OP7 material depends on ment peptide that carried a mutation in the respective amino
the production MOI acid sequence. The abundance of total M1 protein was quan-
tified by measurements of a fragment peptide that was identi-
To determine the production MOI yielding the highest biolog- cal for OP7 and wild-type virus. In line with the results of the
ical efficacy, OP7 samples were compared in an in vitro in- interference assay, the relative abundance of M1-OP7 was
terference assay. Here, the suppression of STV replication by highest for OP7 produced at a MOI of 1E−2 and lowest for
OP7 co-infection was assessed. More specifically, STV infect- a production MOI of 1E−4. Next, the proportion of the M1-
ed cells were co-infected with OP7 material, and the reduction OP7 to total M1 protein was estimated. We observed that
of released infectious virus particles was compared with those higher production MOIs led to higher proportions of M1-
of STV only infected cells. STV was added at MOI 10 and OP7, with OP7 produced at MOI 1E−1 showing the highest
harvested OP7 material with a fixed volume of 125 μL in proportion. However, the total amount of produced M1-OP7
order to identify a production condition showing the highest was higher for material produced at MOI 1E−2, which may be
interfering efficacy per product volume. The TCID50 titer, HA explained by the decreased total virus titer for the production
titer, and OP7 Seg7 vRNA level for the OP7 preparations MOI of 1E−1 (Fig. 1b). As a control, a plaque-purified STV
produced with different MOI are shown in supplementary sample (devoid of OP7) was used, which was tested negative
table S3 (production replicate 2). for the presence of M1-OP7. In contrast, the peptide for total
Figure 2a shows the results of the interference assay. OP7 M1 protein could be measured for all samples (supplementary
material produced at a MOI of 1E−2 showed the strongest Fig. S4), confirming the validity of the measurement.138 Appl Microbiol Biotechnol (2021) 105:129–146
Fig. 2 Evaluation of OP7 material produced at different MOIs. a, b are indicated. d Results of MS. The relative abundance of M1-OP7 and
Interference assay. Adherent MDCK cells were infected at a MOI of 10 the relative proportion of M1-OP7 to total M1 protein are shown. Results
with STV and co-infected with 125 μL of OP7 material, produced at a were normalized to the respective maximum value. As a control, a
MOI ranging from 1E−1 to 1E−4 or medium as NC. At 16 hpi, a virus plaque-purified STV, devoid of OP7, was measured. The interference
titers and b vRNA levels of Seg5, Seg7 OP7, and Seg8 in the progeny assay was performed in independent experiments (n = 3) using one
virions were determined. c, d OP7 materials, produced at different OP7 production sample. MS measurements were performed as technical
MOIs. c Results of segment-specific reverse transcriptase-PCR. Signals replicates (n = 3) of one production sample. Error bars indicate standard
corresponding to full-length (FL) and DI vRNAs of Seg1, Seg2, and Seg3 deviation
In summary, the interference assay showed the Instead, to demonstrate the absence of STV for UV-treated
highest interfering efficacy for material produced at a OP7 material, an in vitro innocuity assay was performed. Here, a
MOI of 1E−2, in line with MS measurements indicating small sample volume was used for infection of a large number of
the highest amount of M1-OP7. cells, followed by another infection passage after 3 days. This
complies with a low MOI scenario in which almost exclusively
UV irradiation completely inactivates STV while single-hit infections occur. Accordingly, these infection condi-
preserving interfering efficacy of OP7 tions allow for the propagation of residual STVs, which might
have not been detectable by the plaque assay (Fig. 3a).
In order to inactivate STV in the produced OP7 material, Afterward, virus accumulation was determined by hemaggluti-
which may cause harm in a potential application, UV irradia- nation assay. Indeed, OP7 material irradiated up to 6 min was
tion was used. Moreover, we targeted at short inactivation tested positive in the presence of infectious STV. The first time
times to avoid a potential loss of interfering efficacy of OP7. point tested negative was 7 min of UV irradiation (black arrow:
Figure 3a shows the inactivation kinetics of a pure STV Fig. 3a). Nevertheless, for safety reasons, an inactivation time of
sample and of OP7 produced at a MOI of 1E−2. For the STV 8 min was chosen for processing of OP7 material for subsequent
sample, infectious virus titers steadily decreased with irradia- animal experiments.
tion time until 5 min. At 6 min, the detection limit of Next, the interfering efficacy was determined for OP7 ma-
the plaque assay was reached. However, for the OP7 terial inactivated for different UV irradiation times (Fig. 3b).
material, no infectious virus titer could be detected al- With longer inactivation times, the interfering efficacy de-
ready after 2 min UV irradiation. Here, it is likely that creased, which can be explained by inactivation of OP7 par-
the quantification of STV in the plaque assay (detecting ticles. Interestingly, up until 1 min inactivation time, the inter-
only infectious viruses) was impeded by the suppression fering efficacy slightly increased, which may be explained by
of virus replication by OP7 particles. a faster inactivation of STV compared with OP7.Appl Microbiol Biotechnol (2021) 105:129–146 139
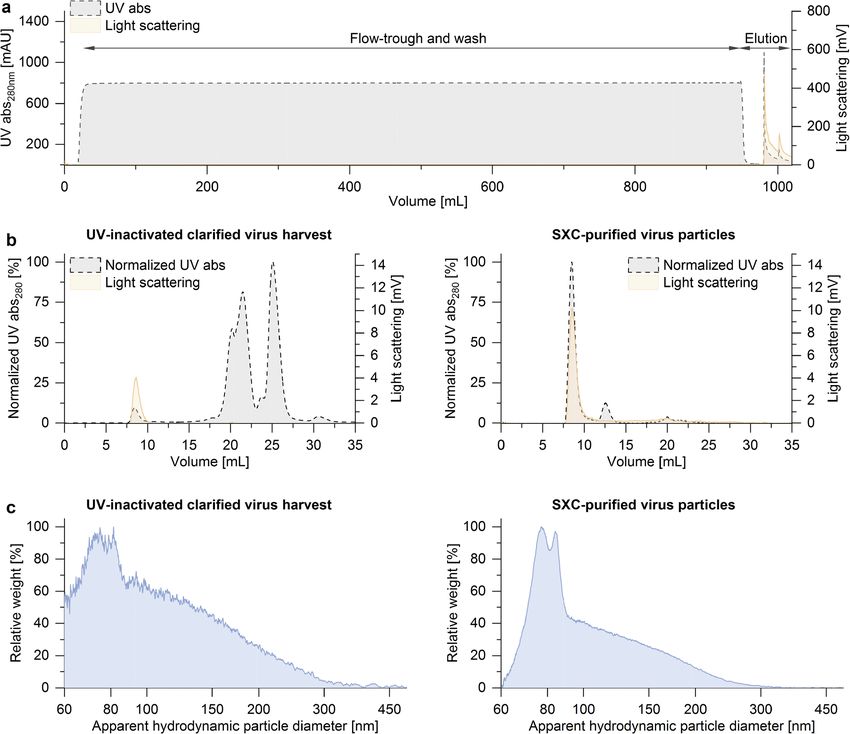
assay was 45.2% relative to the load (further discussion on
product yield in “Purification of processed OP7 material”).
Figure 4b shows analytical SEC fingerprints of the
clarified virus harvest (left panel) and the SXC-purified
virus particles (right panel). The virus particles are traced
by light scattering at a retention volume of 7.5–10 mL.
The virus purity based on the total protein detected by the
UV signal at 280 nm from the SEC fingerprints was 2.7%
for the clarified virus harvest and 89.1% for the SXC-
purified sample (area under the curve of the virus peak
divided by the total area of the chromatogram).
Figure 4c shows the particle size distributions of the
unpurified and purified samples determined by DCS analysis
(left and right panel, respectively). The signal noise of the
unpurified sample is due to a lower particle concentration
compared with the purified material. Two main peaks are
observed at around 80–90 nm with the additional presence
of less concentrated larger particles up to 250 nm.
Next, the concentrated and SXC-purified (1.12E+11 Seg7
Fig. 3 UV irradiation of produced OP7 material. Produced OP7 material
OP7 vRNA copies/mL) material was analyzed in the interference
(MOI 1E−2, 32 hpi) was irradiated with UV light. a Infectious virus titer assay (Fig. 5). Although the produced material was treated by
in the sample and b infectious virus titer in the interference assay UV irradiation, SXC purification resulted in a greatly increased
(described in Fig. 2) were determined for different UV inactivation times, interfering efficacy (Fig. 5a). The UV-irradiated, SXC-purified
where 0 min corresponds to UV untreated samples. a As a control, the
decrease in infectious virus titer of a pure STV, devoid of OP7, was OP7 reduced the release of infectious virus particles by approx-
tested. The black arrow indicates the first time point where no infectious imately four orders of magnitude, similar to the non-concentrated
virus could be detected for the UV-treated OP7 material, as shown by an OP7 material without UV irradiation. In line with this, the vRNA
innocuity assay. b For the interference assay, medium was tested as a NC. levels of Seg5 and Seg8 in the released virus particles show the
Panels include results of one experiment
strongest reduction for infection with the purified OP7 material
(Fig. 5b). The increased volumetric interfering efficacy after the
SXC-purification was most likely caused by the approximately
13-fold increase in the concentration of total virus par-
Taken together, UV irradiation resulted in a complete inac- ticles, as indicated by HA titers, which showed an in-
tivation of STV in the produced OP7 material after 7 min. crease from 2.61 to 3.67 log 10 HAU/100 μL. An
Still, to a large degree, the interfering efficacy of OP7 was inactivated OP7 control was generated by UV irradia-
preserved. tion (for 24 min) of the purified material. This material
did not show an interfering effect, probably due to com-
plete inactivation of OP7. Indeed, only residual amounts
Downstream purification and concentration greatly of Seg7 OP7 vRNA could be detected in the released
improve interfering efficacy of UV-irradiated OP7 virus particles.
material In summary, UV-irradiated OP7 material was purified by
SXC, resulting in an approximately 13-fold concentration and
In order to increase the volumetric interfering efficacy, the a greatly improved interfering efficacy.
UV-irradiated OP7 material was purified and concentrated
by membrane-based SXC. Therefore, the UV-inactivated
and DNA-digested clarified virus harvest was mixed in-line OP7 material protected mice against a lethal dose of
1:2 with 16% PEG-6000 and fed to a chromatography filter IAV upon co-administration
unit. Based on the SXC chromatogram shown in Fig. 4a, no
visible losses of virus particles were observed in the flow- Studies in a mouse infection model were performed to evalu-
through during sample loading and column wash, evidenced ate the antiviral effect of OP7 material in vivo. The tested
by a nil light scattering signal. The absence of IAV particles in material was cell culture–derived unpurified OP7, UV-
the flow-through fraction was confirmed by the hemaggluti- inactivated for 8 min to inactivate potentially harmful STV;
nation assay. The purified virus particles were eluted in PBS, this material is referred to as “active OP7” (0 TCID50/mL,
and the product yield estimated with the hemagglutination 2.02 E+10 Seg7 OP7 vRNA copies/mL). As negative140 Appl Microbiol Biotechnol (2021) 105:129–146 Fig. 4 Purification of virus particles by SXC. UV-inactivated OP7 mate- the SXC-purified material (right panel). (c) Particle size distributions rial was purified using membrane-based SXC. (a) The light-scattering determined by differential centrifugal sedimentation. The signal noise signal indicates the presence of the IAV particles in the elution step. (b) of the unpurified sample in the left panel is due to a lower particle con- Analytical size-exclusion chromatography fingerprints of IAV samples centration compared with the SXC-purified material on the right panel. before and after membrane-based SXC. The virus purity based on the UV The purification was performed in a single experiment signal was 2.7% for the clarified virus harvest (left panel) and 89.1% for controls, OP7 material that was UV inactivated for 24 min was and all but one mice died. In strong contrast, mice treated with used. This material is referred to as “inactive OP7.” active OP7 showed no body weight loss, and all the animals First, toxicity of the material was examined (Fig. 6a and b). survived the infection. For this, OP7 material (active or inactive; 2.2E+8 Seg7 OP7 Finally, different concentrations of active OP7 ranging vRNA copies/mice) was intranasally applied to mice. Neither from 2.2E+8 Seg7 OP7 vRNA copies/mice (1:2) to 8.8E+6 active OP7 nor inactive OP7 caused body weight loss, and all Seg7 OP7 vRNA copies/mice (1:50) were tested for their an- mice survived the treatment. These results demonstrate that tiviral effect (Fig 6f and e). Treatment with 1:2 diluted active OP7 alone did not cause any obvious toxic effects. OP7 resulted in a 100% survival rate and no significant body Next, mice were infected with a lethal dose of 1000 FFU weight loss. Mice treated with 1:10 diluted active OP7 lost STV (Fig. 6c and d) and co-treated with active OP7 or inactive weight but all recovered and survived the infection. Twenty- OP7 (2.2E+8 Seg7 OP7 vRNA copies/mice). Mice treated five percent of mice treated with 1:20 diluted active OP7 still with inactive OP7 started to lose weight 4 days post infection, survived the infection. However, when active OP7 was diluted
Appl Microbiol Biotechnol (2021) 105:129–146                                                                                             141

                                                                            irradiation and purified with SXC. This purified material showed
                                                                            strong interfering efficacy in a cell-based in vitro interference
                                                                            assay. Animal experiments with mice showed a 100% rescue
                                                                            of mice infected with a lethal dose of IAV upon OP7 co-treat-
                                                                            ment, demonstrating its potential for antiviral therapy.

                                                                            Identification of the production conditions yielding a
                                                                            high interfering efficacy

                                                                            Cell culture–based production of IAV in shake flasks was
                                                                            previously established in our group for vaccine manufacturing
                                                                            (Bissinger et al. 2019; Genzel et al. 2013; Granicher et al.
                                                                            2019; Lohr et al. 2010). Therefore, many parameters including
                                                                            media composition, shaking orbit, and stirrer speed were al-
                                                                            ready optimized. Here, we investigated the impact of the ap-
                                                                            plied MOI, the harvest time, and the VCC at time of infection
                                                                            on OP7 yield. The interfering efficacy of material harvested at
                                                                            different time points or produced with different VCC at time
                                                                            of infection did not show any significant differences (data not
                                                                            shown). However, as previous works suggested, the MOI had
                                                                            a large impact on yield (Dimmock et al. 2008; Frensing 2015;
                                                                            Tapia et al. 2019; Wasik et al. 2018). The highest interfering
                                                                            efficacy was observed for material produced at a MOI of 1E
                                                                            −2. This can be explained as follows. On the one hand, the
                                                                            yield of Seg7 OP7 vRNA was very similar for a production
                                                                            MOI of 1E−2 and 1E−3; however, the production MOI of 1E
                                                                            −3 resulted in a higher infectious virus titer. Here, the higher
Fig. 5 Interfering efficacy of processed OP7 material. An interference      STV concentration may have resulted in a reduced interfering
assay was conducted as described in Fig. 2. The produced OP7                efficacy in this sample, probably by a stronger competition of
material; produced material irradiated with UV (for 8 min); UV-treated,     STV against OP7. As different vRNA segments compete for
SXC-purified material (active); and SXC-purified material, inactivated by
                                                                            resources in translation, increased amounts of STV vRNA
UV light for 24 min (inactive), and medium as negative control was
tested. a Virus titers and b vRNA levels of Seg5, Seg7 OP7, and Seg8        may have also had negative impact on the amounts of pro-
in the progeny virions are shown. The interference assay was performed      duced M1-OP7. More specifically, MS measurements indicat-
in independent experiments (n = 3), each using one preparation. Error       ed reduced amounts of M1-OP7 for virions produced at a MOI
bars indicate standard deviation
                                                                            of 1E−3 compared with those produced at a MOI of 1E-2.
                                                                            Here, it was speculated that M1-OP7 may also contribute to
1:50, no difference to PBS treated IAV-infected mice could be               the interference of OP7 (Kupke et al. 2019), which could
detected, and all the mice died 8 days post infection.                      explain the lower interfering efficacy for material produced
   Taken together, treatment of mice with active or inactive                at a MOI of 1E-3.
OP7 material did not show any obvious toxic effects.
Moreover, co-treatment with active OP7 protected mice                       Comparison of cell culture–based production pro-
against a lethal dose of STV. Here, the minimum required                    cesses for DIPs
dose to achieve a 100% survival rate was 4.4E+7 Seg7 OP7
vRNA copies/mice (1:10 dilution). Mice treated with an OP7                  The cell culture–based batch production process suggested
dose as low as 2.2E+7 Seg7 OP7 vRNA copies/mice (1:20                       here has advantages over a previously reported egg-based
dilution) were still partially protected. These results clearly             process for DIPs (Dimmock et al. 2008). In principle, the cell
demonstrate the antiviral potential of OP7.                                 culture–based process allows for an improved scalability and
                                                                            flexibility. Furthermore, it allows for better defined pro-
                                                                            cess conditions and the possibility to monitor the pro-
Discussion                                                                  duction. Therefore, the production process can be char-
                                                                            acterized in depth, and reproducible product quality can
In this study, a cell culture–based production process for OP7              be ensured (Frensing et al. 2014; Swick et al. 2014;
was established. The produced material was processed via UV                 Tapia et al. 2019; Wasik et al. 2018).
142 Appl Microbiol Biotechnol (2021) 105:129–146 Fig. 6 Mouse infection experiments with OP7 material. Female 8–12- active OP7 (1:2, dose: 2.2E+8 Seg7 OP7 vRNA copies/mice (n = 4); week-old D2-Mx1r/r mice were intra-nasally infected with 20 μL solution 1:10, dose: 4.4E+7 Seg7 OP7 vRNA copies/mice (n = 6); 1:20, dose: containing OP7 and/or STV in PBS. a, b Toxicity was tested by applying 2.2E+7 Seg7 OP7 vRNA copies/mice (n = 4); 1:50, dose: 8.8E+6 Seg7 10 μL active (n = 5) or inactive (n = 5) OP7 material individually (dose: OP7 vRNA copies/mice (n = 6)) or PBS (n = 10). All mice treated with 2.2E+8 Seg7 OP7 vRNA copies/mice). All mice survived the treatment active OP7 diluted 1:2 or 1:10 survived the infection. Y-axes show per- with active or inactive OP7. c, d Mice were co-treated with 10 μL active centages (in relation to day 0) of mean body weight losses (a, c, e) and (n = 9) or inactive (n = 13) OP7 material (dose: 2.2E+8 Seg7 OP7 vRNA survival rates (b, d, e) for each group. Error bars indicate one standard copies/mice) and a lethal dose of 1000 FFU STV. e, f Mice were infected error of the mean (SEM) for body weight changes with a lethal dose of 1000 FFU STV and treated with different dilutions of Previously, a process for continuous production of DIPs was batch process. For instance, in continuous cultivation, the de reported (Frensing et al. 2013; Tapia et al. 2019). However, the novo generation and accumulation of conventional DI RNAs here proposed batch process may hold several advantages. For was observed (Frensing et al. 2013; Tapia et al. 2019). This example, the reproducibility and product quality are higher for a resulted in a mixture of a variety of DIPs and thus a less-
Appl Microbiol Biotechnol (2021) 105:129–146                                                                                          143

defined product. In contrast, no accumulation of conventional DI        for the production of OP7, for example, by using a cell line
RNAs was observed in the batch cultivations for any genome              expressing the wild-type M1 and/or M2 protein. Note that
segment, probably due to a shorter cultivation time and a lower         previous results suggest that the mutated M1-OP7 may ex-
MOI. Moreover, an oscillating titer and fluctuating DIP to STV          plain or contribute to the defect in the replication of OP7
ratios were observed in continuous cultivation (Frensing et al.         (Kupke et al. 2019).
2013; Tapia et al. 2019), which might complicate the selection
of an optimal harvest time point. In contrast, the batch process        Purification of processed OP7 material
shown here resulted in very reproducible titers.
    The results obtained in this proof-of-concept study should          The SXC purification resulted in a product yield of 45.2%,
facilitate scale-up and further process improvements. The high          which was lower than the typically observed yield of > 95%
comparability of a production in shake flask and a stirred tank         for the PR8 and other influenza virus strains purified using the
bioreactor indicate that production in larger scales is equally         same conditions (Marichal-Gallardo et al. 2018). In our expe-
feasible. Furthermore, process intensification strategies could be      rience, yields lower than 80% when purifying influenza virus
applied similar to those that have already been widely explored         particles with SXC are mostly due to fouling of the stationary
for production of monoclonal antibodies in CHO cells (Pollock           phase caused by the presence of submicron size particles, as
et al. 2013) or the production of flaviviruses (Nikolay et al.          observed in the DCS particle size distribution of the
2018). In the latter, a continuous feeding and harvesting scheme        unpurified material. This is further supported by the
(perfusion) was implemented that used a cell retention device to        absence of virus particles in the flow-through. The pres-
achieve higher cell concentrations and, subsequently, higher vi-        ence of submicron particles might be minimized by
rus titers. For IAV and DIP production, further improvement             changes during cell culture or sample processing (e.g.,
seems also possible. More specifically, a strategy for continuous       harvest time, UV inactivation), and this reduction might
harvesting of produced virus particles may be employed. This            lead to higher purification yields.
might result in higher yields of biologically active virions by             The two main peaks detected by DCS analysis (80–95 nm)
avoiding the time-dependent degradation and loss of biological          of the SXC-purified sample are consistent with the reported
activity, which is typically observed in a cultivation (Genzel et al.   size range for IAV particles of 80–120 nm (Pieler et al. 2017).
2010). However, continuous virus harvest with membrane-based            The difference between both peaks might be due to aggregates
cell retention remains problematic due to potential blocking of         or to previously observed size differences between STV and
the membrane (Genzel et al. 2014). Alternatively, cell retention        OP7 (Kupke et al. 2019). The particle population in the puri-
devices like an acoustic settler might be used for continuous virus     fied material might be further characterized in future studies
harvesting (Coronel et al. 2020; Granicher et al. 2020).                by using analytical SEC integrated to multi-angle light scat-
                                                                        tering, ion exchange chromatography, or isoelectric focusing.
UV irradiation for inactivation of STV in OP7                               Membrane-based SXC-purification was able to eliminate
manufacturing                                                           most UV-detected impurities as evidenced by the analytical
                                                                        SEC fingerprints. Before SXC, the virus peak had an estimat-
For the inactivation of STV in the produced material, a previ-          ed purity of 2.7%, compared with 89.1% after SXC. Further
ously described UV-irradiation principle was applied                    polishing of the sample to achieve higher purity could be done
(Dimmock et al. 2008). Here, a faster inactivation of STVs              after SXC by using pseudo-affinity chromatography with sul-
compared with DIPs was expected (Dimmock et al. 2008). In               fated cellulose membrane adsorbers (SCMA) (Fortuna et al.
theory, an STV already loses its infectivity when only one              2018). Both of these membrane-based purification methods
segment is inactivated, while OP7 only loses its interfering            rely on disposable devices and can be scaled-up by linearly
efficacy when specifically Seg7 OP7 is inactivated.                     increasing the membrane surface needed.
Moreover, Seg7 is rather small (~ 1 kb) compared with, e.g.,                The separation of STV and DIPs by SXC was not studied
Seg1, Seg2, and Seg3, with more than 2 kb, decreasing the               in this work. Although separation in SXC is mainly based on
likelihood of its inactivation. Nevertheless, the UV irradiation        particle size, other variables play a role in the separation effi-
inactivated parts of the produced OP7 and resulted in a re-             ciency, such as pH, conductivity, and the isoelectric point of
duced interfering efficacy. One approach to avoid the need              the target product. The possibility of resolving STV from
of UV irradiation may be the production of pure OP7 particles           DIPs using a modified version of the SXC protocol used here
using a cell line that complements the defect in replication of         is an interesting prospect for future work.
OP7. Such a system was already successfully applied for the                 Based on the results obtained in this work, we believe the
generation of conventional DIPs carrying a deletion on Seg1             following options are interesting for future purification exper-
vRNA using a complementing cell line expressing the corre-              iments: (1) increasing the product yield of SXC by optimiza-
sponding missing protein polymerase basic 2 (Bdeir et al.               tions in cell culture to reduce the presence of submicron par-
2019; Yamagata et al. 2019). A similar strategy might be used           ticles and/or testing of stationary phases with pore sizes larger
You can also read