Open Ocean Finfish Aquaculture: Business Case - February 2020 Prepared by Envirostrat Ltd - MPI
←
→
Page content transcription
If your browser does not render page correctly, please read the page content below
New Zealand Trade and Enterprise

Open Ocean
Finfish
Aquaculture:
Business Case
February 2020

Prepared by Envirostrat Ltd

                                   P a g e 0 | 84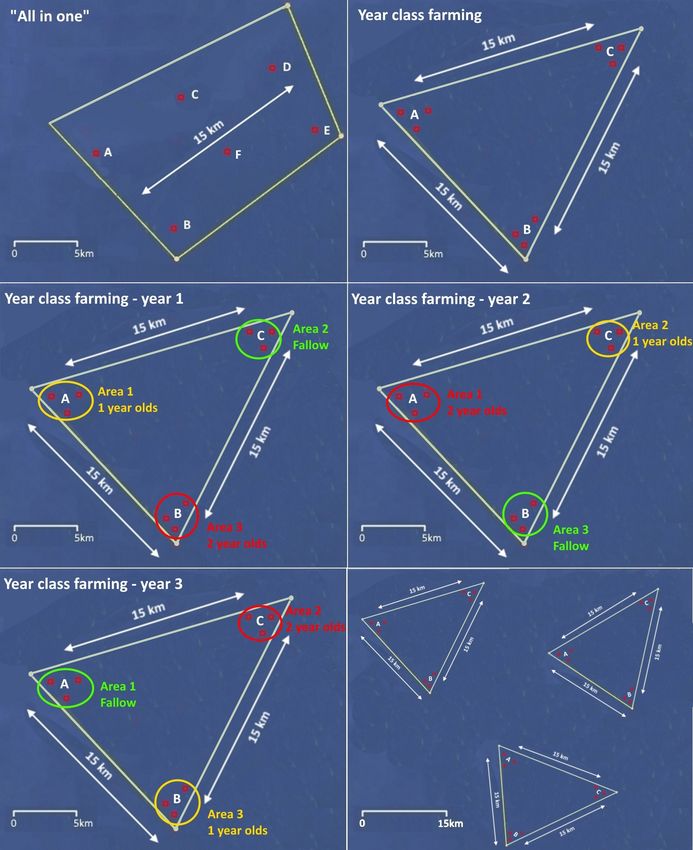
Table of Contents

EXECUTIVE SUMMARY .............................................................. 4

1 INTRODUCTION ................................................................... 7

1.1    Purpose of the Document .............................................. 7

1.2    Background ..................................................................... 7

1.3    Strategic Case for OOA in New Zealand ......................... 8

1.4    Current International Aquaculture Context ................. 10

2 FINANCIAL MODEL & SCENARIO ANALYSIS ...................... 14

2.1    Key Findings ................................................................... 14

2.2    Capital Costs .................................................................. 14

2.3    Operating Costs ............................................................. 17

2.4    Return on Investment ................................................... 19

2.5    Scenario Analysis ........................................................... 20

2.6    Industry View ................................................................. 21

3 ECONOMIC IMPACT ASSESSMENT .................................... 23

3.1    Results............................................................................ 23

4 OOA FUNCTIONAL REQUIREMENTS ................................. 33

4.1    Biological Specifications ................................................ 33

4.2    Infrastructure Requirements ........................................ 40

                                                                           P a g e 1 | 84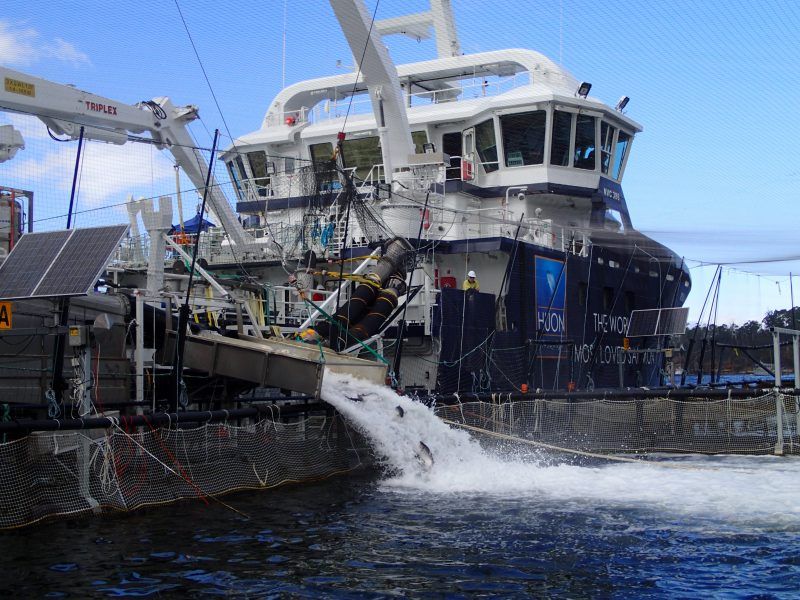
4.3    Technological Horizons ................................................. 49

4.4    Legal Assessment of OOA ............................................. 50

4.5    Commercial Risk ............................................................ 53

4.6    Biosecurity ..................................................................... 54

4.7    Impacts & Stakeholders ................................................ 59

4.8    Climate Change Considerations ................................... 67

5 CONCLUSIONS ................................................................... 70

APPENDIX 1: FINANCIAL MODELLING ASSUMPTIONS ......... 75

APPENDIX 2: FINANCIAL STATEMENTS – BASE CASE ............ 83

                                                                          P a g e 2 | 84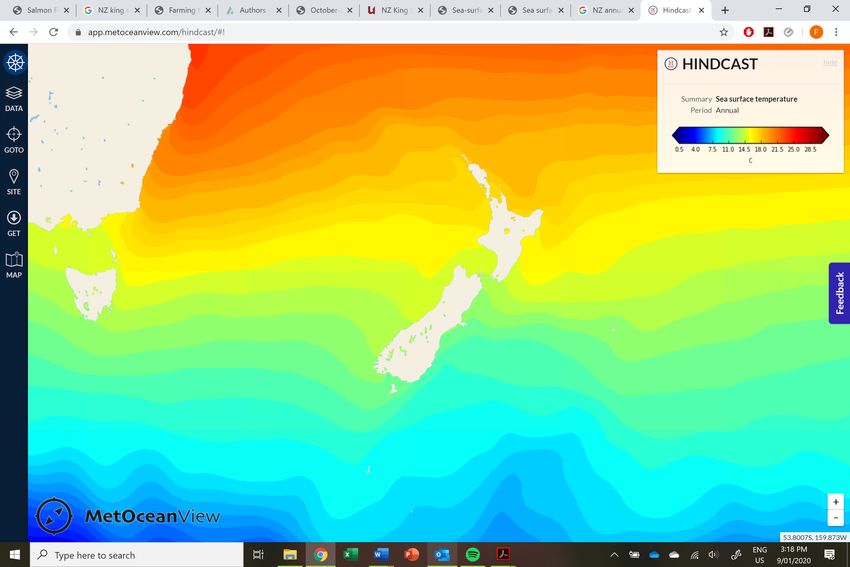
Figure 1. Fish consumption per continent 2019E (left). Development of global average fish
consumption (right). .............................................................................................................................. 8
Figure 2. Estimated growth of aquaculture relative to wild caught seafood. ..................................... 8
Figure 3. Norwegian Cost of Production Trend 2012 to 2018. .......................................................... 12
Figure 4. Upfront capital cost for 10,000t operation ($ real) ............................................................. 15
Figure 5. Annual operating cost for 10,000t ($ real)........................................................................... 17
Figure 6. Industry production and sales - 30-year forecast. .............................................................. 22
Figure 7. Cumulative position (benefits less costs). ........................................................................... 25
Figure 8. Distribution of outcomes (MCS). .......................................................................................... 26
Figure 9. Employment Impacts – Construction and set-up ............................................................... 30
Figure 10. Employment Impacts - Ongoing. ....................................................................................... 31
Figure 11. Income returned ($’m). ....................................................................................................... 32
Figure 12. Chinook salmon (Oncorhynchus tshawytscha). ................................................................ 33
Figure 13. Main Chinook Salmon marine farming regions, New Zealand. ....................................... 34
Figure 14. Annual Sea Surface Temperature (SST) map of New Zealand waters. ............................ 38
Figure 15. (Left to right, top to bottom). Kingfish (Seriola lalandi), Hāpuku (Polyprion oxygeneios),
Snapper (Pagrus auratus), Trevally (Pseudocaranx dentex), Butterfish (Odax pullus). ................... 39
Figure 16. Rainbow Trout (Oncorhynchus mykiss)............................................................................. 39
Figure 17. Sea port facilities & container terminals suitable for OOA around New Zealand. ......... 42
Figure 18. The effect of ration (feed amount) on growth rate and feed conversion rate. ............... 46
Figure 19. Ronja Huon. 75m long wellboat owned by Huon Aquaculture. ....................................... 47
Figure 20. Diagrams showing relative biosecurity risk ...................................................................... 57
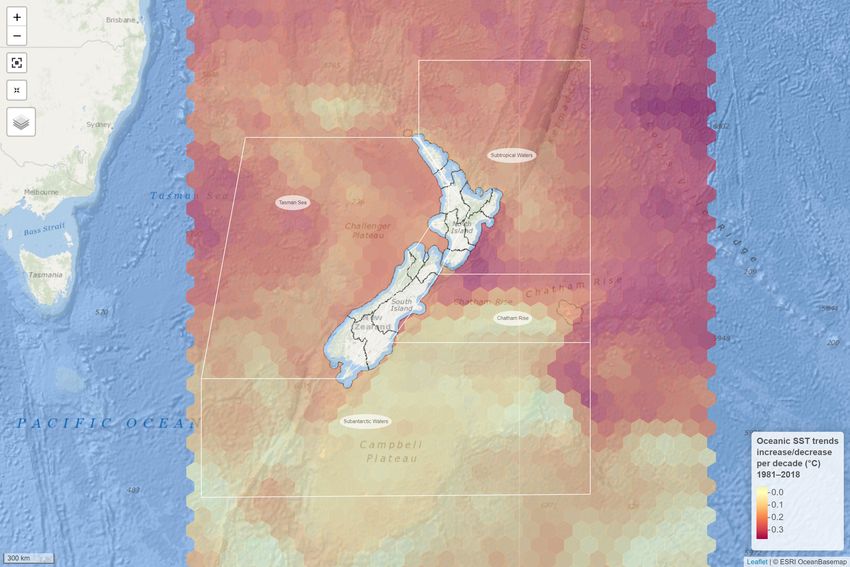
Figure 21. Oceanic sea surface temperature trends around New Zealand (1981 - 2018). .............. 68
Figure 22. Surface seawater temperature records at Marlborough Sounds salmon farms (2018-
2019). .................................................................................................................................................... 68
P a g e 3 | 84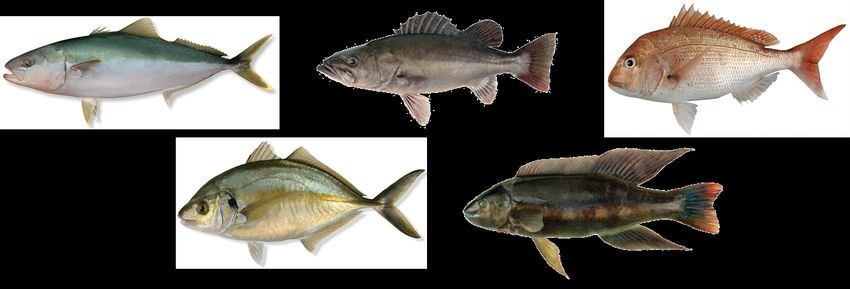
Executive Summary
Purpose
The purpose of this document is to provide information for potential investors and sponsors to make
informed investment decisions and to understand Open Ocean Aquaculture (OOA) potential in New
Zealand. It does this by assessing the attractiveness of the proposed investment from different dimensions,
including an overview of the financial feasibility and an assessment of potential direct and in-direct
economic benefits to the New Zealand economy to inform an overall view of the case for investment.
This report includes a financial model and economic analysis that provides projections for an OOA
operation in New Zealand, including investment requirements, establishment timeframes, revenues and
operating costs (including jobs created). The primary focus of the business case is open ocean farming of
finfish with the key species being Chinook (King) Salmon. We have adopted a scenario approach tailored
specifically for New Zealand that leverages sound international understanding and is underpinned by
robust assumptions and commentary. The report also includes a high-level commentary regarding
potential upside from farming other species relevant to the New Zealand context.
Overall Summary
Farmed salmon offers a very compelling environmental and human health story by comparison with
other farming systems in New Zealand. Farmed salmon has a very low carbon footprint, low water use
and low ‘land use’ from input of raw materials compared to all other animal farming systems. Farmed
salmon are a very healthy choice for consumers offering significant health benefits over other animal
protein sources. These two factors mean that there is and will continue to be a growing demand for
farmed raised salmon for the foreseeable future.
Moving offshore is essential for the growth of the industry as this enables the capitalisation of
opportunities associated with the open ocean environment. RAS systems are unlikely to be an effective
solution in New Zealand as the cost of the systems will be high, and one of the offsetting costs is by
locating these systems close to the market to reduce costs and time associated with moving fish to the
end customer.
Growing fish in OOA systems is likely to have a significant payback in terms of fish health benefits
(mostly associated with low temperature rearing), as well as creating greater scale in the sector. This type
of approach would allow New Zealand to continue to claim more ‘natural’ farming rather than very high
density on-land RAS systems, providing an advantage in competitive international markets.
Technologies being investigated include semi-closed systems to increase production in the existing
sheltered coastal ribbon, land-based systems using RAS technology and offshore systems that can exploit
much more energetic open ocean locations.
There are two main categories for offshore technologies. The first is more robust ‘existing’ net pen
technology that can withstand greater wave action (up to Hs 6.0m). This type of system requires some
shelter from genuine open ocean conditions and is still exposed to the same fish health challenges that
farms in more sheltered locations experience. However, the capital cost is not excessive compared to
existing technologies and the farmer benefits from economies of scale because each site is larger.
Second, the capital cost of emerging technologies that can operate in more exposed locations is much
higher. For these to be successful they must offer a ‘health benefit’ that will offset the additional capital
and operating costs associated with moving offshore. The economic performance of emerging
technologies is not yet established. In parallel to the development of offshore technologies is the
development of on land RAS production systems and coastal ribbon semi-closed systems. These systems
may be used to reduce the production time in existing farms and/or to grow fish through to harvest size.
Semi-closed systems will have lower capital costs than offshore systems and RAS systems. They will have
higher operating costs (especially energy costs and waste treatment costs) than traditional cage systems.
But they will offer a significant health benefit for the fish that may off-set these costs.

                                                                                          P a g e 4 | 84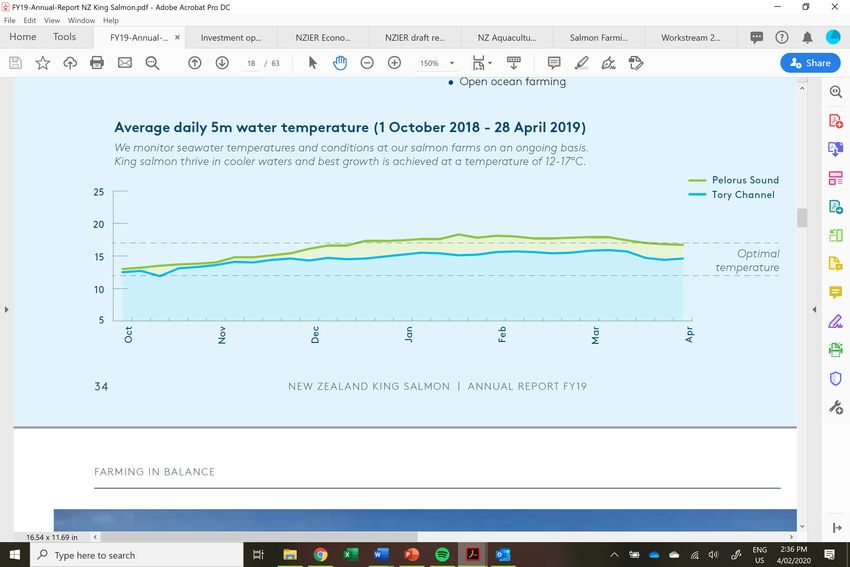
The future for salmon farming is bright. Consumer demand for the product is high and the environmental
case is strong. Farming systems need to change to accommodate the increasing demand as existing
coastal water space is at or near capacity. It is likely that there will be a mix of the traditional (existing)
farming systems, more exposed systems using more robust existing technology, genuine offshore farming
technologies, semi-closed farming systems and RAS systems. At this stage what will emerge as the
dominant production technology for the next 20 years is not clear. Over the next 5 years there will be
significant progress made in all these different systems and much more robust information to determine
what the shape of the industry will be.
New Zealand’s competitive advantage is its natural marine environment. New Zealand is geographically
isolated from the large salmon markets, so RAS systems will be a less attractive proposition in this region
(unless it is to support more traditional farming systems by reducing the ‘at sea’ growing time). To take
advantage of the marine environment, developing offshore technologies with more robust existing
technology and with genuine offshore technology will be important and should get significant focus. This
focus should address the technologies that are best suited in the New Zealand context and the regulatory
framework to support the industry in these new farming areas.
The main conclusions from this work include:
     •   There is a severe shortage of salmon smolt and other finfish production facilities (lack of
         hatcheries for all species in general) in New Zealand; an increase to 264m smolt per annum is
         required to meet each additional 10,000t of production.
     •   Much of the equipment used for OOA is not currently made or available in New Zealand.
     •   There is no barrier to applying feed delivery systems to offshore farms.
     •   The technology used for growing smolts in New Zealand is old and inefficient (not state of the
         art). New (RAS) technology is available and widely used in the salmon farming industry overseas
         and would be suitable in the New Zealand context.
     •   There are limited locations in New Zealand’s marine environment to establish new salmon
         farms, however Southland and Cook Strait are the most promising locations for future salmon
         OOA. The Ports of Bluff, Nelson and Picton are well suited to establishing a salmon farming and
         processing base to service OOA farms.
     •   The allocation of water space for salmon farming in the open ocean environment is an urgent
         pre-requisite.
     •   OOA, if developed in New Zealand, and particularly for salmon, in the South Island, would be
         profitable and of substantive regional economic benefit to the country.

Financial and Economic Summary
Financials
To calculate the cost of developing an OOA farm, NZTE assumed that each consent application, and
subsequent development, will be undertaken to grow 10,000t of Chinook Salmon. It is assumed that the
OOA farms developed will be completely independent of each other and will not rely on any existing
aquaculture infrastructure that is privately owned. Each 10,000t operation requires approximately $188m
of capex to set-up and the annual operating cost when fully operational equates to $124m excluding
additional processing costs from transitioning into high value products. The annual revenue from such an
operation is estimated to be $181m per annum when fully established.
The base case assumptions conservative resulted in an IRR of 12% and a payback period of 17 years.
When more aggressive assumptions were applied (such as increased sale price growth) the IRR increased
to 19% with a pay-back period of 14 years. The investment metrics and analysis, despite being at a high
level, does suggest that open ocean aquaculture is a commercial opportunity that the private sector may
be interested in. It is likely that the biggest commercial hurdle is the time it takes to set-up an open ocean
operation. From the date of first investment it is estimated that it will take approximately 9 years before
any revenue is generated and that is dependent on various assumptions that are highly unpredictable. As

                                                                                           P a g e 5 | 84
such, the risk profile associated with such an investment is very high. The financial analysis undertaken
considered the performance of one consent application and the performance of multiple consent
applications (which generated a view of the potential industry).
Economics
Using the base assumptions, the OOA industry will deliver a positive net position under low discount
rates (up to 6%) with the net benefit position being $242m over 30 years. This is equal to an annual gain
of $8.1m. The export revenue is substantial, with a present value of $8bn. The value of the employment
benefit is estimated at $355m over 30 years. The Present Value of the costs (both capex and opex), is
estimated at $8.1bn with the opex component accounting for 88% of the costs. Overall, establishing the
OOA industry is expected to deliver benefits outweighing the costs, returning a Cost Benefit Ratio (CBR)
of 1.03.
At the peak of the construction phase, the OOA will support over 3,900 construction jobs throughout
New Zealand. The construction and set-up phase span several decades, ramping up from year five, with
intermittent peaks every two/three years. It then tapers off after 2040. In contrast, the jobs supported by
the ongoing activity, start in the second decade, increasing to 58,300 once operating at full capacity.

                                                                                        P a g e 6 | 84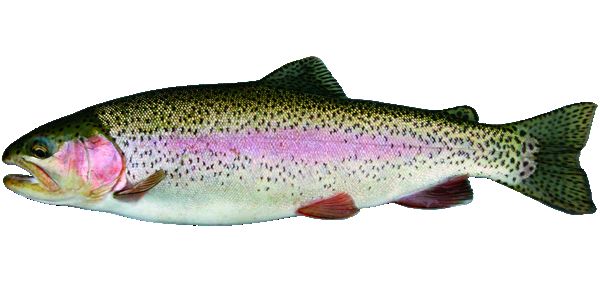
1 Introduction
1.1 Purpose of the Document
The purpose of this document is to provide information for potential investors and sponsors to make
informed investment decisions and to understand OOA’s potential in New Zealand. It does this by
assessing the attractiveness of the proposed investment from different dimensions, including an overview
of the financial feasibility and an assessment of potential direct and in-direct economic benefits to the
New Zealand economy to inform an overall view of the case for investment.
For this report we have adopted a definition of OOA provided by NZTE: “areas requiring upgraded
technology (i.e. where the existing inshore or semi-exposed infrastructure becomes unsuitable)” as well
as “the transfer between legislative boundaries (i.e. territorial sea / Exclusive Economic Zone)” or, “the
next big step”1.
The intended audience for this report is New Zealand Trade and Enterprise (NZTE), the Ministry for
Primary Industries (MPI), and commercial entities looking to explore OOA opportunities in New
Zealand.
The document is structured to answer the following:
       •    What will future industry demand be for seafood produced in the open ocean? (Strategic Case)
       •    What are the pre-requisites and assumptions for open ocean aquaculture to occur in New
            Zealand? (Functional Requirements)
       •    Is open ocean aquaculture financially feasible in New Zealand? (The Financial Case)
       •    What are the expected economic costs and benefits? (The Economic Case)

This report includes a financial model and economic analysis that provides projections for an OOA
operation in New Zealand, including investment requirements, establishment timeframes, revenues and
operating costs (including jobs created). The primary focus of the business case is open ocean farming of
finfish with the key species being Chinook (King) Salmon. We have adopted a scenario approach tailored
specifically for New Zealand that leverages sound international understanding and is underpinned by
robust assumptions and commentary. The report also includes a high-level commentary regarding
potential upside from farming other species relevant to the New Zealand context.

1.2 Background
NZTE is seeking to understand the potential direct and indirect economic impact of the open ocean
aquaculture industry in New Zealand, and its implications for potential investment. OOA is new to New
Zealand and although the topic has been discussed at a high level by the aquaculture industry over
recent years, there has been little work done attempting to quantify the potential benefits to New
Zealand’s economy2.
This business case provides a financial and economic analysis of a hypothetical OOA sector located in
New Zealand waters, and serves to provide expert advice to government and potential investors of the
scale and key considerations that need to be taken into account when planning for a new offshore
industry.

1
    Definitions provided by NZTE following consultation with Cawthron Institute.
2
    Based on relevant grey literature and personal communications with NZTE and MPI.

                                                                                        P a g e 7 | 84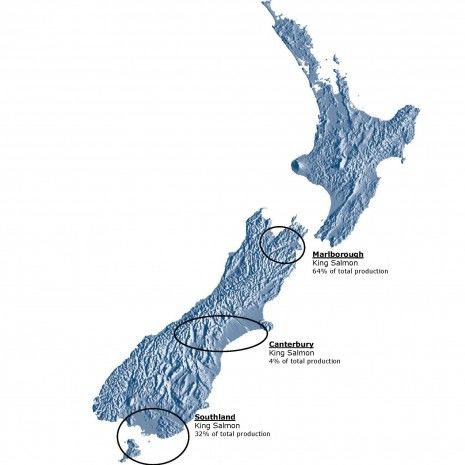
1.3 Strategic Case for OOA in New Zealand
1.3.1 Global Food Demand
As the global population increases and becomes more affluent, a large middle-class is emerging in
countries like China and India. It is estimated that by 2030 Asia will represent 66% of the global middle-
class population and 59% of middle-class consumption3. Increasing consumer awareness and
connectivity to markets combined with greater middle-class wealth is driving demand for higher quality,
healthy and sustainably produced food with a small environmental footprint. By 2027, per capita fish
consumption is estimated to be 21.3 kg; an increase from 20.8kg in 20184 (see Figure 1). This is
equivalent to another 23 million tonnes of seafood supply, much of which will come from aquaculture.

Figure 1. Fish consumption per continent 2019E (left). Development of global average
fish consumption (right).
Source: The State of World Fisheries and Aquaculture OECD-FAO (2018).

Figure 2. Estimated growth of aquaculture relative to wild caught seafood.

1.3.2 Premium Market Positioning of Salmon
Improved marine farming and feeding technology have seen the rapid expansion of profitable salmon
farming on a global scale. The industry is now well respected for providing jobs in rural and coastal
communities as well as a reliable source of high-quality seafood. The expansion of salmon farming
internationally has been supported by a stable supply of salmon smolts, improved salmon nutrition and
better fish health. Growing demand (driven by health-conscious consumers) in foreign markets (Asia in

3
    http://oecdobserver.org/news/fullstory.php/aid/3681/An_emerging_middle_class.html
4
    FAO (2018); The State of World Fisheries and Aquaculture OECD-FAO (2018) Agricultural Outlook 2018-2027

                                                                                                     P a g e 8 | 84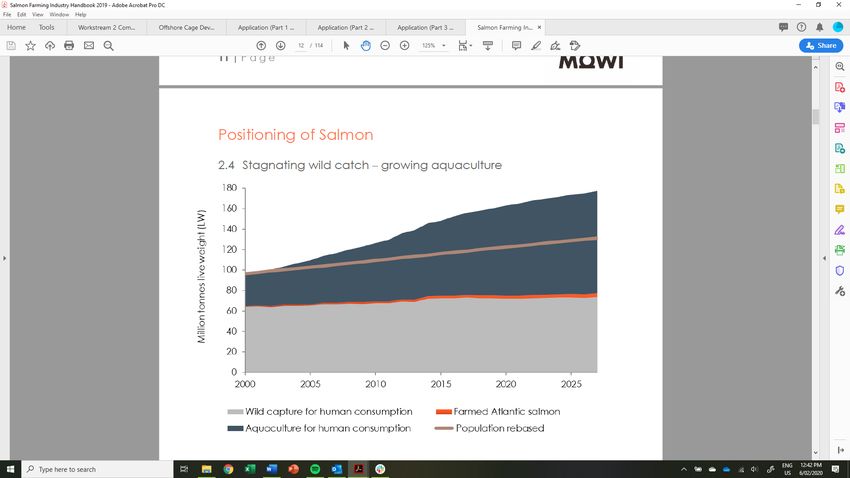
particular) for high quality farmed salmon from New Zealand is currently outpacing our ability to supply
product; local producers are no longer fully capable of servicing these markets.
The complex regulatory situation for sea cage farming has led to limited inshore water space consented
for salmon farming activity in New Zealand. An acute shortage of hatchery produced juvenile salmon
smolts and other finfish has historically been a significant constraint to the growth of the sector here. The
industry in New Zealand is seeking to expand to take advantage of favourable prices and consistent
market demand. On the supply side, a key competitive advantage for New Zealand producers is that few
other places in the world produce Chinook Salmon; Chinook Salmon sells for a premium (compared with
Atlantic Salmon) on global markets. In New Zealand, Chinook Salmon is primarily farmed in the marine
environment in Marlborough, Southland and Akaroa Harbour. However, freshwater operations in
Canterbury, Otago and Tasman utilise ponds, raceways and hydro canals for grow-out operations.

1.3.3 The New Zealand Aquaculture Strategy
The New Zealand Aquaculture Strategy5 (the Strategy) published in September 2019 outlines a work
programme over the next five years to enable the sector to reach the ambitious sales target of $3b per
annum by 2035. Currently, the sector as a whole (including shellfish production) achieves $670m in
annual sales despite having a strong year on year track record for growth. In order to expand the sector
by another $2.4b by 2035, the Strategy identifies three key drivers that will enhance growth:
       1. Maximising the value of existing farms through innovation.
       2. Extending into high value land-based aquaculture.
       3. Extending aquaculture into the open ocean.

Transformational change must occur within the sector if these drivers are to facilitate growth, this will
include (but is not limited to) overcoming significant technological hurdles (especially to enable OOA),
additional investment in R&D and commercialisation of the outputs of the R&D, building resilience to
climate change, creating additional scale, a review of the regulatory environment, and locating new
sources of investment.
Although growth is central to the Strategy, it also recognises aquaculture’s benefit to the country as a
primary sector with the potential to deliver high quality seafood products with relatively low
environmental impact. The sustainability narrative applies to every aspect of the aquaculture value chain,
and this is reflected strongly in the Strategy. It seeks to reduce the impacts of aquaculture on the
environment while also reducing the industry’s waste and emissions. New Zealand’s well-managed
aquaculture industry that incorporates strong sustainability elements is also highly aligned with the
United Nations Sustainable Development Goals6, and in particular, Goal 14: ‘Life Below Water’, which
seeks to “conserve and sustainably use the oceans, seas and marine resources”7. Aquaculture’s
contribution to the economy depends on continued access to the marine environment, on the area
allocated to marine farming production, the ability to add value through higher return species, and
market demand. Considering that the social license for undertaking marine finfish farming in the
nearshore coastal waters around New Zealand is near capacity, the future of fish farming in New Zealand
waters is increasingly looking to be either in the open ocean or on land.

         “The growth pathway also sets objectives of a sustainable, resilient and inclusive aquaculture
       industry. This means aquaculture will lead in environmental practices across the value chain; be
          strong and protected from external risks of pests, disease and climate change; and work in
       collaboration with Māori and communities to realise meaningful jobs, wellbeing and prosperity”
                                         – Hon. Stuart Nash, Minister of Fisheries.

5
    https://www.mpi.govt.nz/dmsdocument/15895-the-governments-aquaculture-strategy-to-2025
6
    https://www.un.org/sustainabledevelopment/sustainable-development-goals/
7
    https://www.un.org/sustainabledevelopment/oceans/

                                                                                             P a g e 9 | 84
1.3.4 Open Ocean Aquaculture Solution?
Open ocean aquaculture has great potential to contribute to food security, livelihoods (both in the
regions and main centres) and the economic growth of New Zealand. However, this growth needs to
happen in a sustainable manner with minimal to no impact upon natural ecosystems, whilst maintaining
a low emissions profile and providing new economic opportunities for Māori. New Zealand’s experience
with salmon farming, combined with our solid reputation for high quality products, and suitable oceanic
environment provides a strong platform for the country to become a global leader in open ocean
aquaculture. Significant local expertise and the presence of a mature inshore (and canal-based) salmon
farming industry should provide confidence to potential investors that open ocean aquaculture is
possible.
Developing an open ocean farming industry will, however, require a degree of tolerance by regulators
and investors for uncertainty and adaptation, both around the production aspects, as well as the potential
impacts upon the offshore marine ecosystem. Since this industry is a new frontier for New Zealand’s
marine farming sector, there is little in the way of direct comparisons. Therefore, it is important that we
leverage international understandings and technologies to enable the development of a new open ocean
aquaculture sector in New Zealand.
1.4 Current International Aquaculture Context
1.4.1 International Trends
This overview summarises the trends in international aquaculture with respect to exploiting more
exposed farm locations with a focus on the costs of infrastructure options and the drivers associated with
the economic viability of such investments. This section largely focuses on the Norwegian experience
(but should be interpreted as the same for other parts of the world) for several reasons:
• Most innovation is occurring in the Norwegian salmon farming industry. This is because of the
ownership structure of the industry, and the proactive regulatory framework that has been
adopted to support offshore innovation.
• The scale of the industry in Norway.
• The current challenges associated with traditional net pen farming in this region (e.g. sea lice
issues and lack of inshore farming space – these issues apply across the Northern Hemisphere
and in South America).
• Norway’s salmon farming experience largely reflects that of the rest of the world.
Industry Structure
Ownership of much of the Northern Hemisphere salmon farming industry is based in Norway.
Innovations in farming technologies are highly transferrable. Management control and technical expertise
is more accessible in Norway because the head office functions are located in this region.
Norwegian Industry Scale
The industry in Norway is significantly larger than other regions of the world (see table below). The scale
of the industry means that there is a large service sector, and this enhances and supports innovation.
Approximate production of (marine) salmonids from main salmon and trout producing countries.
Country Marine Salmonid Production (2018, tonnes)
Norway 1,100,000
Chile 843,000
Scotland 155,000
Canada 123,000
Faroe Islands 77,000
Australia 48,000
USA 23,000
P a g e 10 | 84Iceland 19,000
Ireland 14,000
New Zealand 10,000
Regulatory Support
The Government of Norway has developed a supportive regulatory framework to encourage innovation.
Licenses have been granted that require the holder to invest in innovative technologies (innovation
licences are granted for open ocean aquaculture and must be based on the implementation of new
technology). These licenses are issued with a very low cost and allow the holder additional productive
capacity.
Production Challenges
Fish health status has deteriorated, and survival rates have declined in the salmon industry in Norway
(where the vast majority of production occurs) as well as other key salmon producing countries like
Scotland and Canada. The main driver of poorer fish health is sea lice either directly from the sea lice
themselves, or as a result of multiple treatments using chemical and physical removal methods when
treating the fish. There is also concern that, especially with respect to sea lice, that farms are negatively
The New Zealand Context
In New Zealand there is no sea lice issue with farmed salmon in the coastal environment. This is because sea
lice occur in lower abundances, and because chinook salmon are naturally resistant to sea lice.
Sea lice is therefore not a reason to prevent growth here. The main issues preventing growth in New Zealand are
seabed impacts being perceived as higher than ideal, negative visual impacts on areas with high or outstanding
natural character, and competition for coastal space with other users (e.g. recreational, fisheries etc.).
Shifting to OOA in New Zealand would likely offer a significant health premium for fish (lower temperature
farming, less health issues (unrelated to sea lice)) and therefore better survival, faster growth and lower food
conversion rates.
impacting wild stocks. Sea lice from farms ‘infect’ wild salmon and reduce their survival.
Sea lice control has become a major regulatory requirement. The regulator has responded by reducing
the growth rate of the industry (i.e. cutting production and / or not allowing increases in production) until
sea lice control and fish health status are improved. This has resulted in a stagnation in the growth of
production in Norway. Prices for salmon have increased on the back of increasing demand and flat
production. Profitability in the sector is high and farmers want to take advantage of the higher prices and
increase production.
Production Objectives
Norway has a strong desire to increase the production of salmon in their EEZ. A total production of 5
million tonnes per year by 2050 has been suggested. This is a four-fold increase from the current levels.
In Scotland there is also a strong desire for growth; the industry has developed a plan to double the value
of the aquaculture sector from 2016 levels by 2030. Industry, regulators and other stakeholders all
recognise that to achieve these levels of production there will need to be new technological solutions to
address environmental, fish health and social challenges associated with salmon farming.
P a g e 11 | 841.4.2 Cost Trends
The cost of growing salmon in Norway
has increased significantly over the last
7 or 8 years (see Figure 3). This is due
to changes in exchange rates and to
more challenging farming conditions –
particularly fish health challenges
related to sea lice control.
Since 2012 the exchange rate has
changed from approximately
6NOK:1US$ to 8NOK:1US$. This is
33% depreciation in the Norwegian
currency. This would affect some
Figure 3. Norwegian Cost of Production Trend 2012 to 2018.
input costs – especially feed
ingredients.
As feed contributes approximately 50%-65% of the production cost it is reasonable to assume that about
5NOK of the increased cost of production can be attributed to currency changes. The rest of the cost
increase (approximately 14NOK/kg) can be attributed to genuine cost increases associated with the
farming process. These have come primarily from farmers attempts to either directly control sea lice
numbers on their stock to ensure regulatory compliance or from mortality associated with fish health
treatments. Also associated with the sea lice control issue is the early harvest of fish at sub-optimal sizes.
If sea lice numbers are too high operators will sometimes elect to harvest fish early. This means that there
is less biomass harvested from the farm than planned and this increases the cost of production as fixed
costs (especially capital) are not diluted by the anticipated volume of harvest biomass.
Despite these cost challenges, profits in salmon farming are increasing internationally as there has been
very limited supply growth, while demand is increasing for the product. So, farmers have been able to
increase the sales price by more than costs have increased.
It is the increasing cost of production associated with traditional net pens that has created the opportunity
to invest in more expensive farming solutions (e.g. OOA) that will address fish health challenges,
improve survival and allow savings in ‘per unit’ costs (as there will be less units to be managed).
OOA is seen as a way to farm in areas where there are less fish and fewer sea lice, and therefore
improved fish health. This is not yet proven but is one of the key assumptions behind the transition to
open ocean farming in Norway.
1.4.3 Innovating for Growth
The current industry model is to grow juvenile fish in land based freshwater facilities to an average
transfer weight of 80 to 150g and then to move the fish to traditional net pens. Currently most farms are
in the sheltered coastal ribbon. Sites have a reasonable to high amount of protection from wave action by
being placed in the lee of islands or headlands from the prevailing wind direction or by being placed in
sheltered fjords or bays. This has proven to be a very effective way to grow salmon to market size with a
small environmental footprint and, especially in recent years, very good economic returns.
However, these areas are limited and there have been increasing issues with fish health and with
interactions with wild salmonids (as discussed in 1.4.1) that are preventing significant additional
increases in production using this model. To increase production, farming companies have a range of
options:
1. Move to more exposed and energetic sites that are expected to allow the environment to more
effectively absorb the additional nutrients from the farm system, allow more fish to be reared in a
single location (economies of scale) and avoid sea lice (and therefore improve fish health) by
being established away from salmon migratory routes.
P a g e 12 | 842. Invest in land-based systems to grow fish to a larger transfer size. If larger smolt are transferred to
sea this will reduce the time at sea and reduce the exposure of the fish to fish health challenges
that have emerged. More importantly, from a production point of view, it will allow existing
marine farms to produce more biomass per year. The current farming cycle is approximately 18
to 22 months followed by a 2-month fallow period. If the growing time is reduced to 10 to 14
months with a 2-month fallow period, then the annual production8 from existing locations will
be increased by up to 33%.
3. Invest in land-based systems to grow fish to market size. The technology to do this is not yet
proven to be economic. Despite this, there is a massive investment currently underway (in
Norway and the United States in particular) in 100% land-based production recirculation
aquaculture systems (RAS) by new entrants and by incumbent farming companies (see 4.2.1).
4. Increase the productive capacity of existing farms in the coastal ribbon. By moving to semi-
closed farming systems for part or all of the production cycle it may be possible to grow fish in a
protected environment, eliminate sea lice issues that are prevalent in the Northern Atlantic and
improve fish health by requiring less interventions and by improving the water quality of the
system. This will lead to increased survival and reduced feed requirements. Additionally, the
majority of the solid waste (faeces, waste feed, net biofouling material) could be removed from
the water and disposed of on-land as fertiliser or utilised for energy production in anaerobic
digesters.
8
The annual site productive capacity can be determined by the biomass of fish harvested divided by 2 years.
P a g e 13 | 842 Financial Model & Scenario Analysis
2.1 Key Findings
2.1.1 Operation Size
To calculate the cost of developing an OOA farm, a series of assumptions was agreed with NZTE and
MPI (Appendix One contains the full set of assumptions):
• Each consent application, and subsequent development, will be undertaken to grow 10,000t of
Chinook Salmon.
• The OOA farms developed will be completely independent of each other and will not rely on
any existing aquaculture infrastructure that is privately owned.
Given the industry is non-existent in New Zealand at the moment (in the open ocean) the cost
information has been calculated based on comparable local market data and comparable operations
internationally. However, it is noted that OOA is a relatively new idea and market data is very difficult to
find. As such, the input assumptions have required professional judgement in many instances.
2.1.2 Cost of Development
For each 10,000t consent application, NZ$187.5m of capex (in real dollars) is required, which includes:
• $2.5m on consenting;
• $25m hatchery;
• $160m open ocean operation (including processing infrastructure).
2.1.3 Return on Investment
The base case assumptions suggest an Internal Rate of Return of 12% and a payback period of 17 years
(17 years to recover the capital outlay). This assumes all operational equipment needs to be purchased
(including the hatchery) and no economies of scale. Given the concentrated aquaculture industry in New
Zealand, it is likely that an investor would have existing operations and would benefit from economies of
scale. Scenario analysis suggests that the IRR could increase to 19% however this is perceived as an
aggressive scenario. The most apparent commercial risk is the time delay between applying for a consent
and receiving a return. Based on the assumptions applied, it would take 9 years before any revenue
would be generated and 11 years before breaking even, which could be delayed further if there were
unforeseen setbacks.
2.1.4 Industry View
Analysis has been undertaken to understand the potential value of the OOA industry. Assuming 11
consent applications (for 10,000t each) between 2020 and 2040, gross production is expected to reach
110,000t of salmon which equates to $3.4b nominal ($2.0b real) of annual sales by 2049.
2.2 Capital Costs
2.2.1 Overview
The capital costs associated with the development and maintenance of an OOA operations include:
• Consenting – site identification, specification and consent application
• Hatchery development – land, RAS and buildings and plant
• OOA – On-water assets and processing facilities
P a g e 14 | 84Based on a 10,000t operation, the capital cost totals circa $188m (real dollars) which is spent over the
first nine years of the development phase. As shown below, this cost is predominantly in relation to the
OOA assets totalling $160m (real). The cost split is displayed below:
$3 m
$25 m
160
Consent Hatchery OOA assets
Figure 4. Upfront capital cost for 10,000t operation ($ real)
2.2.2 Consenting
The first step for the development of an open ocean aquaculture operation is obtaining resource
consents. This will typically involve three steps:
1. Identifying the site location and undertaking a preliminary assessment
2. Resource consent application
3. Developing design specifications and associated costings
The assumed cost and timeframe associated with a successful consent application is provided in the table
below:
Consent application
Item Years 1 - 5 Years 6+
Total cost of consent application $2.5m $2.0m
Number of years to gain consent 4 years 2 years
Source: Aquaculture Direct Limited and agreed with project team & NZTE/MPI
Assumptions relating to the table above:
• Each consent will last 20 years at which point a new consent application will be made and
granted.
• The cost and timeframe to obtain a consent will reduce from year 6 and beyond. This
assumption was agreed with the project team on the basis that the government will be
encouraged to support the industry and will change consenting processes to encourage
investment by the private sector.
P a g e 15 | 842.2.3 Hatchery
Once the consent is obtained, the development of the hatchery will be initiated. As agreed with NZTE, it
is assumed that the hatchery developed will utilise RAS technology and will have the production
capacity of 2.6m smolts per annum which are required for the production of 10,000t of salmon assuming
a survival rate of 85%. The assumed cost and timeframe associated with the development of the hatchery
is provided in the table below:
Hatchery development
Item Total
Total cost to build hatchery $25m
Number of years to build the hatchery 2 years
Source: Aquaculture Direct Limited.
Assumptions relating to the table above:
• The smolts will be grown to 130 grams in size and that this will take 12 months.
• For the first 2 years of production, the hatchery will operate at half capacity while the systems
and processes are being tested. It is not realistic for the hatchery to operate at full capacity
immediately.
• There is a new hatchery built for each 10,000t consent application. In reality, in a concentrated
industry, the hatchery would likely be expanded to approximately 40,000t before building a new
hatchery on a new site. However, this would depend on the location of the hatchery and the
open ocean sites and biosecurity zooming considerations.
2.2.4 Open Ocean Assets
In parallel to building the hatchery, the OOA assets would also be developed including the open ocean
cages, support vessels and processing infrastructure. The OOA assets are developed over 5 years which
ensures that the operation is at full scale (10,000t) when the hatchery is producing sufficient smolts. The
assumed cost associated with the development of the open ocean assets is provided in the table below:
OOA assets
Item Standard specification High specification
Cage and net fabrication $41m $45m
Ancillary cage equipment $1m $1m
Feed barge $40m $44m
Wellboats $20m $22m
Net cleaning vessels $12m $13m
Service vessels $20m $22m
On-shore feed control centre $6m $7m
Processing plant $20m $22m
P a g e 16 | 84Total cost $160m $176m
Source: Aquaculture Direct Limited
Assumptions relating to the table above:
• The standard specification option is based on current technology that is used in the industry. The
high specification option represents the technological advances that are currently being explored
in the industry which will likely result in more reliable and robust equipment in exposed
environment conditions. Given the uncertainty surrounding technological advances, it has been
assumed that this cost will be 10% higher than standard.
The cost of building and operating in the open ocean is very much unknown. As such, we have provided
scenario analysis to show the impact of fluctuations in these costs.
2.3 Operating Costs
2.3.1 Overview
The operating costs associated with the open ocean hatchery include the following:
• Hatchery – Feed, power and broodstock
• Open ocean farming – Transport on-water, farming and insurance
• Administration – Sales and marketing,
• Processing – Transportation on-land, removing gills and guts
Additional processing costs may then be incurred to transition the salmon into high-value products such
as smoked salmon. When producing 10,000t per annum, the operating cost is $124m per annum which
is split as follows:
$6 m
$29 m
$18 m
$71 m
Hatchery Open ocean farming Administration Processing
Figure 5. Annual operating cost for 10,000t ($ real)
2.3.2 Hatchery
When the hatchery is built and available to use (2 years after obtaining the consent), the hatchery will be
put into operation at half capacity for two years. This will result in the production of 1.3m smolts per
annum. The hatchery will then increase to full capacity of 2.6m smolts per annum.
P a g e 17 | 84The key operating metrics of the hatchery are summarised in the table below:
Hatchery operations
Item Total
Operating cost per annum $2.20 per unit of smolt
Annual production at full capacity 2.6m smolts
Number of years at 50% capacity 2 years
Number of years smolts stay in hatchery 1 year
Source: Aquaculture Direct Limited
Assumptions relating to the table above:
• After the 12-month period in the hatchery, the smolts are assumed to be approximately 130
grams in size and therefore suitable for transitioning into the open ocean.
2.3.3 Open Ocean Operating Cost
After smolts have been in the hatchery for 1 year, they are transported and maintained in the open ocean
for 2 years. Given the large scale and distance of the cages to land, operating in the open ocean can be
expensive. The key operating metrics of the OOA operation are summarised in the table below:
OOA operations
Item Total
Farming cost including insurance $7,124 per gross tonne
Years salmon stay in the open ocean 2 years
Source: Aquaculture Direct Limited.
Assumptions relating to the table above:
• The cost of $7,124 per gross tonne has been calculated based on a total cost of operating
(including smolts) of approximately $78 million for 10,000t per annum. Given we are assuming
that the smolts are grown internally rather than sourcing from a 3rd party, there is a slight saving.
• The farming cost includes transportation to and from the open ocean ages.
• The operating costs is untested in New Zealand therefore this is very difficult to predict. As such,
we have considered the OOA operating cost in the scenario analysis.
2.3.4 Administration and Processing
After 2 years in the open ocean, the salmon are retrieved, processed and sold. The facilities required for
processing are built as part of the OOA asset development phase. Throughout the OOA farming and
processing phases, a management and sales and marketing cost is incurred. In addition, cost is incurred
for processing, from whole salmon to gilled and gutted. The table below outlines these costs which are
based on existing operations in New Zealand:
Admin, processing and sales
P a g e 18 | 84Item Total
Sales and marketing $712 per gross tonne p.a.
Management $1,069 per gross tonne p.a.
Transport and processing cost $2,920 per gross tonne
Weight lost during processing 10% of gross weight
Source: Aquaculture Direct Limited
Assumptions relating to the table above:
• The sales and market and management cost are calculated based on 10% and 15% of the
farming cost respectively.
• The transport and processing cost and weight lost during processing assumes salmon being gilled
and gutted.
2.3.5 Sales and Product Mix
NZTE has assumed that the OOA operation will sell the salmon from the factory. As such, the product
mix and price reflect the wholesale price that would be achieved ex-factory. The two primary categories
for selling are gilled and gutted and smoked. Whilst smoked is a much higher price per kilogram, the
processing cost and weight lost during the smoking process results in a small net gain. Current industry
participants have suggested that the current mix between gilled and gutted and smoked is approximately
70% and 30% respectively, and that the cost and price received will vary depending on end use. The
table below outlines the assumptions applied to calculate the revenue generated:
Assumptions Related to Product mix and sales
Item Allocation Sales price per Processing cost per Lost weight
kilogram ($) kilogram ($)
Smoked salmon 30% 50 12 45%
Gilled and gutted 70% 17 0 0%
Source: Aquaculture Direct Limited.
Assumptions relating to the table above:
• After allowing for the weight lost from processing and based on the allocation of 30% to smoked
salmon and the balance sold as gilled and gutted, the price achieved per gross kilogram (before
processing) is $20 (exclusive of GST) in real dollars.
• The prices above reflect prices observable in today’s market. Over time, industry participants are
predicting that the global demand for aquaculture products such as salmon will continue to be in
excess of supply and as a result, the price should increase. The base case assumption is that the
price will increase with inflation however this is considered conservative. The scenario analysis
considers price growth over-and-above inflation.
2.4 Return on Investment
2.4.1 Cash Flow Forecast
P a g e 19 | 84To understand the cash flows and return on investment metrics, we have developed a 30-year forecast
based on one consent application. The full set of financial statements for the base case can be seen in
Appendix 2, however the table below provides a summary:
Cash flow
forecast
Item Year 1 Year 3 Year 5 Year 7 & Year 9 & Year 11 Year 13 Year 15 Year 17
&2 &4 &6 8 10 & 12 & 14 & 16 & 18
Capex (1) (1) (97) (73) (38) - - - -
Revenue - - - - 215 447 465 483 503
Operating - - - (58) (228) (349) (363) (378) (393)
expenses
Tax - 0 0 17 8 (23) (24) (25) (26)
Working capital - - - 5 (2) (7) (0) (0) (0)
Free cash flow (1) (1) (97) (109) (44) 68 77 80 83
Source: DRAFT NZTE OOA model V0.03.
Notes relating to the table above:
• Between year 1 and year 9, $210m (inflation adjusted) of capital expenditure is required to pay
for the consent, hatchery and OOA assets.
• From year 9 onwards the operation begins to generate revenue however the first two years of
operations are at 50% capacity.
• From year 11 onwards, the OOA operation generates 10,000t of salmon (gross) and the
profitability is achieved from this point onwards.
2.4.2 Internal Rate of Return
To calculate the return and compare scenarios, the Internal Rate of Return (IRR) has been calculated.
Based on the various assumptions applied (see Appendix One for a full list of assumptions) the IRR is
12% for the base case. The IRR has been calculated based on one 10,000t operation that does not
benefit from economies of scale or leveraging off existing infrastructure. In reality, parties that are most
likely to invest in OOA are existing operators and it is probable that some economies of scale would be
achieved or that consent applications are for more than 10,000 tonnes which would reduce the consent
cost per unit of production.
2.5 Scenario Analysis
2.5.1 Scenarios Considered
To understand the impact of changes to assumptions which are inheritably very unpredictable in this
industry, the following scenarios have been considered:
• Scenario 1: Sales price growth of 1% per annum over years 1-10 (in addition to inflation).
• Scenario 2: 50% of sales is smoked salmon and the remaining 50% is gilled and gutted.
• Scenario 3: Consent timeframe after year 6 is 4 years.
• Scenario 4: 5% lower capital and operating costs for OOA.
• Scenario 5: 10% lower capital and operating costs for OOA.
P a g e 20 | 84• Scenario 6: Combination of Scenario 1, 2 and 5 (note: this is considered aggressive).
The key metrics of each scenario are shown in the table below:
Scenario analysis
Item Upfront capex Internal Rate of Payback period Revenue per kg
Return
Base case $210m 12% 17 years $20
Scenario 1 $210m 16% 15 years $22
Scenario 2 $210m 14% 16 years $22
Scenario 3 $210m 12% 17 years $20
Scenario 4 $201m 13% 16 years $20
Scenario 5 $192m 14% 15 years $20
Scenario 6 $192m 19% 14 years $22
Source: Aquaculture Direct Limited
Notes relating to the table above:
• The upfront capex amount varies between $192m and $210m
• Sales price growth (Scenario 1) has the most material impact, increasing the IRR from 12% to
16%. As noted above, industry experts are expecting some price growth therefore this is not
considered overly aggressive.
• Increasing the proportion of sales of high value outputs from 30% to 50% results in a 2%
increase in the IRR and one year reduction in the pay-back period.
• Scenario 6 is considered aggressive as this combines the reduction in capital and operating costs,
sales price growth and increased proportion of sales to high value products. If these assumptions
are adopted, the IRR increases from 12% to 19% and the payback period reduces from 17 years
to 14 years.
The payback period has been calculated based on cash inflow/outflow after tax.
2.6 Industry View
2.6.1 Overview
Various targets have been set in New Zealand in respect of growing the aquaculture industry. As such,
analysis has been undertaken to consider the potential volume of salmon that could be generated by
OOA and the financial impact that would have on the industry.
2.6.2 Findings
To understand the potential impact, it has been assumed by NZTE for the purposes of the financial and
economic modelling that one consent application will be initiated every 2nd year from 2020 to 2040
(inclusive) resulting in 11 consent applications. Each consent application will result in the development
of an OOA operation capable of delivering 10,000t of salmon per annum. The outcome of this is:
• In the year ended 30 June 2049, gross production is expected to reach 110,000t of salmon
which equates to $3.4b nominal ($2.0b real) of sales annually.
P a g e 21 | 84• The forecast EBITDA of the industry in the year ending 30 June 2049 is $758m nominal ($435m
real).
• To achieve an industry of this size would require capital expenditure of $2.9b nominal ($2.1b
real).
The chart below displays the growth in sales and production volumes over time:
120,000 4,000.0
3,500.0
100,000
3,000.0
Production (tonnes)
80,000
2,500.0
Sales ($m)
60,000 2,000.0
1,500.0
40,000
1,000.0
20,000
500.0
- -
1 3 5 7 9 11 13 15 17 19 21 23 25 27 29
Years
Total gross volume of salmon produced Sales
Figure 6. Industry production and sales - 30-year forecast.
P a g e 22 | 843 Economic Impact Assessment
This section summarises the outcomes of an economic assessment of establishing an open ocean
aquaculture industry in New Zealand. Crucially, the assessment focuses on establishing the industry
using a ‘greenfield approach’ so all the required infrastructure needs to be procured. The assessment uses
several different tools, including:
• Economic impact assessment (EIA), and
• Cost benefit analysis (CBA).
Both tools are linked to a Monte Carlo Simulation (MCS) that randomly adjusts key input parameters
showing the anticipated distribution of outcomes. A positive outcome from using the two approaches is
that a rich and multi-dimensional picture of the potential economic outcomes is presented. Perhaps the
most important aspects include:
1. The CBA sheds light on relationship between costs and benefits,
2. The EIA illustrates how the new activity will flow through the economy, generating Value
Added9 (VA) and jobs.
Crucially, the economic impacts (VA) should not be seen as benefits. Value Added includes items like
salaries and wages. A salary/wage is a gain to the worker but a cost to the company. Further, the initial
capital investment (e.g. constructing a building) generates economic activity and so it delivers a VA
impact. But this capital investment is a cost because a resource is used, and an opportunity cost is
incurred10. Refer to Appendix B of the Economic Report for a full breakdown of the limitations, caveats,
and the key assumptions that have underpinned this analysis.
3.1 Results
This section summarises the results of the assessment and the outcomes of a sensitivity analysis. The
Monte Carlo Simulation is also discussed. The CBA is dealt with first before the EIA results are presented.
Several different discount rates are used to translate future cash flows (positive and negatives) into present
values. Selecting a discount rate is very important because it has a large impact on the results. A high
discount rate reduces the ‘value’ of cashflow (and benefits/costs) that occur in the future. This means that
more weight is placed on the short term. Discounted Cash Flow analysis (DCF) is used to translate future
costs and benefits into a single value, i.e. how much is the future costs/benefits worth today. A discount
rate of 6% is used (together with 4% and 8% to show the range)11. The results for a zero-discount rate is
also included as a benchmark.
3.1.1 Costs and Benefits
The analysis timeframe covers 30 years with the first 10-year period covering the set-up and initial
investment in hatchery cycles. This means that most of the benefits are only expected after the first
decade.
Cost Benefit Analysis Results Summary.
Discount Rates
9
Value Added is similar to GDP but excludes some taxes.
10
The funding cannot be used for another purpose.
11
This is the ‘default’ discount rate used by the Treasury. Source: https://treasury.govt.nz/information-and-services/state-sector-
leadership/guidance/financial-reporting-policies-and-guidance/discount-rates
P a g e 23 | 840% 4% 6% 8% 10%
Exports ($’m) 27,434 11,850 8,008 5,510 3,856
Employment ($’m) 1,120 509 355 252 183
Benefits
SUB-TOTAL ($’m) 28,554 12,359 8,363 5,762 4,039
Capex ($’m) 2,160 1,250 976 775 625
Opex ($’m) 22,856 10,308 7,145 5,054 3,645
Costs
SUB-TOTAL ($m) 25,017 11,557 8,121 5,829 4,270
NET POSITION ($’m) 3,538 802 242 (68) (231)
Costs-Benefits
CBR 1.1 1.07 1.03 0.99 0.95
BENEFIT/LOSS PER YEAR ($’m) 118 26.7 8.1 (2.3) (7.7)
Based on the base assumptions, the OOA industry will deliver a positive net position under low discount
rates (up to 6%) with the net benefit position being $242m (at 6%12) over 30 years. This is equal to an
annual gain of $8.1m. The export revenue (a benefit to New Zealand) is substantial, with a present value
of $8bn (at 6%). The value of the employment benefit (after allowing for opportunity costs and transfer) is
estimated at $355m over 30 years. The present value of the costs, both capex and opex, is estimated at
$8.1bn with the opex component accounting for 88% of the costs. Overall, establishing the OOA
industry is expected to deliver benefits outweighing the costs, returning a Cost Benefit Ratio (CBR) of
1.03. Figure 7 shows the cumulative position of establishing the OOA. Overall, a net positive position
will be reached after 24 years. The breakeven position (not shown in the graph) is reached in year 15.
12
6% is the default rate put forward by NZ Treasury.
P a g e 24 | 84You can also read