Opportunities for the fermentation-based chemical industry An analysis of the market potential and competitiveness of North-West Europe ...
←
→
Page content transcription
If your browser does not render page correctly, please read the page content below
Opportunities for the
                 fermentation-based
                 chemical industry
                 An analysis of the market
                 potential and competitiveness
                 of North-West Europe

September 2014
Preface – The
biotechnology (r)evolution
or the greening of the
chemical value chain
Global competition in the chemical market is which converts carbohydrate raw materials into food,
intensifying. The abundance of shale gas in the US, oil feed, fuel and a variety of functional molecules – the
and gas in the Middle East and coal in China means the “4Fs”–, i.e. chemical building blocks.
European chemical industry is under increasing pressure
to find new ways to create a sustainable competitive While this study shows that biobased chemicals have
advantage. The key lies in innovation and new strategic considerable growth potential in the market, the use of
partnerships, as expressed in numerous publications biomass in the European chemical industry faces several
and discussions. real and perceived hurdles. These hurdles, recently
documented by Cefic and investigated thoroughly by
A golden opportunity exists in the creation of new TNO17 and Nova Institute5, have meant that worldwide
value chains with biobased feedstocks as the starting production capacity for fermentation-based chemicals
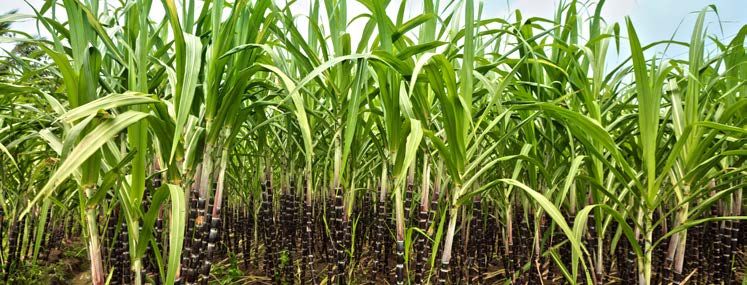
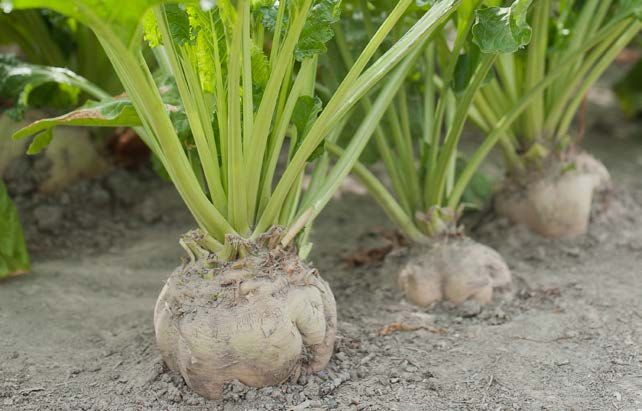
Crops – Beets, point and biorefineries at the core. The industrial shifted to regions outside Europe in the past decade
cane and corn application of biotechnology will not only broaden despite the growth in worldwide demand and the wide
the range of raw materials used as the principal input availability of biotechnological knowhow in Europe.
for chemical production but also generate products As an example, in 2006 a broad group of stakeholders
and materials with new properties and applications. led by Wageningen University and Research Centre
Feedstock – Further developments of processes and technologies (WUR) and Energy Research Centre for the Netherlands
Sugars and are necessary and feasible since biobased feedstocks (ECN)2 documented the broad range of possibilities and
starches differ from fossil feedstocks. The required infrastructure a roadmap for industrial biorefineries. Several years
to bridge the existing gaps between the agricultural later, the World Economic Forum also recognized the
and the chemical industry and business communities, importance in a study on the future of biorefineries19.
Processing
while significant, is manageable. Given the rapid Prof. Johan Sanders captured it well in his recent
Industry –
technological developments and the potential for farewell speech: “the biorefinery is the bridge between
Fermentation
growth, this study intends to show that biobased agriculture and chemistry.”15
feedstocks can help Europe participate in this emerging
segment and gain a competitive edge. Of course, biobased products compete in a world
End-markets and market against fossil-based alternatives produced
applications At the instigation of the Biorenewables Business using a well-established technology and asset base.
Platform (BBP), several stakeholders teamed up to European stakeholders and legislators therefore could
determine the market potential of one of the key help address these and level the playing field if they
processes that make biobased feedstocks ready for use want to benefit from this trend and bring investments
in the chemical industry. That process is fermentation, to Europe.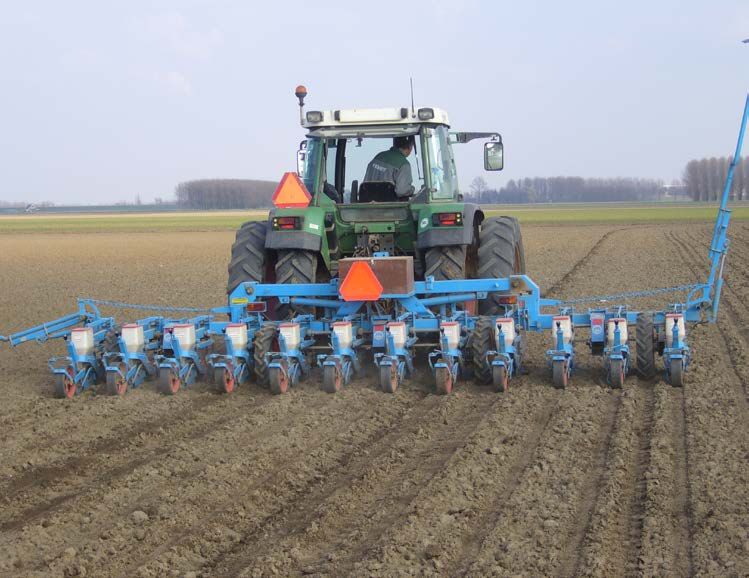
What specifically are the hurdles that need overcoming       The report does seem to come at time of increasing
if Europe is to gain an edge?                                momentum. See for example the recent announcement
First, the ‘preferential treatment’ of the use of biomass    of the European Union and the Biobased Industries
to produce fuel and/or energy, which is not limited to       Consortium to launch a Biobased Industries Joint
Europe, over the use for materials. This not only drives     Undertaking, a new public-private partnership, with
up biomass prices but also puts fossil-based alternatives    € 3.7 billion of funding to realize the potential of this
at an artificial advantage since there are no taxes or       industry in Europe to stimulate sustainable growth and
duties on fossil-based carbon sources for chemicals.         create meaningful jobs.
The heavy tax on conventional fuels increases the
artificial pressure on the use of biomass for fuels even     This study leverages extensive desk research, Deloitte
further.                                                     analysis and interviews with industry experts. The
Second, the lack of industry knowledge, applicable           appendix lists all data sources used and the numerous
policies, in particular the Common Agricultural Policy,      contributors who have generously provided their
insufficient political commitment and uncertainty about      expertise.
the long-term direction, which all affect the investment
climate and investments in Europe.                           Together, the facts, the analysis and the contributors
Third, the perception that European sugar prices are         all speak for a take-off of the fermentation-based
well above world market prices and that European             chemical industry in Europe and with that the
production costs are not competitive.                        continued greening of the chemical value chain.

While not addressing the policy and regulatory issues,
this report does provide a comprehensive, fact-based
perspective on fermentation-based chemicals and
materials and the opportunities they create for the
chemical industry. The report sizes the existing market
for the global fermentation-based industry, zooms in
on products with sufficient market potential for the
chemical industry and provides an economic analysis.
It also includes an assessment on the competitiveness
of North-West Europe from a raw material perspective,
as a place of business compared to the USA, Brazil and
Thailand.

     A new paradigm shift: From feedstock to “beetstock”?

     “An indigenous raw material source for the emerging European fermentation industry is a dream come true.
     Located in the same region as the ARRRA (Antwerp-Rotterdam-Rhine-Ruhr-Area) chemical cluster, it could be the
     catalyst for a paradigm shift and assure a solid foundation for evolutionary developments and synergies. It would
     be a source of inspiration and rejuvenation in the cluster and a timely shot in the arm. My gut feeling is that the
     up to 5 million tons of potential raw materials could attract investments for products and polymers in the order
     of 5 to 10 billion dollars. “Agri meets Chemicals” could be the start of a decades-long intensive collaboration
     between the two sectors, capturing the envisioned opportunities in which forward integration with the Agri
     sector may well play a crucial role.”

     Ton Runneboom, Chairman of the Biorenewables Business Platform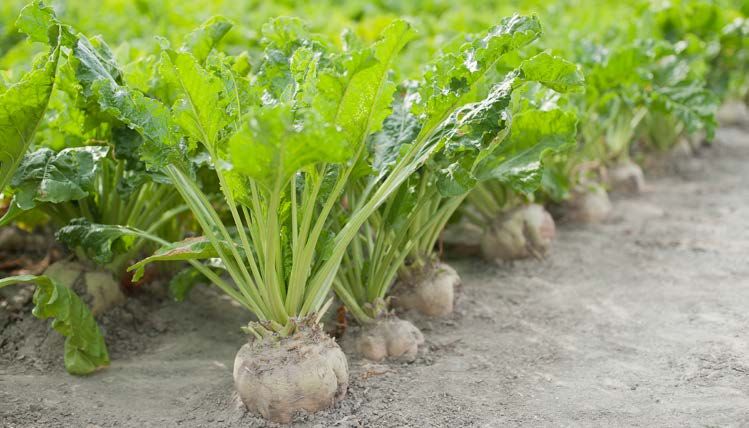
Content

      Executive summary                                                              1

      Opportunities for the fermentation-based chemical industry

          1. Where Agri meets Chemicals: rationale, background and
          		 scope of the study                                                      6

          2. The global fermentation market is valued at 127 bn dollar and
          		 expected to grow above GDP                                             11

          3. The attractiveness of the fermentation-based chemical industry
          		 depends on end-markets and alternative feedstocks price levels as
          		 well as product yields                                                 14

          4. Key feedstocks in the US, Brazil, South-East Asia and North-West
          		 Europe include sugars and starches from cane, beet, tapioca and corn   19

          5. Food, Feed, Fuel and Functional Molecules – What crops are used
          		 for and the way they are processed varies tremendously                 24

          6. North-West Europe can be a competitive location for
          		 fermentation-based processes and business                              28

          7. In a nutshell: A surprisingly positive picture for North-West Europe
          		 and the sugar beet                                                     36

      Contacts                                                                      37

      Appendices                                                                    38
          A. Approach of the study                                                  39
          B. Key fermentation processes and theoretical yield                       40
          C. Definitions of mono- and polysaccharide carbohydrates                  44
          D. Interviewees                                                           46
          E. Steering committee                                                     47
          F. Reference material                                                     48
          G. Abbreviations                                                          50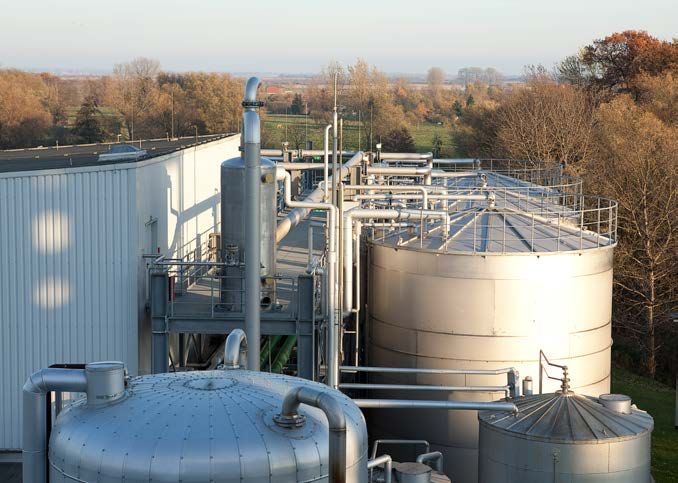
Executive summary

       The European chemical industry is a strong, innovative and important sector in key countries like Germany,
       Belgium and the Netherlands (revenue in the Netherlands 51 billion euros excluding pharma, 8% of GDP in 2013)38.
       However, it has been losing competitive ground recently, mainly due to higher energy prices. Announcements of
       investment in new production facilities are comparatively rare. Clearly, the industry needs to explore new ways to
       create a sustainable competitive advantage.

       Fortunately, a golden opportunity is to be found in increasing the applications of industrial biotechnology and
       biobased feedstock for the fermentation-based chemical industry. This opportunity spans the entire value chain,
       from seed to “drop-in” chemicals and new functional molecules with new properties. Current examples at opposite
       ends of this value chain include the potential of the ‘Energybeet’, developed by the seed producer KWS, and
       the additional properties of Avantium’s technology for producing PEF for Coca Cola’s PlantBottle™ replacing the
       conventional PET bottle.

       In the broader economic context, a remarkable development that has almost escaped notice is the ratio between
       the prices for crude oil and white sugar. Before the turn of the millennium, the ratio between Brent Crude and
       London’s No 5 contract for white sugar, both in US$/GJ, hovered around 7. However, soaring oil prices and low
       sugar prices in 2000 led to the ratio plummeting to about 3. The ratio continues to decline gradually. Given the
       high correlation between raw and white sugar prices, the trend for the main feedstock for fermentation is identical.
       Crops and arable land use for fermentation-based chemicals will remain insignificant compared to food, feed and fuel while
       the added value is high

                   Usage               Food and Feed                         Fuel (Energy)                         Chemicals

       Sources
         Agricultural
                                                                                     0.4
          produce:
                                                 10                                                                                           Fermentation-based
         ~11 bn ton                                                                                                        0.1
                                                                                      0.3                                                          Products
         dry matter
          biomass                                      0.1
         equivalents

            Fossil
           materials
       (coal, oil & gas):
         ~35 bn ton                                                                 33                                 1.5
          dry matter
           biomass
         equivalents

        • All figures are indicative; Biofuel excludes wood; See separate table with detailed figures covering added value, arable land use
       Source: FAO, IEA, EIA, Sanders & Bos (2013), Deloitte Analysis

       Figure 1 – Global fossil and agricultural inputs and usage in 2012 (bn ton dry matter biomass equivalents)

       The fermentation-based chemical industry, while growing, is still small compared to petrochemicals. Oil and gas are
       mainly used for energy and only a small share for chemicals – ca. 4% and another 4% for the energy required to
       make the chemicals.

       The concerns and uncertainties about climate change have produced another relevant development. All major
       global brand-owners of consumer products are pushing harder for sustainability in their product portfolio,
       end-to-end value chains and consumer brand marketing. Given the limited availability of arable and fertile land,
       the use of sugars for fuel and, to some extent, high value-added biobased chemicals and materials using first-
       generation fermentation technology raises additional questions. Figure 1 above and table 1 below attempt to put
       the debate in perspective.

                                                                                                                                                                   1
The potential of fermentation-based chemical products and materials
    The global fermentation-based industry is already worth over 127 billion dollars. It processes up to 200-250 million
    tons of carbohydrate equivalents (CHEQ) annually from either sugars, starches or cellulosic origins, including
    finished products such as production grade white sugar and intermediates such as thick juice and cane juice. By
    far the largest share goes to bioethanol – 94% in terms of volume and 87% in terms of value. However, as table 1
    illustrates, functional molecules (including plastics) provide a much higher economic added value and market
    growth in the biobased chemical segment compared to alcohols and biogas. Also, the added value in relation to
    the use of arable land is very attractive for functional molecules. The projected annual growth until 2020, excluding
    alcohols, is 6.5%, which is well-above projected GDP growth.

     Market overview for key fermentation products in 2013 and annual growth projection until 2020

     Category         Market           Average            Market size       Market         Average         Market          Arable land
                      Size in          theoretical        in carbohy-       size in        added           growth          use*
                      product          yield              drate input       value          value           until 2020
                      output                              required                         generated
                      (quantity                                                            from car-
                      produced)                                                            bohydrate
                      Mln ton          Ton product/ Mln ton                 Bn USD         USD/CHEQ        % CAGR          Mln ha
                                       ton glucose CHEQ
     Alcohols               99.8               0.51             195.1         110.0               164         4.4%            25.08
     Amino                   7.1               0.92                7.8          11.0            1,010         5.6%             1.00
     Acids
     Organic                 2.9               1.05                2.8           3.5              850         8.8%             0.36
     Acids
     Biogas                  0.1               0.27                0.5           0.2                 0        5.0%             0.06
     Polymers                0.2               0.93                0.2           0.6            2,600        13.5%             0.03
     Vitamins                0.2               0.96                0.2           0.7            3,100         2.6%             0.03
     Antibiotics             0.2               1.00                0.2           0.8            3,600         4.0%             0.03
     Industrial              0.1               1.00                0.1           0.3            2,600         8.0%             0.01
     Enzymes
     Total                110.5                                206.8          127.0                           4.6%             26.6
     *Land use estimates vary greatly with the different region and the crop used to produce the sugar,
     current estimates are based on weighted average yields (ton CHEQ / ha) of sugar cane and sugar beet

     Note: Rough-cut added value from carbohydrate obtained by market value – average cost of CHEQ at                   Global Arable
     400 USD per ton and ignoring side-streams, energy, etc.                                                            Land
     Source: BCC Research, FO Licht Renewable Chemicals Database, NOVA Institut, FAO/OECD,                              1,500 mln ha
     Deloitte Analysis

    Table 1 Market overview for key fermentation products

    The key product using fermentation process technology today is bioethanol (included in alcohols in table 1 above).
    This development is driven by the relatively ease with which ethanol can be produced and, more importantly,
    by regional requirements for supplements to fossil fuels for the transportation sector. The latter is stimulated by
    various regulatory measures in the US, Brazil and Europe.

2
Other key fermentation products with sufficient market potential (i.e. excluding bioethanol) equate to roughly 11.6
 million tons of carbohydrate equivalents and have a turnover potential of 17.1 billion dollars (see table 1). These
 include amino acids, organic acids such as lactic and succinic acid, as well as polymers such as xanthan.
   Market studies show a projected base case growth of 5% CAGR with alcohols staying the key segment and polymers
   showing the highest growth

                             Total                                                                    Non-alcohols
                                                                                                                                 6.5%
                             300                                                                      20
                                                     282.6
                                             4.6%                                                                                   0.1   18.1
                                                      18.1                                                                          0.2
                                                                                                                                             0.5        Highest growth in
                             250                                                                                                    0.2 0.7
                                                                                                                                                        polymers and
                                                                                                      15                                                organic acids
Market size (mln ton CHEQ)

                                     206.8
                                                                                                                                                 5.0
                             200      11.6                             Non-Alcohols 6.5%
                                                                                                                     11.6   0.1
                                                                       Alcohols           4.4%
                                                                                                                        0.2 0.2
                                                                                                                   0.5      0.2
                             150                                                                      10
                                                     264.5                                                            2.8
                                                                                                                                                       Ind. enzymes   8.0%
                                                                                                                                                       Antibiotics    4.0%
                             100     195.1
                                                                                                                                             11.4      Vitamins       2.6%
                                                                                                        5
                                                                                                                                                       Polymers       13.5%
                                                                                                                      7.8
                              50                                                                                                                       Biogas         5.0%
                                                                                                                                                       Org. acids     8.8%
                                                                                                                                                       Amino acids    5.6%
                                0                                                                        0
                                     2013            2020                                                            2013                    2020
           Note: 2020 outlook is based on available predictions where possible and extrapolation in case no explicit predictions are available
           Source: BCC Research, FO Licht Renewable Chemicals Database, NOVA Institut, OECD-FAO Agricultural Outlook 2013, Novozyme 2013 Annual report,
                   DSM Factbook 2014, Deloitte Analysis

 Figure 2 – Global fermentation market in 2013 and projection for 2020 (mln ton CHEQ)

 The competitiveness of North-West Europe and sugar beets
 The attractiveness of the fermentation-based chemical industry depends on the price levels of the functional
 molecules as chemical products, including the mainly fossil-based alternatives with which they compete, the yield
 of fermentation processes and the market prices for biobased feedstocks.

 Sugar, a major biobased feedstock, comes either directly from cane or beet or indirectly from corn or tapioca
 starch, and it can be competitive against fossil alternatives for selected high-value-added products. Globally, four
 main regions emerge as attractive locations for fermentation businesses, each with a different feedstock:
 • Brazil, mainly sugar cane
 • US, mainly corn
 • South-East Asia, mainly tapioca/cassava and sugar cane
 • North-West Europe, mainly wheat and sugar beets

 The cost levels to produce sugar in North-West Europe are amongst the lowest in the world due to increasing crop
 and sugar yields in the fields and from production efficiencies. Although weather conditions are also relevant, our
 analysis of the underlying drivers show the relative cost position is likely to improve further in the coming years. The
 global supply-cost curve for the most recent season shows the impact of efficiency improvements.

                                                                                                                                                                             3
In the last season, volumes have been higher than average and the Netherlands has taken the lead in low cost
    sugar production

                                         3.000
                                                        Beet
                                                        Cane

                                         2.500          Global white sugar market price range (2008-2013)
    Production cost (USD / ton w.s.e.)

                                         2.000

                                         1.500                  South/Central Brazil
                                                                       (Cane)
                                                     Netherlands
                                                        (Beets)                                   Germany          France
                                                                             Thailand              (Beets)         (Beets)
                                         1.000                                                                                        India
                                                           UK                 (Cane)
                                                                                                                                     (Cane)
                                                         (Beets)

                                          500

                                           0
                                                 0      10         20   30    40        50   60      70       80        90     100      110       120      130      140      150      160       170
                                                                                                   Volume (mln ton w.s.e.)

                          Note: Production costs of raw sugar converted to w.s.e. multiplying by 1.087 (polarisation constant) and adding refining costs of $65 / ton, raw sugar volume converted
                          to w.s.e. by dividing volume by 1.087; Note 2: Production costs for beet and cane include for both land and factory costs for labour, capital (incl. a.o. land rent and
                          depreciation), input (incl. a.o. seeds, fertilizer, chemicals, and energy), and factory by-product revenue.
                          Source: LMC International Sugar & HFS report 2014, UNICA Harvest Reports 09/10 – 12/13, Deloitte Analysis

    Figure 3 – Global supply curve of sugar 2012/2013 (USD/ton w.s.e)

    Sugar beet from North-West Europe and especially the Netherlands appears to be particularly cost competitive due
    to low inbound and outbound transportation costs, high sugar yields per hectare of land, large-scale facilities and
    the ability to supply ample volumes of thick sugar juice on a year-round basis. Other benefits include access to the
    tightly knit network in the ARRRA region (Antwerp-Rotterdam-Rhine-Ruhr-Area) and the high level of education in
    the cluster in both chemical and agricultural technology.

    Dispelling the myth surrounding European white sugar prices
    A recent EC report on industrial white sugar, as shown in figure 4 below, shines an interesting light on the
    perception that European prices still exceed world market prices:
    • EU prices were higher the world market prices before 2009, leading companies to invest elsewhere
    • EU prices were below London No 5 white sugars between 2009 and 2012
    • EU prices for non-food sugars converged to world market levels in 2013

4
Prices for white and raw sugar have ranged between $350 and $800 per ton over recent years, European industrial
white sugar has been less volatile and converged to world market levels
1,000
800
Spot price (USD/ton)
600
400
Raw sugar price (New York No. 11)
200 White sugar price (London No. 5)
White Sugar (Moving Quarterly average)
European industrial white sugar from sugar producers
Global white sugar market price range (2008-2013)
0
01-01-2008 01-01-2009 01-01-2010 01-01-2011 01-01-2012 01-01-2013 01-01-2014
Source: FO Licht, Deloitte Analysis
Figure 4 – Raw and white sugar prices 2008-2013 (USD/ton)
Furthermore, the EU will be lifting production quotas for food-grade sugar in 2017. Deregulation means the
production volume of sugar beets sales will grow substantially. It also entails production shifts to the most efficient
growing areas in Europe.
Investment hurdles
The preface already referred to some of the hurdles that legislators and other stakeholders need to address to
create a level playing field. The most relevant of these is the set of measures that stimulates the use of biomass
for biofuels. These measures discourage investment in European facilities that produce high value-added biobased
materials because they limit access to biomass for other uses and increase net costs. The unintentional consequence
is the advantage given to fossil-based alternatives. Surveys and analysis by TNO show that this factor and the
insufficient availability of venture capital adversely affect the pilot and commercialisation phases in particular17, 18.
This report shows that it is worthwhile taking on these challenges. The biotechnological (r)evolution has the
potential to stimulate innovation, economic growth and create jobs. Today, the convergence of the chemical and
agricultural eco-system and the biotechnological knowhow in North-West Europe make for a prime location.
Fermentation is where ‘Agri meets Chemicals’.
51. Where Agri meets Chemicals:
rationale, background and scope
of the study
The competitiveness of the fossil-based chemical industry in North-West Europe is increasingly under pressure
because of the US shale gas revolution and high energy prices in Europe. Other global developments, triggered
by megatrends such as urbanization, mobility, the rapidly aging population and work force in Europe and the
rising middle class in the high-growth economies, compound the situation. At the same time, the use of biobased
feedstock – sugar, starch and cellulose – and fermentation process technologies are expanding. Sustainability as
another megatrend is the driver here. This creates new opportunities in Europe due to the intensity of the chemical
and agricultural eco-systems and the body of knowledge on the intersecting boundaries of these two domains. This
is where ‘Agri meets Chemicals’.
In addition, the projection is that biobased feedstock supplies will increase in North-West Europe from 2017
onwards due to de-regulation in the EU resulting from the new common agricultural policy. Europe will be lifting
production and import quota for sugars and iso-glucose, creating a free market and increasing production volumes.
As a result, the EU will have several million tons of additional supplies each year.
Previous studies have investigated the economics of producing specific chemicals via the bio-route, for example,
DOW has explored the specific case of the beet-to-ethanol-to-ethylene pathway under 2011 market conditions1.
However, the competiveness of biobased feedstocks from North-West Europe from the perspective of the chemical
industry is not well understood. Consequently, there is limited insight into the competitiveness of biobased
feedstocks based on sugar beets compared to alternatives such as sugar cane from Brazil, corn (dextrose) from the
US and tapioca (starch) from South-East Asia.
Yet a number of stakeholders have shown a shared interest in receiving fact-based answers to the
following questions:
• What is the supply/demand balance for biobased products and feedstocks (cost-price curves)?
• What are the current and projected availability and prices of major feedstocks in the global market?
• What are the primary fermentation processing options?
• What are the key uncertainties and sensitivities?
• What is the competitive position of North-West Europe in the ARRRA cluster?
“IT meets Telecom” – The case of ICT
It is always hard to predict the future, especially when it comes to the impact of new technologies on industry
sectors. Who could have predicted 25 years ago that IT and Telecommunication would merge to create ICT?
Telecom was firmly analogue and IT was digital. As Rudyard Kipling said about the East and West: “Never
the twain shall meet.” But how fast things have moved since analysts first observed that the Telecom sector
was experimenting with digital technology. They understood that IT and Telecom would soon merge into
something new and amazing. Indeed, the millennial generation is blissfully unaware of life before ICT. As soon
as the markets appreciated what was going on, investment money flowed into new companies that straddled
IT and Telecom. A new industry emerged and some giants in IT and Telecom were sidelined.
Do we have a comparable situation with Agri and Chemicals today?
6First and second generation technology
Fermentation is currently based on processing C6 sugars (C6H12O6) while the commercial processing of C5 sugars
is still in early stages of development. Depending on the crop, sugars can originate directly from the crop itself or
from starch or cellulosic material. Starch and cellulosic material require hydrolysis and enzymes to break the material
down into sugars before the fermentation step, as shown in the figure below. This process is commercially viable
for starches.
Cellulosic material can and will be a source of carbohydrates for chemicals in the future, but is not a commercially
viable process today
Sugar
Sugar cane,
sugar beet
Sugar
production
Starchy crops Starch
(e.g. cassava, Sugars
wheat, corn)
Starch Hydrolysis
production of starch
Fermentation
Commercially viable and
in operation today
The process of converting
Cellulosic cellulosic material is more
residue complex, so it is not yet used
Cellulosic materials on a commercial scale. It will
(wood, paper waste, require continued technological
Hydrolysis
food residue, etc.) of cellulose advancements and reduced
costs to become profitable
Source: Industry expert interviews, Deloitte Analysis
Figure 5 – Production of fermentation inputs from cellulosic material and starches
However, the process of converting cellulosic material is more complex and not yet used on a commercial scale. It
will require continued technological advancements and reduced costs to become profitable. Project Liberty, a JV
of DSM-POET in the US, aims to show the commercial viability of large-scale production of cellulosic bio-ethanol.
The facility opened in September of 2014. The term second generation can be misleading since it applies to
the pre-processing of cellulosic materials to produce sugars. First- and second-generation products both use
fermentation to convert sugars but rather than using the sugars directly from the crops, second generation
products use the “waste” of the crop, i.e. the cellulose.
Of course, the stated ambition of brand-owners and many chemical companies is to drive second or
next-generation technologies based on various types of biomass, even though fermentation-based chemicals
require relatively insignificant amounts of biobased feedstocks compared to fuels. Given the limited and decreasing
availability of arable and fertile land, the effective and efficient use of biomass is rightfully high on the agenda of
the biotechnology industry.
7In light of the current commercial status of and limited data for next-generation fermentation, this study does not
cover cellulosic materials and their processing. A description of the different isomers of sugar, starch and cellulose,
and next generation fermentation using hemicelluloses and C5 sugars is available in the appendix.
Chemicals derived from cane, beet, corn, tapioca, and wheat through fermentation are the primary focus of this study
Cane Beet Cellulose Corn Tapioca Wheat Other Starchy
crops
Sources (crops)
Feedstock Sugars Starches
(sugars and
starches)
Food Catalytic
Processing Fermentation industry
(processing industry) conversion
industry
Micro-
End-markets and Food Pharma Feed Fuel Chemicals Dyes, etc
organisms
applications
Primary focus is chemicals and
Note: Excludes streams of co-products bioethanol (fuel) is secondary
Figure 6 – Fermentation-based chemical value chain – “Agri meets Chemicals”
Natural sources of carbohydrates in the form of sugar or starch fall within the report’s scope when determining
the feedstock market size, but the focus will be on a selected number of feedstocks when determining the
competitiveness of regions and key feedstock crops.
Sugars and starches can be processed in a variety of ways (e.g. fermentation, catalytic conversion) or they can be
used directly for applications in end markets (e.g. ingredients in the food industry). When determining the produced
volumes of biobased feedstock, all uses are taken into account. However, when focusing on the fermentation
industry, only that specific use for fermentation-based chemicals and bioethanol is considered.
Fermentation processes and products are used in a wide range of industries for a variety of applications. When
investigating the total fermentation industry, all end markets (ranging from pharmaceuticals, food, feed, fuel end
chemical building blocks) are taken into account. When determining the competitiveness of regions and feedstock
crops, we focus on supplies to the chemical industry.
8With a significantly higher added value than ethanol, the land use for biobased chemicals is very
small compared to the global land use
Land use ethanol (mln ha)* Added value ethanol (bn USD)
1.5% 2.0% 2.0%
+4% 0% +4% 0%
31 30 146 141
23 108
2013 2020 2030** 2013 2020 2030**
Land use functional molecules (mln ha)* Added value functional molecules (bn USD)
0.1% 0.2% 2.0%
30 241
+29% +29%
+7% +7%
2 2 12 19
2013 2020 2030** 2013 2020 2030**
*** Land use is based on weighed average land use of sugar cane and sugar beet;
*** 2030 target is based on a scenario where 30% of petro chemicals is substituted by agri feedstock; x.x% = Fraction of global
*** Arable land is the land under temporary agricultural crops (multiple-cropped areas are counted only use of arable
once), temporary meadows for mowing or pasture, land under market and kitchen gardens and land land***
temporarily fallow (less than five years). The abandoned land resulting from shifting cultivation is not
included in this category. Data for “Arable land” are not meant to indicate the amount of land that is
potentially cultivable. Data are expressed in 1000 hectares.
Source:BCC Research, FO Licht Renewable Chemicals Database, NOVA Institut, FAO/OECD,
Deloitte Analysis, Rabobank Analysis
Figure 7 – Land use and added value for fuel and functional molecules in 2013, 2020 and 2030 (mln ha and bn USD)
The “4Fs”: Food, Feed, Fuel and Functional Molecules
Development of crops for functional molecules, biomaterials, biochemicals and nutraceuticals is good for society at large. The footprint
of biobased chemicals is lower than that of fossil-based alternatives. Furthermore, it is beneficial for farmers; the higher added value of
chemicals may help to increase farm income per hectare. More income per hectare stimulates agricultural productivity. Underinvestment
due to low margins is the main reason behind the low productivity in many parts of the world. A higher farm income may also revitalize rural
areas and limit the migration of the rural poor to the world’s mega cities.
Arable land is limited; we have on our planet approximately 1,5 billion hectares available. Agriculture can never produce enough biomass
to still the world’s hunger for energy and hence is not the cure for our reliance on oil. The calorific value of current global agricultural
production is less than one third of global energy demand (13 bn ton oil equivalent, IEA 2014), barely enough to satisfy global transport
fuel demand.
However agriculture can easily provide enough feedstock to the chemical industry without jeopardizing food production. Current demand
for petrochemicals is only 300 mln ton per annum. Replacing all petrochemicals would require just 5% of agricultural biomass production
and global arable land. This is about 60 times less than what would be required to replace all fossil energy. Besides, in terms of market value
per ton, chemicals are on average priced 15 times higher than energy.
9Given the ongoing debate about the appropriate use of agricultural products for purposes other than food and
feed, it is helpful to get a balanced perspective on the use of agricultural crops and biomass for biobased chemicals.
Our analysis underscores three main points:
• While the added-value for biobased chemicals is high, crop and land use are very small compared to food, feed
and fuel, and this will remain the case
• The fermentation-based chemical industry, while growing, is very small compared to petrochemicals
• Oil and gas are used mainly for energy; only a small part is used for chemicals – approx. 4% and another 4% for
the energy required to make the chemicals, whereas the total added value for chemicals is comparable
In the broader economic context, there was another highly relevant development during the past two decades.
Oil prices were relatively stable up to 2000, after which they increased dramatically, while white sugar prices were
volatile but increased more gradually. As a result, sugar prices have decreased relative to crude oil in the past fifteen
years, a step change happening around 2000. This has created an opportunity for the biobased economy. The
question is, will the trend continue? Different scenarios are feasible given the uncertainties around climate change
and carbon capture.
In the past fifteen years the sugar price decreased relative to crude oil, creating an opportunity for sugar in the
biobased economy
15
Ratio London #5 (USD/GJ)/Brent Crude
Relatively stable oil prices
against volatile sugar prices
Ratio London #5/Brent crude (USD/GJ/USD/GJ)
12 depending on harvest results
Since 1999, oil prices have
risen at a faster rate than
sugar prices
9
6 Financial crisis
resulting in very
volatile oil prices
3
Lowest sugar price since
1987 against strongly
rising oil prices
0
Jan-86 Jan-88 Jan-90 Jan-92 Jan-94 Jan-96 Jan-98 Jan-00 Jan-02 Jan-04 Jan-06 Jan-08 Jan-10 Jan-12 Jan-14
Figure 8 – Development of price ratio of white sugar over crude oil (monthly averages, USD/GJ/USD/GJ)
Methodology and approach
To assess the competiveness of key feedstock regions and ensure a reasonable level of consensus, the study
applied a four-step approach while engaging different stakeholders and organisations. We carried out desktop
research, analysis, interviews and validation workshops with various subject matter experts between March
and June 2014. The participants and the details of the approach are provided in the appendix.
102. The global fermentation market
is valued at 127 bn dollar and
expected to grow above GDP
Industrial fermentation is a complex, multi-step process that converts sugars, starches and cellulosic material into
food, feed, fuel and other industrial products. The conversion uses enzymes or micro-organisms such as yeasts and
algea, which may be genetically modified, and takes place in bioreactors or fermentors. Subsequent down-stream
processing is typically required to isoloate and purify the target product. C6 sugars can be isolated directly from
some crops such as cane and sugar beets or indirectly from starches in crops such as tapioca, wheat or corn by
using enzymatic hydrolyis as a pre-processing step. However, the isolation of C5 and C6 sugars from cellulosic
materials and the separation from lignine is more complex and requires breakthroughs in pre-treatment and
enzyme technologies.
The Figure 9 below shows that eight product groups are currently produced commercially using a fermentation
process. Several other product groups are in development phases, ranging from analysis to testing. This study
excludes the industrial production of yeast and other micro-organisms.
Currently eight key categories of molecules or compounds are produced commercially and ample opportunities for
future developments exist
Currently commercial fermentation processes
• Ethanol • Citric • Xanthan • Beta-lactam
Alcohols
• Butanol Organic • Lactic • PHA Anti- • Tetracycline
& Polymers
• BDO acids • Succinic biotics • Clavulic
Ketones
• Acetone acid
• MSG • Methane • Vitamin C • Amylase
Amino • Lysine • Vitamin B2 Industrial • Cellulase
Biogas Vitamins
acids • Threonine • Vitamin B12 enzymes • Lipase
• Tryptophan • Protease
Selection of future developments based on current research
(ranging from theoretical research to testing plant phase)*
•Nonane •Butadiene •Histamine •Malonyl -
•Tetra- •Isoprene •Tyramine ACP
Alkanes Olefins Amines Esters
decane •Propene
•Farnesene
•Various •Biodiesel
dyes Microbial
Dyes
(e.g. oils
Indigo)
*Selection based on interviews and in-depth research that showed these products are currently produced on a very small scale,
e.g. farnasene is produced on laboratory scale of appr. 0.04 million tons per year
Note: Yeasts and other microorganisms excluded from the scope of this study
Source: BCC Research, FO Licht Renewable Chemicals Database, Deloitte Analysis
Figure 9 – Fermentation molecules and a selection of representative compounds
Market sizing approach
Fermentation as a process is not commonly described as a separate market. However, to identify key
opportunities for bio-based feedstocks, we identified the key products and processes that are fermentation-
based. For each of these products, their market size in tons of product is known. The theoretical yield of
a product from glucose can be calculated based on the reaction stoichiometry (see appendix). Using this
maximum theoretical yield, the carbohydrate equivalent (CHEQ) has been determined to aggregate results.
Due to the use of the maximum theoretical yield, volumes in CHEQ are likely to be underestimated.
11The total fermentation industry is c. 207 mln ton and is largely driven by volumes in alcohol and to a minor extent in
amino acids and organic acids
210 94.4% 3.8% 1.3% 0.2% 0.1% 0.1% 0.1% 0.0% 100%
206.8
0.2 0.2 0.1
0.5 0.2
205
2.8
Market size (mln ton CHEQ)
200
7.8
Mainly ethanol which can be produced
195.1 from unrefined sources, e.g.
195
• Raw sugar
• 2 nd or 3 rd crush sugar cane juice
• Molasses
• Starch
• Cellulosic residue
0
Alcohols & Amino Organic Biogas Polymers Vitamins Antibiotics Industrial Total
Ketones acids acids enzymes
Source: BCC Research, FO Licht, NOVA Institut, OECD-FAO Agricultural Outlook 2013 , Deloitte Analysis % = percentage of global fermentation market
Figure 10 – Global fermentation market volume in 2013 (mln ton CHEQ)
Figure 11 shows that the market value is 127 billion dollars.
When comparing market value, the relative importance of the smaller volume categories is higher, though
alcohols still dominate the market
130 86.6% 8.6% 2.7% 0.2% 0.4% 0.5% 0.6% 0.3% 100%
0.8 0.3 127.0
0.7
0.2 0.6
125
3.5
120
Market size ( bn USD)
115 11.0
110.0
110
0
Alcohols & Amino Organic Biogas Polymers Vitamins Antibiotics Industrial Total
Ketones acids acids enzymes
Note: prices are average prices price ranges for the different products based on publicly available data
Source: BCC Research, FO Licht, NOVA Institut, OECD-FAO Agricultural Outlook 2013, Deloitte Analysis % = percentage of global fermentation market
Figure 11 – Global fermentation market value in 2013 (bn USD)
12The total volume of products currently being produced commercially is 207 million tons in terms of CHEQ, as shown
in figure 10. Figure 11 shows that the market value is 127 billion dollars. Alcohols and ketones amount to 94,4% of
the total fermentation market in terms of volume. In terms of value in dollars this is 86,6%.
The market is dominated by alcohols, especially ethanol, in terms of volume and market value. The higher market
price and added-value of the other product segments, i.e. non-alcohols, make their share of the value somewhat
higher, 5.6% vs 13.4 %. In volume terms, the fermentation industry, excluding alcohols, requires over 11.6 million
tons of CHEQ to build a market of 17.1 billion dollars. Key products include lysine, MSG and glutamic acid (all
amino acids), citric acid and lactic acid (organic acids), methane (biogas) and xanthan (polymers). Not all product
groups are used in the chemical industry. Some (amino acids, vitamins, antibiotics) are used mostly by the food and
pharmaceutical industry.
The growth outlook for the fermentation market as a whole is driven largely by the expectation of what will
happen to bioethanol, which in turn depends strongly on the blending mandates in the US and the petrol/
bioethanol policies in Brazil. Growth in the non-alcohols is expected to hit 6.5% annually until 2020, but key
uncertainties in technological advancement and the market acceptance of biobased fermentation products exist.
The largest growth is expected in polymers and organic acids.
Market studies show a projected base case growth of 5% CAGR with alcohols staying the key segment and
polymers showing the highest growth
Total Non-alcohols
6.5%
300 20
282.6
4.6% 0.1 18.1
18.1 0.2
0.5 Highest growth
250 0.2 0.7
in polymers and
15 organic acids
Market size (mln ton CHEQ)
206.8
5.0
200 11.6 Non-Alcohols 6.5%
11.6 0.1
Alcohols 4.4%
0.2 0.2
0.5 0.2
150 10
264.5 2.8
Ind. enzymes 8.0%
Antibiotics 4.0%
100 195.1
11.4 Vitamins 2.6%
5 Polymers 13.5%
7.8
50 Biogas 5.0%
Org. acids 8.8%
Amino acids 5.6%
0 0
2013 2020 2013 2020
Note: 2020 outlook is based on available predictions where possible and extrapolation in case no explicit predictions are available
Source: BCC Research, FO Licht Renewable Chemicals Database, NOVA Institut, OECD-FAO Agricultural Outlook 2013, Novozyme 2013 Annual report,
DSM Factbook 2014, Deloitte Analysis
Figure 12 – Global fermentation market growth in 2013-2020 (mln ton CHEQ)
133. The attractiveness of the fermentation-
based chemical industry depends on
end-markets and alternative feedstocks
price levels as well as product yields
To evaluate the attractiveness of biobased feedstocks and the fermentation-based chemical industry, several
criteria are relevant. These fall broadly into two main categories: financial and non-financial. This study explores the
financial aspects although the non-financial criteria turn out to be equally important. Drivers are growth and sales
price developments in the end-markets, the availability and prices of alternative feedstocks, as well as the product
yield of the fermentation process.
Financial criteria
The business case for biobased production clearly needs to be proved on a case-by-case basis. As part of the
private and confidential part of this study, we therefore developed a model to evaluate the financial returns based
on specific input parameters.
The economic feasibility is driven largely by the projected actual yield of the fermentation process and its various
costs, such as energy, utilities and capital costs. The feedstock cost (i.e. the market price) is typically dictated by
global commodity markets and can therefore be influenced to a lesser extent. Prices for pharmaceutical products,
nutraceuticals and nutritional product ingredients are usually much higher than feed and fuel prices. Price setting
depends on the availability of alternatives to buyers and additional product characteristics compared to these fossil-
based alternatives. A ‘green premium’ is often only found when CO2 tax credits or similar measures are in place or
when consumers are willing to pay extra for a green brand.
The sales price curve in the diagram below shows a potentially profitable market of about 11 million tons (in CHEQ)
of fermentation products produced from sugar, with a margin of more than $500 per ton. The total value pool
required to cover processing costs and margins based on raw sugar is $26 billion per annum. This excludes further
processing into products such as PE, PET, PLA, etc.
The economic success of the product, which is discussed in more detail later in the report, depends on two aspects:
the fermentation process’ starting point and the feedstock’s required purity for fermentation in the bioreactor.
Consequently, instead of working with sugar and paying the white sugar price, it may be better working with
semi-finished products, using the discount to create additional margin through a backward-integrated fermentation
process. Clearly, there is a trade-off since this approach may require the elimination of impurities. The effective use
of side streams and sale of the by-products is also an important factor in overall profitability.
14The sales price curve shows a potential profitable market of about 11mln ton CHEQ of fermentation products from
sugar with a margin of >$500 / ton
22.500
Vitamin B2 Sales price (USD / ton CHEQ, 2013)
White sugar price (London #5, USD / ton, average 2013)
5.000
Antibiotics
4.500
4.000
Sales price (USD/ton CHEQ)
3.500
3.000
Detailed on Figure 14
2.500
2.000
1.500
Isobutanol,
Ethanol methane
1.000
500 Semi-finishedproduct discount
0
0 10 20 30 40 50 60 70 80 90 100 110 120 130 140 150 160 170 180 190 200 210
Volume (mln ton CHEQ)
Source: BCC Research, FO Licht Renewable Chemicals Database, NOVA Institut, Deloitte Analysis
Figure 13 – Fermentation products global average market price at industrial in 2013 (USD/ton CHEQ)
Since bio-ethanol takes such a large part of the total market volume, it is worthwhile zooming in on the more
interesting segment with the higher margin potential represents about 11 million tons CHEQ. Only five products
make up the largest volumes of this potentially lucrative market (89%), namely, lysine, MSG, citric acid, lactic acid
and glutamic acid. The total value pool required to cover processing costs and margins based on raw sugar is $12
billion per annum.
15The majority of the volume of this potential market (89%) is currently in five products, namely, lysine, MSG,
citric acid, lactic acid, and glutamic acid
22.500
Vitamin B2 Sales price (USD / ton CHEQ, 2013)
Antibiotics White sugar price (London #5, USD / ton, average 2013)
5.000
4.500
Tryptophan, enzymes
Sales price (USD / ton CHEQ)
4.000
Vitamin B12,Iso-ascorbic acid, Xanthan,
3.500 Vitamin C, Succinic acid, PHA
3.000 Glutamic acid
2.500 PDO, Threonine,
Itaconicacid
2.000 BDO
MSG Lactic acid Fatty alcohols
Lysine Citric acid
1.500
1.000
Gluconic acid,
Acetone, N-butanol
500
0
0 1 2 3 4 5 6 7 8 9 10 11 12
Volume (mln ton CHEQ)
Source: BCC Research, FO Licht Renewable Chemicals Database, NOVA Institut, Deloitte Analysis
Figure 14 – Fermentation products global average market price at industrial grade in 2013 (USD /ton CHEQ)
Using the above analysis as a starting point, we applied a structured funnelling process to select a number of
products worthy of further analysis for the sponsors of the study. Key criteria included market size and margin
potential. The diagram below describes at a high level the financial model we used to carry out the evaluation of
the business case as well as a sensitivity analysis to determine the robustness of the results for the different regions.
Using expert input, we identified key “shocks” and their impact on model input parameters. These included
changes in sugar and starch prices, process yields, oil prices, by-product revenue and soil fertility.
16Key model characteristics
Bio-feedstock Four regions are compared with a typical cost analysis based on indicative
Input figures*:
• EU – Sugar Beet & Wheat
• USA – Dextrose / Corn
• Brazil – Sugar Cane
• SEA – Sugar Cane & Tapioca
Processing Where relevant, two cost models are created to investigate the option of
options an intermediate as feedstock:
• EU – White Sugar or Thick Juice
• Brazil – Raw Sugar or Cane Juice
• Thailand – Raw Sugar or Cane Juice
Process steps The cost models are broken down where possible for the following three
Cultivation
process steps with underlying cost components:
• Feedstock Cultivation Feedstock
processing
• Factory Feedstock Processing
Fermentation
• Fermentation
Outputs The cost models per country will be run based on several future shocks in
order to assess the impact on the margin
• Base Case
• Feedstock prices
• Yield effects
• Soil fertility effects
• Processing costs
• Oil and US gas price effects
• By-product revenue effects
* Typical analysis based on indicative industry averages, detailed profitability analysis should be made on a case-by-case basis
Figure 15 – Key model characteristics
Without disclosing the details, we gained the following insights from the cases we investigated:
• In most cases, starting fermentation from an intermediate product is more attractive and makes the process
economically viable
• Without regulatory measures, the economics of bio-ethanol is questionable
• Production costs are the lowest in the US due to significantly lower energy cost levels. However, given the
available feedstock, production in the US will result in a GMO labelled product, which cannot be sold globally
• We compared the main regions and their bio-feedstock crops. North-West European beets and wheat offer a
potentially attractive alternative
• The difference between the four key regions is however smaller than the range of the total costs (max. versus
minimum) resulting from the estimated error and uncertainty in the inputs
• Our sensitivity analysis shows that the results are robust but oil, sugar and starch prices can be flip-the-coin
between the regions
• The prices for CO2 emission rights must increase drastically to have an effect. The impact for bio-ethanol is the
higher than for other products
• This also means that key uncertainties, i.e. thinking in terms scenarios, is important (As part of a comprehensive
analysis of the role of biorefineries in the biobased economy, an American industrial consortium, led by the
University of Minnesota and Deloitte, developed a complete set of scenarios and illustrated the concept of
strategic flexibility6)
17While the difference in financial criteria between regions is significant, the non-financial factors and key
uncertainties weigh heavily on a location decision or preferences.
Non-financial criteria
In light of the above insights, we asked a group of mainly European experts to evaluate a range of non-financial
criteria for the four main regions. Life-cycle assessments, which show that sugar beet scores well against other
crops on sustainability criteria such as carbon footprint, corroborate the evaluation of these experts. This group
concluded that Europe generally scores significantly better than other regions. However, since elements of this
assessment are qualitative and subject to judgement, companies and other stakeholders need to develop their own
perspective.
Besides price, there are additional criteria for comparing the regions. Europe generally scores
significantly better than other regions
EU US BR SEA
Beet Wheat Dextrose Cane Tapioca Cane
Carbon footprint +++ ++ + ++ ++ ++
Sustainability* (over
NOX footprint + + + + + +
lifecycle)
SOX footprint + + + + - +
Water footprint ++ + 0 -- 0 -
Low fertilizer use + + 0 0 0 0
Soil fertility + + 0 - 0 -
Feedstock supply security ++ ++ ++ ++ + +
Feedstock purity ++ - ++ + - +
Market environment
Stability of legislation ++ + ++ ++ - -
Availability of skilled labour ++ ++ ++ - + +
Level of R&D ++ ++ ++ + + +
Closeness to end markets +++ +++ ++ - ++ ++
Currency effects ++ ++ ++ 0** 0 0
Logistics ++ ++ + - - -
Network potential +++ +++ + - 0 0
Public acceptance ++ + + +++ ++ +
Other
Brand-owner acceptance + + ++ + + +
Non-GM feedstocks*** ++ ++ -- ++ ++ ++
* Agri-footprint data retrieved via SimaPro 8.0.3 on 2 July 2014. Scoring
Dextrose data based on Blonk Consultants (2013) LCA study of +++ ++ + 0 - -- ---
fructose and HFCS‘; ** For ethanol closeness ++, for chemicals -; ***
Fraction of feedstock that is not genetically modified Extremely Very Good Neutral Poor Very Extremely
Source: Industry experts, Deloitte Analysis; good good poor poor
Figure 16 – Scores of regions and feedstocks on non-financial criteria
184. Key feedstocks in the US, Brazil,
South-East Asia and North-West
Europe include sugars and starches
from cane, beet, tapioca and corn
This section identifies the main regions and crops for the fermentation industry and explores some of the
pricing dynamics.
The top four crops for the fermentation industry are cane, beet, tapioca and corn. Every year, 5.5 billion tons of
crops are grown, containing 2.4 billion tons of carbohydrate. In fact, 61% of crops contain 89% of the global
carbohydrate (CHEQ) supply in starch. Together, the top four crops add up to 75% of the volume, generating 80%
of the global carbohydrate production. The diagram below illustrates the significant variance in the percentage of
carbohydrates (CHEQ) compared to crop volumes.
Annually 5.5 bn ton crops are grown containing 2.4 bn ton carbohydrate; 61% of the crops contain 89% of
the global carbohydrate supply in starch
Global supply of harvested crops containing Global supply of carbohydrates
carbohydrates (mln ton crop, 2012) (mln ton CHEQ, 2012)
5,457 5,457 2,388 2,388
100% 100%
Sugar
2%
11% 3%
7% 4%
Sugar crops 4%
80% 2% 80%
39% 5% Cane sugar
9%
Wheat starch
60% Sugar cane 60% 21%
34%
Starch
40% 40% 89% Rice starch
Wheat kernel 23%
Starch crops 12%
61%
Rice kernel
20% 13% 20%
Corn starch
Corn kernel 27%
16%
0% 0%
Other roots & tubers ** Sugar beet Potatoes Cassava Wheat Corn
Other coarse grains* Sorghum Barley Sugar cane Rice
* Other coarse grains includes millet, oats, rye, triticale, buckwheat, fonio, canary seed, and quinoa; ** Other roots & tubers includes sweet potatoes, yams, taro, and yautia
Note: figures include mentioned sources of carbohydrates only; Source: FAO, USDA nutrient database, Deloitte Analysis
Figure 17 – Global supply of harvested crops and carbohydrates in 2012 (mln ton)
19The study focuses on the regions with the highest concentration of carbohydrates of interest to the
fermentation industry
Total: 2,4 mln ton CHEQ
648 552 507 224 100 98 64 43 37 66 50
100%
RoW
17%
23% 23% BR
38% 41% EU
42%
75% 52% 48% SEA
8% 54%
61% India
7% 30% 70%
5% US
39%
China
50% 20% 15%
Study
3%
31% 21% focus
43%
14% 9% 12% 34%
10%
41% 5% 4%
25% 9%
11% 41%
19% 26%
24% 28%
24% 12% 11%
18% 11%
7% 4% 4% 4% 4%
0%
Corn Rice Wheat Sugar Cassava Barley Potatoes Sorghum Sugar Other Other
cane beet coarse roots
grains* &
tubers**
* Other coarse grains includes millet, oats, rye, triticale, buckwheat, fonio, canary seed, and quinoa; ** Other roots & tubers includes sweet potatoes, yams, taro, and yautia
Source: OECD-FAO Agricultural Outlook 2013, USDA nutrient database, Deloitte Analysis
Figure 18 – Global production of carbohydrate feedstocks per region in 2012 (mln ton CHEQ)
Globally, four key regions emerge for the biobased fermentation industry:
• The US: corn
• Brazil: sugar cane
• South-East Asia (Thailand, Malaysia): tapioca and/or sugar cane
• North-West Europe: sugar beet and wheat
These regions produce sufficient volumes at the most competitive cost levels for their feedstock. Alternative
feedstock includes cellulosic material to be processed into sugar by hydrolysis through the use of acids. Therefore,
the study focuses on the regions with the highest concentration of carbohydrates that are of interest to the
fermentation industry.
20The study covers the most important crops and the largest relevant producing regions
Focus regions of this study
Beet
16 mln ton
CHEQ
Wheat
China excluded because:
103 mln ton
• Volatile production
CHEQ
• Expected to stay net
Corn importer of feedstock*
203 mln ton • Entry barriers
CHEQ
Cassava
26 mln ton Cane
CHEQ 23 mln ton
CHEQ
India excluded because:
• Volatile production
• High use for feed
Cane • Low incentive to
88 mln ton invest in fermentation
CHEQ
*See appendix
Source: OECD-FAO Agricultural Outlook 2013, Industry experts, Deloitte Analysis
Figure 19 – Focus regions of this study
Prices for carbohydrate crops were volatile between 2008 and 2014 but have since steadied between 300 and
450 $/ton CHEQ. Rice is an exception and is expensive at 600 $/ton CHEQ. European wheat and US corn have
generally been cheaper than the other commodities per ton of carbohydrate, while rice is the most expensive.
The fluctuations are significant but subject to climatic conditions and other unique events seen in other
commodity markets.
21European wheat and US corn have generally been cheaper than the other commodities per ton carbohydrate,
while rice is the most expensive
US Corn Thai Rice EU Wheat
1.500 1.500 1.500
Global rice crisis
Severe
1.000 drought 1.000 1.000
567
500 500 435 500 378
386
287 286
0 0 0
2008 2010 2012 2014 2016 2008 2010 2012 2014 2016 2008 2010 2012 2014 2016
Raw sugar (New York #11) Thai Tapioca White sugar price (London #5)
1.500 1.500 1.500
1.000 1.000 1.000
500 500 500 480
387 419
0 0 0
2008 2010 2012 2014 2016 2008 2010 2012 2014 2016 2008 2010 2012 2014 2016
Commodity price (USD / ton) Commodity price (USD / ton CHEQ)
Note: Wheat, corn, and rice prices exclude processing costs of freeing starch, processing costs are an estimated $50 – 100 per ton starch
Source: FO Licht, Bloomberg, Oanda, Indexmundi, USDA nutrient database, Deloitte Analysis
Figure 20 – Feedstock commodity prices in 2008-2013 (monthly average, USD/ton, USD/ton CHEQ)
Although the agricultural commodities have global market prices, local prices differ due to transport costs, regional
premium and semi-finished product discounts. As shown in the introduction, the price of white sugar has decreased
significantly since 2000 relative to crude oil. The final section of this report explores future price developments.
22You can also read