Optical performance of progressive addition lenses (PALs) with astigmatic prescription - Nature
←
→
Page content transcription
If your browser does not render page correctly, please read the page content below
www.nature.com/scientificreports
OPEN Optical performance of progressive
addition lenses (PALs)
with astigmatic prescription
E. De Lestrange‑Anginieur1* & C. S. Kee1,2
The progressive addition lens (PAL) is a spectacle lens design with progressive refractive power
changes across the lens surface to provide sharp vision at different viewing distances for patients
with reduced accommodative strength. It has gained in popularity not just for presbyopic patients,
but also patients with occupational (office, driving, or digital device) and therapeutic (e.g., myopia
control) needs. However, despite the increasing prevalence of astigmatism in adults > 40 years old who
rely on PAL correction, no metric is available to reflect the optical variation in PALs with astigmatic
prescriptions. Based on recent studies, four novel optical metrics sensitive to variation of refractive
power across the lens surface of PALs have been developed. These metrics were used to compare
the optical performance of PALs of various prescriptions, designs, and manufacturers. For each
lens, the refractive power profile was first measured with a Moire-deflectometry-based instrument.
The data was then exported and analyzed using a two-dimensional error map for each of the four
metrics. The results revealed significant impacts of astigmatic prescription, providing evidence for the
usefulness of these metrics in quantifying the optical performance of PALs for patients with astigmatic
prescriptions.
PALs are designed to provide continuous, additional converging powers for eyes that need extra refractive powers
to see things sharply at different viewing distances. With the increasing popularity of handheld digital devices,
PAL fulfills both functional and cosmetic needs for the growing aging population, in whom accommodative
demands cannot be supported through the coordination of eye’s ciliary muscles and the crystalline lens. In the
clinical setting, selecting PALs is largely dependent on the patients’ visual demands, such that the design of the
PAL’s refractive profile can provide clear distance and near vision within the designated zones1. However, the
integration of multiple lens curvatures to provide additional powers in PAL inevitably induces unwanted optical
blurs, the lower region at both sides of PAL being distorted by varying amounts of astigmatic blur2. Such optical
blurs degrade patient’s foveal and peripheral vision when the eye looks towards the peripheral area of the lens.
A detailed analysis of the aberrations of PALs using wavefront sensing analysis showed a dominant contribution
of lower-order aberrations (defocus and astigmatism), with only small amounts of higher-order a berrations3–5.
To analyze the optical performance of PALs, other optical techniques, such as Moire deflectometry have been
applied to characterize the refractive power profile across the lens s urface6. In addition, measurement of the
height profile of the back and front surfaces of PALs was also utilized for ray tracing analysis of the interaction
between eye and P ALs7.
PAL design can be broadly divided into “soft” and “hard” designs, based on the concentration of the distorted
area. Soft designs have a smoothly varying optical blur across the lens surface, which is traded off by a narrower
area providing clear vision (progressive corridor), whereas hard designs provide a larger area for clear vision at
the cost of an abrupt change in refractive powers into the distorted region. Psychophysical studies comparing
PAL with single vision lenses have indicated that the narrowing of the progressive corridor caused by optical
aberrations tends to reduce the performance of PALs in dynamic visual tasks8,9. The importance of the refractive
profile of PALs has also been highlighted in several clinical studies comparing patient’s subjective preference
with lens d esign10–13. Other studies have shown a strong correlation between various optical quality metrics
and visual acuity14,15. The hypothesis that patients’ visual performance was sensitive to the optics of PALs was
later verified16 by correlating optical performance with visual performance measured at different optical zones.
Although only local metrics were assessed, a close relationship was found between optical and visual perfor-
mance, demonstrating that fine-tuning the PAL wavefronts (e.g., in personalized PAL designs) can enhance
1
School of Optometry, Hong Kong Polytechnic University, Hong Kong, China. 2Interdisciplinary Division of
Biomedical Engineering, Hong Kong Polytechnic University, Hong Kong, SAR, China. *email: elie.delestrange@
hotmail.com
Scientific Reports | (2021) 11:2984 | https://doi.org/10.1038/s41598-021-82697-0 1
Vol.:(0123456789)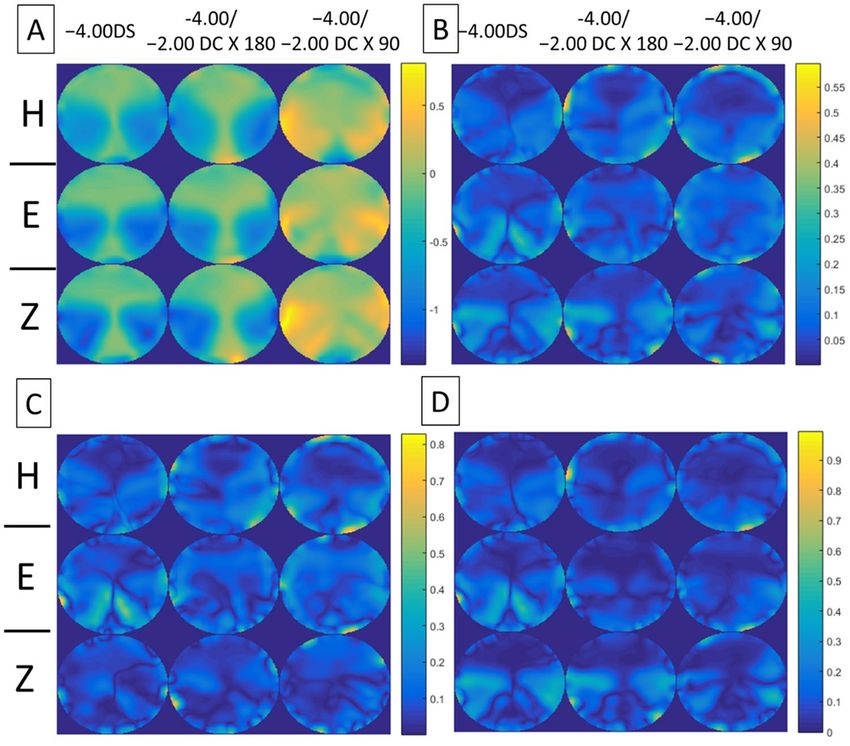
www.nature.com/scientificreports/
Lens manufacturers Essilor Hoya Zeiss
Fitting cross height (mm) 4 6 6
Corridor length (mm) 14 and 17 11 and 14 10 and 14
1. Varilux Comfort 1. Hoyalux Summit Dynamic 1. Classic PAL LT
Model
2. Physio 2. Lifestyle V + Harmony 2. Precision Plus DVP
Table 1. Characteristics of progressive addition lenses measured.
Figure 1. Measurement of refractive power profile. (A) The Rotlex Free Form Verifier system with graphic
user interface (left) and positioning device (right). Note that the tested PAL was set with the front surface facing
downwards. (B) The two standard engraved symbols of the PAL marked with a fine-tip marker and positioned
within the green rings (arrows) appeared on the graphic user interface. (C) The flow chart summarizes the
measurement procedure.
patients’ visual performance. Given the complex spatial distribution of aberrations across the lens surface of PAL,
a comprehensive assessment of optical quality would require a global metric that can reflect the optical quality
of the whole lens surface area. In this respect, S heedy17,18 proposed to evaluate the power distribution of PALs
by estimating the width of clear “zones” designated for distance, intermediate, and near vision, based on the
departure from the target prescription. This method provides a quantitative description of the area that provides
clear vision, but the method has not been tested in PALs with astigmatic p rescriptions19.
The primary aim of this study was to develop quantitative global metrics to examine the influence of astig-
matism correction on the optical performance of PALs. The hypothesis is that the optical performance of PALs
is quantifiable with metrics sensitive to astigmatic prescription. To test this hypothesis, four metrics varying in
complexity were developed and used to compare the optical performance of PALs of different prescriptions,
designs, and manufacturers. The results indicate that metrics sensitive to astigmatic prescription can quantita-
tively differentiate the optical performance of PALs.
Methods
PAL samples. To compare the influence of astigmatic axis on lens optics, different designs of PALs from
three lens manufacturers (Essilor, Hoya, and Zeiss) with identical addition powers (+ 2.00D), but with cylindri-
cal axis of orthogonal direction (i.e., 90 vs. 180), were tested. Because myopia (or short-/near-sightedness) is
increasing in prevalence worldwide, especially in East Asian p opulation20), distance prescriptions of PALs were
based on the characteristics of refractive error reported in a recent study on the Hong Kong Chinese clinical
population21: − 4.00 DS, − 4.00 DS/− 2.00 DC × 90, and − 4.00 DS/− 2.00 DC × 180. For each lens manufacturer,
two popular PAL models with two different progressive corridors were included (see Table 1). A total of 12 lenses
from each lens manufacturer (3 prescriptions × 2 models × 2 corridor lengths) were provided in-kind for meas-
urement. All lenses had a refractive index of 1.6.
Measurement. Figure 1A–C shows the instruments and steps involved in measuring the refractive power
profile of PALs. Based on the Moire deflectometry principle, the Rotlex Free Form Verifier (Rotlex, Omer, Israel)
used a diverging light to illuminate the PAL lens surface. Light refracted from the PAL passed through two grat-
ings creating a Moire interference pattern that was converted into arrays of local wavefront properties. These
Scientific Reports | (2021) 11:2984 | https://doi.org/10.1038/s41598-021-82697-0 2
Vol:.(1234567890)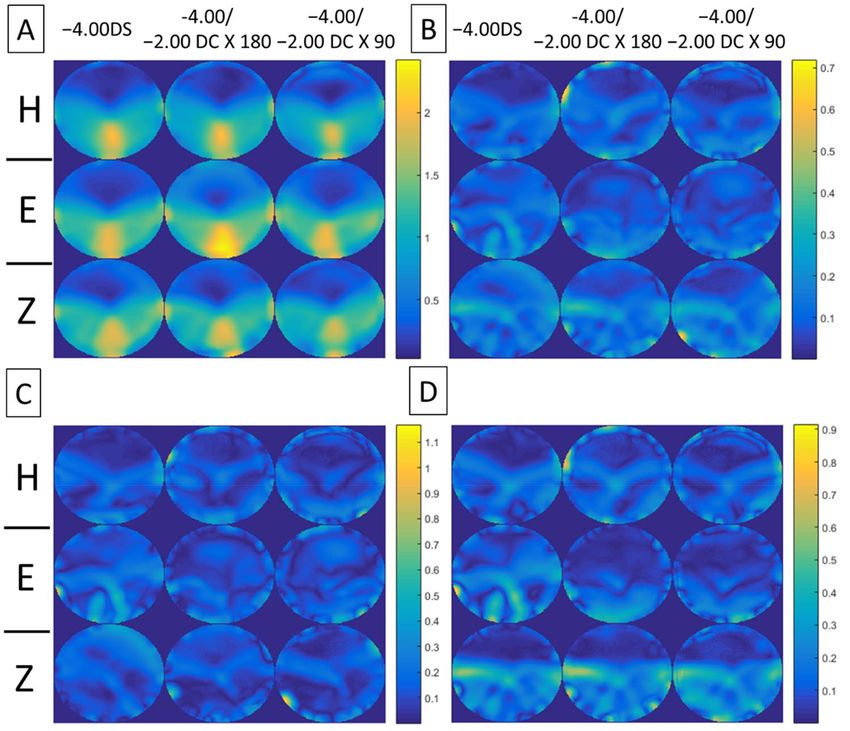
www.nature.com/scientificreports/
Figure 2. Derivation of cylindrical errors at different locations x, y on the lens surface. (A) Actual cylindrical
refractions Jactual at three separate locations (black symbols) on the lens surface are represented by their
respective J0 and J45 coordinates. Cylindrical error at each position is quantified by subtracting the target
Jtarget (red circle) from the actual Jactual (black symbols), as indicated by the arrowhead. (B) An error map
is constructed by computing the cylindrical error for each location on the lens surface. Cylindrical errors
computed for the three locations in (A) are represented by open symbols. The color gradient highlights the levels
of mismatch between actual and target cylinder power, which progressively increases from blue to red colors.
Figure 3. Vectorial differences due to difference in astigmatic axis. Actual (blue square) and target (red circles)
refractive prescriptions (− 4.00 DS/− 2.00 DC × 90 and − 4.00 DS/− 2.00 DC × 180) with identical spherical
equivalent and cylinder magnitude (J) are used as examples. Since all prescriptions have identical spherical
equivalent, they lie on the same astigmatic plane. All prescriptions lie on the big blue circle, representing a
common cylinder magnitude of J . The symbol �J α stands for the unwanted errors after subtracting the target
(with axis α = 0 and 90) from the actual prescriptions. Note that in this example, the first metric (JCC error
map) predicts the same optical performance for the two prescriptions (�Jα = 0). The second metric (vectorial
error map) J45 components also could not differentiate between the two prescriptions when compared to the
target prescription, but the different J0 components for different axes (α = 0 and 90) predicted different optical
performance (see text for details).
arrays were used to calculate two-dimensional refractive maps of spherical and cylindrical powers. The software
required the input of the following lens parameters for the calculation of the refractive power map: lens refractive
index (provided by the lens manufacturer), center thickness (measured by a lens gauge), and front surface radius
(measured by a lens clock). The locations of the two standard laser-engraved symbols of the PAL were identified
with standard procedures and marked by a fine-tip marker. The lens front was placed face down according to the
Scientific Reports | (2021) 11:2984 | https://doi.org/10.1038/s41598-021-82697-0 3
Vol.:(0123456789)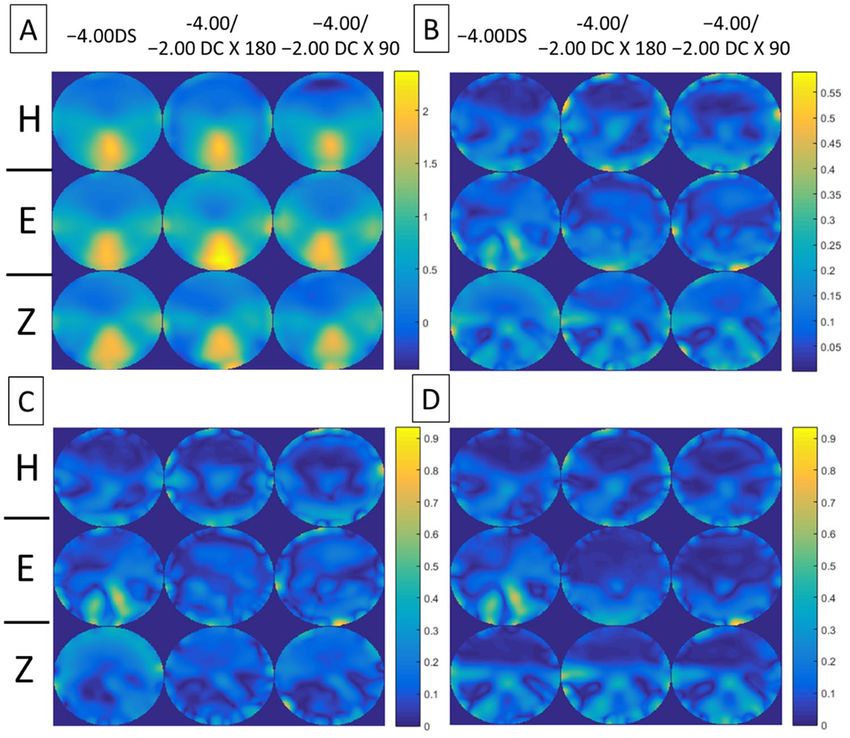
www.nature.com/scientificreports/
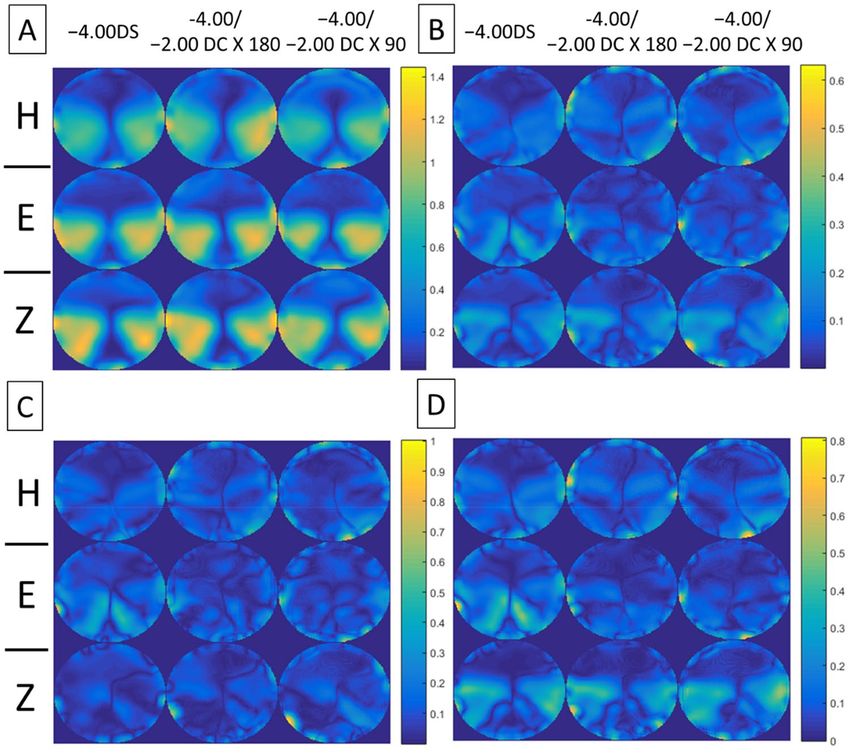
Figure 4. Error maps of spherical power, M. (A) Mean and (B) standard deviation of the error maps at distant
viewing distance for four lenses (2 models × 2 corridor lengths) with the same prescription (columns) from the
three lens manufacturers (rows: H Hoya, E Essilor, Z Zeiss). (C) and (D) show mean absolute differences of the
error maps for PALs of different models and corridor lengths, respectively. Note that the scales of color-coded
maps are different.
user’s manual. The alignment of the tested lens was checked by positioning the two ink marks (laser-engraved
symbols) within the green rings on the screen (Fig. 1B). Once all the parameters were set, five repeated measure-
ments were acquired for each lens and averaged.
Analysis. ASCII data files from the Rotlex Free Form Verifier were imported into Excel and analyzed using a
custom Matlab algorithm. The analysis was performed over a 64-mm lens diameter with a resolution of 0.3 mm.
Using power vector a nalysis22, the spherical (S), cylindrical power (C) and axis (α) components in the conven-
tional prescription notation (S, +C × α + 90) were converted into rectangular E = (M, J0, J45) and polar forms
(M, J × α):
C
M =S− ,
2
C
J0 = cos (2α),
2
C
J45 = sin (2α),
2
2 = C,
J= J02 + J45
2
where M is the spherical equivalent, J 0, J45 and J are the cylindrical components of a Jackson cross-cylinder (JCC)
lens at axis 0°, 45°, and α , respectively. For instance, for a prescription written in the conventional negative-
cylinder notation (− 4.00/− 2.00 × 180), the power vector coordinate is (− 5.00, + 1.00, 0) in rectangular form
and (− 5.00, − 1.00 × 90) in polar form.
The formulae above were used to generate a set of optical metrics for comparing refractive power differences,
including spherical defocus, astigmatism, and overall optical blurs. To determine the impacts on lens optics
Scientific Reports | (2021) 11:2984 | https://doi.org/10.1038/s41598-021-82697-0 4
Vol:.(1234567890)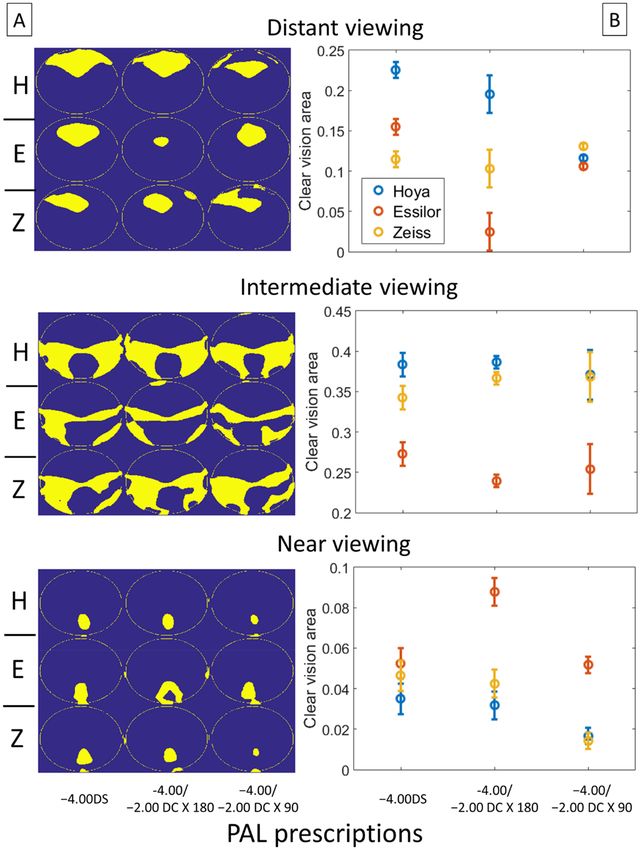
www.nature.com/scientificreports/
Figure 5. Error maps of JCC, �Jα . (A) Mean and (B) standard deviation of the error maps for four lenses (2
models × 2 corridor lengths) with the same prescription (columns) from the three lens manufacturers (rows: H
Hoya, E Essilor, Z Zeiss). (C) and (D) show mean absolute differences of the error maps for PALs of different
models and corridor lengths, respectively. Note that the scales of color-coded maps are different.
due to the varying refractive powers across the lens surface, an error map (�) of refraction was constructed
by subtracting the target refraction from actual refraction of the lens prescription at each position on the PAL
surface. The mean and standard deviation of the error maps across the four samples of the same prescription
(i.e., 2 models × 2 corridors lengths) are reported for individual manufacturers. To determine the influence of
the PAL corridor length and model type on the reported error map, the mean absolute difference of the error
maps between PALs having a different corridor length and model, respectively, were also calculated. Small dif-
ferences indicate that the averaged error map reported is representative of the performance of the selected PAL
prescription, whereas large differences indicate that the corridor length or/and model affects the performance
of prescription differently.
The error maps generated are described below:
• For unwanted spherical defocus, the error map M was calculated for three target (desired) viewing distances
(i.e., distant, intermediate, and near) of PALs:
M x, y = Mactual x, y − Mtarget ,
where Mactual and Mtarget are the actual (i.e., measured) and target (i.e., intended) spherical powers, respec-
tively. The Mtarget is computed as:
Mtarget = MPALs + V + Rx ,
where MPALs were −5.00D and −4.00D for PALs with and without astigmatism correction, respectively; V rep-
resents the vergences of light (0.00 D, − 1.50 D, − 2.50 D) from three target viewing distances (distant = infinity;
intermediate = 66 cm; near = 40 cm); and Rx is the residual accommodative power. To account for the residual
capacity of an average presbyope to accommodate for nearby objects, as recommended by A ndre23, a residual
accommodative power of Rx = 0.50D at the intermediate and near distances was assumed.
• For unwanted astigmatism, two optical metrics, which measure the difference between the actual and target
cylindrical profiles at each position on the lens surface, as depicted in Fig. 2, were developed.
Scientific Reports | (2021) 11:2984 | https://doi.org/10.1038/s41598-021-82697-0 5
Vol.:(0123456789)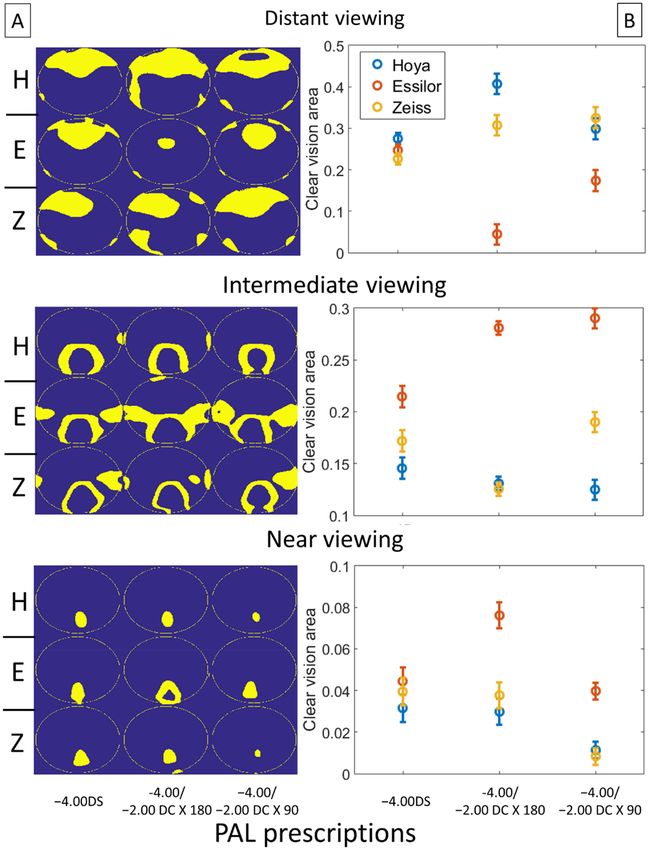
www.nature.com/scientificreports/
Figure 6. Error maps of vectorial cylinder, Jv . (A) Mean and (B) standard deviation of the error maps for four
lenses (2 models × 2 corridor lengths) with the same prescription (columns) from the three lens manufacturers
(rows: H Hoya, E Essilor, Z Zeiss). (C) and (D) show mean absolute differences of the error maps for PALs of
different models and corridor lengths, respectively. Note that the scales of color-coded maps are different.
• The first metric concentrated on the error between the actual and target astigmatic magnitude of the PALs
at each location on the lens surface. The error map associated with a single JCC component at axis α, here
termed the JCC error map �Jα, was generated as follows:
�Jα x, y = (Jactual − Jtarget ).
Although this metric can quantify the difference in magnitudes of actual and target astigmatic blur, it ignores
the potential optical effects of astigmatic axis. The JCC error map is equivalent to half of the astigmatic magnitude
(“C ”) in Sheedy’s study17.
• To overcome the limitation of �Jα of ignoring the astigmatic axis, the second metric, the vectorial cylindri-
cal error map, Jv was computed by taking into account the vectorial differences between actual and target
astigmatic components of the power vector ( J0, J45), as follows:
Jv x, y = J02 x, y + J45 2 x, y ,
where the cylinder error maps associated with each J0 and J45 component were as follows:
J0 x, y = J0,actual x, y − J0,target ,
J45 x, y = J45,actual x, y − J45,target .
To illustrate how the second metric, Jv , can overcome the limitation of the first metric, �Jα, Fig. 3 shows
the vectorial differences that could only be measured by Jv but not the �Jα metric. For illustration purposes,
the two metrics were compared by their ability to detect differences in astigmatic prescription. Three pre-
scriptions with identical spherical equivalent and cylinder (J), one actual (blue square) and two target (red
Scientific Reports | (2021) 11:2984 | https://doi.org/10.1038/s41598-021-82697-0 6
Vol:.(1234567890)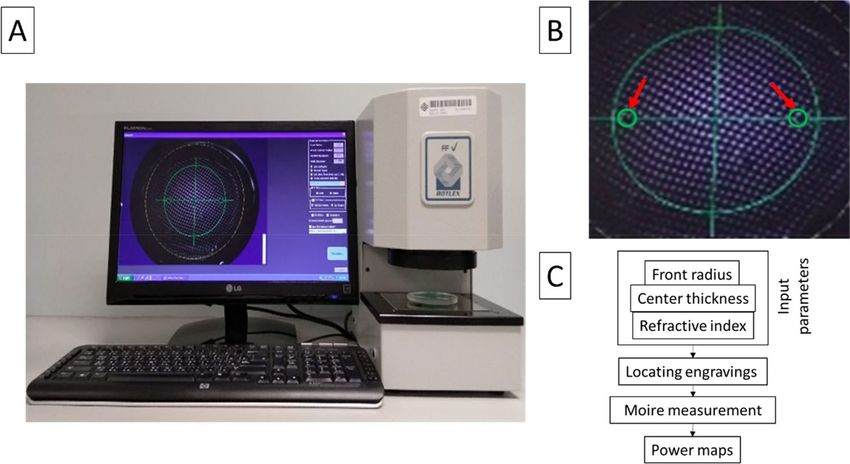
www.nature.com/scientificreports/

                                  Figure 7.  Error maps of overall refraction L. (A) Mean and (B) standard deviation of the error maps at distant
                                  viewing distance for four lenses (2 models × 2 corridor lengths) with the same prescription (columns) from the
                                  three lens manufacturers (rows: H Hoya, E Essilor, Z Zeiss). (C) and (D) show mean absolute differences of the
                                  error maps for PALs of different models and corridor lengths, respectively. Note that the scales of color-coded
                                  maps are different.

                                  Figure 8.  Area of clear vision for different PALs, metric �Jα. (A) Binary image showing area of clear vision
                                  (yellow) and area with �Jα more than ± 0.25D from the target prescription (dark blue). The calculations in each
                                  plot were based on data of four lenses with the same prescription. H Hoya, E Essilor, Z Zeiss. (B) Proportion of
                                  clear vision area as a function of PAL prescription. The proportion was calculated as the area of clear vision to
                                  the total area of measurement. Error bars represent standard errors.

                                  circles) sphero-cylindrical prescriptions, were used for comparison. It should be noted that, because all three

Scientific Reports |   (2021) 11:2984 |                https://doi.org/10.1038/s41598-021-82697-0                                                     7

                                                                                                                                              Vol.:(0123456789)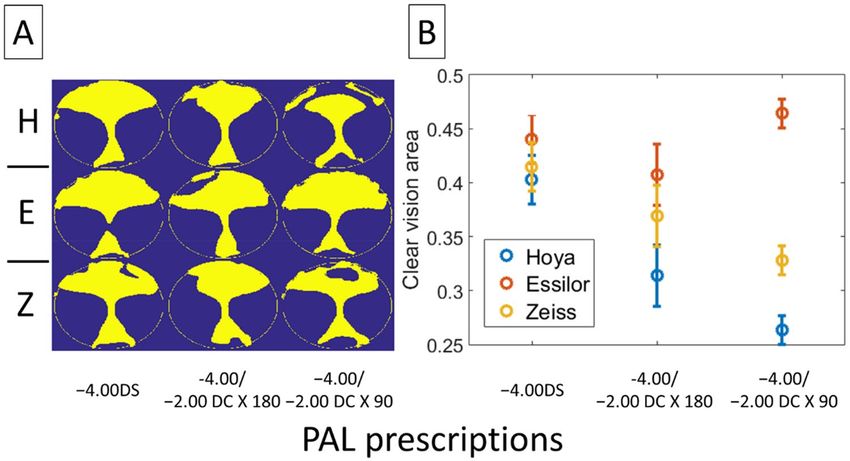
www.nature.com/scientificreports/
Table 2. Summary of two-way ANOVA results for different metrics. This statistical summary indicates the
level of significance obtained with various metrics for the different manufacturers and prescriptions. The color
code of the p-value is as follows: dark blue, p > 0.05 (not significant); light blue, p ≤ 0.05; yellow, p ≤ 0.01; red, p
≤ 0.001. Note that the blank field corresponds to the conditions where the statistical test is not applicable (i.e.,
presence of interaction between prescription and manufacturer, or absence of a significant main effect). H Hoya,
E Essilor, Z Zeiss.
Table 3. Summary of post-hoc test results for different metrics. This statistical summary indicates the level of
significance obtained with metrics showing interaction between manufacturer and prescription type, namely
J v and M metric. The color code of the p-value is the following: dark blue, p > 0.05 (not significant); light
blue, p ≤ 0.05; yellow, p ≤ 0.01; red, p ≤ 0.001. Note that the blank field corresponds to the conditions where the
statistical test is not applicable. H Hoya, E Essilor, Z Zeiss.
prescriptions have identical spherical equivalent (i.e., M = − 5.00 D), the mean-power dimension (which was
represented in the z-axis in Thibos et al. three-dimensional dioptric s pace22) is not shown here. Each of the three
symbols occupies a locus on the big blue circle, representing the same magnitude of J. Since the first metric (�Jα)
only considers the magnitude of J, comparing an actual refractive prescription to either of these two target pre-
scriptions with identical J would return a zero value (�Jα = 0), i.e., the metric could not differentiate between
the two prescriptions with different astigmatic axes. In contrast, Jv takes into account the vectorial differences,
returning two distinctly different quantities relative to the actual prescription (�J α, represented by red lines),
indicating a differential optical performance.
It is important to note that when actual and target axes are the same, the vectorial cylindrical error map Jv
is equivalent to �Jα. This is because, for αactual = αtarget = α, the following relationships:
�J0 = Jactual cos (2αactual ) − Jtarget cos
2αtarget
�J45 = Jactual sin (2αactual ) − Jtarget sin 2αtarget
become:
Scientific Reports | (2021) 11:2984 | https://doi.org/10.1038/s41598-021-82697-0 8
Vol:.(1234567890)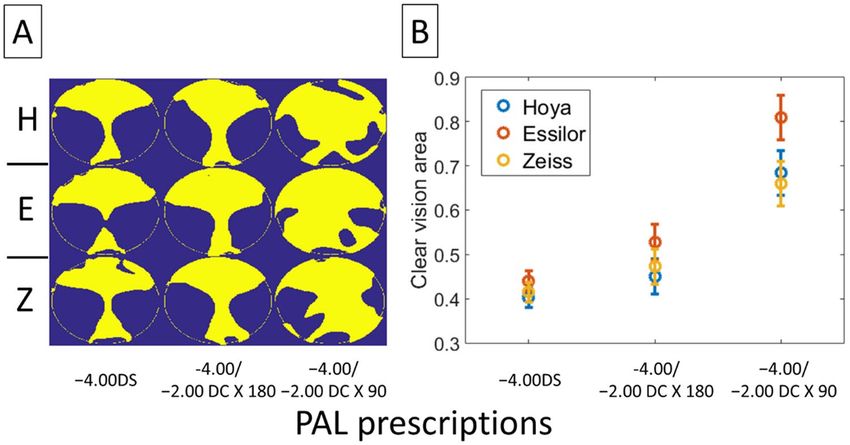
www.nature.com/scientificreports/
Figure 9. Area of clear vision for different PALs, metric Jv . (A) Binary image showing area of clear vision
(yellow) and area with Jv more than ± 0.25D from the target prescription (blue). The calculations in each plot
were based on data of four lenses with the same prescription. H Hoya, E Essilor, Z Zeiss. (B) Proportion of clear
vision area as a function of PAL prescription. The proportion was calculated as area of clear vision to the total
area of measurement. Error bars represent standard errors.
2
�J02 = (Jactual − Jtarget )cos (2α)
2 = (J
2
�J45 actual − Jtarget )sin (2α)
By substituting those expression in J , we get:
�J = (Jactual − Jtarget ) = �Jα .
• To provide a comprehensive estimation of the overall optical effects introduced by the actual refractive power
variation across the lens surface, the length of the power v ector22,24 was analyzed, as follows:
√ 2
M + J02 + J452
L= .
A previous study showed that the length of the power vector can explain more than 90% of the variance in
uncorrected visual acuity found in the ametropic population with simple myopia, myopic astigmatism, and
mixed astigmatism15. In addition, the length of the power vector was found to accurately predict the change in
visual acuity associated with optically induced variations in spherical and cylindrical refractive errors, with a
correlation coefficient R2 ranging from 0.90 to 0.99 in groups with mixed astigmatism, simple myopic astigma-
tism. and hyperopic astigmatism25.
• The overall optical blurs arising from the mismatch between actual and target prescription was computed by
vectorial analysis of the power vector according to the above rule of subtraction26:
(�M, �J0 , �J45 ).
The length of this vector difference is a measure of the overall error map of refraction L:
√
M 2 x, y + J02 x, y + J45 2
L x, y = x, y ,
where M, J0 , and J45 are the error maps associated with the spherical and cylindrical components, respec-
tively, and are described individually above.
In order to quantify the useful region providing visual clarity on the lens surface, the “area of clear vision”
was defined as an area exhibiting dioptric errors below a certain threshold corresponding to the tolerance of
optical blur. Here, the area of clear vision within ± 0.25D of the target prescription was reported, reflecting both
the level of accuracy provided by lens prescriptions and the level of b lur17. This area was used to compare the
optical performance between different PALs.
Scientific Reports | (2021) 11:2984 | https://doi.org/10.1038/s41598-021-82697-0 9
Vol.:(0123456789)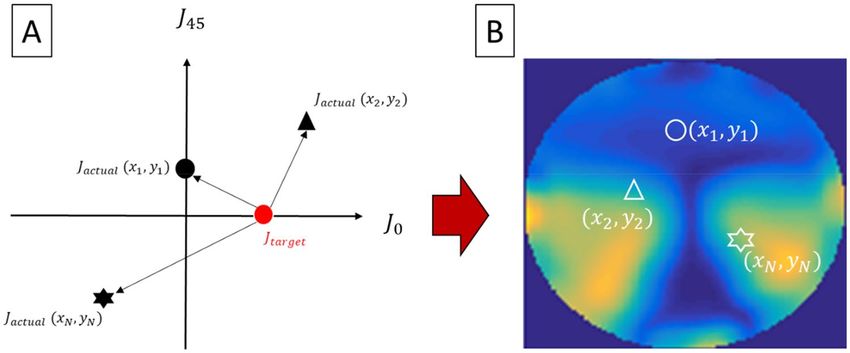
www.nature.com/scientificreports/
Figure 10. Area of clear vision of different PALs for distant, intermediate, and near viewing distances, metric
M . (A) Binary image showing area of clear vision (yellow) and area with M more than ± 0.25D from
the target prescription (blue). The calculations in each plot were based on data of four lenses with the same
prescription. H Hoya, E Essilor, Z Zeiss. (B) Proportion of clear vision area as a function of PAL prescription.
The proportion was calculated as area of clear vision to the total area of measurement. Error bars represent
standard errors.
Results
Error maps. Figures 4, 5, 6, 7 show the error maps using different optical metrics ( M , �Jα , �Jv , L, respec-
tively, defined above) for the three prescriptions (columns) from the three lens manufacturers (rows). In each of
these four figures, error maps in (A) and (B) represent the mean and standard deviation of four lenses (2 mod-
els × 2 corridor lengths) with the same prescription respectively; whereas maps in (C) and (D) show the absolute
differences between samples having different model and corridor length, respectively. Note that the absolute
differences in (C) and (D) rarely exceeded 0.40D, indicating that the error maps of the mean in (A) were rep-
resentative of each PAL prescription. For each prescription (columns), the variation in error maps tended to be
similar among manufacturers (A in Figs. 4, 5, 6, 7), indicating similarities in overall design and/or technological
approach across the three manufacturers. In contrast, for each manufacturer (rows), qualitative differences in the
Scientific Reports | (2021) 11:2984 | https://doi.org/10.1038/s41598-021-82697-0 10
Vol:.(1234567890)www.nature.com/scientificreports/
Figure 11. Area of clear vision of different PALs for near, intermediate, and far distance metric L. (A) Binary
image showing area of clear vision (yellow) and area with L more than ± 0.25D from the target prescription
(blue). The calculations in each plot were based on data of four lenses with the same prescription. H Hoya,
E Essilor, Z Zeiss. (B) Proportion of clear vision area as a function of PAL prescription. The proportion was
calculated as area of clear vision to the total area of measurement. Error bars represent standard errors.
error maps were observed between the three types of prescriptions, in particular for the JCC error maps (�Jα )
of PALs with − 2.00 DC × 90 (Fig. 5).
Area of clear vision. �Jα metric. Figure 8 compares the area of clear vision determined by the JCC as-
tigmatic magnitude alone ( Jα ). Using this metric that does not take into account the influence of the astigmatic
axis, significant main effects on the area of clear vision were found for both prescription and manufacturer
(Two-way ANOVA: prescription effect, p < 0.001; manufacturer effect, p < 0.006). Although all PALs bear some
amount of unwanted astigmatism (Fig. 8A, dark blue area), PALs with astigmatic prescription tend to have a
smaller magnitude of errors. For instance, the area of clear vision is more than 60% for PALs with − 2.00 DC × 90
prescription (Fig. 8B).
Tables 2 and 3 use colored boxes to indicate significant effects on the area of clear vision for different metrics,
as revealed by two-way ANOVA and post-hoc tests, respectively. While an unfilled (blank) box indicates no
Scientific Reports | (2021) 11:2984 | https://doi.org/10.1038/s41598-021-82697-0 11
Vol.:(0123456789)www.nature.com/scientificreports/
statistical test is applicable (either because the presence of an interaction effect, or because there was no main
effect), the different colored boxes represent different p-values (dark blue, p > 0.05, not significant; light blue,
p ≤ 0.05; yellow, p ≤ 0.01; red, p ≤ 0.001). Note that because no interaction effect was found for J α(dark blue,
Table 3), the corresponding column for J α in Table 3 has only blank boxes. The following sections cover the
results for different metrics, further detailed statistical results are available in Supplementary Tables.
Jv metric. The metric Jv , which takes into account the influence of the astigmatic axis, shows a reduction in
the range of the clear vision area, as compared to the metric �Jα(Fig. 9 vs. Fig. 8, 25–45% vs. 40–80% for Jv and
�Jα metrics, respectively), for PALs with astigmatic correction. These differences were particularly obvious with
the − 2.00 DC × 90 prescription, indicating the dominant role of the astigmatic axis in the optical performance.
Unlike �Jα, there was a significant interaction effect when using Jv to compare the area of clear vision across
PALs (Two-way ANOVA: manufacturer × prescription, p < 0.05). The difference in optical performance between
manufacturers was particularly obvious for PALs with − 2.00 DC × 90 prescription (Fig. 9; see Tables 2 and 3 for
statistical details).
M metric. The differences in optical performance between PALs were not simply affected by astigmatic mag-
nitude ( J α) and axis ( J v ), but tended to vary strongly with viewing distances. Figure 10 shows the area of
clear vision determined by the level of spherical error ( M ) for different viewing distances. At distant view-
ing distance, there were significant interaction effects of manufacturer and prescription (Two-way ANOVA:
p = 0.001); at intermediate viewing distance, only the manufacturer had a significant main effect (p < 0.001);
at near viewing distance, both manufacturer and prescription have significant main effects (both p < 0.01) (see
Tables 1 and 2 for details). For all the manufacturers, the area of clear vision at near viewing distance was smaller
in PALs with − 2.00 DC × 90 prescription, as compared to the other two prescriptions (Two-way ANOVA with
post hoc tests; − 2.00 DC × 90 vs. − 2.00 DC × 180, p < 0.01; − 2.00 DC × 90 vs − 4.00DS, p < 0.05).
L metric. In order to estimate the optical effect due to the combination of spherical errors and astigmatic
blurs, Fig. 11 plots the overall errors map of refraction ( L) for each viewing distance. For both distant and
intermediate viewing distances, the manufacturer has significant main effects (Two-way ANOVAs: p < 0.05
and p < 0.01 respectively); for near viewing distance, both manufacturer and prescription have significant main
effects on the area of clear vision (both p < 0.01) (see Tables 2 and 3 for details). Similar to M , the area of clear
vision using this metric was significantly smaller in PALs with − 2.00 DC × 90 prescription compared to the other
two prescriptions (Two-way ANOVA with post hoc tests; − 2.00 DC × 90 vs. − 2.00 DC × 180, p = 0.01; − 2.00
DC × 90 vs − 4.00 DS, p < 0.05).
Discussion
The four optical metrics developed in this study revealed the impacts of prescription and manufacturer on the
optical performance of PALs (Tables 2 and 3). Whilst J α metric showed a significant effect of prescription on
the optical performance, J v metric shows a significant interaction effect of prescription and manufacturer on
the area of clear vision (Table 2). In contrast, comparing the optical performance at different viewing distances
using M vs. L also revealed subtle differences (Table 2): for distant viewing, the performance depended on
the interaction between prescription and manufacturer with M, but depended only on manufacturer with L
(Table 2); for intermediate viewing, it depended on the manufacturer with both M and L ; for near viewing,
it depended on both prescription and manufacturer for both M and L . These results highlight the influence
of optical parameters on optimizing lens performance across surface area.
The area of clear vision provided by PAL is limited by the axis of the astigmatic correction. Although a metric
such as J α could reflect the variation of optical blur due to astigmatic magnitude (Fig. 8), but the metric per se
has little clinical value to one whose vision is sensitive to blur associated with the astigmatic axis—in this case a
metric such as J v provides a better evaluation of optical performance (e.g., compare area of clear vision in Fig. 8
with Fig. 9). Nevertheless, all four metrics including J α underscore the pivotal role of astigmatic prescription
in determining the optical performance of PALs. Of particular importance is the finding that, as supported by
both M and L metrics (Table 2, Figs. 10 and 11), the area of clear vision at near viewing distance shows a
significant reduction in PALs with − 2.00 DC × 90 when compared to the other two prescriptions. To the best
of our knowledge, this is the first study that shows a significant impact of astigmatic prescription in PALs using
novel, quantifiable metrics.
Although these results demonstrate some obvious differences between PALs with different astigmatic cor-
rection and between PALs from different manufacturers (Figs. 8, 9, 10, Tables 2 and 3), caution should be
employed when generalizing these results to lenses with different prescriptions, because only a small number of
PALs were used. Some variations in the distribution of optical errors across PALs are expected with individual
lens parameters. In addition to these factors, other non-optical factors can also influence the resultant optical
performance. For examples, studies using wavefront a nalysis5,16 showed that the optical interactions between
the ocular aberrations and PAL can influence the retinal image quality at specific lens zones. While such optical
effects may be overcome by a personalized PAL design taking into account the potential spectacle tilts as-worn
(e.g., pantoscopic tilt4,7 and wrap angle11) and the preferred visual habits (e.g., head and eye movements9,27), it
remains unknown how the intersubject variability in ocular parameters and the way eye and lens optics interact
in real view c ondition28, affect the visual performance of a conventional PAL (i.e. with standard values). Since
these parameters may interact with the optics of PALs in a complex manner, prescribing conventional PALs with
astigmatic correction for myopic children warrants careful consideration, because growing evidence in animal
studies29 has indicated the influence of astigmatic blur in regulating early eye growth.
Scientific Reports | (2021) 11:2984 | https://doi.org/10.1038/s41598-021-82697-0 12
Vol:.(1234567890)www.nature.com/scientificreports/
In conclusion, this study used novel quantifiable optical metrics to show the differences in optical performance
of PALs attributable to prescription and manufacturer. Further work is needed to investigate the potential impacts
of these optical metrics on visual performance in real life conditions.
Received: 8 June 2020; Accepted: 18 January 2021
References
1. Jalie, M. Ophthalmic Lenses and Dispensing 3rd edn, 169–175 (Butterworth-Heinemann, Edinburgh, 2008).
2. Sheedy, J. E., Campbell, C., King-Smith, E. & Hayes, J. R. Progressive powered lenses: The Minkwitz theorem. Optom. Vis. Sci. 82,
916–922 (2005).
3. Blendowske, R., Villegas, E. A. & Artal, P. An analytical model describing aberrations in the progression corridor of progressive
addition lenses. Optom. Vis. Sci. 83, 666–671 (2006).
4. Villegas, E. A. & Artal, P. Comparison of aberrations in different types of progressive power lenses. Ophthalmic Physiol. Opt. 24,
419–426 (2004).
5. Villegas, E. A. & Artal, P. Spatially resolved wavefront aberrations of ophthalmic progressive-power lenses in normal viewing
conditions. Optom. Vis. Sci. 80, 106–114 (2003).
6. Huang, C. Y. et al. Comparison of three techniques in measuring progressive addition lenses. Optom. Vis. Sci. 89, 1564–1573 (2012).
7. Arroyo, R., Crespo, D. & Alonso, J. Scoring of progressive power lenses by means of user power maps. Optom. Vis. Sci. 89, E489-
501 (2012).
8. Selenow, A., Bauer, E. A., Ali, S. R., Spencer, L. W. & Ciuffreda, K. J. Assessing visual performance with progressive addition lenses.
Optom. Vis. Sci. 79, 502–505 (2002).
9. Han, Y. et al. Static aspects of eye and head movements during reading in a simulated computer-based environment with single-
vision and progressive lenses. Investig. Ophthalmol. Vis. Sci. 44, 145–153 (2003).
10. Wittenberg, S., Richmond, P. N., Cohen-Setton, J. & Winter, R. R. Clinical comparison of the TruVision Omni and four progressive
addition lenses. J. Am. Optom. Assoc. 60, 114–121 (1989).
11. Han, S. C., Graham, A. D. & Lin, M. C. Clinical assessment of a customized free-form progressive add lens spectacle. Optom. Vis.
Sci. 88, 234–243 (2011).
12. Jaschinski, W., König, M., Mekontso, T. M., Ohlendorf, A. & Welscher, M. Comparison of progressive addition lenses for general
purpose and for computer vision: An office field study. Clin. Exp. Optom. 98, 234–243 (2015).
13. Forkel, J. et al. Personalized progressive addition lenses: Correlation between performance and design. Optom. Vis. Sci. 94, 208–218
(2017).
14. Marsack, J. D., Thibos, L. N. & Applegate, R. A. Metrics of optical quality derived from wave aberrations predict visual performance.
J. Vis. 4, 322–328 (2004).
15. Raasch, T. Sphero-cylindrical defocus and visual acuity. Optom. Vis. Sci. 72, 272–275 (1995).
16. Villegas, E. A. & Artal, P. Visual acuity and optical parameters in progressive-power lenses. Optom. Vis. Sci. 83, 672–681 (2006).
17. Sheedy, J. E. Progressive addition lenses–matching the specific lens to patient needs. Optometry 75, 83–102 (2004).
18. Sheedy, J., Hardy, R. F. & Hayes, J. R. Progressive addition lenses—measurements and ratings. Optometry 77, 23–39 (2006).
19. Wei, Y., Xiang, H., Zhu, T., & Chen, J. A design of PAL with astigmatism. In Proc. SPIE 9618, 2015 International Conference on
Optical Instruments and Technology: Optical Systems and Modern Optoelectronic Instruments, 961819 (5 August 2015).
20. Gifford, K. L. et al. IMI—Clinical management guidelines report. Investig. Ophthalmol. Vis. Sci. 60, M184–M203 (2019).
21. Leung, T. W., Lam, A. K., Deng, L. & Kee, C. S. Characteristics of astigmatism as a function of age in a Hong Kong clinical popula-
tion. Optom. Vis. Sci. 89, 984–992 (2012).
22. Thibos, L. N., Wheeler, W. & Horner, D. Power vectors: an application of Fourier analysis to the description and statistical analysis
of refractive error. Optom. Vis. Sci. 74, 367–375 (1997).
23. Andre, B. J. Characterization of the optical properties of progressive addition lenses (PALs) using root mean square of the power
error (RMSPE). College of Optometry. 1. https://commons.pacifi cu.edu/opt/1.
24. Thibos, L. N., Hong, X., Bradley, A. & Cheng, X. Statistical variation of aberration structure and image quality in a normal popula-
tion of healthy eyes. J. Opt. Soc. Am. A Opt. Image Sci. Vis. 19, 2329–2348 (2002).
25. Remon, L., Monsoriu, J. A. & Furlan, W. D. Influence of different types of astigmatism on visual acuity. J. Optom. 10, 141–148
(2017).
26. Thibos, L. N. & Horner, D. Power vector analysis of the optical outcome of refractive surgery. J. Cataract Refract. Surg. 27, 80–85
(2001).
27. Han, Y., Ciuffreda, K. J., Selenow, A. & Ali, S. R. Dynamic interactions of eye and head movements when reading with single-vision
and progressive lenses in a simulated computer-based environment. Investig. Ophthalmol. Vis. Sci. 44, 1534–1545 (2003).
28. Jia, Z., Kai, Xu. & Fang, F. Measurement of spectacle lenses using wavefront aberration in real view condition. Opt. Express 25,
22125–22139 (2017).
29. Troilo, D. et al. IMI—Report on experimental models of emmetropization and myopia. Investig. Ophthalmol. Vis. Sci. 60, M31–M88
(2019).
Acknowledgements
We thank Mr Zhang Yanlong and Mr Kong Bingyuan for their technical assistance in acquiring data from PALs.
Author contributions
E.D.L. and C.S.K. contributed equally to this manuscript.
Funding
Innovation and Technology Fund - Innovation and Technology Support Programme - Tier 2 (ITS/164/16FX).
Competing interests
The authors declare no competing interests.
Additional information
Supplementary Information The online version contains supplementary material available at https://doi.
org/10.1038/s41598-021-82697-0.
Scientific Reports | (2021) 11:2984 | https://doi.org/10.1038/s41598-021-82697-0 13
Vol.:(0123456789)www.nature.com/scientificreports/
Correspondence and requests for materials should be addressed to E.L.-A.
Reprints and permissions information is available at www.nature.com/reprints.
Publisher’s note Springer Nature remains neutral with regard to jurisdictional claims in published maps and
institutional affiliations.
Open Access This article is licensed under a Creative Commons Attribution 4.0 International
License, which permits use, sharing, adaptation, distribution and reproduction in any medium or
format, as long as you give appropriate credit to the original author(s) and the source, provide a link to the
Creative Commons licence, and indicate if changes were made. The images or other third party material in this
article are included in the article’s Creative Commons licence, unless indicated otherwise in a credit line to the
material. If material is not included in the article’s Creative Commons licence and your intended use is not
permitted by statutory regulation or exceeds the permitted use, you will need to obtain permission directly from
the copyright holder. To view a copy of this licence, visit http://creativecommons.org/licenses/by/4.0/.
© The Author(s) 2021
Scientific Reports | (2021) 11:2984 | https://doi.org/10.1038/s41598-021-82697-0 14
Vol:.(1234567890)You can also read