OPTIMISATION OF ASANKO'S OBOTAN SABC CIRCUIT TO ACHIEVE PROJECT 5 MTPA - Process IQ
←
→
Page content transcription
If your browser does not render page correctly, please read the page content below
OPTIMISATION OF ASANKO’S OBOTAN SABC CIRCUIT TO ACHIEVE PROJECT 5 MTPA

*R. Bradford1, W. Gift-Agbey1, E. Grobler2 D. Frost2, & P. Morgan2
1
 Asanko Gold
Ghana
2
 DRA Global
Johannesburg/Toronto

(*Corresponding author: russell.bradford@asanko.com)

Abstract

Asanko gold mine in Ghana started processing ore from the Nkran pit in January 2016 at a production nameplate
of 3 million tonnes per annum (Mt/a). The flowsheet is a conventional semi-autogenous grinding (8.6 m Ø x 4 m,
originally 5.6 MW) ball mill (5.8 m Ø x 9.1 m 5.6 MW) and pebble crusher (SABC) with gravity-gold and carbon-
in-leach (CIL) recovery. The nameplate production was comfortably achieved, so much so, that the SABC circuit
was capable of processing more than the downstream section of the plant. Consequently, a program of de-
bottlenecking was initiated to rectify volumetric capacity constraints. This program was later referred to as
Project 5 Million (t/a) or P5M. Having completed the de-bottlenecking exercise, it became evident that the SABC
circuit could not reach 5 Mt/a, on hard rock from Nkran. The new challenge was, therefore, to increase the
capacity of the milling circuit through a focused comminution initiative that would address the following:
geometallurgical treatment plan; upfront fragmentation requirements; installation of feed and mill monitoring
equipment; and integration of a knowledge-based control strategy. In this paper, the authors take the reader
through the various measures implemented to increase the milling rates and to create a stable/sustainable
control philosophy. As a result of the implementation of advanced mill performance monitoring technology
(MillSlicer) and the collaboration between a team of experts in comminution, control, and operations, the Asanko
process plant feed tonnage has increased from 3 Mt/a to 5 Mt/a.

Keywords

SABC 1, MillSlicer 2
Introduction

As part of the upgrade of the Asanko gold processing plant from 3 million tonnes per annum (Mt/a) to 5 Mt/a,
an optimisation initiative was formulated through a detailed definitive feasibility study (DFS) and front-end
engineering design (FEED). The exercise identified sections of the plant that would require modifications in the
form of either equipment volumetric increases or gravity-circuit upgrades.

The modifications included the following:

    •    Cyclone overflow and thickener underflow pipe diameter increases
    •    The addition of an additional Knelson concentrator into the grinding circuit
    •    The upgrade of the cyclone feed pumps
    •    An additional tailings line and pump train feeding to the tailings storage facility (TSF)
    •    An increase in screen aperture for the inter tank CIL screens
    •    An additional 5-tonne oxygen plant.

Despite these modifications, from the mill discharge to the tailings line, the required mill feed rate could not be
consistently achieved predominantly due to the following reasons:

    •    Considerable variation in ore hardness and run-of-mine (ROM) feed size distribution
    •    Ineffective over- or under-predicted corrections and interventions made by the operators of the
         supervisory control and data acquisition (SCADA) control system.

In reality, the mill throughput rate decreased. Consequently, a detailed, focused program was initiated to
optimise the mill throughput rate and take full advantage of the newly modified processing plant. This paper
details the reasoning and actions taken by the implementation team to increase grinding circuit throughput rates
and to create a stable/sustainable process control philosophy.

Circuit Optimisation Steps

ORE FEED VARIABILITY – DEVELOPMENT OF THE GEO-MATRIX
It was acknowledged that the SABC circuit is highly sensitive to variations in plant feed ore hardness and
fragmentation. These two predominant factors needed to be understood in the context of maintaining stable
circuit performance and higher than rated name-plate capacity.

The Nkran Pit along and neighbouring satellite open-cast mines have been frequently tested for comminution
variability as the mine development progressed. Typically, the Bond ball work index (BBWi) is taken for rapid
turnaround and benchmarking purposes. Various comminution studies were undertaken to develop a milling
model that can effectively describe the SABC circuit performance. The most influential testwork in this regard
involved the DRA grind mill apparatus at ALS Perth, from which the Dynamite Hill and Esaase-Obotan deposits’
composite results were used to describe the breakage rates trend (through energy-based population balance
modelling) in relation to top size, for a particular ore hardness (Hinde et al., 2001). Figure 1 shows the variation
extrapolated to ascertain the peak specific breakage rates at typical SAG mill feed top sizes.

1 | SAG CONFERENCE 2019 VANCOUVER | SEPTEMBER 22–26, 2019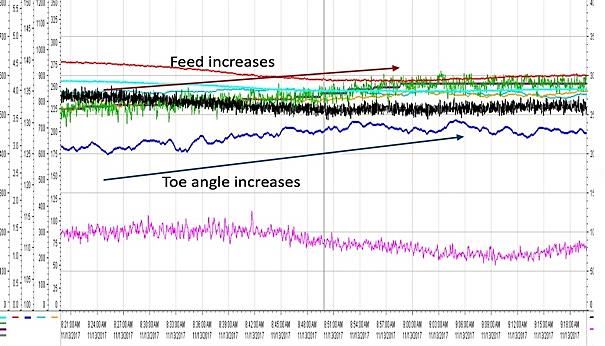
Figure 1 – Peak Specific Breakage Rate Variation with Top Size for Asanko Ores

A number of plant audits were then undertaken to assess the validity of the milling model developed. It became
apparent that the Obotan circuit could achieve better performance and higher capacity through optimisation
and improved controls.

Figure 2 shows a database of a BBWi sample population, which was gradually accrued over time and is used to
describe the variation in hardness that may be encountered. Later on, certain hardness’ were attributed to
specific ore facies and mapped across the Nkran Pit, to develop a comminution “geo-matrix” that could assist
with production forecasting by estimating future development blocks and plant feed hardness.

2 | SAG CONFERENCE 2019 VANCOUVER | SEPTEMBER 22–26, 2019
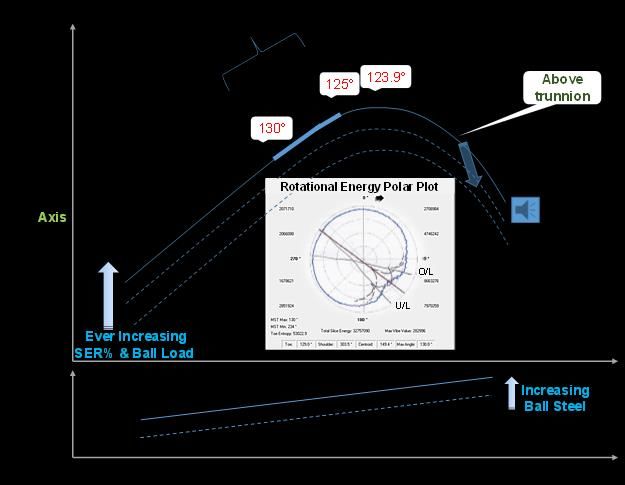
Figure 2 – Nkran Bond Ball Work Index Database Population

The degree of variation in hardness S-curve is typically between 10 kWh/t and 20 kWh/t, approximately a
10 kWh/t spread, which is a two-fold order of magnitude, but not necessarily weighted similarly in terms of actual
production tonnes.

Taking into account this latitude of variation, it was clear that the plant’s capacity would be affected by changes
in hardness, but also by the effect of fragmentation reporting to the SAG mill. Through the resultant simulations,
a validated mill model was created, which included pebble crushing performance and gave way to a simple
formula that estimates potential feed capacity using ore hardness and the degree of fragmentation (% -80 mm).
The relationship between BBWi and forecast SABC feed tonnage was found to be linear for a typical jaw crushed
run-of-mine (ROM). Each shift this information is relayed into a crusher feed plant which assists with blending
based on hardness (BBWi) and predicts the tonnage that can be achieved for that shift.

The team realised that the percentage of minus 80 mm material could be improved by secondary crushing a
proportion of the feed. In this way, SAG mill throughput could be increased, and a healthy SAG mill charge could
still be maintained. A series of mobile crusher pilot projects was undertaken to prove this theory and to establish
the full-scale potential requirements.

It was also apparent that it was necessary to operate the SAG mill at peak power in order to achieve optimal
circuit performance. To this end, the MillSlicer instrument provided by Pro-Op Industries was selected to monitor
the SAG mill load position and to optimise the SAG mill power condition.

3 | SAG CONFERENCE 2019 VANCOUVER | SEPTEMBER 22–26, 2019
Mill Power and Control System Optimisation

PRINCIPLES OF THE MILLSLICER
MineralScan’s MillSlicer is a mill performance monitoring instrument (Gugel and Forguson, 2018). The MillSlicer
effectively determines the average mill load toe angle relative to the 12 o’clock position of rotation, which can
then be used to manipulate the load characteristics to obtain the optimal angle. According to Hogg and
Fuerstenau (1972) and Morrell (1992), for empirical mill power draw estimates to converge under most operating
conditions, the optimal angle for peak power should be 123.9° from the vertical.

After a period of operation, it was realized that the mill load toe angle was responding in a manner similar to
Figure 3, which could then be used as a rules-based mechanism to adjust the mill feed tonnage to achieve the
optimum charge toe angle. An angle below 123.9° means that the mill is going into an overload condition, and
well above this is an under-loaded condition.

                      Figure 3 – Diagram of SAG Mill Response Characteristics with Toe Angle.
        Rotational Energy Polar Plot Extracted from Digital Control Lab Brochure (Gugel and Forguson, 2018)

The primary objective of the MillSlicer control system is to control the mill toe angle in order to optimise the mill
throughput. In order to control the mill toe angle, the system considers three basic input parameters, assuming
mill speed is fixed:

    •      Total new feed rate into the mill
    •      Percentage of new feed rate split between the two apron feeders
    •      Water fed into the mill.

4 | SAG CONFERENCE 2019 VANCOUVER | SEPTEMBER 22–26, 2019
The MillSlicer system controls the total feed rate automatically by adjusting the material throughput on each of
the two apron feeders feeding from the coarse ore stockpile. The percentage feed ratio of each feeder rate is
controlled manually by the operator, as it strongly depends on the size of the material on the stockpile. Material
segregation is dependent upon the mining method, origin of the material, and crushing deployed before material
is tipped onto the crushed ore stockpile. For this operation, larger coarse rocks are on the outer end of the
stockpile and are mostly fed via the outer feeder (Feeder #2), which is closest to the mill. The finer material is
commonly fed from the inner feeder (Feeder #1). The operator can adjust this ratio manually according to visual
inspection of the material segregation. Mill feed water is also controlled manually and is calculated from a
function that considers the type of material fed into the SAG mill. In essence, the moisture content is controlled
by this function.
Development of the Rules Based System (RBS) Control Philosophy
The first observation made when the control optimisation was attempted was the long reaction time of the mill
performance after a mill feed throughput change. Any attempt to adjust the PID loop was impossible, not only
due to these extended time constants (between two and four hours), but also because of the inconsistent mill
feed size distribution and feed material characteristics, which would change several times a day. Changing the
material composition has a significant impact on the control parameters of the system.
Operators attempted to optimise feed rate through audio observations (noise) and by making judicious
adjustments. However, the results achieved using this control methodology depended heavily on the operator’s
experience and interpretation of the process. During the study, researchers stopped the mill several times to
take samples and to determine the actual state of the mill through visual inspection. Overzealous adjustments
often caused mill overloads and the requirement for regular mill grind-outs resulting in loss of production.
Subsequently, a rules-based system (RBS) was implemented which continuously attempts to optimise the SAG
mill throughput by adjusting the maximum allowed material feed rate.
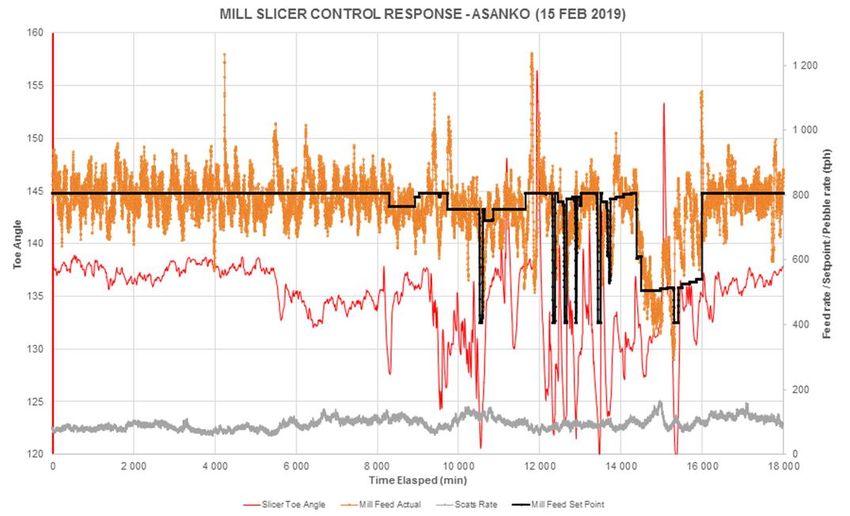
The RBS is used as the primary control loop and the original PID loop is only used to control the feed rate when
the toe angle overshoots or exceeds the toe angle set point. The practical observed reasoning behind this is that
once the toe angle set point is breached the mill goes into a grind-out phase. A grind-out phase reduces the feed
rate significantly (commonly, down to 40% of the normal mill target feed rate) for up to 45 minutes before a feed
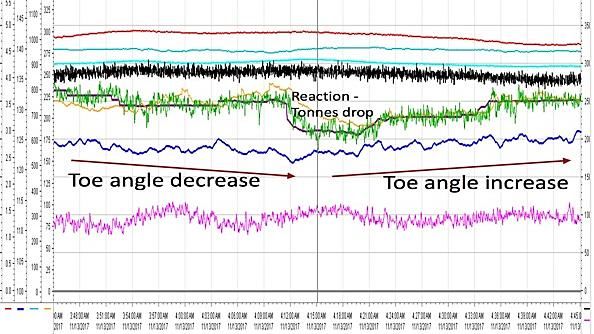
equilibrium is re-established. This is shown in Figure 4a.
a.) b.)
Figure 4 – Rule-based system (RBS) where the toe angle is used as primary process variable to optimise SAG
mill control stability: a.) Toe angle reduces as mill starts to “fill”. The PID loop drops the tonnes, waits, and
starts to increase again as toe angle increases. b.) Increased tonnage in a controlled manner.
5 | SAG CONFERENCE 2019 VANCOUVER | SEPTEMBER 22–26, 2019Figure 5 – Optimised Response and Feed Rate Control In order to achieve a sustainable and consistent mill throughput rate without “knowing” the material segregation and material type, the authors introduced several control limits and time constants as part of the RBS. A waiting period taken to note the impact of several consecutive lateral changes further improved the stability of the system and prevented the overloading condition of the mill. In conjunction with the slow reaction time of the above scenario, the RBS also introduced a fast-acting mode for when the mill is overloaded or in a grind-out state. This function drastically reduces the maximum feed rate increment by up to 20% and assists the mill to get out of the grind-out scenario much faster, and therefore with a reduced impact upon production. Once the mill recovers and the toe angle exceeds a toe angle set-point, which is defined as one of the set-point bands, the control again enters the normal control mode, but with a reduction in maximum permissible feed rate being set as the new starting point of control. Monitoring the trends of the toe angle and keeping step-wise adjustments conservative over longer time intervals proved to be good strategy to optimise the mill throughput. In order to assist the RBS, the authors also introduced a maximum calculated feed rate for each shift. This maximum feed rate is calculated from the metallurgical properties of the stockpile material (geomet model). The RBS uses this as a basis for its calculations and continuously adjusts the maximum feed rate depending on the rules specified for the specific band and rate of change. The result of the RBS, where the toe angle is used as the primary process variable, is a significant improvement in control stability noted where physical measures are used to improve the mill throughput strategy, shown in Figure 4b. Furthermore, little or no human interpretation and intervention are required to control the mill feed rate. The overall result was a sustained and substantial improvement in overall SAG mill throughput rates and mill efficiency. 6 | SAG CONFERENCE 2019 VANCOUVER | SEPTEMBER 22–26, 2019
Datum and Adjustments Made to Improve MillSlicer Control

At very low-ball charge loads the MillSlicer response is dull and unresponsive. After several days of first operating
with the MillSlicer, the team realised that the response could be improved by increasing the ball charge load in
the mill to raise the acoustic response and raise peak power close to the 5.6 MW rating.

After taking mill load measurements, the authors realised that the mill motor power was the limiting factor and
a larger motor together with variable speed drive (VSD) could further improve circuit capacity. A decision to
change the motor from 5.6 MW to 6.5 MW was made and was instituted in early 2018.

A SAG mill feed rate set-point algorithm was developed to “drive and maintain” the highest feed rate possible
and slaved to achieve the desired toe angle, given:

    •    The limitations and constraints of the circuit as a rules-based monitoring system
    •    The response characteristics shown in Figure 3.

Over time, the filters and response intervals for the set-point changes were finely tuned, and eventually a good
control strategy was developed. The maximum feed rate set-point possible (or Upper Clamp UC), was pre-set
daily and kept in line with the geomet model formula derived from knowing the BBWi and % -80 mm of the
incoming feed stream. Typically, a mining block campaigned for production has its BBWi determined according
to the geomet model.

Early findings indicated that the plant was achieving between 96% and 99% of theoretical throughput when
under MillSlicer automated control. This predictability was used to formulate the milling budget based on the
hardness of each rock type to be processed during that particular year. Using the ore type mix based on the
mining schedule one can predict the tonnage that can be processed at that point in time. Milling rates are
predicted based on hardness and required fragmentation into the mill.

Following a full shell relining, mill power development is physically reduced and limited as a consequence of
reduced effective mill diameter (typically 600 kW to 800 kW). The degree of scatter of load toe angle
measurement also increases and attenuates over time as the liners wear in. Given this well known phenomenon,
the nearness of operating close to the optimum angle with little to no liner wear meant that the toe angle set-
point could be set just below the optimum angle position and safely pulled out of an overload condition, due to
the aggressiveness of the newer lifter profile. Whilst still in the learning stage of automated control operation,
the authors anticipate that the desired toe angle set-point will gradually need to be increased over the liner’s life
as the potential for power draw increases, shown in Figure 5.

7 | SAG CONFERENCE 2019 VANCOUVER | SEPTEMBER 22–26, 2019
Figure 6 – Anticipated Toe Angle Set-point Variation with Liner Life
The response of the MillSlicer is sensitive enough to indicate when ball rationing is required, and subsequently
lead to a regime of adding grinding balls every day on morning shift to maintain a steady ball charge. Planned
stoppages allow for the SAG mill load and ball charge to be checked and kept in line with estimated wear rates
to maintain stable load conditions. The ball loading in the SAG has increased from 14% to 17% v/v and ball size
optimisation on the ball mill has improved grind response. The SAG grate discharge port slots were increased by
35% in size to assist in the discharge of material from the SAG to the pebble crusher.
Summary of Results and End Performance
As a result of the complement of work completed by a dedicated mill team, the study resulted in a significant
increase in throughput. Part of the success in the mill throughput increase has been the site team’s dedication
and commitment to short-term interval control on all sections of the plant. Understanding the sensitivities and
translating these into actionable plans/requirements and modifications was a steep learning curve. Figure 6
illustrates the step-wise increase in mill performance the commissioning team achieved. Actual mill throughput
now exceeds the plant upgrade target of 5 Mt/a.
Feed Rate, t/h - Jan'17 to Feb' 19
800
700
600
500
400
300
Feb-17
Mar-17
May-17
Jul-17
Oct-17
Nov-17
Mar-18
May-18
Jul-18
Oct-18
Nov-18
Jan-17
Apr-17
Jun-17
Aug-17
Sep-17
Dec-17
Jan-18
Feb-18
Apr-18
Jun-18
Aug-18
Sep-18
Dec-18
Jan-19
Feb-19
Figure 7 – Production Rates
8 | SAG CONFERENCE 2019 VANCOUVER | SEPTEMBER 22–26, 2019All the plant modifications made to date have been stressed tested at a 5 Mt/a rate with no problems to report.
In light of this success, further modifications were implemented in support of the new higher mill throughput
including the following:
• A dedicated mobile crushing circuit for each ore type, either oxide, fresh ore, or Granite. Each rock
type is fed into its own dedicated designed mobile crushing unit with a fit for purpose comminution
circuit. This has contributed to achieving required mill feed fragmentation levels required.
• A Lynxx Imaging camera system, which can measure and report the mill feed size distribution, was
commissioned, and linked to the SCADA plant control system
• A shiftily crusher feed plan which reports the feed hardness blend. This is checked against the
Geometallurgical model to ensure at that particular hardness the correct fragmentation can be
achieved.
Conclusion
Several modifications were successfully installed and de-bottlenecked in preparation for the increased tonnages
through the mill. The Asanko process plant feed tonnage has increased from 3 Mt/a to 5 Mt/a by means of: a
focused and systematic team approach; implementation of a geometallurgical treatment plan; installation of mill
feed monitoring equipment; SAG mill toe angle measurement (MillSlicer); and integration of a knowledge-based
control strategy.
Acknowledgements
A great deal of gratitude goes to the Asanko Gold Mine personnel for their dedication and hard work they
contributed to achieving P5M.
This paper was first published by AusIMM for the Mill operators conference in Brisbane August 2018 and has
been updated to include current operating performance information. The author would like to acknowledge
AusIMM for allowing this paper to be reprinted with the permission of The Australasian Institute of Mining and
Metallurgy.
References
Gugel, K., & Forguson, S. (2018). MillScan MillSlicer – Comprehensive mill vibration analysis brochure [online].
Retrieved from: http://www.totalmetric.cl/MSlicerBrochure_V3.pdf [Accessed: 24 April 2018].
Hinde, A., Wiseman, D., Hand, P., & Morgan, P. (2001). Using the world’s most popular software for design and
optimisation of crushing and grinding circuits. Conference, crushing and grinding in mining conference,
Johannesburg, South Africa: in Proceedings 3rd IRR.
Hogg, R., & Fuerstenau, D. W. (1972). Power relationships for tumbling mills. Trans. SME-AIME, 252: 418–423.
Morrell, S. (1996). Power draw of wet tumbling mills and its relationship to charge dynamics – Part 1: A
continuum approach to mathematical modelling of mill power draw. Trans. Inst. Min. Metall., Sect. C
105: 43-53.
9 | SAG CONFERENCE 2019 VANCOUVER | SEPTEMBER 22–26, 2019You can also read