OPTIMIZATION OF A DISTRICT ENERGY SYSTEM IN ZARAGOZA (SPAIN) - DEPARTMENT OF TECHNOLOGY AND BUILT ENVIRONMENT
←
→
Page content transcription
If your browser does not render page correctly, please read the page content below
DEPARTMENT OF TECHNOLOGY AND BUILT ENVIRONMENT

      OPTIMIZATION OF A DISTRICT
      ENERGY SYSTEM IN ZARAGOZA
               (SPAIN)

                Natalia Moreno Bruned

                       June 2009

           Master’s Thesis in Energy Systems
            Supervisor: Alemayehu Gebremedhin
             Examiner: Alemayehu Gebremedhin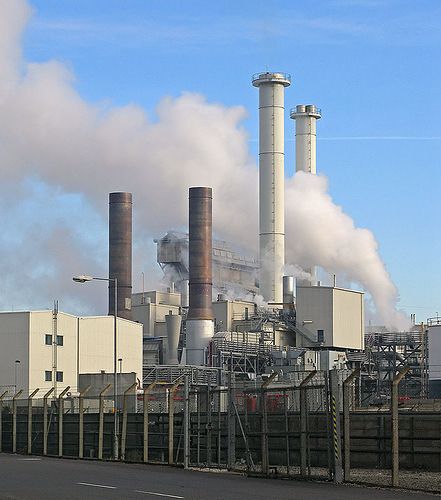
Preface

This project has been carried out as the final thesis of the Master’s Programme in Energy
Systems at the University of Gävle (Sweden).

Firstly, I would like to give my most sincere thanks to my lecturer Miguel Ángel Lozano from
the University of Zaragoza (Spain) for the excellent guidance given to me throughout the
development of the thesis. This project has been possible thanks to his involvement in the
research work. His support and advice was most helpful. I would also like to thank my
supervisor at the University of Gävle, Alemayehu Gebremedhin, whose attention, comments
and advice have been of great help. Furthermore, I would like to thank all the other people
involved in this project for their support and cooperation who have not been mentioned.

Finally, I would like to give special thanks to my family, my friends and my boyfriend Ángel;
whose moral support and understanding during my study years has been a great help. They
encouraged me when I decided to study abroad for one year because they knew that it would
be an incredible experience for my personal, professional and human enrichment.

June 2009.

Thank you,

Natalia Moreno Bruned
Abstract
The main objective of the present thesis is to study the design and optimization of a district
energy system. The system is designed to meet the energy demand of a housing development
located in the city of Zaragoza (Spain). The trigeneration system supplies domestic hot water,
heating, cooling and electricity to the community. The area is supposed to be composed of a
number of residential buildings, a hospital, a hotel and a school. The energy needs are
provided by a CHP plant combined with several cooling machines. The selected equipment as
well as the way of operation has been decided upon by using an optimization program called
MODEST (Model for Optimisation of Dynamic Energy Systems with Time dependent
components and boundary conditions). MODEST is a model based on linear programming
which is used for optimizing energy systems. The program optimizes the energy system in
order to meet the three types of demands within the area: heating, cooling and electricity. The
result of the optimization gives the most cost-effective combination of equipment and fuels
throughout the year to meet the energy demand.

Furthermore, district energy systems provide a good solution to take advantage of the
installed power in the CHP plant. Cogeneration systems combined with absorption machines
enable the excess heat from electricity production, which is often a problem during the warm
season, to be used. This waste heat fuels absorption chillers to generate cooling. However, the
cooling capacity needed in some periods is higher than the power required for the production
of heat. Thus, it is more suitable to combine absorption and compression cooling possibilities.

The problem has been solved by comparing the optimisation results of two different scenarios:
first, considering the option of installing a gas turbine CHP combined with a small gas engine
CHP and second the assumption of only gas engine CHP technology. Both systems have been
compared from energy and economic perspectives. The final conclusion is that the scenario
composed only of gas engine CHP is much more efficient as well as being a bit cheaper
annually. Moreover, environmental effects are also taken into account when the decision is
made.

Broadly speaking, the introduction of a district energy system in Spain offers a great
opportunity to promote the use of efficient technology in the residential sector by installing
CHP systems combined with absorption possibilities. These systems provide a big potential to
decrease greenhouse gases emissions; contributing to the fight against climate change.
However, an important effort by the authorities will be necessary to support district systems
and to change the current attitudes of society. Citizens must be made aware of environmental
problems and real needs of using renewable and efficient energy.
Abbreviations
AM       Absorption Cooling Machine

BOE      Boletín Official del Estado (Official State Bulletin)

CHP      Combined Heat and Power

CHCP     Combined heating, cooling and power generation

CM       Compression Cooling Machine

CNE      Comisión Nacional de la Energía (Nacional Energy Comisión)

COP      Coefficient of Performance

CTE      Código Técnico de la Edificación

DC       District Cooling

DH       District Heating

BB       Biomass boiler

GB       Gas Boiler

GT       Gas Turbine

GE       Gas Engine

IDEA     Instituto para la Diversificación y Ahorro de la Energía

MODEST   Model for Optimization of Dynamic Energy Systems with Time dependent

         components and boundary conditions

MPa      Megapascal

MW       Megawatt

MWh      Megawatt Hour

O&M      Operating and Maintenance

OMEL     Operador del Mercado de Energía

RD       Royal Decree

REE      Equivalent Electric Efficiency

TOE      Ton Oil Equivalent
Table of contents

1.  Introduction.............................................................................................................. 1
  1.1. Background....................................................................................................... 1
  1.2. Objective........................................................................................................... 1
  1.3. Limitations ........................................................................................................ 1
2. Literature study ........................................................................................................ 2
  2.1. District heating and district cooling.................................................................. 2
    2.1.1.    District heating ......................................................................................... 2
    2.1.2.    District cooling.......................................................................................... 4
    2.1.3.    Environmental effects .............................................................................. 4
    2.1.4.    Situation of district energy system in Spain ............................................. 5
  2.2. Cogeneration and trigeneration....................................................................... 7
    2.2.1.    Cogeneration ............................................................................................ 7
    2.2.2.    Trigeneration .......................................................................................... 10
    2.2.3.    Efficiency parameters of cogeneration Systems .................................... 11
    2.2.4.    Environmental and economic advantages ............................................. 12
    2.2.5.    Development of cogeneration in Spain.................................................. 12
  2.3. Combined Heat and Power technology.......................................................... 18
  2.4. Cooling techniques: Compression and absorption systems .......................... 20
    2.4.1.    Compression cooling .............................................................................. 20
    2.4.2.    Absorption cooling ................................................................................. 21
  2.5. Biomass in Spain ............................................................................................. 24
  2.6. Current heating and cooling systems in Spain ............................................... 26
  2.7. Electricity market in Spain: Special Regime.................................................... 29
3. Method ................................................................................................................... 31
  3.1. Gathering of facts ........................................................................................... 31
  3.2. Gathering of data............................................................................................ 31
  3.3. MODEST software........................................................................................... 32
  3.4. Scenario modelled .......................................................................................... 33
  3.5. Sensitivity analysis .......................................................................................... 33
  3.6. Limitations ...................................................................................................... 34
4. System description ................................................................................................. 35
  4.1. Location of the urbanization .......................................................................... 35
  4.2. Description of the urbanization...................................................................... 36
  4.3. System model ................................................................................................. 37
  4.4. Input data ....................................................................................................... 38
    4.4.1.    Demand characteristics .......................................................................... 38
    4.4.2.    Equipment prices and characteristics .................................................... 42
    4.4.3.    Fuel prices............................................................................................... 42
5. Results of the optimization .................................................................................... 44
  5.1. Scenario modelled .......................................................................................... 44
    5.1.1.    Components of the system .................................................................... 44
    5.1.2.    Energy consumption............................................................................... 45
    5.1.3.    Production of heating, cooling and electricity ....................................... 46
    5.1.4.    Duration graphs...................................................................................... 49
    5.1.5.    CO2 emissions ......................................................................................... 50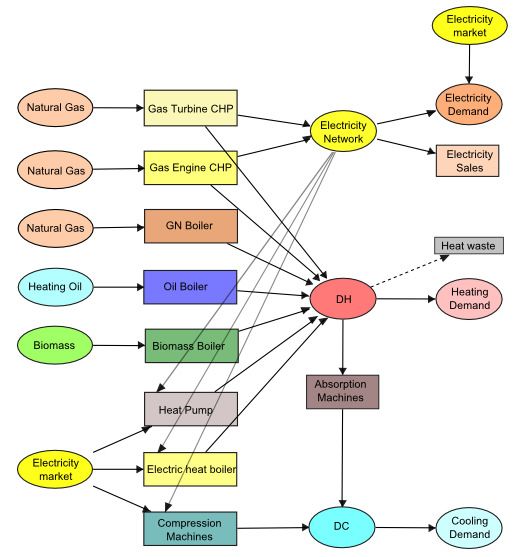
5.1.6.      System cost............................................................................................. 50
    5.1.7.      Alternative operation ............................................................................. 50
    5.1.8.      Calculation of the REE............................................................................. 51
    5.1.9.      Energy analysis ....................................................................................... 51
    5.1.10. Economic analysis................................................................................... 52
    5.1.11. Sensibility analysis .................................................................................. 53
  5.2. Alternative scenario........................................................................................ 54
    5.2.1.      Components of the system .................................................................... 55
    5.2.2.      Energy consumption............................................................................... 56
    5.2.3.      Production of heating, cooling and electricity ....................................... 58
    5.2.4.      Duration graphs...................................................................................... 60
    5.2.5.      CO2 emissions ......................................................................................... 61
    5.2.6.      System cost............................................................................................. 61
    5.2.7.      Alternative operation ............................................................................. 62
    5.2.8.      Calculation of the REE............................................................................. 62
    5.2.9.      Energy analysis ....................................................................................... 62
    5.2.10. Economic analysis................................................................................... 63
6. Discussion and conclusion ...................................................................................... 65
References ...................................................................................................................... 68
Appendixes ..................................................................................................................... 72
  Appendix A.................................................................................................................. 72
  Appendix B.................................................................................................................. 75
  Appendix C.................................................................................................................. 76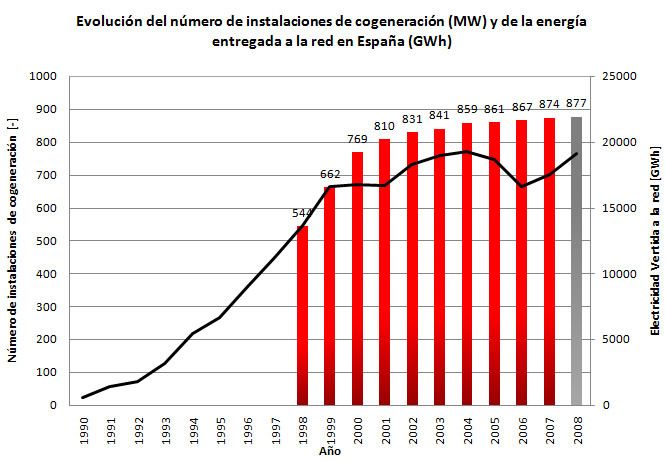
1. Introduction

1. Introduction
This chapter gives an introduction to the issue of the thesis. The background describes why the
issue is interesting to investigate; followed by the main purpose of the analysis. Further on in
this section a brief explanation of the main limitations found during the work is given.

    1.1. Background
In Spain, the current situation is that heating and cooling demand is met by individual systems.
In the great majority of the cases, boilers and small air conditioning equipment are installed in
each dwelling or building. This results in high fuel and electricity consumption. The idea of the
thesis is to study the possibility of installing district energy systems that supply energy to a
residential area. This type of system has been widely used around the world but its
introduction has been slow in Spain, where only a few of these systems have been installed.
The intention of district energy systems is that the energy is produced centrally and then
distributed to all the users in the area through a shared infrastructure. In this way, it is possible
to use efficient technology such as cogeneration systems, thereby decreasing fuel
consumption and environmental effects.

On the other hand, the climatic change due to the increase of greenhouse gases in the
atmosphere is an important preoccupation for Spanish authorities. They support renewable
energy and efficient technology concepts by means of economic incentives.

    1.2. Objective
The main objective of the thesis is to promote the introduction of district energy systems in
Spain as a way of replacing current individual systems. The present work analyses the
possibility of installing a central system that produces heating, cooling and electricity to meet
the energy demand of a residential area composed of diverse types of building with different
final functions. The thesis is based on the design and optimization of a district energy system
located in Zaragoza (Spain). The energy system is optimised by using an optimization program
called MODEST that helps to decide the type of components and fuels used as well as the most
profitable method of operating. Furthermore, it is desirable that the system is efficient and
environmental friendly.

    1.3. Limitations
The first limitation of the work was to find reliable input data about the several types of energy
demand of the considered buildings. It was a complicated task involving a great deal of time
because it is not usual to register the hourly energy consumption of a place. The types of
buildings included in the urbanization have been defined taking into consideration the
available input data. Furthermore, it proved extremely difficult to collect all the input data
about the technology and fuels used in these types of systems as well as to adapt them for use
in MODEST software. Finally, it was necessary to build a simulation model, to overcome
various problems, which were ultimately resolved by this means.

More limitations and assumptions made during modelling are described in detail in the section
3.6. Limitations.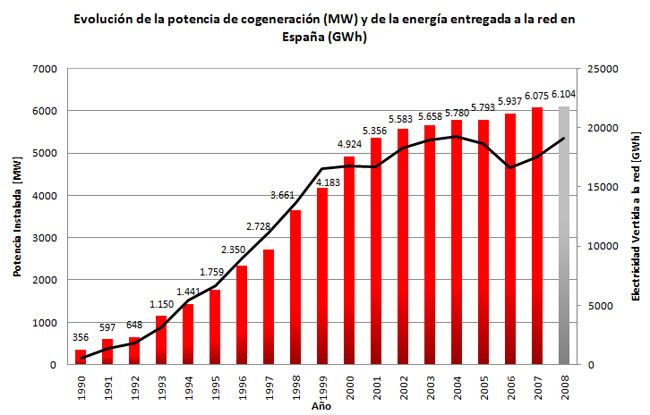
2. Literature study

2. Literature study
The study of available literature is an important aspect in order to acquire a deep knowledge
about the topic to be developed during this thesis. A detailed study must be done in order to be
able to analyse the situation and to make conclusions. This section presents the literature that
has been studied to make the evaluation. First, a description of DH and DC systems is given
followed by an explanation about cogeneration and trigeneration. Next, the CHP technologies
and the different cooling techniques are analysed.

    2.1. District heating and district cooling
District heating and cooling systems are thought to be one of the most outstanding ways to
maximise the efficiency of processes that are used to produce heating and cooling. They allow
an electricity generation process to be optimised by using CHP plants that save energy.
Furthermore, different types of fuels can be used to produce it, increasing fuel flexibility and
providing opportunities for introduction of renewable energy sources as well as industrial
waste heat.

        2.1.1.        District heating
District heating represents a type of energy which is thought to be cleaner. It is produced in an
efficient and cost-effective way. Heat generation is centralized and DH is delivered to
residential homes and commercial buildings in a certain area. DH systems can provide both
space heating and hot water. [IEA DHC, 2009]

District heating uses water that is centrally heated and distributed through a pipe-system to
individual users in areas of high concentration of activities and housing. In large cities several
thousands of users can be connected to the system. In DH systems, heat is supplied to all
customers in the city through a supply pipe in the ground and distributed to all substations of
the houses which are connected in parallel between the supply pipe and the return pipe. DH
delivers heat in services pipes to the house heating system and to the tap hot-water system by
means of district-heating substations. The water then returns to the plant to be heated again.
Any district heating network is composed of three main sectors: production, distribution and
market (customers). [IEA DHC, 2009]

District heating presents a number of advantages which have contributed to its quick
development all over the world. It offers flexibility for heat production and enables combined
heat and power production. Technically, larger system results in better efficiency and lower
specific costs. What is more, the plant can use many types of fuels; it is possible to use local
energy sources, such as biogas or wood fuel. It can also absorb low grade heat sources such as
garbage burning or industrial waste heat, which are released to the environment in countries
that do not use DH system. Thus, it is an environmentally friendly way to heat houses,
buildings and schools. [Danfoss, 2009]

DH network is made up of with steel pipes with a compound integrated plastic jacket (jacket
pipes). Pipes have to be installed in order not to move too much in the ground when they are
heated up. In smaller systems, pipes make of flexible copper or plastic can be used, which are
more simple and cheaper to install. However, plastic pipes have a limited pressure of 6 Bar and
temperature of 90°C.

                                                                                                2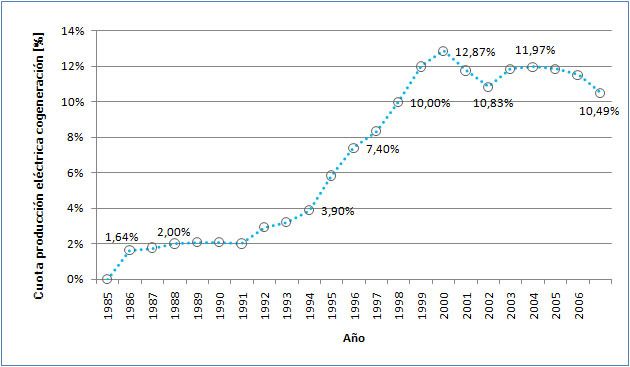
2. Literature study

The temperature of supply of DH depends on the expected load, which is a function of the
outdoor temperature. Figure 1 shows typical DH-temperatures in supply and return pipes.

                 Figure 1: District heating temperatures. Source: Zinko, H., 2008

Some typical design values in northern countries can be pressure of 1,6 MPa (16 Bar),
temperature of approximately 120 ºC (130 – 140 ºC) and flow velocity from 1 m/s in smaller
pipes to 2 m/s in larger pipes.

The pressure of the water in the pipes drops due to the friction in the pipes. Therefore, the
pressure difference is measured at a distant point away from the plant. If the pressure
difference is too small, the pump is ordered to deliver a higher pressure. Control valves in the
substations control the flow to each load and temperature sensors at the customer demand
side control the amount of flow which is necessary in order to heat the water to the desired
temperature. The temperature of radiators which is the temperature of the DH supply pipe is
controlled according to the outdoor temperature. At the heating plant, there is only one pump
which pumps all the water needed by the whole city. [Zinko, H., 2008]

Heat losses of a district heating system are presented in Figure 2. The most significant losses
are due to distribution of DH.

                                                              •   Production losses 8 - 12 %
                                                              •   Distribution heat losses 10 - 20 %
                                                              •   Customer losses 5 - 10 %

Figure 2: heat balance in district heating system. Source: Zinko, H., 2008

A successful district heating system requires both a cheap local energy source and a heating
market. For example, the most used energy sources in Nordic countries are: waste heat from
power generation in Denmark and Finland, geothermal energy in Iceland, waste heat from
incineration in Norway and a mixture of several energy sources in Sweden. [Nordvärme, 1996]

District heating systems have been built all over the world. In Europe, DH has been introduced
into many countries. Some of them are mentioned as follows. In Sweden, DH has reached a
significant position with a high penetration in the heat market. The total DH production is

                                                                                                   3
2. Literature study
estimated to 50 TWh per year. It is produced by CHP plants using a mixture of heat sources in
order to reduce fuel oil dependence; main fuels are coal, wood chips, peat, heat from waste
incineration and waste heat recovered from industrial processes. In Austria, the largest district
heating system is in Vienna producing 5163 GWh per year in 2005, using 22 % heat from waste
incineration and 72 % from waste heat from municipal power plants and large industrial
plants. In Denmark, DH has been installed in the main cities; it produces more than 60% of
space heating and water heating by generating 82.4% of it in CHP plants. In Finland, district
heating represents 50% of the total heating market, produced mainly by cogeneration plants.
In Germany, the largest DH network is located in Berlin. The total connected heat load is
around 52.729 MW and 83% comes from CHP plants using mainly natural gas and coal. In
Iceland, DH has the highest penetration covering 95% of the demand and it is produced from
geothermal energy. Other countries that use district heating are Italy, Norway, Russia, Serbia
and the United Kingdom. Moreover, district heating is also used in the United States, Canada
and Japan. [Wiki DH, 2009]
2.1.2. District cooling
Nowadays, cooling demand requires much more energy than heating. Hence, district cooling
has been developed quickly. DC networks operate in the same way as district heating
networks. Water is chilled centrally and then distributes to multiple buildings through an
underground pipe network. This cold water is used in cooling processes of industry or to create
thermal comfort in residential housing, shops or offices. The cooling is provided from a cooling
plant where it is centrally produced in an efficient way. In this way, it is possible to eliminate
the need for individual traditional air conditioning systems in buildings. [Danfoss, 2009]
Chilled water supplied by DC systems may be produced by different techniques. The most
common ways are compression cooling and absorption cooling. Usually, a mix of techniques is
used to get the optimal solution. In Europe, several sources are used to produce cold water,
such as cold sea or lake water, but also DH and industrial waste heat that fuel absorption
machines [Danfoss, 2009]. A competitive way is to use heat produced by CHP plants with high
combined efficiency. So, thermal energy turns into cold water by means of absorption cooling
chillers. It is also useful to take advantage of heat production during hot seasons. [Nccc, 2009]
Basically, a DC system consists of three main components: the central plant including power
generation, cooling equipment and thermal storage; the distribution network and the
consumer system which is composed of air handling units or fan coils and chilled water piping
in the buildings. [Nccc, 2009]
Furthermore, district cooling offers a good opportunity to reduce electricity consumption;
decreasing it by more than 65% compared to traditional air conditioning systems. As well as
being a technology with minimum environmental impact that uses energy efficiently and with
low air emissions. [Danfoss, 2009]
2.1.3. Environmental effects
District heating and cooling system are thought to have a big potential to reduce greenhouse
gas emissions. This importance has been accepted in many member countries where they are
introducing these types of systems as well as other technologies to reduce environmental
impact. It provides an attractive solution for meeting environmental targets established by the
Kyoto protocol.
42. Literature study
District systems offer an excellent opportunity for reducing environmental pollution and saving
energy. These systems let one use flexible technology such as combined heat and power which
works with any fuel including renewable energy resources or industrial waste energy. [IEA
DHC, 2009]
2.1.4. Situation of district energy system in Spain
Because of Spain characteristics, the first district heating networks are starting to be
developed and they are mainly fuelled by biomass. They can be utilized to supply heat during
the cold period and to refrigerate in summer. At present, there are only a few small district
heating systems in Spain because DH systems are not commonly used as a heat production
solution. Some of them are going to be explained in this section. In the last part, the
development of a new project based on heating and cooling production is mentioned.
• Cuéllar Project (Segovia)
Cuéllar is a 10.000 inhabitant town sited 120 km north of Madrid, with numerous wood
industries in the area. The district heating system is based on a 5.95 MWth plant with two
wood waste boilers. It supplies hot water for heating and sanitary water by using the waste
from those mills. The system supplies district heating to more than 1000 inhabitants (15
detached houses, 5 blocks of flats and some municipal buildings: a sports’ centre, a library and
a public school for 500 pupils). The DH plant is fuelled by waste recovered from forest cleaning
as well as other types of biomass because the boilers are prepared to use bark, saw wood or
plywood as fuel indistinctly. In this case, the use of wood waste coming from nearby industries
(furniture, boards and other wood mills) facilitates a cheap energy source to feed both boilers:
a 5,25 MW unit for winter heating and a 0,7 MW unit for sanitary water in summer. The DH is
distributed to the users through pre-isolated piping, with a heat counter in each one for
municipal invoicing.
The plant is maintained by the city council with the collaboration of Valladolid University,
whose technical department gets and analyses the results, advising IDAE and EREN about
eventual corrections and improvements in the system. The main aim of the IDAE was to study
the feasibility and real exploitation conditions for this type of plant, to produce heating in cold
areas of Spain, where DH systems are not commonly used to produce heating. The project
implementation took 9 months, and started to operate in March 1999. [Heymo, 2009]
Figure 3: DH system in Cuéllar. Source: Heymo, 2009
52. Literature study
• Sant Pere de Torelló Project (Barcelona)
The first district heating system was built in 1993 in Sant Pere de Torrelló (Barcelona). It is a
biomass plant that consumes between 6.000 and 7.000 tons per year of biomass. The system
supplies district heating to 540 of the 800 homes in the municipality.
Figure 4: DH system in Sant Pere de Torelló. Source: Solé, 2009
In the future, this system might be substituted by a new cogeneration plant because the old
one is inefficient both from the point of view of energy and economy. The CHP plant will
produce district heating and electricity to meet the demand of the area, which is estimated to
be 4.5 MWe. The total power generated will be 5.4 MWe. [Biomasa, 2009] [Solé, 2009]
• Molins de Rei Project (Barcelona)
This district heating system was built in Molins de Rei (Barcelona). It is based on a mobile grate
boiler of 2 MW and a biomass boiler of 1.7 MW which is fuelled by 3.000 tons of wood waste
per year. It reduces the production of 3.000 tons of CO2 annually. The system produces heat to
supply hot water and heating to 700 dwellings. [Biomasa, 2009] [Solé, 2009]
Figure 5: DH system in Molins de Rei. Source: Solé, 2009
62. Literature study
• Tub verd Project - Mataró (Barcelona)
This system started working in 2003 and it supplies heat to several schools, the Mataró
hospital, the municipal swimming pool and a municipal sports’ centre which uses absorption
chillers during summer. In the near future, the system will meet the demand of several
dwellings. The total thermal power produced was 4.9 MWth in 2006. The system consists of a
Natural Gas engines CHP with an installed power of 6 MWe and furthermore, it recovers the
waste heat from waste mud drying. It is believed that the system will supply 12.000 MWh of
heat per year and it will prevent the production of 500 tons of CO2. The cost of the system is
estimated to be 3.630M€. [Biomasa, 2009] [Solé, 2009]
Figure 6: DH system in Mataró. Source: Solé, 2009
• Geolit Project (Jaén)
This project will be the first project developed in Spain that will produce hot and cold water.
The project is being developed in a Science and Technology Park in Mengibar (Jaén) and it will
cost 2,3 M€. It is a project that promotes the use of renewable energy sources and applies
energy efficient measures. The system is going to supply district heating and district cooling to
the buildings of the Park with an estimated total surface of 33.000 m2. The energy will be
supplied by two biomass boilers with a power of 3 MW each. The boilers will be fuelled by
more than 800 tons of biomass per year. The fuel used is olive chips, wood waste and other
types of biomass. The cooling will be produced by an absorption cooling plant [Biomasa, 2009].
2.2. Cogeneration and trigeneration
2.2.1. Cogeneration
Cogeneration (also known as Combined Heat and Power or CHP) is the process in which
electricity and heat is produced simultaneously, both used thereafter in different applications.
The fundamental principle of cogeneration is to maximise efficiency of systems by obtaining as
much final energy as possible from a fuelled plant. CHP can substantially increase the
efficiency of energy utilization, resulting in lower operating costs for the user. Systems should
be designed according to the heat demand of the application. This can be an individual
building, an industrial plant or a district heating and cooling system for a city. [Cogen, 2009]
72. Literature study
By producing heat and electricity at the same time, the efficiency of a cogeneration plant can
reach up to 90%. Therefore, CHP offers a big potential of energy saving which represents
between 15 and 40% compared to conventional systems. Traditionally, electricity and heat was
generated from separate conventional power stations and boilers. CHP uses the heat that
would be wasted in a conventional power plant to produce electricity. Consequently, less fuel
is consumed to produce the same amount of useful energy [Unep, 2009].
Figure 7 and Figure 8 illustrate the differences of power generation in a cogeneration system
compared to a conventional system.
Figure 7: Typical cogeneration scheme Source: Unep, 2009
Figure 8: Typical conventional power generation scheme. Source: Unep, 2009
The benefits that cogeneration offer society by optimising the energy supply are important.
Cogeneration is the most efficient way of power generation reducing environmental emissions,
in particular CO2 which is the main greenhouse gas. So, it becomes a helpful solution to
achieve the Kyoto Protocol targets. Moreover, cost savings are significant, providing additional
competitiveness for industries and domestic users. It offers also an opportunity to decentralise
electricity generation, providing that plant is designed to meet the needs of local consumers
with high efficiency, reducing transmission losses and increasing flexibility and security of
supply. In addition, cogeneration reduces the import dependency of fuels and promotes
liberalisation in energy markets. [Educogen, 2001]
End users with significant thermal and power needs can generate both thermal and electrical
energy in a single CHP system. Heat is generally recovered in the way of steam or hot water.
However, in some cases it can be used directly for applications such as heating or drying
processes. Apart from this, the waste heat can be utilized to drive equipment that is thermally
activated, such as absorption chillers for cooling. [Cogen, 2009b]
Important characteristics for CHP technology are:
• Annual operating hours: typically more than 6 000
• High thermal and power output resulting in high overall efficiency
• Low maintenance costs
• Low emissions
• High reliability
82. Literature study
Traditionally, CHP systems have been applied to larger industries with high steam and power
demands such as chemicals, paper or refining but also for institutional applications such as
universities and hospitals. Currently, a large potential can be found for smaller CHP systems in
light industrial or commercial and residential applications. Some important requirements to
consider before deciding to install a cogeneration system are: great amount of heat
consumption, fuel supply reliability and high utilization factor (>5 000 hours/year). [Unep,
2009]
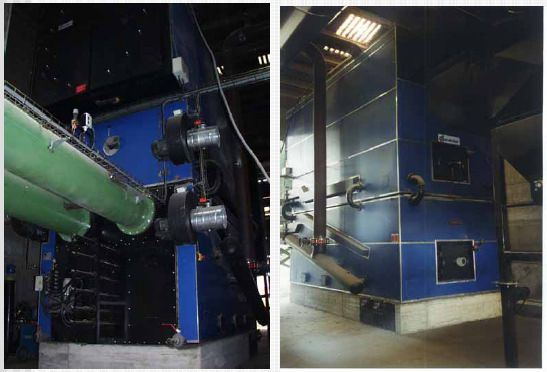
Figure 9: CHP plant in Winnington. Source: http://www.flickr.com
A cogeneration system can be classified according to three points [Lozano, M.A., 2008]:
1. Process sequence in heat and electricity production:
- Bottoming cycle: heat is produced first
- Topping cycle: electricity is produced first
2. Power generation capacity:
- Micro CHP: 50 MWe
3. Depending on the type of motor machine.
- Steam turbine
- Gas turbine
- Reciprocating engine
- Combined cycle
- Micro turbines
- Fuel cells
- Stirling engines
92. Literature study
2.2.2. Trigeneration
Trigeneration is a particular case of cogeneration in which waste heat from processes is
utilised to generate cooling by means of absorption chillers. It is the simultaneous production
of three types of energy: cooling, heating and electricity, by using only one fuel input.
Trigeneration is also known as CHCP that stands for combined heating, cooling and power
generation. A typical trigeneration plant can be described as a cogeneration plant that has
added absorption chillers. The system converts waste heat from the CHP plant into chilled
water. Four forms of energy can be obtained from this process: hot water, steam, chilled water
and electricity. [Trigen, 2009b]
Figure 10: Typical trigeneration system. Source: GEenergy, 2008
Trigeneration systems offer some advantages over conventional systems. The main factors
that support its development are global efficiency increase, reliability of energy supply and
decrease of annual costs. Generally, the global system efficiency of a trigeneration power plant
reaches values from 86% to 93% compared to 33% of a typical central power plant. Besides, it
is also more efficient than CHP plant. [Trigen, 2009]
Figure 11: Energy flows in a trigeneration system. Source: Trigen, 2009
102. Literature study
Cooling technology enables CHP plants to be used during warmer season, increasing
equipment utilization and reducing amortization period. Moreover, trigeneration is promoted
by The European Union because it is thought that it can help to reduce climatic change. It is
the most environmental friendly method of generating power and energy, especially when the
fuel source is Biodiesel or Biomethane. [Trigen, 2009]
Trigeneration systems are usually installed in hospitals, universities or groups of residential
and offices buildings. In this case, it is also referred to as a "district energy system" or
"integrated energy system". This possibility for supplying both heating and cooling for
buildings is really interesting, because these systems offer greater operational flexibility. This is
particularly relevant in countries where buildings need to be air-conditioned and industries
require process cooling. [Trigen, 2009]
There are different possibilities for refrigeration [GEenergy, 2008]:
• Absorption chillers:
- Operation with hot water
- Operation with steam
- Direct heat through combustion
• Compression-type refrigeration machines:
- Direct drive power
- Electrical drive power
2.2.3. Efficiency parameters of cogeneration Systems
It is necessary to define several parameters in order to value investment opportunity, select
the most adequate system and optimize its operation. Then, the cogeneration system is
supposed to be a black box in order to simplify the system. It consumes F units of fuel (lower
heating value - LHV) and produces W units of power and Q units of heat simultaneously. This
system is compared to a conventional system producing the same amount of heat and power
separately. [Lozano, M.A., 2008]
Figure 12 shows the energy flows in a cogeneration system and in a conventional system to be
compared.
Figure 12: Comparison between a cogeneration system and a conventional system.
Source: Lozano, M.A., 2008
The fundamental parameters that determine the energy performance of the system are:
112. Literature study
Electric efficiency RWF = W/F
Thermal efficiency RQF = Q/F
Global efficiency ηe = (W + Q)/F
Power Heat Ratio RWQ = W/Q
Being F the primary energy fuelled, W the electricity generated and Q the heat produced that
meet the energy demand (no waste heat included).
Moreover, other parameters which are useful to compare different cogeneration systems to
conventional systems are defined below.
Primary energy saving ∆F = F* - F =F W+ FQ –F = W/ηW + Q/ηQ – F
Fuel energy saving ratio FESR = I∆F = ∆F/F* = 1 – F/ [W/ηW + Q/ηQ]
Equivalent electric performance REE = ηee = W/(F - FQ) = W/(F – Q/ηQ)
FESR and REE are used to find out if cogeneration systems are more efficient than
conventional system producing heat and power.
The last parameter REE must higher than the minimum equivalent electric performance REEmin
to be able to receive an extra income when electricity is sold. It is established by Special
Regime in “Royal Decree 661/2007”. [Lozano, M.A., 2008]
2.2.4. Environmental and economic advantages
Cogeneration systems are highly efficient systems and offer a real opportunity to save primary
energy and reduce fossil fuel usage; resulting in a reduction of greenhouse gases emissions
and energy costs. CHP plants also improve security of energy supply and decrease risks
associated with rapidly rising electricity prices. Besides, transmission and distribution losses
can be reduced when many smaller CHP plants are constructed near consumption areas.
[EnerG, 2009]
Cogeneration reduces environmental impacts and helps to achieve Kyoto Protocol targets,
decreasing CO2, NOx and SO2 emissions. In Spain, it shows a saving of primary energy of
850.000 toes per year, which means 3% of the total natural gas imports. It also prevents the
production of from 7Mton of CO2 per year. In conclusion, without using cogeneration Spain
will break the Kyoto Protocol targets by 5% more than at present. [Acogen, 2009]
2.2.5. Development of cogeneration in Spain
In Spain, cogeneration systems had the greatest and widest use at the end of the XIX century
and the beginning of the XX century. Some years later, the development of the electrical sector
meant that big power facilities and distribution networks were built. Therefore, cogeneration
systems were moved to medium-sized industries.
Nevertheless, this situation started to change between 1973 and 1979. Oil dependency
problems forced the authorities to promote efficient energy use. Some research projects were
done and the Government gave help to support investment, financing and electricity sales.
This development was also due to the availability of natural gas in Spain. It was a clean and
easily used fuel; hence, supply systems were reconverted to use the new fuel. On the other
hand, deregulation of energy markets provided electricity purchase and sale. The two last
factors that promote a CHP system were increasing environmental concerns and cogeneration
technology development. [Lozano, M.A., 2008]
122. Literature study
In Spain, cogeneration is located mainly in industrial areas. The distribution of cogeneration
capacity in Spain in 2006 is shown in Table 1.
Table 1: Cogeneration capacity in Spain’s industrial areas. Source: Viladrich-Grau, M., Vila, J., 2007.
NUMBER OF
AREA CAPACITY (MW)
PLANTS
Catalonia 1194 138
Andalusia 701 49
Galicia 595 84
Valencia 579 141
Castilla-Leon 509 55
Cogeneration plants are principally built in industries with intensive energy use. The presence
of cogeneration in the tertiary sector only represents 7.4% due to the low residential heating
hours required during the year compared to other European countries; although it is thought
that the cogeneration combined with refrigeration (trigeneration) is going to be well-
developed in this sector because a number of social changes in Spain have increased the
cooling demand in the tertiary-residential sector. Accordingly and as a response to these needs
cogeneration will expand. [Viladrich-Grau, M., Vila, J., 2007]
The distribution of cogeneration systems in Spain divided by sectors is gathered in Table 2.
Table 2: Distribution of cogeneration by industry sectors. Source: Viladrich-Grau, M., Vila, J., 2007.
INSTALLED POWER NUMBER OF PERCENTAGE (MW
SECTOR
(MW) SYSTEMS by industry sector)
Agro-alimentary industry 1057 138 18.2
Chemical industry 944 54 16.3
Paper mill industry 876 75 15.1
Oil refinery 577 11 9.9
Non metal ore industry 536 157 9.2
Other industries 581 83 10.0
Textile industry 412 61 7.1
Buildings and services 432 98 7.4
Other 388 63 6.7
TOTAL 5803 740 100
According to the primary energy used, in 2006, natural gas represented 72% of cogeneration
plants and 64% of the available capacity. Secondly, liquid fuels corresponded to 25% of
available capacity and the main fuels are oil derivatives such as diesel, gasoline, fuel oil or
refinery gas. The rest of fuels had limited significance; they fuelled 3% of plants and
represented 11% of available capacity. [Viladrich-Grau, M., Vila, J., 2007]
In 2007, the most commonly used fuel in power CHP system was natural gas which represents
over 80%, followed by fuel oil or gas oil with 10%. The distribution of fuels used in CHP system
is shown in Figure 13.
132. Literature study
Fuels used in CHP systems
4% 1%
4%
10%
Natural gas
Fuel oil / Gas oil
Other fuels
Refinery gas
High oven gas
81%
Figure 13: Distribution of the fuels used in CHP systems. Source: Cogen, 2009
When cogeneration plants are studied from the point of view of installed capacity, it is seen
that more than 50% of plants have a capacity of between 1 and 5 MW. Hence, Spanish
cogeneration profile is made up of many small and low-capacity CHP plants. This fact may
explain why cogeneration is not currently considered a real option for the production of
electricity on a large scale. The main objective of these small plants is often to reduce energy
costs for the companies, instead of producing electricity.
The technologies most frequently employed for cogeneration are, combined cycle, condensed
steam turbines, internal combustion engines and gas turbines with counter-pressure heat
recovery. [Acogen, 2009]
The cogeneration installed power has been increasing rapidly and it was 6075 MW from 874
CHP plants in 2007. [CNE, 2009] The evolution of the installed power and electricity sold in the
market can be seen in the Figure 14.
Figure 14: Evolution of the cogeneration installed power in Spain. Source: Cogen, 2009
142. Literature study
In Figure 15, the increase in the number of CHP plants installed in Spain can be seen.
Figure 15: Evolution of the number of CHP plants in Spain. Source: Cogen, 2009
At present, the production of electricity from cogeneration systems represents over 11% of the
total electricity generated. This evolution is shown in Figure 16.
Figure 16: Percentage of the electricity production from CHP systems. Source: Cogen, 2009
At present, the characteristics of the cogeneration in Spain are listed as follows:
• More than 6.000 MW of installed power
• Approximately 900 CHP plants distributed around Spain
• It creates more than 4.500 direct employment positions and more than 10.000 indirect
employment positions
• It has a turnover of more than 3.800 M€ per year
152. Literature study
• The total electricity fed into the public grid is 19.700 GWh per year
• The total electricity generated is estimated to be over 29.700 GWh per year
• It covers almost 10% of the electricity demand of Spain
• Primary energy saving of 850.000 toe per year, which means 3% of the total natural
gas imports.
• Water saving of 40 million of m3 per year.
• It prevents the production of some 7 million of tons of CO2 per year.
In general, the electricity is produced by different types of fuels. Table 3 gathers the total
electricity generated from the diverse fuels and the annual variation. [Energía, 2008]
Table 3: Total electricity production in Spain. Source: Energía, 2008
TOTAL ELECTRICITY PRODUCTION (GWh)
VARIATION (%)
2006 2007
HYDRO 25 330 26 447 4.4
FOSSIL FUELS 150 737 158 239 5.0
NUCLEAR 60 126 54 982 -8.6
Ordinary Regime 236 193 239 668 1.5 %
RENEWABLE AND
33 069 37 845 14.4
WASTE
COGENERATION 34 418 35 043 1.8
Special Regime 67 487 72 888 8
TOTAL 291 045 300 146 3.1
The distribution of fuels used to produce electricity is represented in Figure 17. 87% of the
electricity is generated in Ordinary Regime by hydro, fossil fuels and nuclear; production in
Special Regime only represents 12% and this electricity comes from renewable sources, waste
or cogeneration. In Spain, electricity is mostly produced from fossil fuels which correspond to
60% of the total. [Energía, 2008]
Electricity production
Combined cycle
Wind
5%
Other:CHP,biomass,
18%
minihydro,w aste…
37%
International exchange
Hydro
16% Nuclear
4%
11% 1% 8% Coal
Fuel/Gas
Figure 17: Distribution of the fuels used to produce electricity in December 2007.
Source: Data from Energía, 2008
162. Literature study
The evolution of the electricity which is sold in Special Regime can be observed in Table 4.
Generally, it has been increasing annually, which means that people have started to become
concerned about environmental issues.
Table 4: Evolution of the electricity sold in Special Regime. Source: Energía, 2008
172. Literature study
2.3. Combined Heat and Power technology
This section describes the current status of some natural gas-fired distributed energy resource
technologies. The power technologies analysed can be used in CHP plants. Despite being
capable of utilizing a variety of fuels in a range of applications, these technologies are
evaluated according to electric power and combined heat and power (CHP) applications using
natural gas [Nrel, 2003].
The technologies characterized can meet the needs of a wide range in the residential,
commercial and industrial sectors. Comparative performance and costs of each technology
option must be taken into consideration in order to decide the best alternative. Table 5
compares the characteristics of each technology.
Table 5: Comparison of CHP technologies. Source: Nrel, 2003
• Reciprocating Engines
Reciprocating internal combustion engines are a widespread and developed technology for
power generation. They can be used for all types of power generation. Spark ignition engines
for power generation use natural gas as the preferred fuel but they can run on propane or
gasoline. However, compression ignition engines operate on diesel fuel or heavy oil, moreover
they can run in a dual-fuel configuration burning primarily natural gas with a small part of
diesel fuel. The advantages of using this technology are several: low investment cost, easy
start-up, reliability when properly maintained and good load-following characteristics. On the
182. Literature study
other hand, some drawbacks can have relatively high noise levels, rather high air emissions,
and regular maintenance required. Gas-fired reciprocating engines are well suited for CHP in
commercial and light industrial applications of less than 5 MW. Smaller engine systems may be
used to produce hot water and larger engine systems are designed to produce steam at low
pressure. [Nrel, 2003]
• Gas Turbines
Gas turbines are an established technology in sizes from several hundred kilowatts up to about
50 MW. They produce high-quality heat which is used to generate steam. This steam usually
runs a generator to produce electricity, it is known as combined-cycle configuration. Gas
turbines mainly burn natural gas, but also they can be fuelled by a variety of oil fuels or have a
dual-fuel configuration. An important advantage of gas turbines CHP systems is the high-
quality of waste heat available in the exhaust gas, apart from which maintenance costs are one
of the lowest. That is why gas turbines are a great option for industrial or commercial CHP
applications larger than 5 MW. This CHP technology is also useful in many industrial processes
where the high-temperature exhaust gas is appropriate for generating steam at high pressure.
By running a gas turbine in simple cycle, the hot exhaust gas may be employed directly in a
process of the industry or used to generate steam and hot water by adding a heat recovery
steam generator. [Nrel, 2003]
• Steam Turbines
Steam turbines are one of the most versatile and oldest main technologies used to drive
generators and mechanical machinery. What’s more, steam which runs the turbine is extracted
to be utilized directly in a process or to be converted to other types of thermal energy such as
hot water or chilled water that may be used for district heating and cooling. The capacity of
steam turbines can reach several hundred MW for large utility power plants. Steam turbines
are run by high pressure steam which must be produced in a boiler or heat recovery steam
generator. Boilers can be fuelled by different varieties of fuels, including natural gas, fossil
fuels such as coal and oil or renewable fuels like wood or municipal waste. Steam turbines CHP
systems are mainly used in industrial processes where solid or waste fuels are available to be
burnt in boilers. [Nrel, 2003]
Figure 18 illustrates the range in which the mentioned technologies operate as well as power
heat ratio achieved.
Figure 18: Selection of the cogeneration system. Source: Modified from Lozano, M.A., 2008
192. Literature study
In Spain, the most installed technologies in cogeneration systems are gas turbines and internal
combustion engines. Gas turbines produce electricity during 80% of the year, while engines
have an average functional time of 48% and they represent 42% of the total capacity. Once the
system is in operation, the cogeneration production costs for gas turbines are lower than for
engines. Nevertheless, internal combustion engines have less start-stop difficulties than gas
turbines. Hence, they are more flexible, being turned on and off to meet the demand
requirements much faster and with less cost than turbines [Viladrich-Grau, M., Vila, J., 2007].
2.4. Cooling techniques: Compression and absorption
systems
2.4.1. Compression cooling
Electrical compressor chillers are the most widespread type of technology used to create
cooling. It is used to produce air conditioning and refrigeration in buildings, industries and
automobiles.
The main components of the simple compression system, illustrated in Figure 19, are a
compressor, a condenser, an expansion valve and an evaporator.
Figure 19 : Simple compression cycle . Source: Modified from Ruiz, 2007.
The compressor is used to increase the pressure and the temperature of the refrigerant
vapour from the evaporator to the condenser. The cooling capacity of the machine is regulated
by changing the output temperature of the compressor. The refrigerant vapour at high
pressure is cooled in the condenser by means of air or water, and it becomes a liquid. Then, it
goes through an expansion valve to reduce the pressure in the evaporator. In the evaporator
the cooling effect takes place. The refrigerant liquid evaporates by taking heat away from the
space. The evaporator receives two different names according to its operation; when the air of
the space that needs to be chilled is cooled directly by the evaporator it is called air coil. But if
the evaporator cools a liquid that is heat exchanged with the space air it is called a chiller.
[Fernández, P., 2008a]
To produce the cooling effect it is necessary for the temperature of the refrigerant in the
evaporator to be lower than the cooled space and in the condenser to be higher than the
environmental temperature. In larger systems, water which extracts heat from the condenser
is usually cooled in a cooling tower. However, in smaller systems it is possible to use air to
remove heat from the refrigerant.
202. Literature study
The energy analysis of the cycle is explained by using enthalpy (kJ/kg).
The heat removed from the space in the evaporator known as cooling capacity is QL = h6-h5
The work made by the compressor is WC = h2-h1
The heat extraction in the condenser is QH = h3-h4
h6 - h5
Thus, it possible to define the coefficient of performance as COP =
h 2 - h1
However, the real cycle has some losses due to mechanical inefficiencies of the compressor or
energy losses in heat transmission and pressure drops that decrease the efficiency of the
system.
Besides, it is important to select the type of compressor according to the type of refrigerant
chosen. There are different types of compressor. For example, centrifugal compressor work
better when pressures are low and specific volumes are high; on the other hand, reciprocating
compressors work better at higher pressures and smaller specific volumes. Other types of
compressor are screw, scroll and vane compressors. [Wulfinghoff, 1999]
A simple description of the energy flows in a compression machine (Centrifugal type water
chillers) is shown in Figure 20.
0.17 1
Electricity Cold water
1.17
Cooling water
Figure 20 : Energy flows in a typical compression machine.
2.4.2. Absorption cooling
The main characteristic of an absorption cooling system is that it uses heat energy as fuel in
order to produce cooling. For this reason, it is common to use these systems in plants that
have an excess power capacity during the summer season, so it is possible to take advantage
of the installed power of the systems used to produce heat.
The components of an absorption machine are integrated closely within a single compact
package. The most used pairs of refrigerant-absorber are the system ammonia-water and
system water-salt lithium bromide.
There are some differences between chiller models according to the heat source and the
number of stages. Initially, absorption chillers were fuelled by steam or hot water at high
temperature but currently direct-fired absorption chillers are the most used because they have
an integrated boiler reaching higher efficiency levels. Furthermore, single-stage chillers have
been replaced by two-stage machines or even multiple-effect ones that provide significantly
higher efficiency.
212. Literature study
In the indirect-fired absorption chillers the power input is steam, hot water or hot gases
produced in a boiler or turbine/engine generator. These chillers are usually installed for
integration into a CHP system for buildings. During the summer season, the rejected heat
produced from the electricity generation is used to cool the buildings by means of absorption
chillers. In this way, the feasibility of using otherwise wasted energy increases operating
efficiency. [Fernández, P., 2008b]
The main components of an absorption cooling system are the condenser, the throttling valve,
the evaporator and the "thermal" compressor that is composed of a generator, an absorber, a
pump and a valve or heat exchanger. Figure21 illustrates a basic absorber system. Its operation
is explained in the next paragraph.
Figure 21: Single-effect absorption system. Source: Fernández 2008b.
A system using ammonia as refrigerant and water as absorbent is considered in order to
explain how the system works.
In the absorption cycle, the ammonia passes through the condenser, the throttling valve and
the evaporator, in the same order than in a compression system. The difference is that the
compressor is substituted by a thermal compressor composed of an absorber, a pump, a
generator and a valve. In the absorber, the vapour of refrigerant is absorbed by means of an
exothermic reaction in a poor solution of refrigerant (absorber) that comes from the generator
through the valve. The resultant rich solution of ammonia is cooled by the cooling water in
order to convert it into a liquid. This water comes from a cooling tower. Then, this liquid is
compressed into a pump that increases its pressure up to the generator pressure. In the
generator, the rich solution of refrigerant is heated. Therefore, the ammonia turns into steam
22You can also read