Optimized Energy Cost and Carbon Emission-Aware Virtual Machine Allocation in Sustainable Data Centers - MDPI
←
→
Page content transcription
If your browser does not render page correctly, please read the page content below
sustainability

Article
Optimized Energy Cost and Carbon Emission-Aware
Virtual Machine Allocation in Sustainable
Data Centers
T. Renugadevi 1, *, K. Geetha 1 , K. Muthukumar 2 and Zong Woo Geem 3, *
 1    School of Computing, SASTRA Deemed University, Thanjavur 613401, India; geetha@cse.sastra.edu
 2    School of Electrical and Electronics Engineering, SASTRA Deemed University, Thanjavur 613401, India;
      kmuthukumar@eee.sastra.edu
 3    Department of Energy IT, Gachon University, Seongnam 13120, Korea
 *    Correspondence: renugadevi@cse.sastra.edu (T.R.); geem@gachon.ac.kr (Z.W.G.);
      Tel.: +91-975-0887-871 (T.R.); +82-317-505-586 (Z.W.G.)

 Received: 29 May 2020; Accepted: 4 August 2020; Published: 7 August 2020

 Abstract: Cloud data center’s total operating cost is conquered by electricity cost and carbon tax
 incurred due to energy consumption from the grid and its associated carbon emission. In this work,
 we consider geo-distributed sustainable datacenter’s with varying on-site green energy generation,
 electricity prices, carbon intensity and carbon tax. The objective function is devised to reduce the
 operating cost including electricity cost and carbon cost incurred on the power consumption of servers
 and cooling devices. We propose renewable-aware algorithms to schedule the workload to the data
 centers with an aim to maximize the green energy usage. Due to the uncertainty and time variant
 nature of renewable energy availability, an investigation is performed to identify the impact of carbon
 footprint, carbon tax and electricity cost in data center selection on total operating cost reduction.
 In addition, on-demand dynamic optimal frequency-based load distribution within the cluster nodes
 is performed to eliminate hot spots due to high processor utilization. The work suggests optimal
 virtual machine placement decision to maximize green energy usage with reduced operating cost and
 carbon emission.

 Keywords: cloud computing; virtual machine placement; sustainable data center; energy efficiency;
 renewable energy; carbon footprint

1. Introduction
      Large data centers are nowadays an integral part of the information technology (IT) industry.
Cloud-based services are of high preference to organizations and individuals. Organizations consolidate
multiple clusters to large data centers. Power consumption has been a significant economic and
environmental issue in data centers due to growing demand. The growth of the data center’s energy
consumption is approximately 10–12% per year [1]. The geo-distributed data centers enable providers
to establish different renewable energy sources based on the environment. The energy cost associated
with data centers is approximately 42% of the overall operating cost of the data centers [2]. The service
providers are compelled to improve the infrastructure related to server power consumption, cooling
provisioning and heat dissipation while maintaining service level agreement (SLA). Data centers
contribute to 2% of the world’s total carbon dioxide (CO2 ) emission due to high energy consumption.
The cost involved with cooling infrastructure can be 50% or more in a poorly designed data center [3].
Due to increasing power densityheat and thermal management are crucial for data centers to increase
the lifetime of the servers and to reduce economic loss in the form of electricity bill. The two possible
ways to overcome the problem of CO2 emission are (1) grid power source to be replaced with renewable

Sustainability 2020, 12, 6383; doi:10.3390/su12166383                       www.mdpi.com/journal/sustainability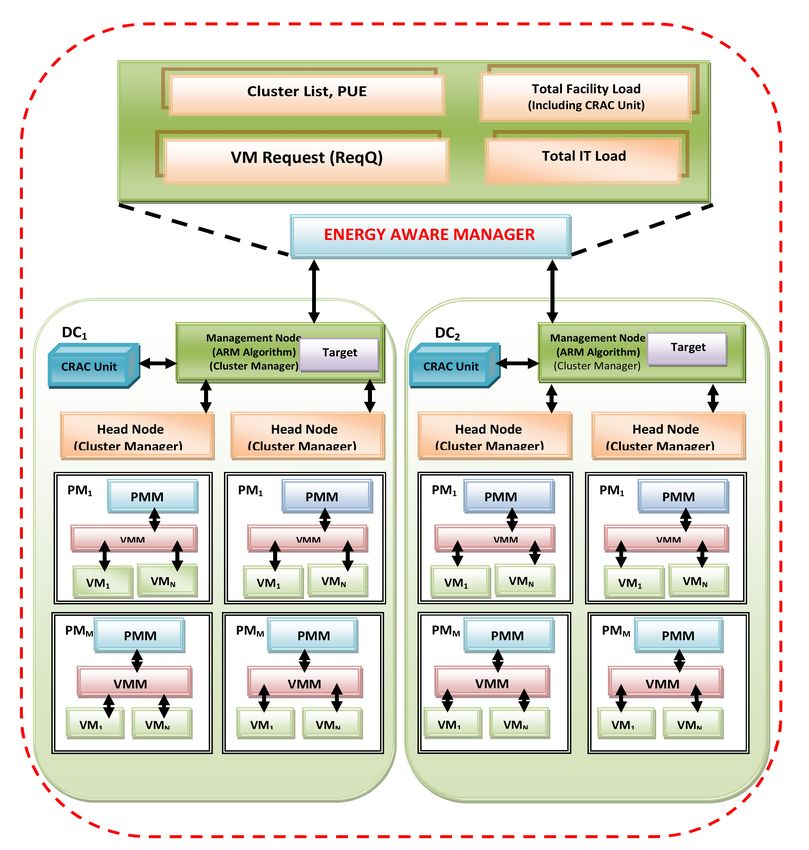
Sustainability 2020, 12, 6383                                                                          2 of 27

energy sources; (2) Improve the Power Usage Effectiveness (PUE) of the data centers. The Green Grid
consortium [4] defines the PUE metric as the ratio between the total power consumed by the data
center (IT power + overhead power) and energy consumed by servers executing IT load (IT power).
The overhead power includes the power consumed by data center infrastructure other than server
power. The overhead power is mainly dominated by the power consumed by Computer Room Air
Conditioning (CRAC) devices. The increase in temperature inside the data center is due to two factors:
(1) Utilization of CPU in higher frequencies; (2) Increase in outside temperature. Thermal management
of CRAC units is performed based on rack-level IT loads [5,6]. Two temperature-aware algorithms were
proposed to prevent hot spots and to minimize the rise of operating temperature [7]. A game-based
thermal-aware resource allocation was proposed in [8]. It uses a cooperative Nash-bargaining solution
to reduce the thermal imbalance in data centers. Threshold-based thermal management was introduced
in [9] to handle hot spots effectively but failed to treat the thermal imbalance. Thermal management is
proposed to distribute the load at the rack level to handle temperature drop effectively but fails to
handle hotspots [10].
      The lower PUE indicates a more efficient data center showing less overhead power and more IT
power. The cloud provider’s PUE ranges from 1.1 to 1.2 [11,12]. Collocated small data centers still
provide PUE up to 2 [13]. Mixed-integer linear programming was used to minimize operating cost,
energy cost and reliability cost by minimizing active PMs in data centers [14]. Stochastic search based
on a genetic algorithm was used to reduce IT power consumption and migration cost by considering
energy-aware vitual machine migration [15]. Facebook, Amazon, Microsoft, Apple and Google have
built their suitable clean energy sources based on its location [16–18]. Since clean energy is not
consistent, it carries more challenges in its efficient usage. Data centers provide a way in for off-site grid
energy to power the infrastructure to balance the inconsistent nature of renewable energy. The nature
of variable workloads in data centers and prediction algorithms contribute to power and resource
management to use clean energy more effectively in data centers. The two popular on-site energy
sources considered are solar and wind. Solar energy follows a pattern; it increases gradually from
the morning, reaches its peak at noon, and progressively slows down. Wind energy does not have a
pattern of generation. Renewable energy availability varies based on the location of the data center.
It paves a way to target the load to the data center with the maximum renewable source to use clean
energy effectively.
      In the current state of the art, the works are carried out in different perspectives considering
traditional energy management techniques to act on energy reduction within data centers. This work
highlights the factors, namely, server energy consumption reduction and service providers’ operating
cost and carbon emission reduction. For server energy consumption reduction, it considers the variation
of the core parameters of DVFS (Dynamic Voltage Frequency Scaling), namely, frequency, utilization and
power consumption. Concerning workload, the on-demand dynamic optimal frequency for the nodes
in the cluster is identified and load balancing is performed to eliminate hot spots due to high processor
utilization. Secondly, as many providers own geo-distributed data centers powered by a mixed supply
of both grid and renewable sources, this work aims to efficiently utilize the renewable source to
reduce the total operating cost and carbon emission. The impact of electricity price, carbon footprint,
carbon cost on server and cooling device power consumption are taken into consideration while
formulating the proposed objective function. In our previous work [19], VM placement considering
dynamic optimal frequency-based allocation and standard power efficient algorithm (C-PE) were
compared. This work is the extension of our previous work with both brown and green energy sources
and related energy cost parameters towards the realization of the proposed objective.
      In this work, we provoked the following questions: (1) When the renewable energy source is not
in a stable condition, how to maximize its usage? (2) How to reduce the power consumed by CRAC
devices and IT devices to reduce the total electricity cost? (3) How to reduce the carbon emission?
In this work, energy source and DVFS-aware VM placement algorithm is proposed to minimize total
cost, carbon footprint and cooling device power consumption for geo-distributed data centers with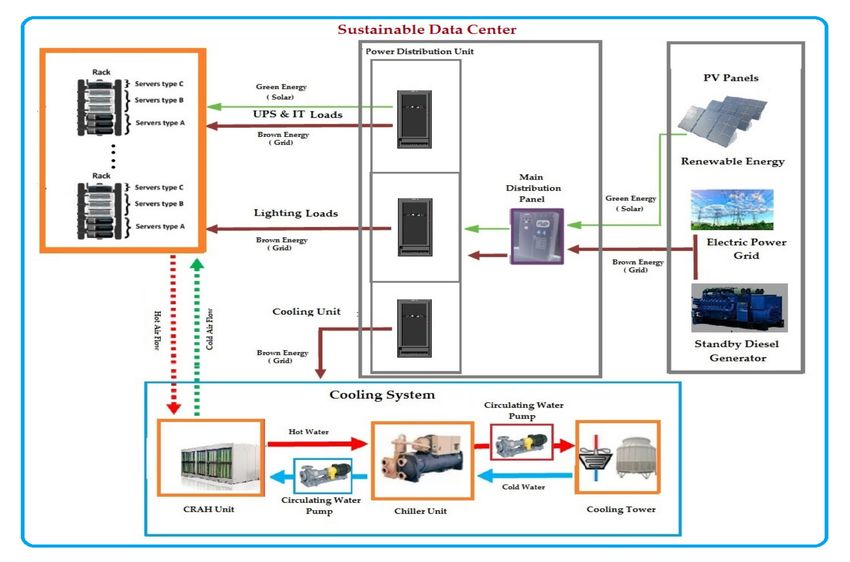
Sustainability 2020, 12, 6383                                                                           3 of 27

a mixed supply of grid and clean energy. Container technology along with virtualization is used to
provide the necessary environment and isolation for task execution [20].
     To achieve the above said objective, the following measures are carried out in this work as
key contributions.

•     Optimal DVFS-based VM scheduling is performed to distribute the load among the servers to
      minimize the operating temperature.
•     Formulation of an objective function for data center selection with the consideration of varying
      carbon tax, electricity cost and carbon intensity.
•     Investigation on the effect of renewable energy source-based data center selection on total cost,
      carbon cost and CO2 emission.
•     The efficient utilization of VMs is carried out by appropriate VM sizing and mapping of containers
      to available VM types.
•     K-medoids algorithm is used to identify container types.
•     Examined the upshot of workload-based tuning of cooling load on total power consumption.

     The remaining sections of the paper are structured as follows: In Section 1, data centers’ power
consumption information is delineated. In Section 2, existing research works in the literature related
to virtual machine placement and containers are discussed. The architecture of the sustainable data
center system model and the problem formulation of stochastic virtual machine placement are given in
Sections 3 and 4. Sections 5 and 6 briefly explains the task classifications of Google cluster workload
and the proposed algorithms. In Section 7, the experimental environment and evaluations of proposed
algorithms are detailed. Section 8 concludes the findings of this research work.

2. Related Works
       Extensive research has been carried out to deal with energy efficiency in data centers. Their focus
is towards the optimal QoS, efficient utilization of resources and operation cost reduction. However,
still, it is a challenging task to satisfy the necessities of users and service providers with efficient energy
management. In an energy efficiency perspective, the focus may be on software level, hardware level
or intermediate level [21].

2.1. DVFS and Energy-Aware VM Scheduling
     The growth of data centers in terms of size and quantity leads to significant increase in energy
consumption resulting in more challenges in its management. In DVFS-based energy efficient power
management approach, the working frequency and voltage of CPU are adjusted dynamically to alter
the energy utilization of the servers. For effective energy savings in data centers, the task scheduling
is carried out based on DVFS. The authors in [22] have proposed an energy-aware VM allocation
algorithm intending to solve a multi-objective problem considering the optimization of job and power
consumption along with its associated constraints. DVFS-based energy management and scheduling
on heterogeneous systems is performed in [23]. Web server’s performance control issues were handled
using DVFS as a control variable to reduce the server’s energy consumption [24].
     DVFS-based approach has been proposed with an objective to enhance the utilization of
resources and minimize the energy consumption without compromising the performance of the
system. The workloads are prioritized based on available resource demand and explicit service
level agreement requisite [25]. DVFS-based technique has been utilized for constrained parallel tasks
in [26]. The authors claim that the proposed method can minimize the energy consumption with
minimum task execution time. DVFS-based approach was applied for optimizing the energy efficiency
of the data centers in [27]. To enhance the trade-offs among application performance and energy
savings, an integrated approach of DVFS and VM consolidation has been addressed and it has been
authenticated using real test bed [28]. The results implicate that there is a trade-off between energy and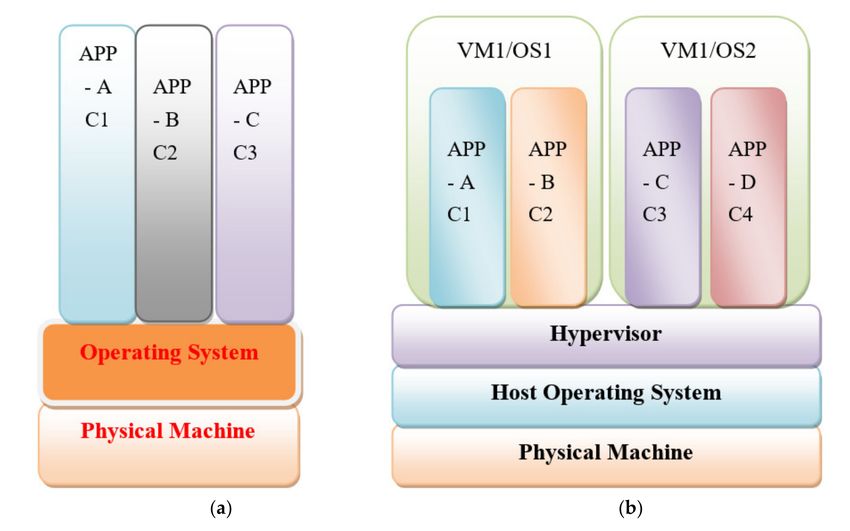
Sustainability 2020, 12, 6383                                                                        4 of 27

migration time while performing energy efficient VM consolidation among geographically distributed
data centers.
      A task model has been proposed in [29] which depict the QoS of the tasks with lowest frequency.
Energy consumption ratio (ECR) has been utilized to estimate the efficiency of diverse frequencies
in task execution. To reduce energy consumption of the servers, the incoming tasks are dispatched
to the active servers and then the execution frequencies are adjusted. Migration algorithm has been
utilized on individual servers to balance the workload dynamically to minimize the ECR of the server.
In [30], a power-aware extension of WorkflowSim has been used to integrate a power model for the
optimization of pre-eminent energy saving management considering computing, reconfiguration,
network costs and host energy saving is achieved through DVFS. fort. The above-mentioned
approaches aim to minimize the energy consumption of the data centers as much as possible with
performance trade-off.
      Comparatively, in our approach, we consider the renewable energy source along with brown
energy for sharing the energy consumption while formulating the optimization problem which would
lead to different scenarios to support performance improvement of the data centers.

2.2. Regional Diversity of Electricity Price and Carbon Footprint-Aware VM Scheduling in Multi-Cloud Green
Data Centers
     Few authors formulated the VM allocation problem by merging the energy consumption of
data centers with its carbon footprint. Carbon-aware resource allocation considering a single data
center was proposed in [31] for provisioning on-demand resources on servers powered by renewable
energy. Load distribution among different data centers was proposed in [32] considering brown
energy consumption cost. A Min Brown VM placement algorithm was introduced in [33] to minimize
brown energy consumption considering the task deadline, VM migration between federated data
centers was performed to minimize brown energy cost by considering dynamic electricity pricing [34].
The migration of VM’s was considered with an aim to minimize carbon footprint in the federated
cloud [35]. A combination of wind and solar energy sources was considered with an aim to distribute
the load with zero brown energy cost [36]. Delay constraint applications were considered with an aim
to reduce electricity pricing [37].
     The authors in [38] have addressed the VM placement problem with an aim to minimize energy
and the cost associated with the carbon footprint in geologically distributed data centers, located within
the same country. A dynamic workload scheduling technique has been proposed in [39] for the servers
powered by renewable energy source. To use the renewable energy in an efficient manner, workload
migration has been addressed in [40]. The authors in [41] proposed a middleware system called
GreenWare with an aim to increase the renewable energy usage by the geo-distributed data centers
powered by wind and solar power. The focus of the study was to minimize the carbon footprint of
certain requests within a predetermined budget cost by the service provider. An adjustable workload
allocation approach within the geographically distributed data centers based on the renewable energy
availability has been proposed in [42]. Few researchers focused their research on resource management
strategies in the multi-cloud environments. To balance the workload optimally among the geographical
distributed data centers, an algorithm has been proposed in [43] to increase the green energy usage
and minimize brown energy.
     With an aim to minimize the brown energy utilization, a load balancing approach has been proposed
by utilizing the available green energy [44]. A framework has been introduced in [45] with an aim
to minimize the total electricity price of data centers. Based on the renewable energy availability,
load balancing has been done among multiple data centers. A workload and energy management scheme
has been introduced to decrease the operational cost of the network and energy costs [46]. A dynamic
workloads deferral algorithm has been introduced in [47] for multi-cloud environment. Based on the
diverged location of the data centers, the dynamic electricity prices are taken into account while ensuring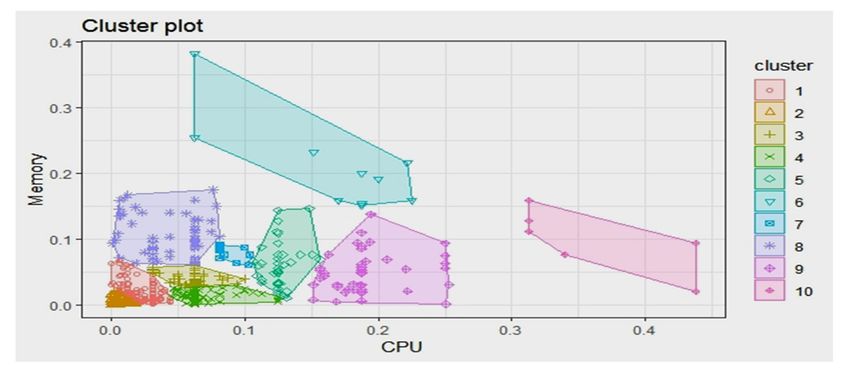
Sustainability 2020, 12, 6383                                                                               5 of 27

the workloads deadline. To allocate the workloads in the sustainable data centers located at different
locations, Markov Chain-based workload scheduling algorithm has been proposed in [48].
      In the above mentioned approaches, the authors focused towards their problem formulation for
minimizing the total electricity costs of data centers without the consideration of carbon cost. The data
center partially fed by green energy helps the cloud provider to minimize the coal-based energy sources
dependency. Comparatively in our approach, we consider the renewable energy source along with
brown energy for sharing the energy consumption of the data centers with an aim to reduce the total
electricity costs and carbon cost in the geo-distributed data centers.
      The amount of renewable energy availability and carbon intensity depends on the location of the
data centers. Compared to existing approaches summarized in Table 1, to enhance the renewable energy
utilization, we consider the workload shifting approach within the geographically distributed data
centers with variation in the carbon intensities and its green energy availability. Based on the availability
of green energy, carbon emission in tons/MWh, electricity price and carbon cost, the preference has
been given for the selection of data center for workload shifting. However, due to the intermittent
nature of green energy generation, it is still essential to exploit the aforementioned parameters on
operating cost incurred due to brown energy support.

                Table 1. Comparison summary of existing work for Virtual Machine (VM) placement.

                                Approach              Environment            Metrics Considered
     Ref. No.
                                Green      Workload                           Cost of               Carbon
                   DVFS                               Multi-Cloud   Energy                 SLA
                                Energy     Shifting                          Electricity           Foot- Print
       [25]                                                          Yes                   Yes
       [26]          Yes                                             Yes                   Yes
       [27]          Yes                                             Yes                   Yes
       [28]          Yes                                             Yes                   Yes
       [44]                      Yes                     Yes         Yes        Yes
       [46]                      Yes                     Yes         Yes        Yes
       [45]                      Yes                     Yes         Yes        Yes
       [47]                                  Yes         Yes         Yes        Yes        Yes
       [48]                      Yes         Yes         Yes         Yes        Yes
       [38]                      Yes                     Yes         Yes        Yes                   Yes
       [39]                      Yes         Yes                     Yes                   Yes
    Proposed
                     Yes         Yes         Yes         Yes         Yes        Yes        Yes        Yes
    Approach

2.3. Containers
     Containers are lightweight with less startup time and communication overhead, alternate to
virtual machines. They provide the virtual platform and task isolation at the operating system level.
The containers are more prevalent in providing a platform as a service in a cloud environment [49].
The container technologies, namely Docker, was compared with kernel-based virtualization machine
(KVM) in terms of processing, memory and storage, and the performance of containers was the
same as bare metal with virtualization overhead as in VMs. Containers allow horizontally scalable
systems for hosting microservices. There is a constraint of resource exploitation under process
groups in container-based virtualization techniques [50]. A container as a service lays a bridge
between infrastructure-as-a-service (IaaS) and platform-as-a-service (PaS). Containers offer a portable
application environment by providing the application services with a free environment of platform as
a service-specific environment [51]. Docker is an open platform for launching application containers.
Docker swarm scheduler places containers on available VMs in round-robin fashion without considering
resource usage of VMs [52]. The queuing algorithm is proposed for the placement of containers on VMs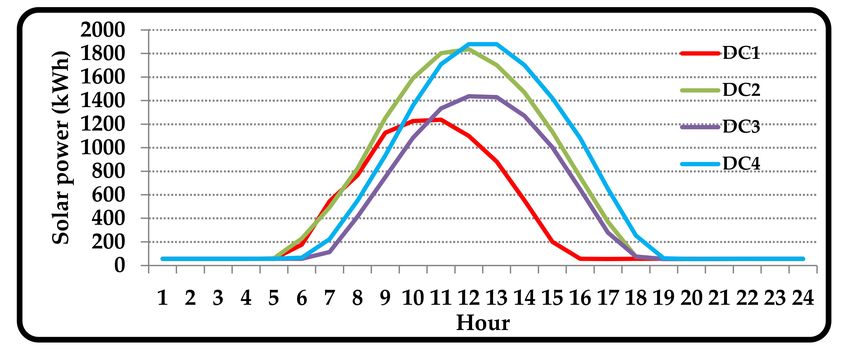
Sustainability 2020, 12, 6383                                                                       6 of 27

to reduce response time and efficient utilization of VMs [53]. Constraint satisfaction programming-based
container placement algorithm is proposed to decrease billing cost and energy consumption by reducing
the number of instantiated VMs [54]. A metaheuristic approach-based container placement is addressed
to reduce migration, energy consumption, increase SLA, VM and PM utilization. Figure 1 provides
different ways of container placement. The container C1, C2 and C3 emulates an operating system
and runs directly on the operating system as in Figure 1a. Containers provide increased performance
as they do not emulate the hardware as virtual machines. The container engine provides isolation,
security and resource allocation to containers. Hybrid container architecture which the container
engine and containers execute on top of the virtual machine is shown in Figure 1b.

                 Figure 1. Containers (a) Placement on host operating system (b) Placement on VM

3. The Architecture of the Proposed System

3.1. Sustainable Data Center Model
      In the data centers, energy consumption plays a critical role which decides the carbon emission
of the conventional power generating sources. The data centers ought to be aware of the energy
efficiency of IT equipment, cooling subsystems, and carbon footprint with the help of appropriate
metrics. Data center ecosystems offer additional flexibility to incorporate the usage of on-site renewable
power generation to minimize the carbon footprint. The integration of solar and wind energy impose
new challenges into the data center’s energy management. Based on the availability of green energy,
workloads are assigned to sustainable data centers located in diverged geographical locations with
different local weather conditions.
      This paper proposes a comprehensive management strategy for sustainable data centers to reduce
the IT load and cooling supply system’s energy consumption. In such situations, the management
techniques must regulate the IT workload based on the available solar and grid energy sources. It can
be realized by allocating the workload based on the time-varying nature of renewable power. A data
center powered with hybrid power infrastructure integrating grid utility and solar-based renewable
energy is shown in Figure 2. Each rack contains M number of servers powered by both grid and
solar-based renewable energy.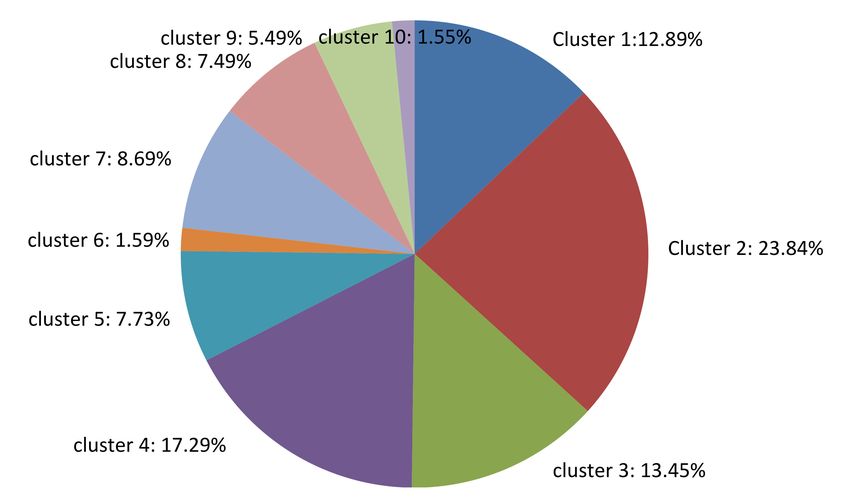
Sustainability 2020, 12, 6383                                                                         7 of 27

                                   Figure 2. Sustainable data center model.

3.2. Proposed Structure of Management System Model
      The utility of the management system components presented in Figure 3 are detailed below:

•     Energy-Aware Manager (EAM): The data centers of a cloud provider are located in geo-distributed
      sites. In addition to physical servers, data centers have additional energy-related parameters PUE,
      carbon footprint rate with different energy sources, varying electricity prices and proportional
      power. The EAM is the centralized node responsible to coordinate the input request distribution.
      It is responsible to direct the request to the data centers to attain minimum operating cost,
      carbon footprint rate and energy consumption. Each data center registers the cloud information
      service to EAM and updates it frequently. The energy-aware manager maintains information about
      the list of clusters, carbon footprint rate (CFR), data center PUE, total cooling load, server load,
      carbon tax, carbon cost, and the carbon intensity of the data centers.
•     Management Node (MN): Each data center holds several clusters with heterogeneous servers.
      The cluster manager of each cluster updates the cluster’s current utilization, power consumption,
      number of servers on/off to MN. The MN receives user requests from the EAM and based on the
      cluster utilization, distributes the load to the clusters through cluster manager. The main scheduling
      algorithm responsible for the allocation of VM to PM and the de-allocation of resources after VM
      termination is the ARM algorithm (Algorithm 1). It is implemented in the management node.
•     Cluster Manager (CM): Each cluster contains heterogeneous servers with different CPU and
      memory configurations. The power model of the systems in the cluster is considered homogeneous.
      Each node in the cluster updates information about its power consumption, resource utilization,
      number of running VMs, resource availability, and its current temperature to the CM. The cluster
      manager is the head node in the cluster that maintains cluster details concerning total utilization,
      server power consumption, resource availability, power model, type of energy consumed (grid or
      green) and temperature of the cluster nodes.
•     Physical Machine Manager (PMM): The PMM is a daemon responsible for maintaining the host
      CPU utilization percentage, resource allocation for VMs, power consumption, current server
      temperature, status of VM requests, number of VM request received, and so on. The PMM shares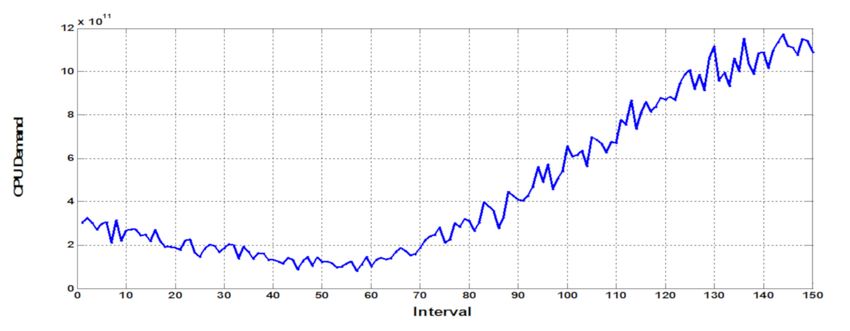
Sustainability 2020, 12, 6383                                                                       8 of 27

       its resources to the virtual machines and increases its utilization through virtual machine manager
       (VMM). It is responsible to update the aforementioned details to the cluster manager.
•      Virtual Machine Manager (VMM): The VMM utilizes the virtualization technology to share the
       physical machine resources to the virtual machines with process isolation. It decides on the
       number of VMs to be hosted, provisioning of resources to VMs and monitors each hosted VM
       utilization of physical machine resources. It maintains information about CPU utilization, memory
       utilization, power consumption, arrival time, execution time and remaining execution time of all
       active VMs, number of tasks under execution in each VM, current state of the VMs, and other
       resource and process information.

                         Figure 3. Schematic representation of the management system model.

    Algorithm 1: ARM Algorithm Approach
    Input: DCList, VMinstancelist
    Output: TargetVMQ
    1 For each interval do
    2      ReqQ← Obtain VM request based on VMinstancelist;
    3      DCQ← Obtain data centers from DCList;
    4      TargetVMQ← Activate placement algorithm;
    5      If interval >min-exe-time then
    6            Compl-list← Collect executed VMs from TargetVMQ;
    7         For each VM in Compl-list do
    8            Recover the resources related to the VM;
    9 Return TargetVMQ.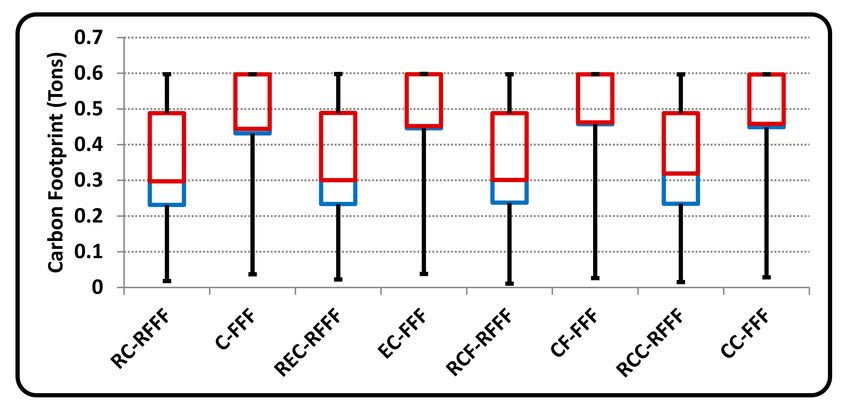
Sustainability 2020, 12, 6383 9 of 27
4. Problem Formulation
In this work, each physical machine (PM) is characterized by its resource capacity (processor and
memory) and processor power model. The power consumption is linearly correlated with its processor
utilization [30]. Each PM has fixed k discrete utilization levels in the execution state. When there
is no workload assigned, the processor is set to be in an idle state. The power consumption of the
processor at different utilization level is determined by its power model. The VM request is assumed
to have three parameters: arrival time, resource requirement and execution time. The VM request is
accepted and placed by the placement algorithms, if the required resource requirement is fulfilled by
the available PM resource capacity.4.1. Energy Consumption in Data Centers
The power consumption by all the servers (SP) and cooling equipment (overhead power (OP)),
plays a major role while modeling the data center energy consumption. The amount of energy
utilization by the data centers has a direct impact on carbon footprint.
4.1. Power Model of Server
The total facility power (TFP) consumption includes the overhead power consumption (OP) and
power consumption of all the servers (SP). It is formulated as (Equation (1)):
tc
X M
X
TFPd = OPd + ETc × P j (l) (1)
c=1 j=1
where tc, d and M represents number of clusters, datacenters and number of machines.
Pj (l) is the power consumed by jth physical machine. It is derived as [55] (Equation (2)):
S j (l) –U j (l)
P j (l) = × P j (l + 1) − P j (l) + P j (l) (2)
U j (l + 1) − U j (l)
where Uj (l) < Sj (l) < Uj (l + 1), 0 ≤ l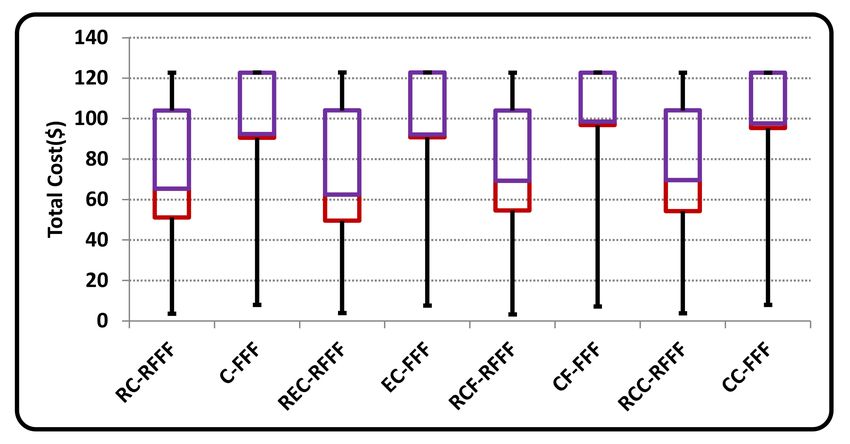
Sustainability 2020, 12, 6383                                                                        10 of 27

4.3. Green Energy
     The availability of green energy is dependent on environmental weather conditions and different
time zones in which the data centers are located geographically. We aim to minimize the carbon
footprint by coordinating the green energy availability of distributed data centers while handling the
user’s demand. In this work, solar energy is assumed as on-site renewable energy used along with
brown energy. The solar energy has been given higher priority during its availability than grid energy.

4.4. Carbon Cost (CC) and Electricity Cost (EC)
    Carbon cost (CC) and electricity cost (EC) of the data center depends upon the carbon tax (CT),
carbon footprint rate (CFR) and energy price (EP). These factors are based on the green or brown
energy sources utilized by the data center. In addition, the carbon footprint rate (tons/MWh) and
carbon tax (dollars/ton), energy price (cents/kWh) are location-specific. We aim to reduce the cost
associated with the data center based on optimal selection of data center considering the nature of
energy source, carbon emission, carbon tax and energy price while satisfying the user requests.

4.5. Objective Function
      We aim to minimize the data center’s overall operating energy cost (TC). An objective function
is formulated to calculate the cost considering power consumption and carbon footprint emission.
The total cost (TC) for handling the workload in a data center d is the sum of carbon cost (CC) and
electricity cost (EC) formulated as (Equation (5)):

                                               TCd = CCd + ECd                                           (5)

     The first part of the Equation (5) represents the carbon cost (CC). It is dependent on carbon tax
(CT), carbon footprint rate (CFR) and total facility power (TFP) consumed by data centers calculated as
(Equation (6)):
                                       CCd = CTd × CFRd × TFPd                                      (6)

     The second part of the Equation (5) calculates the data center electricity cost (EC). It is the product
of electricity price (EP) with total facility power (TFP) calculated as (Equation (7)):

                                               ECd = EPd × TFPd                                          (7)

Constraints Associated with the Objective Function
    The objective function in Equation (5) is subjected to the following constraints:
    The sum of processor requirement R j,i (c) and memory requirement R j,i (m) of the number of
                                                                                            cpu.max
VM’s (n) placed in the physical machine PMi are not supposed to exceed the processing PMi           and
memory limit PMi  mem.max of the physical machine and it is calculated as (Equations (8) and (9)):

                                             n
                                             X
                                                                 cpu.max
                                                   R j,i (c) ≤ PMi                                       (8)
                                             j=1

                                            n
                                            X
                                                   R j,i (m) ≤ PMimem.max                                (9)
                                             j=1

     The relation R between VM and PM is many-to-one. More than one VM can be placed in one PM
but a VM should be placed only in one physical machine, i.e., R ⊆ N × M, if

                                ∀ l N &∀ m, n M : (l, m)R ∧ (l, n)R ⇒ m = n.
Sustainability 2020, 12, 6383 11 of 27
The total brown energy (B) and green energy consumed by physical machines should be within
the service provider’s approved grid electricity consumption (B) and generated green energy (G)
(Equations (10) and (11)):
TFPd ≤ Total assigned brown energy (B) (10)
SPd ≤ Total generated green energy (G) (11)
4.6. Performance Metrics
To check the efficiency of VM to PM mapping, instruction to total energy ratio (IER), instruction to
cost ratio (ICR) and instruction to carbon footprint ratio (ICFR) are calculated as (Equations (12)–(14)):
Ptd Ptc PM PN
d=1 c=1 j=1 i=1 Rd,c,j,i × Rd,c,j,i (c) × VMex
i
ICRd = (12)
Ptd
TC d=1 d
Ptd Ptc PM PN
d=1 c=1 j=1 i=1 Rd,c,j,i × Rd,c,j,i (c) × VMex
i
ICFRd = (13)
td
P
CFR × TFP
d=1 d d
Ptd Ptc PM PN
d=1 c=1 j=1 i=1 Rd,c,j,i × Rd,c,j,i (c) × VMex
i
IERd = (14)
Ptd
TFP
d=1 d
where Rd,c,j,i (c) , VMex
i
are the processor requirement and execution time of ith VM. td represents the
total number of data centers.
The value of Rd,c,j,I is the mapping of VM to PM, set to 1, if VMi is allocated to PMj belonging to
cluster c in data center d else set to 0.
The SLA is calculated by the ratio of VM acceptance (RVA) as (Equation (15)):
Ptc PM PN
c=1 j=1 i=1 Rd,c,j,i
RVA (V )d = (15)
N
where N signifies the total number of received VM requests and M is the number of machines.
5. VM Placement Policies
The VM allocation problem can be considered as a multitier bin-packing problem. In the first-tier,
containers are mapped to VMs with an objective of efficient VM utilization and in the second-tier,
VMs are mapped to PMs to reduce energy consumption and carbon emission. The arrival of a VM
request has different choices for its placement with multiple data centers in different locations each with
its carbon footprint rate, PUE, carbon tax and electricity price. In this section, different VM placement
methods are presented to investigate the impact of different parameters with independent data center
selection policies towards energy consumption, RVA acceptance percentage, carbon footprint rate and
total cost.
5.1. ARM Algorithm
The allocation and reallocation management (ARM) algorithm is discussed in Algorithm 1.
The utility of the ARM algorithm can be categorized into two parts. Part 1: Lines 2–4 performs VM to
PM allocation. Part 2: Lines 5–6 performs resource deallocation for every interval.
The input to the algorithm is DCList and VMinstancelist. DCList holds the list of data centers.
VMinstancelist holds the set of VM instances as detailed in Section 6.3. The output of the algorithm is
the TargetVMQ which holds the VM to PM allocation.Sustainability 2020, 12, 6383 12 of 27
5.2. Renewable and Total Cost-Aware First-Fit Optimal Frequency VM Placement (RC-RFFF)
The proposed RC-RFFF algorithm performs strategy plans to allocate the VM on feasible servers
ensuring data center selection based on minimum total cost obtained from Equation (5) including the
carbon tax, carbon footprint rate, energy price for both brown and green energy. The physical machine
choice is based on the server’s optimal first fit frequency. For data center selection, first preference will
be given for renewable source availability followed by the data centers with less total cost.
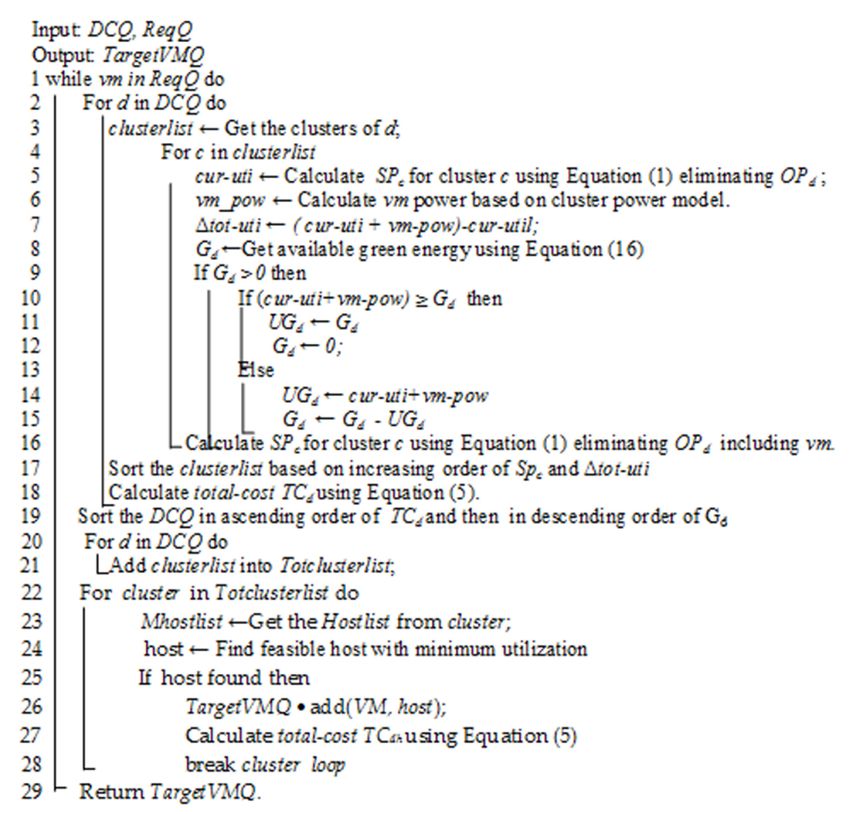
The RC-RFFF algorithmic approach is presented in Algorithm 2. DCQ contains the data center
list, ReqQ holds the input VM request, TargetVMQ holds VM to PM mapping information. RC-RFFF
performs data center selection in lines 2–19 of Algorithm 2 based on carbon tax, energy price,
carbon footprint rate and available renewable energy. In line 5, the total dynamic power consumption
of the servers in the cluster is calculated using Equation (1) eliminating OPd . In line 6, the power
consumption of the VM is estimated by considering the power model of the cluster. The Gd in line 8 is
set to the available green energy. Line 9–16, considers the green energy availability while calculating
the power consumption of clusters. The data center selection is based on the sorted order of TCd in line
18. The clusters inside the data center are ordered in increasing order of Spc and ∆tot-uti in line 17.
Algorithm 2: ARM RC-FFF Virtual Machine Placement AlgorithmSustainability 2020, 12, 6383 13 of 27
The host choice is based on the first-fit optimal frequency with renewable-aware cost calculation.
The host selection procedure starts from line 22 of Algorithm 2. The VM is allocated on the first-fit
feasible host with minimum utilization level. For n number of VM requests, d number of data centers,
c number of clusters, h number of available host, the complexity of the algorithm is derived as O(ndch).
To identify the data center with largest green energy availability, the complexity is O(dclogc). To identify
the host with optimal frequency, the complexity is O(ch). The pseudo codes for remaining algorithms
discussed in subsequent sections are not written as they are derived from the base Algorithm 2.
The steps of Algorithm 2 carried out in each time interval for new VM allocation is
summarized below.
Step 1: Lines 2–18 identifies the data center to schedule the VM based on renewable energy availability.
Step 2: Line 17 sorts the clusters within the data centers in increasing order of its energy consumption.
Step 3: Line 19 sorts the data centers, first in increasing order of total cost (renewable energy electricity
cost and carbon tax are set to 0) and then in non-increasing order of green energy availability.
Step 4: Lines 22–28 performs on-demand dynamic optimal frequency-based node selection within the
cluster and is carried out to decide the placement of VM.
5.3. Cost-Aware First-Fit Optimal Frequency VM Placement (C-FFF)
The C-FFF assumes all data centers with the only brown energy source. The C-FFF algorithm
performs data center selection based on the carbon tax, carbon footprint rate, and energy price of only
available brown energy. The C-FFF algorithm’s data center selection is the same as RC-RFFF except
after calculating ∆tot-uti in line 7 of Algorithm 2; the available green energy Gd in line 8 is set to zero.
The first-fit optimal frequency-based host selection of C-FFF is the same as RC-RFFF.
5.4. Renewable and Energy Cost-Aware First-Fit Optimal Frequency VM Placement (REC-RFFF)
REC-RFF varies from RC-RFFF in calculating total cost by eliminating carbon tax, carbon footprint
rate parameters in data center selection. In this case, when there is no sufficient renewable energy
available, the data center selection is based on the energy cost of brown energy. The brown energy
cost is estimated based on the power consumption and electricity price of corresponding data centers.
Renewable energy electricity price is set to 0. The REC-RFFF differs from RC-RFFF in calculating the
total cost in Line 18 of Algorithm 2. The CCd of Equation (5) is set to 0 while calculating total-cost TCd .
The first-fit optimal frequency-based host selection of REC-RFFF is the same as RC-RFFF.
5.5. Energy Cost with First-Fit Optimal Frequency VM Placement (EC-FFF)
The proposed EC-FFF algorithm assumes all data centers with the only brown energy source.
The EC-FFF data center selection is the same as REC-RFFF in considering only the energy cost of brown
energy for total cost and eliminating carbon emission parameters. The total cost TCd in line 18 of
Algorithm 2 concerning Equation (5) is modified with CCd set to zero and the available green energy
Gd in line 8 is set to zero. The host selection of EC-FFF is same as REC-RFFF.
5.6. Renewable and Carbon Footprint-Aware First-Fit Optimal Frequency VM Placement (RCF-RFFF)
The proposed RCF-RFFF algorithm ensures data center selection based only on carbon footprint
rate including renewable energy availability. The carbon footprint rate of the renewable source is set to
0. The RCF-RFFF differs from RC-RFFF in data center selection, in calculating total cost in line 18 of
Algorithm 2. Set CTd . as 1 in Equation (6) to calculate CCd and replace the total cost equation in line
18 of Algorithm 2 with Equation (6). The rest of the algorithm is the same as Algorithm 2. The host
selection of RCF-RFFF is same as RC-RFFF.Sustainability 2020, 12, 6383 14 of 27
5.7. Carbon Footprint Rate-Aware First-Fit Optimal Frequency VM Placement (CF-FFF)
The CF-FFF algorithm assumes data center with only brown energy. CF-FFF data center section is
the same as RCF-RFFF except Gd set to zero in line 8 of Algorithm 2. The host selection of CF-FFF is
same as RCF-RFFF.
5.8. Renewable and Carbon Cost-Aware First-Fit Optimal Frequency VM Placement (RCC-RFFF)
The RCC-RFFF data center selection is based on carbon cost obtained from Equation (6) including
the carbon tax, and carbon footprint rate excluding electricity cost. It is an extension of RCF-RFFF
and varies in calculating the total cost in line 18 of Algorithm 2. The total cost equation in line 18 of
Algorithm 2 is replaced with Equation (6) with CTd set to data center’s carbon tax. The host selection
of RCC-RFFF is the same as RCF-RFFF.
5.9. Carbon Cost-Aware First-Fit Optimal Frequency VM Placement (CC-FFF)
The CC-FFF algorithm assumes data center with only brown energy. It is the same as RCC-RFFF
except in data center selection; the Gd in line 8 is set to 0. The host selection of CC-FFF is same
as RCC-RFFF.
6. Google Cluster Workload Overview
Three versions of the cloud dataset [58] that are executed on Google compute nodes are publicly
available to make visible job types, resource usage, and scheduling constraint of the real workload.
The node receives the work in the form of a job. A job contains one or more tasks with individual
resource requirements. Linux containers are used to run each task. In this work, the second version
is used. The second version [59] holds 29 days of workload information of 11K machines from May
2011. In the second version, two tables, namely, task event table and resource usage table provide
information about resource request and resource usage of each task. The task events table provides the
timestamp, job-id, task index, resource request for CPU cores, memory and local disk space with other
related information. In the task event table each task is considered as container request. In this work,
the CPU and memory requirement for each task from the task event table is utilized for container
task categorization.
6.1. K-Medoids Clustering
K-medoids is an unsupervised partitioned clustering algorithm that minimizes the sum of
dissimilarities between objects in the cluster. It is more robust to noise and outliers. For each cluster,
one object is identified as representative of the cluster. The algorithmic procedure is as follows:
Step 1: K-values from the dataset are identified as medoids.
Step 2: Calculate Euclidean distance and associate every data point to the closest medoid.
Step 3: Swapping of a selected object and the new object is done based on the objective.
Step 4: Steps 2 and 3 are repeated until there is no change in medoids.
The repetition of steps 2 and 3 will lead to four situations as given below:
1. The current cluster member may be shifted out to another cluster.
2. Other cluster members may be assigned to the current cluster with a new medoid.
3. The current medoid may be replaced by a new medoid.
4. The redistribution does not change the objects in the cluster resulting in smaller square error criteria.
6.2. Characteristics of Task Clusters
The random sample of 15,000 records of the first-day trace of Google workload version 2 [59] is
considered in this work to identify the container types. The resource requests (processor cores andSustainability 2020, 12, 6383 15 of 27
memory) of the tasks in the trace are normalized based on the maximum resource capacity of the
machines [59]. The resource request details are de-normalized based on the machine characteristics given
in Physical machine configurations Table. The containers are executed inside the VMs. The containers
placed inside the VM share the VM resources.
Figures 4 and 5 display the percentage of task distribution among the 10 clusters identified using
K-medoids algorithm presented in Section 6.1. The data pattern represents the container resource
requirement. The first four clusters contribute to 67.47% of the overall tasks and the remaining 32.53%
is shared between clusters 5 to 10. The tasks under clusters 1 to 4 can be categorized as tasks with
minimum resource requirements. The tasks under clusters 3, 4, 5, 7 and 9 can be categorized as
tasks with medium resource requirements. Tasks under 6 and 10 can be categorized as the highest
resource requirement. Cluster 2 has the highest contribution of 23.8% of tasks with the request for
2.5 CPU cores and 2 GB. The task clusters 5 to 10 display tasks with CPU requirements more than
6 cores and memory requirements more than 7 GB. Task clusters 6 has a 1.5% contribution with the
highest CPU and memory request of 22 and 27Gb. Task cluster 10 holds 1.5% with the highest CPU
requirement of 30 cores and memory requirement of 9 GB. The statistics of data, the task with more
resource requirements, has less frequency of occurrence than the tasks with medium and minimum
requirements. The medoids identified under each cluster are considered as the representative of the
cluster to determine the appropriate container size for the task within the cluster, as given in Table 2.
Figure 4. Clusters based on resource requests of the task.
Figure 5. Clusters based on resource requests.Sustainability 2020, 12, 6383 16 of 27
Table 2. Cluster types with container configuration based on the resource request.
Cluster Type vCPU Memory (MB)
1 0.5 186.496
2 2.5 1889.28
3 6 4890.88
4 6.25 2234.88
5 12.5 9781.76
6 22.19 27,686.4
7 8.5 9781.76
8 6.25 10,968.32
9 18.75 7304.96
10 30 9781.76
6.3. Resource Request-Based Optimal VM Sizing for Container Services (CaaS)
After identifying the cluster types for the tasks from the selected dataset, the virtual machine sizing
to execute the tasks of each cluster type has to be identified. The containers are executed on the virtual
machines. The virtual machine resources are shared between the containers. The physical machines
are partitioned into virtual machines. VM utilizes the virtualization technology to enable the sharing
of physical resources with resource isolation and increases the utilization of the physical resource.
To estimate the effective VM size for hosting, the identified cluster types the frequency of occurrence
of the task, and its resource usage in each cluster on an hourly basis for 24 h duration is estimated.
The resource requirement per hour (CPU-req-hourh−C1 ) for the tasks in cluster C1 are calculated based
on the average number of tasks (Num_taskh−C1 ) and average resource usage (CPU_Usageh−C1 ) of the
tasks belonging to C1 executed in the system in the hourly basis (h). The CPU-reqh−C1 is approximated
based on frequency of occurrence within 24 h period.
The number of CPU that a virtual machine can hold depends on the capacity and the number of
virtual machines hosted on a particular physical machine. The number of vCPU a virtual machine can
hold depends on the infrastructure and the limit set by the provider. The virtual machine CPU (vCPU)
for a VM is decided by dividing CPU-reqh−C1 obtained for hourly basis by an integer m. The integer
variable m holds a value between 2 to 9. The set of values obtained by dividing CPU-reqh−C1 by m with
modulus zero is considered for vCPU sizing.
The virtual machine vCPU configuration for a specific cluster C1 is estimated on hourly basis
(h) as
CPU-reqh-C1 = (Num_taskh-C1 × CPU_Usageh-C1 )/m
The virtual machine memory configuration for a specific cluster C1 is estimated as
mem-reqh-C1 = (Num_taskh-C1 × mem_Usageh-C1 )/m
The further virtual machine vCPU and memory are identified for each cluster based on better
match on number of physical machines and available capacities.
6.4. Determine Optimum Number of Tasks for VM Types
The optimum number of tasks is estimated for each virtual machine type for efficient utilization
of virtual machines using Algorithm 3. The aim of this mapping is to avoid underutilization of virtual
machines. The Algorithm 3 determines the minimum number of tasks of a cluster type for maximum
utilization of each VM type resources. Each cluster type is mapped to the VM types identified in the
previous Section 6.3 and the list of feasible VM types are identified as given in Tables below. MinimumSustainability 2020, 12, 6383 17 of 27
numbers of tasks Nt for maximum utilization of feasible VMs for each cluster is considered. Table 3
presents the container to VM mapping based on Algorithm 3. The tasks to VM mapping algorithm
identifies the minimum number of tasks to maximize VM utilization. The tasks are mapped to the
VMs based on Table 3.
Algorithm 3: Identify optimum number of tasks from each cluster for a VM type
Input: Task-List, VM-instanceist,
Output: NT (task-type, VMtype)
For each tasktype in Task-List
For each VMtype in VM-instancelist
Nt = Find the minimum number of tasks of tasktype that causes maximum utilization of
VMtype resources.
i.e., Min (Ntmax-CPU ,Ntmax-Mem )
NT (tasktype,Vmtype).add(Nt)
End
End
Table 3. Optimal number of containers for VM types.
Task Type VM Type-1 VM Type-2 VM Type-3 VM Type-4 VM Type-5
1 12 24 48 36 60
2 2 5 7 - 12
3 1 2 3 - 5
4 - 2 4 3 5
5 - - - 1 2
6 - - - - 1
7 - 1 - 2 3
8 - - - 1 3
9 - - 1 - 2
10 - - - - 1
7. Performance Evaluation
The experimental setup and the results obtained from the aforementioned VM placement
algorithms are discussed in this section. In view of the expenditure and time involved in the assessment
of comprehensive experimentation in real-time, environment simulation is done using MATLAB.
7.1. Experimental Environment for Investigation of Resource Allocation Policies
7.1.1. Data Center Power Requirement
The power consumption of the task is measured based on processor power consumption incurred
due to its utilization. All the servers are considered to be in off state when not in use consuming no
power. 23 ◦ C is considered as the data center’s safe operating temperature. The peak server load
(IT load) power evaluation of the data center is expected ≈ as 52 kW for the server specification given
in Table 4. The floor space of the data center is measured ≈ as 500 square feet. The sum of electricity
power requisite is measured as ≈124 kW (including cooling load, UPS, lighting). The total processor
power consumption of the servers is supposed to be within 17.30 kW. The cooling load due to processor
utilization is restricted to 12.11 kW [60]. The renewable-aware algorithms assume clusters powered
by both grid and renewable energy in all the data centers. The clusters are powered by either one ofSustainability 2020, 12, 6383 18 of 27
the energy sources at a time. The cooling devices are powered only by grid energy source in all the
data centers.
Table 4. Physical machine configurations.
Machines Core Speed (GHz) No. of Cores Power Model Memory (GB)
M1 1.7 2 1 16
M2 1.7 4 1 32
M3 1.7 8 2 32
M4 2.4 8 2 64
M5 2.4 8 2 128
7.1.2. Data Center Physical Machine Configuration
Tables 4 and 5 correspond to the heterogeneous physical machines used in this simulation with
varying power models based on the SPEC power benchmark [61]. In order to evaluate the algorithms
presented in Section 5, an IaaS is modeled using four small scale data centers with 100 heterogeneous
servers located in four cities, namely Jacksonville, Miami, Orlando and Tampa. Each data center has
two clusters of heterogeneous machines powered by both renewable and grid power. The machines in
each cluster follow a particular power model. All data centers are assumed to have a cooling device
with CoP as in Equation (4) powered only by grid power. VM reservations are modeled as in Table 6
based on Section 6.3. Each data center holds two clusters with unique carbon footprint rates. The data
center’s cluster carbon footprint rate, energy price and carbon tax are observed based on [62,63] and
given in Table 7 [38].
Table 5. Utilization (%) and server power consumptions in watts.
Power Utilization Percentage
Idle
Model 10 20 30 40 50 60 70 80 90 100
1 60 63 66.8 71.3 76.8 83.2 90.7 100 111.5 125.4 140.7
2 41.6 46.7 52.3 57.9 65.4 73 80.7 89.5 99.6 105 113
Table 6. VM request types.
VM Type vCPU Memory (GB)
Type-1 1 7.2
Type-2 2 14.4
Type-3 4 15.360
Type-4 3 17.510
Type-5 5 35.020
Table 7. Features of data center.
Carbon Footprint Rate Carbon Tax Energy Price
Data Center
(tons/MWh) (dollars/ton) (cents/kWh)
DC1 0.124 24 6.1
DC2 0.350 22 6.54
DC3 0.466 11 10
DC4 0.678 48 5.77
7.1.3. Solar Energy
The hourly solar irradiance and temperature data was reported for the entire year of 2018 [64].
The solar output power (P) based on Equation (16) was used to generate solar energy (kWh/m2 /day) for
four data centers. With the Solarbayer configuration detail of flat-plate collectors of 2684 m2 enclosedSustainability 2020, 12, 6383 19 of 27
with fixed angle [65], the solar power output (P) for mean solar irradiance β (kW/m2 ) and ambient
temperature T is calculated as [66] (Equation (16)):
P = λ × A × β (1 − 0.005(T − 25)) (16)
The A (m2 ) is the area of the solar unit; λ is the conversion coefficient of solar. We assume the solar
energy trace as 0 between prior to 6 a.m. and after 6 p.m. Figure 6 displays the solar power generated
at different locations.
Figure 6. Solar power generations.
7.2. Experimental Results
The Google workload is studied and the tasks are clustered according to their resource request
pattern utilizing the clustering presented in Section 6.1. The VM sizing listed in Table 6 are based
on the procedure defined in Section 6.3. In our experiment, the identified task containers are hosted
in corresponding virtual machine types in each processing window. Each processing window is
considered to have duration of 300 s. At the start of each processing window, input request is received.
Based on the Lublin-Feitelson model [67], the arrival pattern of identified task containers along with
the number of tasks and runtime of the task is generated. The Gamma and hyper Gamma Lublin
parameters are utilized to generate tasks with varying holding time with a standard arrival time model.
The task containers are mapped to appropriate VM types. Figure 7 displays the CPU demand of
VM types for task containers in the generated workload. Only the active execution time of VM is
considered. Each VM is assigned a minimum of the single physical core of the host. All containers get
the same portion of CPU cycles. CPU limit and CPU requests are considered the same. This work
considers only CPU utilization of the VM and does not consider communications between VM and
containers. Memory limit and memory requests are considered the same for guaranteed quality of
service class. The local disk space 10GBis assumed, allotted for each virtual machine to provide enough
space for operating system installation on each VM. The experimental setup is used to evaluate the
proposed VM placement model in terms of carbon cost, consumption of green energy, consumption of
brown energy, carbon footprint and total operating cost.Sustainability 2020, 12, 6383 20 of 27
Figure 7. CPU demand for VM requests.
7.2.1. Energy and Cost Efficiency of the Proposed Algorithms
We evaluate the proposed VM placement algorithms to explore the impact on grid energy,
solar energy consumption, carbon emission and total cost for the CPU demand presented in Figure 6.
The renewable-based algorithms, namely, RC-RFFF,REC-RFFF,RCF-RFFF,RCC-RFFF, offers high priority
to renewable sources during its availability to power the servers. When there is insufficient renewable
source, the data center selection policy is independent for each proposed algorithm based on total cost
(TC), carbon cost (CC), and electricity cost (EC). Grid energy-based algorithms, namely, C-FFF, EC-FFF,
CF-FFF and CC-FFF, considers only grid source with independent data center selection policy based
on the aforementioned parameters.
7.2.2. Discussion on Grid Energy Consumption and Carbon Footprint Emission
The quantity of brown energy consumption by different VM placement algorithms is depicted in
Figure 8. In C-FFF, eliminating renewable energy availability with total cost reduction as an objective,
considering varying electricity price and carbon tax, the brown energy usage is 11,222.78 kWh with 95%
confidence interval (CI): (1007.74, 14,875.94). In RC-RFFF, considering total cost reduction, the brown
energy usage is 7220.28 kWh with 95% confidence interval: (218.44, 14,869.16). It is noticed that the
RC-RFFF brown energy usage is 35.6% lesser than C-FFF due to renewable energy consideration.
In EC-FFF with electricity cost reduction as an objective without the consideration of green energy,
the brown energy consumption is 11,128.31 kWh with 95% CI: (958.84, 14,881.43). In REC-RFFF,
the brown energy usage is 6913.23 with 95% CI: (277.13, 14,878.51). The obtained results reveal that
the REC-RFFF brown energy usage is 37.8% less than EC-FFF due to renewable energy consideration.
Similarly in CF-FFF, the brown energy usage is 12,131.7 kWh with 95% CI: (975.20, 14,875.44).
In RCF-RFFF, it is 7903.63 with CI: (272.06, 14,871.14) which is 34.85% lesser than CF-FFF. In CC-FFF,
the brown energy consumption is 12,029.22 kWh with 95% CI: (1028.02, 14,870.66). In RCC-RFFF,
the energy consumption is 7869.22kWh with CI: (269.13, 14,867.92) which is 34.58% lesser than CC-FFF.
It can be inferred from the results obtained that the renewable-based algorithms’ counterparts hold
less brown energy usage due to the algorithms’ nature of scheduling the workload to the data centers
based on green energy availability to maximize its usage.Sustainability 2020, 12, 6383 21 of 27
Figure 8. Grid power consumption of servers.
In Figure 9, the carbon emission of the proposed algorithms is compared. The renewable-based
algorithms hold less carbon emission than grid energy consumption. The C-FFF emits 0.44441 tons of
carbon with 95% CI: (0.03716, 0.59748). The RC-RFFF emits 0.29734 tons with CL: (0.01794, 0.59738)
yields 33.09% less than the former. The EC-FFF holds 0.45197 tons with CL: (0.03796, 0.59842) and
CF-FFF holds 0.46218 with CL: (0.02619, 0.59758). Similarly, the REC-FFF holds 0.30034 with CL:
(0.02234, 0.59792) and RCF-FFF holds 0.30121 with CI: (0.01084, 0.59745). Both the approaches lead to
approximately 34% less carbon emission than the grid counter parts.
Figure 9. Carbon emission.
It is noteworthy to mention that the energy consumption and carbon emission of renewable-
based algorithms in the beginning intervals is significantly less than grid-based algorithms and has
more similar power consumption at later intervals which reveals the uncertainty of renewable energy
availability in all the intervals within a day. 1
7.2.3. Discussion on Total Cost
Figure 10 portrays the total operating cost of the proposed algorithms. The C-FFF approach
results in total operating cost of 92.29$ with 95% CL: (7.99, 122.79). The RC-RFFF yields 65.35$ with CL:You can also read