Options to Expand Availability of Weather Station Data & Decision-Support Tools - Project Report
←
→
Page content transcription
If your browser does not render page correctly, please read the page content below
Regional
                                              Adaptation Program

                                              BC Agriculture & Food
                                                  Climate Action
                                                     Initiative

Kootenay & Boundary, British Columbia, 2020

Options to Expand Availability
of Weather Station Data &
Decision-Support Tools

Project Report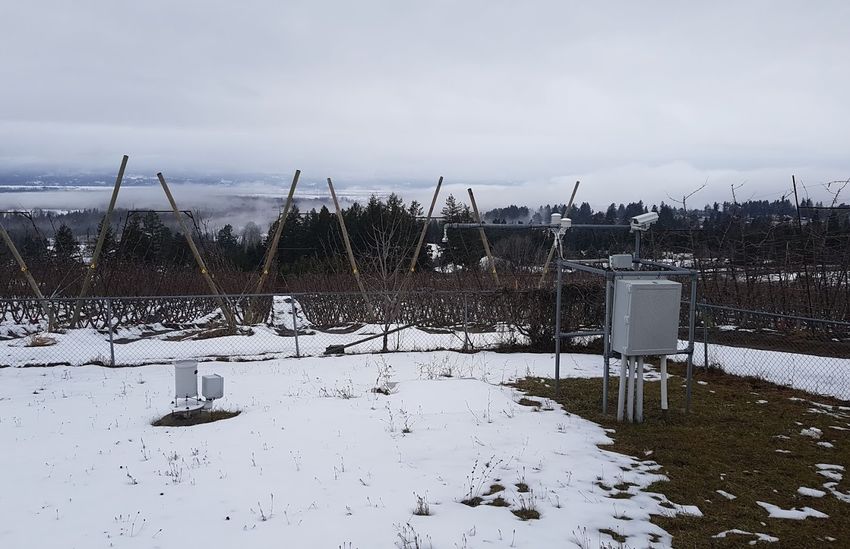
Kootenay & Boundary — Options to Expand Availability of Weather
                   Station Data & Decision-Support Tools: Project Report

                   Prepared by Peak HydroMet Solutions,
                   under project kb01 of the Regional Adaptation Program,
                   a program delivered by the BC Agriculture & Food Climate Action Initiative.

                   Published by BC Agriculture & Food Climate Action Initiative, 2020.

                   Learn more at
                   www.bcagclimateaction.ca/project/kb01
                   www.bcagclimateaction.ca/regional/overview/

Copyright                                Citation Format                         Disclaimer

Copyright © 2020 BC Agriculture &        In-text:                                Agriculture and Agri-Food Canada
Food Climate Action Initiative.          Peak HydroMet Solutions 2020            and the BC Ministry of Agriculture are
                                                                                 committed to working with industry
Available to print and/or distribute     Reference List:                         partners. Opinions expressed in this
under a Creative Commons Attribution-    Peak HydroMet Solutions. 2020.          document are those of the author and
NonCommercial-NoDerivatives 4.0          Kootenay & Boundary — Options           not necessarily those of Agriculture and
International License.                   to Expand Availability of Weather       Agri-Food Canada, or the BC Ministry
creativecommons.org/licenses/            Station Data & Decision-Support         of Agriculture. The Government of
by-nc-nd/4.0/                            Tools: Project Report. BC Agriculture   Canada, the BC Ministry of Agriculture,
                                         & Food Climate Action Initiative.       and their directors, agents, employees,
                                         www.bcagclimateaction.ca                or contractors will not be liable for any
                                                                                 claims, damages, or losses of any kind
                                                                                 whatsoever arising out of the use of, or
                                                                                 reliance upon, this information.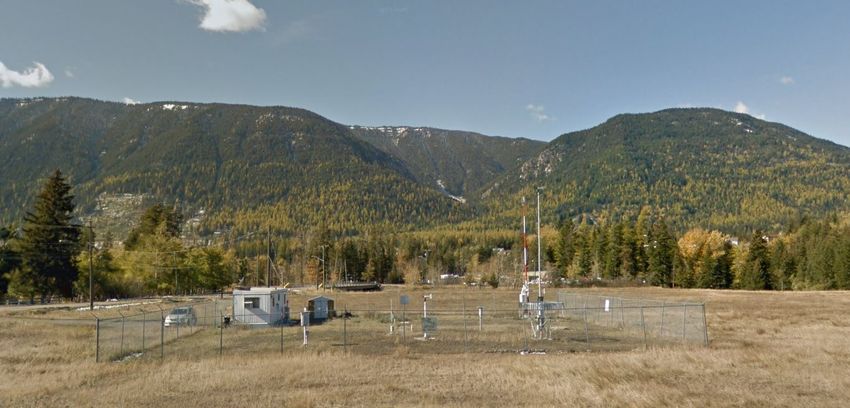
Acknowledgments
This report was prepared by Andrew Nadler (Agricultural   Mark Stephens (Regional District of Kootenay Boundary);
Meteorologist at Peak HydroMet Solutions), in             Jody Murdoch (Kootenay Livestock Association); Rachael
collaboration with Frank Poulsen (Hydrologist and         Roussin (Kootenay & Boundary Farm Advisors); Paul
Software Engineer at Ashlu Environmental Consulting)      Schwinghamer (Growers Supply); Melissa Tesche & Molly
and Duane Holder (Horticultural Consultant at             Thurston (Okanagan Sterile Insect Release Program); Ted
FarmQuest Consulting Ltd), in partnership with the BC     van der Gulik (Partnership for Water Sustainability); and
Agriculture & Food Climate Action Initiative.             Ted Weick (BC Ministry of Environment).

The Project Oversight Committee included:                 Kootenay & Boundary Agricultural Adaptation Working
 → Kristina Anderson & Elizabeth Moore,                   Group included representatives representation from:
     Regional District of Kootenay Boundary                → Kettle River Stockmen’s Association
 → Brad Braun, Hummingbird Farm                            → Kootenay & Boundary Farm Advisors
 → Kevin Murphy & Stephanie Tam,                           → Kootenay Livestock Association
     BC Ministry of Agriculture                            → Kootenay Milk Producers’ Association
 → Rachael Roussin, Kootenay & Boundary                    → Kootenay Organic Growers’ Society
     Farm Advisors
                                                           → Regional District of East Kootenay
 → Ken Shukin, Shukin Orchards
                                                           → Regional District of Central Kootenay
 → Harmony Bjarnason, BC Agriculture & Food
                                                           → Regional District of Kootenay Boundary
     Climate Action Initiative
                                                           → Windermere District Farmer’s Institute
The author also thanks the following individuals for       → BC Ministry of Agriculture
their valuable input: Faron Anslow (Pacific Climate        → BC Agriculture & Food Climate Action Initiative
Impacts Consortium); Kris Belanger & Fiona Dercole
(Regional District of East Kootenay); Dave Brown &
                                                          Funding for this project has been provided in part by
Vincent Jones (Washington State University); Rishi
                                                          Regional District of Kootenay Boundary and in part
Burlakoti, Aston Chipanshi, Gary Judd & Nathaniel
                                                          by the governments of Canada and British Columbia
Newlands (Agriculture and Agri-Food Canada); Brad
                                                          under the Canadian Agricultural Partnership, a federal-
Illston (Oklahoma Mesonet); Shauna MacKinnon
                                                          provincial-territorial initiative. Funding is administered by
(BC Agricultural Climate Adaptation Research
                                                          the Investment Agriculture Foundation of BC and the BC
Network); Mike Malmberg (retired agrologist); Neil
                                                          Agricultural Research & Development Corporation.
Magrath (ROM Communications); Chris Marsh &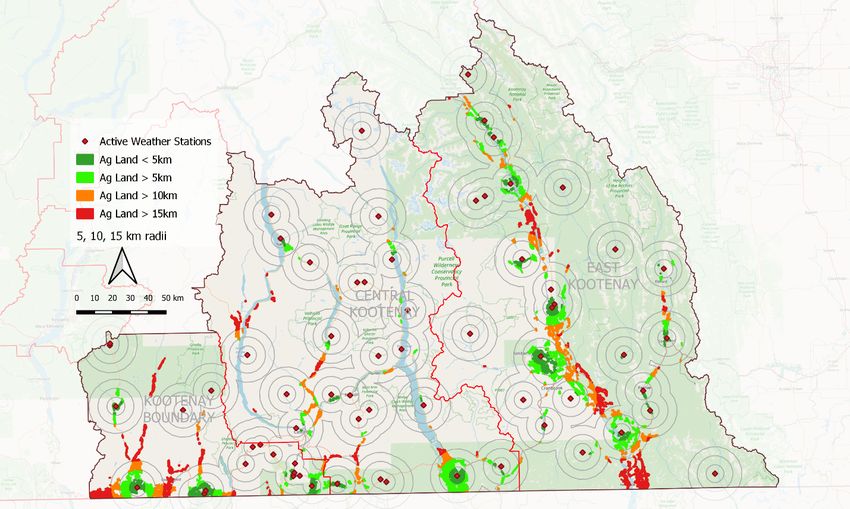
Executive Summary
This report provides an assessment of weather monitoring and decision support tools that are available
to agricultural producers in the Kootenay & Boundary region, along with recommending some strategies
to expand and improve the current situation. The project addresses elements of the Kootenay &
Boundary Adaptation Strategies1. Specifically, Actions 3.1, that include “Expand weather station
coverage and improve producer access to station data” and “Develop decision support tools and
resources linked to weather data”.

A gap assessment reveals that there are large areas of farmland that lack any regional station coverage.
Twelve locations are identified and ranked in order of additional agricultural land that would be
represented by new stations. Further local monitoring is recommended for the Creston Valley to address
the on-farm needs of the tree fruit industry. Equipment that would be suitable for regional and local
monitoring is recommended.

As the region enhances its weather monitoring capabilities by establishing new stations, data should be
configured to flow to Farmwest, which would immediately provide some basic visualization and
agronomic tools. Farmwest would benefit from secure funding that would help to implement
improvements in functionality and features. As a longer-term strategy, the region should explore
partnering with other regions to develop its own agricultural platform. Tree fruit growers are advised to
collaborate with the Sterile Insect Release program about expanding the BC Decision Aid System (BC
DAS) to the Creston and Grand Forks areas.

Some of the challenges related to weather forecasts are addressed in this report. Specifically, the
limitations of regional forecasts. Growers are encouraged to consult some of the publicly available local
forecasts, as well as some of the tools that can provide insight into forecast accuracy. To provide
improved spatial resolution, a more site-specific forecast should be implemented in favour of the
existing regional forecast.

As the region’s weather program progresses, partnerships between stakeholders will be critical. Groups
like the BC Agriculture & Food Climate Action Initiative, BC Agricultural Climate Adaptation Research
Network, Pacific Climate Impacts Consortium, Climate Related Monitoring Program, and the Ministry of
Agriculture will play key roles. Collaboration with these groups needs to continue.

ii                                           WEATHER DATA AND TOOLS – KOOTENAY & BOUNDARY
Acronyms
      AAFC     Agriculture and Agri-Food Canada
      ACARN    BC Agricultural Climate Adaptation Research Network
      ACIS     Alberta Climate Information Service
      AGRI     BC Ministry of Agriculture
      ALUI     Agricultural Land Use Inventory
      API      Application programming interface
      ASWS     Automated snow weather stations
      AWN      Ag Weather Network
      BC DAS   BC Decision Aid System
      BCWS     BC Wildfire Service
      BMP      Beneficial Manager Practice
      CAI      BC Agriculture & Food Climate Action Initiative
      CFFDRS   Canadian Forest Fire Danger Rating System
      CRMP     Climate Related Monitoring Program
      DAS      Decision Aid System
      ECCC     Environment and Climate Change Canada
      EFP      Environmental Farm Plan
      GCM      General circulation model
      GEPS     Global Ensemble Prediction System
      GRAF     Global High-Resolution Forecasting System
      Ha       Hectare
      HRDPS    High-Resolution Deterministic Prediction System
      LPWAN    Low power wide area network
      MSC      Meteorological Service of Canada
      MTI      BC Ministry of Transportation and Infrastructure
      NoN      Network of Networks
      NWP      Numerical weather prediction
      NWS      National Weather Service
      OK SIR   Okanagan Sterile Insect Release
      OSCAR    Observing Systems Capability Analysis Review
      PCIC     Pacific Climate Impacts Consortium
      PFCA     Pacific Field Corn Association
      PWS      Personal weather station
      QC       Quality Control
      RDCK     Regional District of Central Kootenay
      RDEK     Regional District of East Kootenay
      RDKB     Regional District of Kootenay Boundary
      RMSE     Root mean square error
      TAHMO    Trans-African Hydro-Meteorological Observatory
      WSU      Washington State University
      WMO      World Meteorological Organization

iii                  WEATHER DATA AND TOOLS – KOOTENAY & BOUNDARY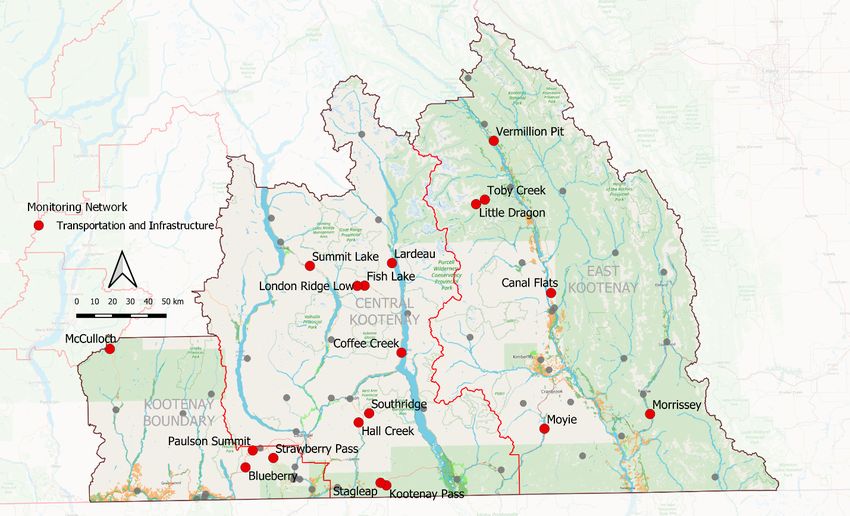
Contents
Introduction ............................................................................................................................................ 1
The Region .............................................................................................................................................. 2
Weather Monitoring ................................................................................................................................ 2
Weather Network Assessment................................................................................................................. 4
       Existing Networks ............................................................................................................................ 5
       Gap Analysis .................................................................................................................................. 15
       Tiered Approach ............................................................................................................................ 20
Hardware .............................................................................................................................................. 21
       Sensors .......................................................................................................................................... 21
       Accuracy ........................................................................................................................................ 22
       Communications ............................................................................................................................ 24
       Complexity..................................................................................................................................... 25
       Hardware Selection........................................................................................................................ 26
Data Management Platform .................................................................................................................. 28
       Quality Control .............................................................................................................................. 29
       Decision Support ............................................................................................................................ 30
       User Interface ................................................................................................................................ 31
       Existing Platforms .......................................................................................................................... 32
       Platform Recommendations........................................................................................................... 37
Addressing the Gaps .............................................................................................................................. 37
       Funding.......................................................................................................................................... 37
       Operation and Maintenance .......................................................................................................... 38
       Training ......................................................................................................................................... 38
       Collaborative Approach.................................................................................................................. 39
Weather Forecast .................................................................................................................................. 40
       Forecast Regions ............................................................................................................................ 40
       Forecast Providers ......................................................................................................................... 41
       Multiple Opinions .......................................................................................................................... 43
       Weather Stations and Forecasts ..................................................................................................... 44
The Path Forward and Summary of Recommendations .......................................................................... 45
References ............................................................................................................................................ 46

iv                                                                WEATHER DATA AND TOOLS – KOOTENAY & BOUNDARY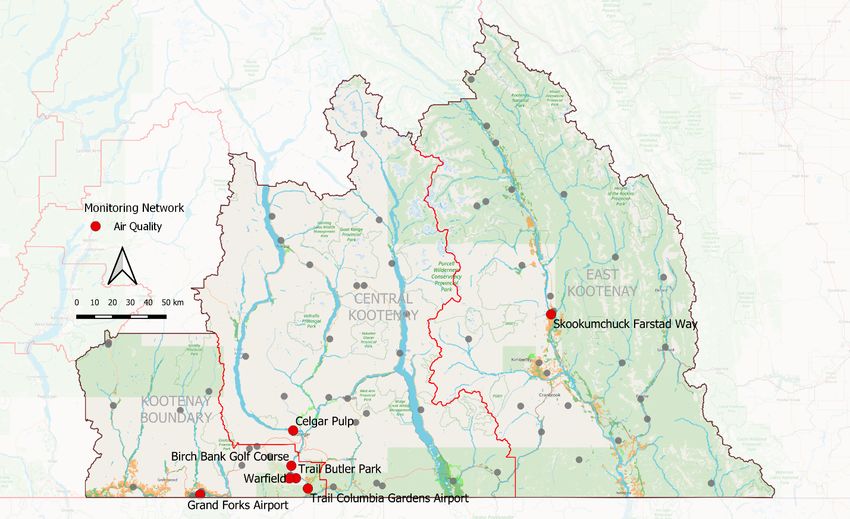
List of Figures
Figure 1: Farmland use within the Regional Districts ................................................................................ 2
Figure 2: Number of weather stations from 1950 through 2019 ............................................................... 3
Figure 3: Evolution of weather station network operators in BC since 1950 ............................................. 3
Figure 4: Environment and Climate Change Canada stations .................................................................... 6
Figure 5: Sparwood ECC weather station ................................................................................................. 7
Figure 6: Creston ECCC station looking west ............................................................................................ 7
Figure 7: Wild Fire Management Branch stations ..................................................................................... 8
Figure 8: Transportation and Infrastructure (Road Weather) Stations ...................................................... 9
Figure 9: Transportation and Infrastructure weather station.................................................................... 9
Figure 10: Air Quality Network Stations ................................................................................................. 10
Figure 11: Automated Snow Pillow Network Stations............................................................................. 11
Figure 12: BC Hydro Weather Station..................................................................................................... 12
Figure 13: Farmwest Weather Station .................................................................................................... 13
Figure 14: Farmwest weather station located at Grand Forks................................................................. 13
Figure 15: Weather Underground Personal Weather Stations ................................................................ 14
Figure 16: Select Bayer Canada weather stations in East Kootenay ........................................................ 15
Figure 17: Agricultural land shown within distances from active weather stations ................................. 17
Figure 18: Proposed locations for additional weather stations ranked from 1 though 12. ...................... 19
Figure 19: Recommended enhanced monitoring areas in the Creston Valley ......................................... 21
Figure 20: Davis Rain Collector and the Hydrological Services TB3.......................................................... 23
Figure 21: Examples of the Davis/ROM station and the METER ATMOS41/ZL6 stations .......................... 27
Figure 22: Farmwest weather station map ............................................................................................. 33
Figure 23: An example of the Growing Degree Day calculator on Farmwest.com ................................... 34
Figure 24: BC Peace Agri Weather Network website showing current conditions ................................... 36
Figure 25: Environment and Climate Change Canada Forecast Regions in Southeastern BC.................... 40
Figure 26: Daily weather forecasts for Grand Forks and Nelson on farmwest.com. ................................ 42
Figure 27: Meteoblue Multi-model ensemble output for Creston .......................................................... 43
Figure 28: SpotWX map showing output grids from the various numerical models ................................ 44
Figure 29: SpotWX chart showing the HRDPS Continental model output ................................................ 44

List of Tables
Table 1: List of proposed locations for additional weather stations ........................................................ 19
Table 2:Comparison between Davis /ROM Communications and METER ATMOS41/ZL6 stations ........... 28
Table 3: Comparison of forecast accuracy among some of the main US providers .................................. 41

v                                                           WEATHER DATA AND TOOLS – KOOTENAY & BOUNDARY
Introduction
This study was prioritized as an outcome of consultations with agricultural producers throughout the
Kootenay & Boundary region. An overwhelming theme that emerged was the need for improved
weather monitoring and access to decision support tools. In times of unpredictable weather and
numerous production challenges, such tools can help farmers to better manage their crops and become
more sustainable.

No sector relies on the weather more than agriculture. Accurate weather data, relevant decision aids,
and reliable forecasts provide advantages to producers in risk mitigation, pest management, irrigation
planning and application, soil fertility, and timing of field operations. Alternatively, inaccurate weather
information can contribute to management mistakes and inaccurate assessments of flooding, drought,
or other impactful perils, thus hindering resilience and response. Unreliable forecasts can lead to
product application or farm operations that are wasteful, costly, or damaging with little or no benefit.

Accurate and consistent long-term weather data helps to quantify the occurrence of climate change and
enables monitoring and detection of extreme events, serving as a basis for adaptation and risk
mitigation. Being able to determine which areas are at risk of hazards such as extreme heat, drought,
wildfire, or flooding, can assist producers in being prepared and ensure that assistance gets allocated
where it is most needed. Yet the rural agricultural landscapes are often the least monitored of all areas.
Producers are forced to rely on weather information that is measured at faraway locations and must
depend on forecasts that have little or no on-farm value.

The Kootenay & Boundary region is a vast area of topographically complex character and diverse
climatic conditions that vary over small distances. A small number of regional climate stations cannot
adequately represent this variability. Accurate weather information is critical for planning, design, and
for day-to-day operations.

This report has three main objectives. First is to assess the weather monitoring networks in the
Kootenay & Boundary region to identify gaps that are relevant to agriculture. Second is to identify
options and strategies to address the identified gaps. And the third is to recommend tools that would
help users acquire the most benefit from improved weather data. Considerations include the
accessibility and usability of weather data and options for decision support tools and improved local
forecasts.

The project has involved reviewing previous work, analysis of existing monitoring networks, and many
conversations with informed stakeholders from within as well as from outside of the region. These
conversations have been extremely helpful in formulating a path forward for the region – both in
identifying the needs of the sector and in devising strategies to address them.

1|P a g e                                     WEATHER DATA AND TOOLS – KOOTENAY & BOUNDARY
The Region
Kootenay & Boundary region covers 57,721 km2 of BC’s southeast - just over 6% of the province’s total
area. It includes the Regional Districts of Kootenay Boundary (RDKB), Central Kootenay (RDCK) and East
Kootenay (RDEK).

Figure 1: Farmland use within the Regional Districts

Most of the region’s landmass is non-agricultural and not at all suited to agriculture due to elevation,
slope, and poor soils. Across the three regional districts, the farmland makes up 127,129 ha or 2.2% of
the total area. 2 Of the farmland, natural and tame pasture make up the largest component, at 81,300
ha or 64% while crop land occupies 23,411 ha or 18% (Figure 1). Pasture occupies 73% of farmland in
RDEK, 69% in RDKB, and 24% in RDCK.3,4,5

Approximately 9,641 ha of the cropland is irrigated, including nearly all tree fruits, vegetables, and
nurseries. However, water can be limited due to unstable water supplies, expansion of irrigation, and
development of urban centers.

Agricultural activities vary considerably across the region, with very different values associated with
each production-type in relation to area. Some sectors, such as the tree fruits, have low acreage, but
very high productivity and returns per unit of land. The degree of management required per hectare of
orchard compared to pastureland is completely different. Orchards may require thousands of dollars in
inputs to manage certain pests while pastureland may require little or none. The purpose of this
comparison is not to rank the importance of one production type to another – but to acknowledge that
some very small areas represent very high value and often, a higher degree of production risk.

Within the Kootenay & Boundary region, nearly all commercial tree fruit production, approximately 338
ha, is in the Creston valley.6 Approximately 231 ha of this is cherries. Such factors are considered when
determining appropriate weather station density across the region. Crops that require a high degree of
management will benefit from more site-specific data, thus weather station density in these areas
should be higher.

Weather Monitoring
Weather information has traditionally been considered a public good, operated within the public
domain, and funded though public dollars. Official meteorological observations began when the

2|P a g e                                              WEATHER DATA AND TOOLS – KOOTENAY & BOUNDARY
Meteorological Service of Canada (MSC) was first being organized as a dominion-wide weather-survey
around 1870. For the first 100 years, MSC a division of Environment and Climate Change Canada (ECCC)
(formerly Environment Canada) was the sole organization monitoring weather across the country. This
resulted in a basic or regional level of weather monitoring that left certain geographic areas and sectors
under-represented.

The monitoring network has seen many changes over the years. From the early 1970’s through to the
mid-1990’s, there were a total of over 500 manual and automated ECCC stations in BC. This number has
since diminished to less than 200 stations today. Figure 2 shows the total number of weather stations in
BC and Kootenay & Boundary region along with the proportion of ECCC stations. Within the Kootenay &
Boundary region, the ECCC network went from its peak of 59 stations in 1975 to a very gradual decline
over the subsequent 45 years to only 12 stations remaining today.

   Figure 2: Number of weather stations in all of BC and in the Kootenay & Boundary region from 1950 through 2019

Certain organizations have recognized the gaps in monitoring, particularly in the locations where they
need accurate and reliable weather information for specific applications. This has led to a
transformation in the proportion of the network that is being operated by ECCC. Until the mid-1960’s,
ECCC operated almost every weather station across the province and within the Kootenay & Boundary
region. In 1950, there were 246 weather stations in BC. All but 5 were operated by ECCC. By 1980, 38%
of the weather stations in BC were operated by other agencies. In 2000, non-ECCC stations made up
56% of the overall station networks. Today, ECCC stations only make up 27% of the monitoring network
while 73% of stations are operated by other agencies. BC Wildfire Service stations comprise the largest
segment at 30% with 209 stations (Figure 3).

Figure 3: Evolution of weather station network operators in BC since 1950

3|P a g e                                             WEATHER DATA AND TOOLS – KOOTENAY & BOUNDARY
This gradual shift from an almost fully ECCC-operated network to multiple network operators has been
fueled mainly by the various organizations’ need for spatially relevant weather data. For example, many
of the early ECCC weather stations were operated by volunteer observers, who were generally located
in somewhat populated areas. This provided little representation of remote forested regions, those of
concern for determining the extent by which weather conditions impact wildfire risk. Likewise,
transportation requires accurate weather data along roadways, including high mountain passes.
Agencies responsible for flood forecasting rely on accurate snowpack and temperature data to predict
peak runoff and river flow. These types of needs have motivated governments, agencies, producer
groups, private companies, and individuals to invest in their own purpose-specific monitoring networks.

Agriculture is highly reliant on the weather and benefits from accurate weather information. In BC, there
has been a relatively modest investment of resources into monitoring networks while other provinces
and states have built impressive systems at considerable cost. Alberta Agriculture has established over
150 climate stations to address under-represented agricultural areas, providing access to over 350
stations on their Alberta Climate Information Service (ACIS).7 Quebec has over 200 agricultural weather
stations as part of their Réseau Météorologique Coopératif du Québec.8 Manitoba has 109 agricultural
weather stations in their Ag-Weather Program.9 Washington State has established 168 weather stations
since 1988 to support their AgWeatherNet (AWN) program.10

Weather Network Assessment
It is impossible to adequately represent the true variability of weather across a landscape based on a
single monitoring point. Factors like temperature, humidity, rainfall, and wind, can vary tremendously
over distance and elevation. While a weather station can provide highly accurate measurements for a
specific location, these measurements are unlikely to adequately represent the surrounding region.
Continuous phenomena that are only measured at certain locations inevitably leave uncertainty across
the unsampled area.

The further apart the weather stations, the more the uncertainty across the landscape, exacerbated by
changes in elevation, slope, and land cover. For those closer to a weather station, the measurements
taken at that station are reasonably representative. However, as distance from that station increases, so
do the differences in weather. Thus, the conditions experienced at one location may have little
resemblance to what the regional station is measuring a few kilometres away.

Inadequate meteorological monitoring networks is a common issue, particularly among industries that
are vulnerable to the weather and in areas where the weather is highly variable. Other reports have
looked at the adequacy of monitoring networks for various applications. In 2018, a BC-wide gap analysis
reviewed the representativeness of monthly precipitation within 30% of the nearest weather station’s
value.11 The study concluded that for monthly accumulations, the observational coverage is sufficient in
agricultural regions. However, for shorter time periods – such as daily or hourly, major gaps exist. Daily
and sub-daily weather information is of most use for a producer making management decisions.

The study also assessed distances from agricultural regions to the nearest and second nearest weather
stations. In the Kootenay & Boundary region, the median distance to the nearest and second nearest
stations were found to be reasonable distances of 7 and 14 km, respectively. However, the maximum
distances to stations were much further at 49 and 50 km, respectively. The study concluded that BC
requires improved weather monitoring to support agricultural production and to help ensure food

4|P a g e                                    WEATHER DATA AND TOOLS – KOOTENAY & BOUNDARY
security within the province, noting that values of crops grown in various regions needs to be
considered. A series of maps were produced that represent the areas with and without coverage.

Existing Networks
In BC, weather data is generally shared amongst the various network operators. This has many
advantages for individual organizations as they may be able to leverage existing stations for their
purposes instead of having to establish and maintain more stations themselves. If a station already
exists in a key area, and if the data is available and is of suitable standard, then it reduces investment in
a redundant monitoring site.

The sharing of weather data in BC has been facilitated and formalized though the Climate Related
Monitoring Program (CRMP), an agreement between various provincial government agencies, private
organizations, Pacific Climate Impacts Consortium (PCIC), and ECCC. The Program’s objective is to
integrate all federal, provincial, municipal and private weather station networks into a single network
for BC, including a standardized data quality control protocol, a centralized data processing system, and
a data-sharing web portal publicly available. The program has worked to establish guidelines and
operational standards for monitoring and offers a publicly available data-sharing portal that is
maintained and hosted by PCIC.

ECCC has also been working towards a tiered or “network of networks” (NoN) approach, which
acknowledges the valuable contribution of weather stations that are operated by non-ECCC
organizations. This collaborative and multi-participant approach was introduced in 2010 to encourage
participants to share and improve the quality of data. ECCC has recognized that their network cannot
adequately meet all monitoring requirements. They have also recognized that there are other networks
collecting valuable data that can supplement their own by addressing the many coverage gaps. ECCC has
begun to incorporate various networks into their data stream. Many CRMP member stations are also
now accessible through the Meteorological Service of Canada (MSC) public Datamart portal.12

The CRMP plays a critical role in coordinating the various networks throughout BC. The following section
briefly describes the networks that operate within the Kootenay & Boundary region. For the purpose of
this report, only actively operating stations are considered. Historically, there are hundreds of additional
monitoring points that have existed for certain durations. While useful for past studies, these stations
are unusable for any types of in-season applications. Only electronic automated stations that report
more than once per day are being considered. While certain manual stations still exist and are valuable
to the climate record, integrating them into near-real-time tools presents challenges. Likewise, stations
that only report daily are less useful for timely decision support tools. Hourly reporting is considered
necessary.

Environment and Climate Change Canada
ECCC stations are well equipped with the highest quality instruments, maintaining a rigorous standard
set by the World Meteorological Organization (WMO). Most of these sites measure temperature,
relative humidity, barometric pressure, wind speed, wind direction, rainfall, and often snowfall by
means of a weighing gauge and snow depth using an ultrasonic snow depth sensor. Weather parameters
are transmitted and made available on an hourly basis, shortly after the top of each hour.

The current automated ECCC network provides the most general overview of climatic conditions across
the region, focusing on the larger population centres (Figure 4). Despite having only six locations, most

5|P a g e                                      WEATHER DATA AND TOOLS – KOOTENAY & BOUNDARY
of these sites are relatively close to a great deal of agricultural land. Nearly 10,000 ha of farmland is
within 5 km of an ECCC station. As these stations are generally sited in reasonably representative areas
such as airports (Cranbrook, Nakusp, Nelson) or other well-exposed areas, they often provide a superb
regional representation so long as regional conditions are not extremely spatially variable. The ECCC
station at Sparwood (Figure 5) is a good example of a well-sited regional monitoring station.

The climate of the Creston Valley is exceptionally spatially variable, with several distinct growing areas.
The existing ECCC station is located within one of these distinct microclimates in south Creston on a
southwest-facing slope (Figure 6). This provides excellent data for that specific location but is of limited
value at any distance beyond the site itself - even orchards less than one kilometre away would have
very different microclimates. Given the sensitivity of certain pests and diseases to differences in
temperature and moisture, this station fails to provide acceptable regional representation.

Figure 4: Environment and Climate Change Canada stations

6|P a g e                                          WEATHER DATA AND TOOLS – KOOTENAY & BOUNDARY
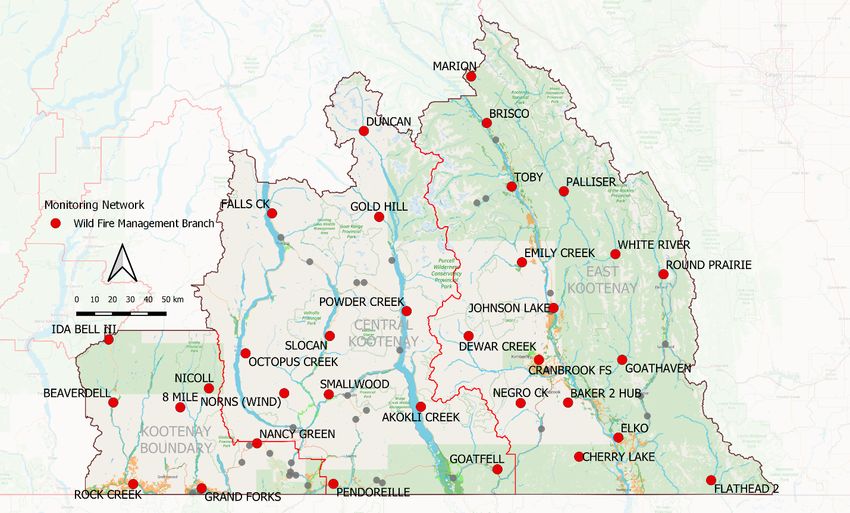
Figure 5: Sparwood ECCC weather station. An example of a well sited weather station

Figure 6: Creston ECCC station looking west. Notice the cloud/fog cover in the Kootenay River valley in the background.

BC Wildfire Service Station Network
The BC Wildfire Service (BCWS) operates the largest monitoring network in the province with
approximately 260 automated weather stations (Figure 7) that record temperature, relative humidity,

7|P a g e                                              WEATHER DATA AND TOOLS – KOOTENAY & BOUNDARY
wind speed, wind direction, and rainfall. Select stations also measure snowfall. The primary purpose of
these stations is to support fire weather forecasting, including input for the Canadian Forest Fire Danger
Rating System (CFFDRS), a federally based decision support tool that assesses the potential for fire
ignition, spread, and burning intensity.

Within the Kootenay & Boundary region, there are 34 actively reporting BCWS stations, providing a
uniform coverage across the entire region, including several areas adjacent to farmland. BCWS stations
with the highest concentration of nearby agricultural lands include Rock Creek, Grand Forks, Cranbrook
FS, Johnson Lake, and Elko. These stations are of value for agricultural applications. Alternatively, some
BCWS stations are located very far from agricultural lands and at higher elevations (Palliser, White River,
Dewar Creek, Octopus Creek). Certain of these stations have little to no applicability to agriculture.

Figure 7: Wildfire Service stations

Transportation and Infrastructure
The BC Ministry of Transportation and Infrastructure (MTI) operates a network of stations to monitor
avalanche risk and highway conditions. These stations are primarily intended for winter monitoring,
collecting air temperature, relative humidity, precipitation, and wind speed/direction. There are 18 MTI
stations in the Kootenay & Boundary region (Figure 8), most located far from agricultural land, often
located on mountain passes and areas prone to avalanches (Figure 9). Certain exceptions that have
pockets of nearby farmland include Morrissey, Moyie, Vermillion Pit, and Lardeau.

8|P a g e                                     WEATHER DATA AND TOOLS – KOOTENAY & BOUNDARY
Figure 8: Transportation and Infrastructure (Road Weather) Stations
Figure 9: Transportation and Infrastructure weather station
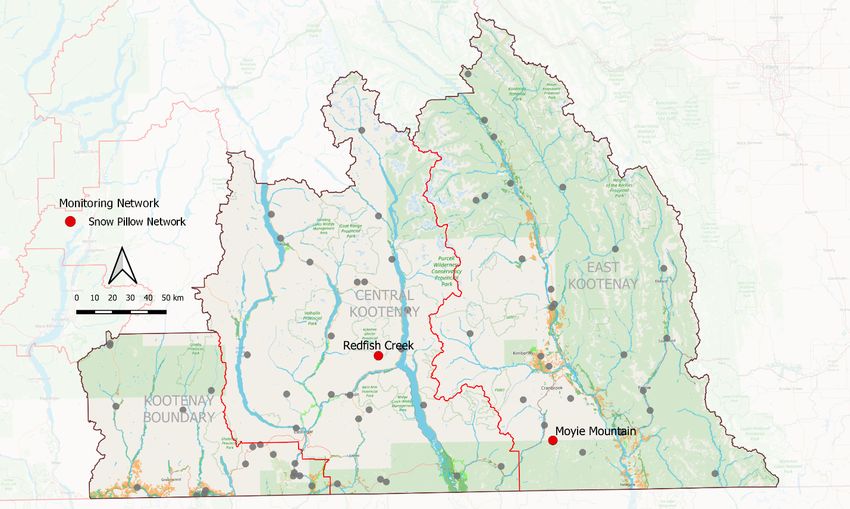
9|P a g e WEATHER DATA AND TOOLS – KOOTENAY & BOUNDARYAir Quality Network The BC Air Quality Network (AQN) stations are mainly operated by the Ministry of Environment and Climate Change Strategy and are used to measure the presence of certain air contaminants for emissions inventories and used to calculate the Air Quality Health Index13. There are approximately 100 real-time, automated continuous air quality monitoring stations throughout BC, including several reporting in the Kootenay & Boundary region. Figure 10 shows the AQN station inventory as acquired from the provincial weather data portal. The Ministry’s website shows some additional stations that were not included in the portal. This is attributed to certain datasets that do not get sent to the portal in near real-time. In addition to air quality parameters, stations also collect meteorological readings, including air temperature, relative humidity, and wind speed/direction. Precipitation is only collected at some sites as many of these air quality stations are co-located with regular meteorological stations. Within the Kootenay & Boundary region, the station located at Grand Forks Airport has an all-weather precipitation gauge. Figure 10: Air Quality Network Stations Automated Snow Weather Station Network The automated snow weather stations (ASWS) are deployed at subalpine to treeline elevations to capture parameters such as snow water equivalent, snow depth, cumulative precipitation, and air temperature. The main applications for this data are river and flood forecasting, forecasting hydroelectric power generation, dam and dike management, and determining avalanche risk. 10 | P a g e WEATHER DATA AND TOOLS – KOOTENAY & BOUNDARY
There are only two ASWS’s within the Kootenay & Boundary region - one at Moyie Mountain and one at
Redfish Creek (Figure 11). Both stations are far from any substantial amount of agricultural land and are
at much higher elevations. Moyie Mountain is at 1930 MASL while the nearest parcels of agriculture are
between 927 and 1041 MASL. Redfish Creek is at 2104 MASL while the nearest agricultural land is
between 530 and 677 MASL. At elevation differences from 889 m to as much as 1574 m, the
representativeness of these weather stations for agricultural purposes is minimal.

Figure 11: Automated Snow Pillow Network Stations

BC Hydro
BC Hydro's regional monitoring networks collect near real-time hydrometeorological data at various
automated data collection stations in or near reservoir systems to support reservoir operations. Most
stations collect precipitation, air temperature, lake levels, stream levels/flows and snow water
equivalents. Wind, solar radiation and barometric pressure are also measured at a few locations. Within
the Kootenay & Boundary region, there is only one BC Hydro station that reports hourly, located at
Fernie (Figure 12). This station records temperature and precipitation.

11 | P a g e                                        WEATHER DATA AND TOOLS – KOOTENAY & BOUNDARY
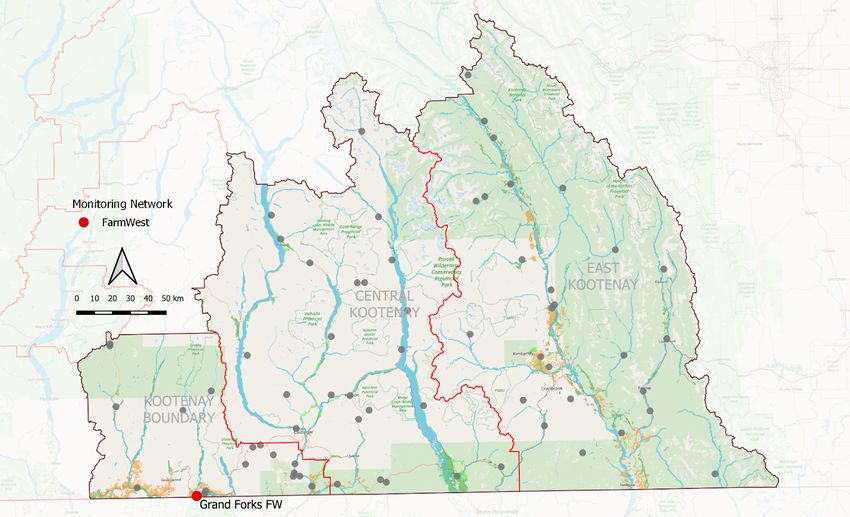
Figure 12: BC Hydro Weather Station

Farmwest
Farmwest is BC’s only province-wide agriculture-specific weather program that provides weather-
related information to BC farmers. Farmwest was launched in 2001, originally established for
agricultural water management. The program is administered by the Pacific Field Corn Association
(PFCA) with most of the operational support coming from the BC Ministry of Agriculture.

The Farmwest monitoring network includes approximately 22 stations across BC, including one in the
RDKB - the recently installed station at Grand Forks (Figure 13). Farmwest mainly relies on weather data
from existing networks operated by the various organizations, including ECCC, but is gradually expanding
to fill agricultural monitoring gaps.

The Farmwest weather stations are the Davis Instruments VantagePro2 supplied and retrofitted with
telemetry by ROM Communications (Figure 15). ROM Communications also provides data transfer and
station installation and upkeep. Currently, these stations transmit once per day, which is adequate for
the daily models that are provided through the website, but not ideal for most operational decision
support tools. Transmitting more frequently would increase costs.

The entire program operates on a very modest budget annual of roughly $50,000. This funding is not
permanent and currently extends to February 2023. This amount covers station maintenance and
upkeep, data transmission costs, website operation, and data analysis. Any remaining funds are
allocated to network expansion, which normally involves one or two new stations per year. Personnel
time is generally supplied in-kind, which can limit the amount of attention devoted to the program.

12 | P a g e                                 WEATHER DATA AND TOOLS – KOOTENAY & BOUNDARY
Figure 13: Farmwest Weather Station

                               Figure 14: Farmwest weather station located at Grand Forks

13 | P a g e                                       WEATHER DATA AND TOOLS – KOOTENAY & BOUNDARY
Private Weather Stations In addition to the established monitoring networks described above, there are other weather stations in the region. These stations belong to farmers, businesses, hobbyists, and various resource-related organizations. Most have been established based on a specific local need or interest. In some cases, these stations feed their data into a larger network. For example, Weather Underground14 began in 1993 as a network of personal weather stations (PWS) scattered across the United States. Station owners can opt to share their station data with Weather Underground, allowing them to benefit from the platform through data visualization, local forecasts, and ability to access historical data. Today, Weather Underground is owned by IBM and consists of over 250,000 PWS’s, including many in Canada and some within the Kootenay & Boundary region. While Weather Underground provides some equipment recommendations and installation guidelines, there is little control or oversight into whether the contributed data is of acceptable quality. For example, these weather stations can be installed in unsuitable locations, such as rooftops or in sheltered yards and the extent of maintenance is unknown. Consumers of this data are generally not aware of these data quality issues. Figure 15: Weather Underground Personal Weather Stations Outside of Weather Underground, there are other private monitoring stations. For example, Bayer Canada requires detailed weather data for their seed production facilities throughout the RDEK. They have taken it upon themselves to install and operate 20-25 monitoring sites (Figure 16Figure 16: Select Bayer Canada weather stations in East Kootenay). These stations are not tied into a larger network, but if a suitable data platform were to exist, this could provide incentive to such organizations share their weather data. Bayer has expressed willingness to participate. Such arrangements could be key to 14 | P a g e WEATHER DATA AND TOOLS – KOOTENAY & BOUNDARY
growing a network throughout the region. This strategy may also tie into provincial and federal
initiatives.

Figure 16: Select Bayer Canada weather stations in East Kootenay

Gap Analysis
When identifying gaps in coverage, we first define areas that are not gaps – locations that are
adequately covered by one or more of the existing monitoring stations. When it comes to adequacy of
coverage, there are no rigid pass/fail specifications; rather it depends on many factors like spatial
variability of each measured parameter across the specific landscape, the accuracy requirements of the
intended purpose, and the needs of each user. As an example, a parameter like temperature across a
large, flat, uniform terrain will have much less spatial variability than it would across a topographically
undulating terrain with prominent features that affect local conditions – terrain much like what occurs
throughout much of the Kootenay & Boundary region.

Within the region, various users will have different accuracy requirements. A rancher near Cranbrook
may be adequately served by a regional station that provides a reasonable approximation of average
temperature and seasonal rainfall to help estimate carrying capacity of a certain pasture. A regional
district may be able to assess regional drought severity based on just a few weather stations.
Alternatively, a cherry grower who is concerned about pest risk or frost damage would be ill-advised to
rely solely on a regional weather station that is several kilometers away and at a different elevation. A
gap analysis considers the density and distribution of weather stations as they relate to agricultural land
as well as the representativeness of each station.

15 | P a g e                                         WEATHER DATA AND TOOLS – KOOTENAY & BOUNDARY
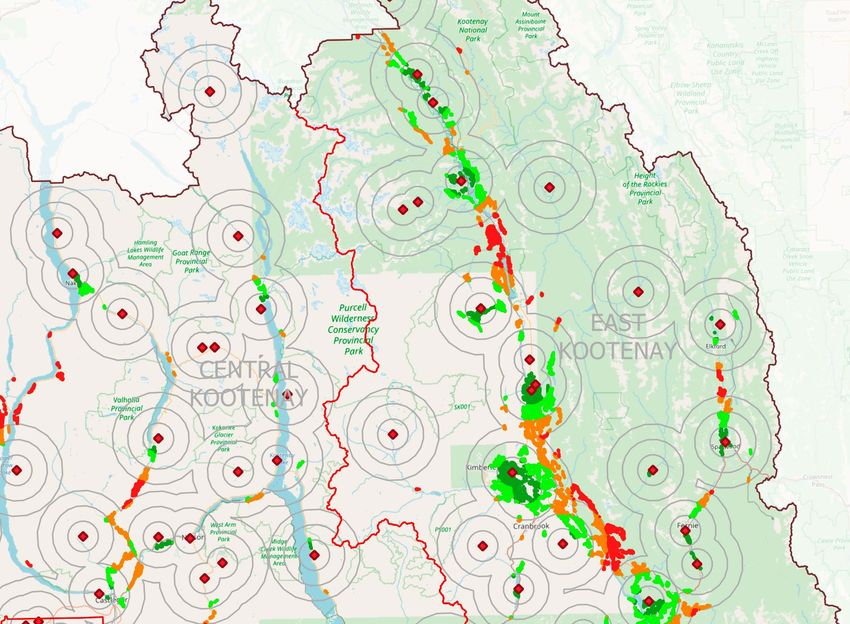
The World Meteorological Organization (WMO), the global authority on meteorological monitoring,
publishes guidelines on recommended station densities.15 For precipitation, the minimum network
density is a station per 100 to 250 km2. From a coverage standpoint, this equates to a weather station
representing a surrounding distance of roughly 5.5 to 9 km. Whereas for snow monitoring, the
recommended minimum density drops to 2,000 to 3,000 km2, representing roughly 25 to 30 km.

Another WMO initiative that defines monitoring requirements, the Observing Systems Capability
Analysis Review (OSCAR), recommends a horizontal resolution of 0.25 to 50 km for accumulated daily
precipitation as it applies to agricultural meteorology. 16 Precipitation intensity (amount of rain over
time) is reduced to a resolution of a maximum of 10 km.

To represent the conditions across a large area with extremely varied terrain, more monitoring points
will provide a clearer picture of the variability that exists. In contrast, a limited number of
measurements leaves a high degree of uncertainty, particularly further away from stations. Obviously,
more weather stations are better, but stakeholders must look at what is realistic from a budget and
resource perspective. Growing the network to a density of a weather station every 10 km would provide
excellent coverage, but the cost would outweigh the benefits. However, incrementally adding stations
based on an established priority will provide a great deal of value, particularly the first few stations that
will address some major gaps. At a certain point, the incremental benefits level off and additional
stations will only provide a modest increase in coverage.

This analysis presents a priority ranking system based on the relative increase in agricultural land
coverage achieved by each new station. This method helps to address expected resource challenges in
that so far, there is no actual budget secured to establish a network. Therefore, as any amount of
funding gets allocated to weather stations, there will be a clear priority as to which areas will receive the
most immediate benefit.

The first pass considers all agriculture land equally, without applying higher weighting to certain crop
types, despite distinct differences in productivity and crop values. The rationale is that although certain
production areas may be considered marginal today, perhaps incapable of producing higher-valued
commodities, this may not always be the case. A changing climate is likely to enable shifts in cropping
types and areas. Without a minimum level of weather monitoring in these locations, there will be no
quantitative evidence to support such opportunities. Furthermore, this analysis focuses on regional
coverage, meant to benefit all farming areas.

The investigation focuses on identifying and incrementally adding monitoring locations that would
minimize the agricultural land without coverage and provide the maximum increase in represented
farmland. Agricultural land was classified into various distances from the nearest monitoring station. The
agricultural land characterization is based on the National Annual Crop Inventory as well as AGRI’s
Agricultural Land Use Inventory (ALUI). Presently, 66,200 ha or roughly 50% of total farmland is further
than 10km for a weather station. Of that, 33,400 ha or 26% of farmland is further than 15 km from the
nearest weather station (Figure 17).

The analysis revealed that 99% of the farmland in the entire region could be adequately covered with 13
new weather stations. All farmland could be completely covered with 29 new stations. However,
recognizing that 16 of those stations (stations 14 through 29) would provide a combined additional
coverage of one percent of the farmland provides a much-diminished return, making such a large
network not worthwhile.

16 | P a g e                                   WEATHER DATA AND TOOLS – KOOTENAY & BOUNDARY
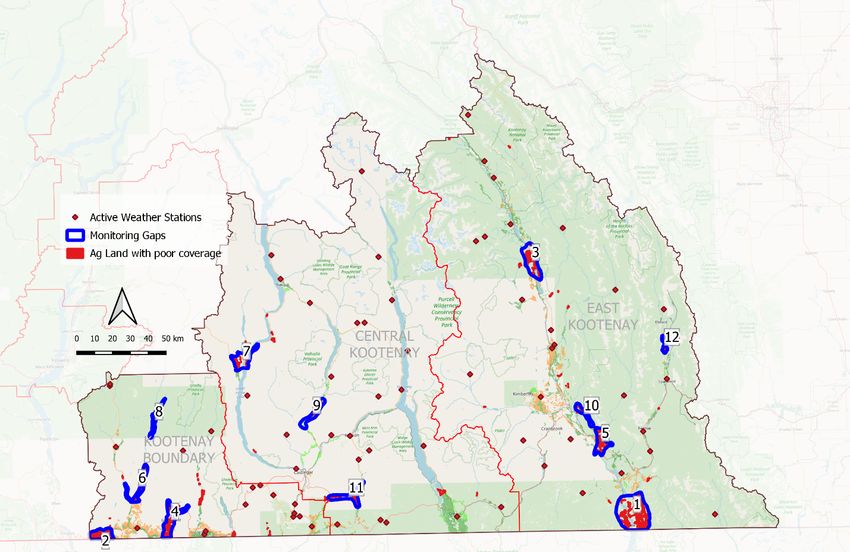
The following is a list of the top 12 locations (13 stations) that rank from highest to lowest priority based
on the increased coverage of farmland per station. These locations are shown in Figure 18: Proposed
locations for additional weather stations ranked from 1 though 12. Table 1 shows the additional
agricultural land that would be represented by each additional station.

Figure 17: Agricultural land shown within 5km, 10km, 15km, and more than 15km from active weather stations

    1. Lake Koocanusa: The most striking gap in coverage is in RDEK surrounding Lake Kookanusa from
       Kragmont, extending south to the Canada-US Border. This area is comprised of approximately
       7,700 ha of rangeland that is further than 15 km from any weather station. The southernmost
       portions of this area are as much as 35 km from the nearest weather station, the BC Wildfire
       station at Elko. Given its size, this area would benefit from two stations, one near Newgate and
       one to the north, south of Elk River.
    2. Sidley Mountain Road: West of Bridesville, extending west to the southwest corner of RDKB.
       Includes approximately 4,660 ha of general agriculture and range lands that are far from any
       weather station.
    3. Fairmont: 3,250 ha of mainly rangeland with some smaller pockets of general agriculture. A new
       weather station should be installed near the airport or along Westside Road, northwest of
       Fairmont Hot Springs.
    4. Greenwood: A mix of rangeland and general agriculture extending from the northern Boundary
       Creek Valley through to the Canada-US Border. The farmland far from any weather station is
       approximately 2,950 ha. A new station should be situated near Greenwood or Anaconda.

17 | P a g e                                        WEATHER DATA AND TOOLS – KOOTENAY & BOUNDARY
5. Wardner: This area of RDEK includes Wardner but extends mainly to the east from rangeland
north of Tie Lake to general agriculture and rangeland north of the Bull River. Within this area,
there is about 2,850 ha of farmland that lacks adequate coverage.
6. South and West Kettle River: This area extends north from the junction of the Kettle River and
the West Kettle River, mainly along south Christian Valley Road, but also along Highway 33
towards Beaverdell. This area is comprised of approximately 2,000 ha of unrepresented
agricultural land.
7. Fauquier: To the west of Upper Arrow Lake along Inonoaklin Valley (Edgewood) Road, south of
Highway 6. There is also some farmland to the east of Upper Arrow Lake. This region includes
1,800 ha of unrepresented agricultural and mixed agricultural land.
8. North Christian Valley along the Kettle River: A large strip of approximately 1,400 ha of
agriculture and rangelands.
9. Winlaw: The area around Winlaw contains a mix of agriculture. Adding a station to this area
would provide good coverage to approximately 1,400 ha.
10. Horseshoe Lake: There is a large, tract of unrepresented agricultural land, roughly 900 ha,
extending from Norbury Lakes Provincial Park to Fort Steele. This area is inadequately covered
by the existing weather stations at Baker 2 Hub (BCWS) and Cranbrook Airport (ECCC).
11. Salmo: The area surrounding Salmo, including some agricultural land to the west along Highway
3. The region includes approximately 900 ha of agricultural land that is quite far and
inadequately represented by the closest weather stations at Pendoreille (BCWS), Stagleap (MTI),
or Hall Creek (MTI).
12. Elk Valley Highway: The area between Sparwood and Elkford along Highway 43 and Elk River
consists of about 900 ha of agriculture and rangeland that is under-represented.
18 | P a g e WEATHER DATA AND TOOLS – KOOTENAY & BOUNDARYFigure 18: Proposed locations for additional weather stations ranked from 1 though 12. Table 1: List of proposed locations for additional weather stations with additional agricultural land that would be covered # LOCATION APPROX. COVERAGE OF AGRICULTURAL LAND (HA) 1 Lake Koocanusa* 7699 2 West of Bridesville 4663 3 Fairmont 3262 4 Greenwood 2961 5 Wardner 2851 6 South and West Kettle River 2036 7 Fauquier 1830 8 North Kettle River 1394 9 Winlaw 1388 10 Horseshoe Lake 895 11 Salmo 895 12 Elk Valley Highway 893 *Two stations recommended for this area 19 | P a g e WEATHER DATA AND TOOLS – KOOTENAY & BOUNDARY
Tiered Approach
Where and how a station is placed has a tremendous influence on the degree to which it represents its
surrounding area. The goal to establishing a regional monitoring network is to situate weather stations
so that they represent as large an area as possible by maximizing exposure of individual sensors relative
to surrounding obstructions. Sensors that are very well exposed, with no nearby obstructions, are
considered to be representative of the larger area. For any sort of regional climate monitoring, a station
needs to be representative. However, if the station is poorly sited, say on a hill, in a depression, or near
a large physical feature or water body that may create a unique microclimate, regional relevance will be
limited. This is particularly important in data-sparse regions where a single station is expected to
represent a large area. In a denser network, this is less of an issue as more stations will better represent
the true variability across the landscape.

Washington State University’s AgWeatherNet (AWN) operates a high-quality automated weather
network that is distributed across the state. Recently, AWN adopted a tiered system of weather
monitoring. A tier 1 station is an AWN-managed professional weather station with a high-end data
logger and a complement of professional grade sensors. These would be somewhat analogous to an
ECCC station that is sited to a rigid standard, having minimal influences from local obstructions. A Tier 2
station consists of a more economical all-in-one weather sensor suite with similar siting to the Tier 1.
Both Tier 1 and Tier 2 stations are meant to represent regional conditions. A Tier 3 is an all-in-one
station that is owned, installed, and maintained by a third-party. These stations may not necessarily be
sited according to the same standards as Tier 1 and 2 sites and may not necessarily reflect the
surrounding region. For example, a Tier 3 station may be located within a field or orchard or in a
sheltered yard site, potentially influenced by local factors or exposed to irrigation. Depending on the
intended application, a user may decide to use only Tier 1 and Tier 2 stations or perhaps all three Tiers.

Information from Tier 3 stations is still valuable but must be used with caution. A weather station that is
intended to monitor the conditions that are occurring within an orchard will likely and appropriately be
located within the orchard itself to best represent the temperature and moisture characteristics that will
influence the various biotic processes. Measurements will be affected by canopy height, structure, and
health as well as factors like irrigation, ground cover, and nearby features. In such a case, even a
neighboring field may experience conditions that are different than those of the nearby station.

The Creston Valley is a unique production area within the Kootenay & Boundary region. The area has a
high concentration of fruit orchards that are highly productive, and which contribute significantly to the
region’s economy. In terms of weather monitoring, Creston has an ECCC station, thus technically
providing adequate regional coverage. Based on the criteria of this gap analysis, this area is excluded
from being designated as a gap. However, given the value of production and the potential benefits to
the area’s producers, there would be a great deal of advantage to additional monitoring in the Creston
Valley. This area should be considered a priority for enhanced local monitoring. Based on local expertise
and input, the three locations – Wynndel, Erickson, and Canyon have unique microclimates that need to
be addressed (Figure 19).

20 | P a g e                                  WEATHER DATA AND TOOLS – KOOTENAY & BOUNDARY
You can also read