Oregon Global Warming Commission - DRAFT 2018 Biennial Report to the Legislature For the 2019 Legislative Session - Squarespace
←
→
Page content transcription
If your browser does not render page correctly, please read the page content below
Draft Version October 12, 2018 for Commission Review – Not Final Until Commission Adopts

Oregon Global
Warming
Commission
[DRAFT] 2018
Biennial Report to
the Legislature
For the 2019
Legislative Session
Draft Version October 12, 2018 for Commission Review – Not Final Until Commission Adopts

Cover Photo Credit: Angus Duncan
Mt. Washington from Black Butte Ranch
near Sisters, Oregon
September 1, 2017

                                              [Front Matter Pages Will Be Inserted]

Table of Contents
Executive Summary....................................................................................................................................... 3
2018 Letter from the Chair ........................................................................................................................... 4
Section 1: Climate Change Comes to Oregon 2018 ...................................................................................... 9
Section 2: Update on Oregon’s Greenhouse Gas Emissions Inventories.................................................... 26
   Sector-Based Inventory........................................................................................................................... 26
   Consumption-Based Inventory ............................................................................................................... 30
Section 3: A Closer Look at Oregon Utility Emissions ................................................................................. 35
Section 4: Projected GHG Emissions from the Transportation Sector ....................................................... 48
   Is the Current State Framework for Reducing Transportation GHG Emissions Enough? ....................... 50
   How Important are Federal Deregulation Trends for Meeting Oregon’s Transportation Emissions
   Goals?...................................................................................................................................................... 55
Appendix A. Detailed Breakdown of Oregon Sector-Based Greenhouse Gas Emissions .......................... 58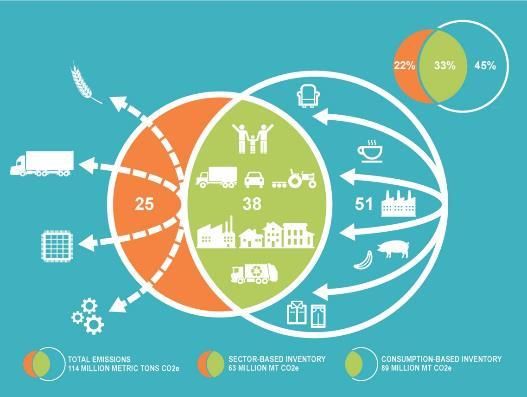
Draft Version October 12, 2018 for Commission Review – Not Final Until Commission Adopts

Executive Summary
[Under development]
Draft Version October 12, 2018 for Commission Review – Not Final Until Commission Adopts

2018 Letter from the Chair

        “Owing to past neglect, in the face of the plainest warnings, we have
        now entered upon a period of danger…The era of procrastination, of
        half-measures, of soothing and baffling expedients, of delays, is coming
        to its close. In its place we are entering a period of consequences…We
        cannot avoid this period; we are in it now.”

        Winston Churchill, in the House of Commons, November 1936

Government and leadership have come a long way from Churchillian rhetoric in those
dark days leading into World War II, and not in any direction that should give us
comfort. As grim as the world’s prospects were in the 1930’s, at least there were
Churchills and Roosevelts summoning us to the great tasks of those times.

We’ve looked for that kind of leadership over the 30 years or so that climate change has
loomed as an existential threat to our society and our children’s future. Rarely have we
found it. Identifying a climate threat so profound has been difficult in the absence of
immediate physical evidence that the climate was changing, but not more so than
inferring a threat from a rearming Nazi Germany. Most of the world, and most of the
United States, then and now, chose to look elsewhere, to more immediate opportunities,
smaller tasks and narrower challenges. Climate science, after all, spoke in data sets
and modeled probabilities. Outcomes remained fuzzy around the edges. Our leaders
would have to ask us to make often uncomfortable changes in budgets, policies and
livelihoods, to forestall . . . probabilities.

The time of probabilities is now past. The first tangible effects of climate change are
upon us. We see it in stronger hurricanes inundating coastal communities around the
world. We see it in the smoke blanketing our state and region from forest fires that start
earlier, persist longer and burn more extensively; smoke that is attacking the lungs of
our children, of the elderly and the asthmatic. We see it in half-full reservoirs and
mountaintops devoid of midwinter snow. (See Section 1 of this Report for links between
earlier projections of climate effects and the realized ones of today.)

Progress and Slippage
In this Report the Global Warming Commission reviews Oregon’s successes and
remaining challenges in meeting its greenhouse gas emissions goals. This Letter reflects
my profound concern, after ten years as Commission Chair, with whether we are rising
to the challenges in meaningful and sufficient ways.

I wrote the first of these Report Letters as a forward to our 2009 Report to the
Legislature. In that letter I described as “unvarnished good news” the wind projects and
solar cell manufacturing, the “green buildings” and energy efficient land use choices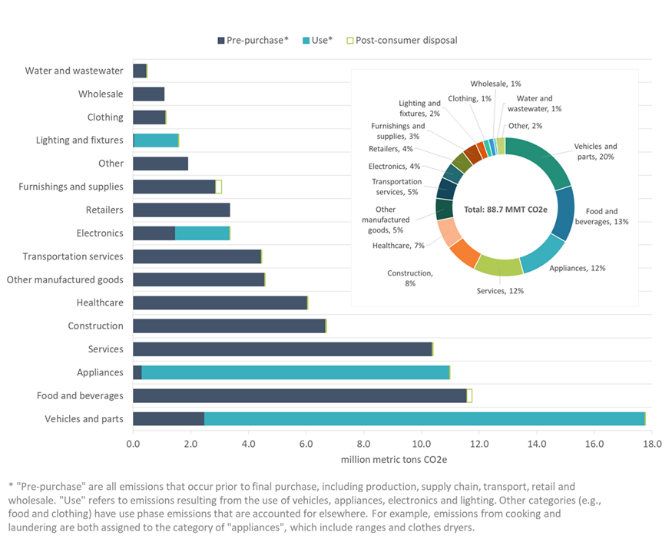
Draft Version October 12, 2018 for Commission Review – Not Final Until Commission Adopts
that we thought would make Oregon a leader for dark but not hopeless times. The
country had just elected a President committed to addressing climate issues. The
Congress was debating national carbon cap legislation. Countries around the world
were telegraphing their parallel commitments to a global climate strategy.
Indeed, much has been accomplished in the ten years since, especially in the realm of
energy technologies that are replacing the nation’s fleet of superannuated coal plants
with cleaner (but, let us be clear, still not clean) gas supplies, and with wind and solar
plants that are offering ever lower costs and higher efficiencies. This cleaner, carbon
free electricity, we speculated then, could power an emerging fleet of electric cars,
trucks, buses, possibly even aircraft.
Momentum is still evident globally. In 2018 two of the last three holdouts from the Paris
Climate Accord, Nicaragua and Syria, signed on. Only the United States of America,
once a global leader for responsible climate action, now remains outside the global
accord, its politics dominated by feckless policies that are indifferent or outright hostile
to the tested, peer-reviewed findings of science. This is leadership of a sort, but of a sort
that will lead the country over the climate cliff.
So it falls to us as Oregonians and Washingtonians and Californians, as citizens of San
Francisco and Portland and Chicago and New York, to demonstrate what real leadership
is in coping with the slow-motion but inexorable emergency we face. It falls to us to
rescue the country from itself, to bear our share of the burden and realize our share of
the promise to the rest of the world.
Oregon’s Emissions Inventories
The Inventory section of this 2018 Report carries both encouraging and challenging
news. We can be legitimately encouraged by accomplishments and opportunities in the
electric utility sector. The ten years past have seen:
PGE’s decision to end coal burning at Oregon’s only in-state coal plant at
Boardman;
a negotiated agreement between environmental groups and our two large electric
utilities, validated by the 2016 Legislature, to terminate coal-generated electricity
imports by 2030, and sharply increase renewables in the mix; and
PGE’s corporate commitment to “deep decarbonization, and the determination of
Northwest Gas to seriously exploring the potential of renewable gas and
hydrogen.
The combined effects of these commitments, fully realized, should drive utility emissions
to, and below, a proportional share of Oregon’s greenhouse gas goals (see the section in
the Inventory section of this Report on utility emissions).
The mounting challenge we face is with transportation emissions, which have been
rising since 2013 after several years of flat-lining or incrementally dropping. Other
states are showing the same backsliding effects as the effects of the 2008 Great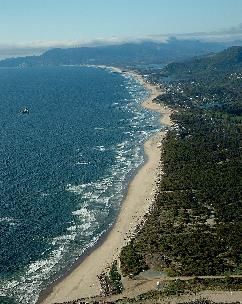
Draft Version October 12, 2018 for Commission Review – Not Final Until Commission Adopts

Recession retreat. More miles1 are being driven in larger and less fuel-efficient cars,
while the Trump Administration undermines the effectiveness of national vehicle fuel
economy standards.

And the strategy of negotiated change that has been successful with two electric utilities
is harder to succeed at with Oregon’s three million vehicle owners/drivers. Alternative
vehicles are slowly entering the market, notwithstanding that electric vehicle purchase
costs are coming down, their operating costs are far lower than for gasoline and diesel
vehicles, and their range between charging sessions is dramatically up2.

To lock in real emissions reductions and shore up slippage, leadership from the Oregon
Legislature and Governor on climate issues is crucial in 2019. A carbon cap will inform
Oregon drivers of both the costs of failure and the rewards of success, while encouraging
movement to more cost- and carbon-efficient travel. The cap is the largest missing
building block (first called for in Governor Kulongoski’s Advisory Group Report in 2003)
in Oregon’s carbon strategy. The Joint Committee On Carbon Reduction chaired by
President of the Senate Courtney and Speaker of the House Kotek, and with an
admirable membership from both legislative chambers, assures that this issue is getting
serious legislative treatment at long last.

Consumption-Based Emissions
Oregon’s consumption-based inventory tracks our state’s greenhouse gas footprint as
measured by the emissions we create with our consumption choices. Through it we can
calculate – and choose to take responsibility for – the emissions associated with the
overseas fabrication of a product, its transport to Oregon, its use and disposal here,
even if some of the emissions may originate in Europe or Asia. These emissions
numbers are rising also. This outcome is a function of increased consumption by
Oregon households and businesses and is consistent with post-recession economic
growth. As Oregon consumers purchase more goods and services, a share of these are
imported from producers in other countries, often where carbon efficiencies are poorer
than here. Increased consumption of imported goods means increased total and per
capita consumption-based emissions.
In the near future Oregon will need to heed these findings by considering consumption-
based emissions reduction goals and tools, since wherever those emissions occur, they
are an outcome of our choices and will result in global climate change that affects
Oregonians.

Oregon Forest Carbon Accounting
Oregon’s forests are world-class at capturing and holding atmospheric carbon in their
trunks, roots, and soils, on par with equally-dense tropical and Alaskan rain forests.
The OGWC’s Forest Carbon Accounting Project worked with the US Forest Service and

1
  . . . a 14% increase since 2012, or up more than 4.5 billion more vehicle miles traveled in Oregon in 2016 (37.5
billion) compared to 2012 (33.0 billion) (per USFHWA, ODOT, Oregon Office of Economic Analysis –
[oregoneconomicanalysis.com]).
2
  >300 miles for the latest Kia e-Niro
Draft Version October 12, 2018 for Commission Review – Not Final Until Commission Adopts

Oregon State University scientists to reveal some striking findings: that some 11 billion
tons of CO2e3 are packed into Oregon forests today; and that we appear to be increasing
that store at somewhere between 15 million tons and 60 million tons (CO2e) annually.4
We were further advised that the opportunity exists to substantially increase this uptake
and storage through modest changes in forest management and harvest practices.
Reducing our (mostly) energy-related emissions plus increasing forest carbon capture
and sequestration could move Oregon toward overall carbon neutrality by the 2030’s,
and to negative carbon thereafter; that is, go from being part of the problem to being a
notable part of the global solution. In the process we could pioneer forest carbon
measures for other forested jurisdictions. The 2019 Legislature can take a significant
step in this direction by packaging forest carbon incentives into its carbon cap
legislation.

Extreme Climate Events
Section 1 of this Report outlines in sometimes painful detail the climate change effects
Oregon, and the wider world, have already begun to suffer. The Fourth National Climate
Assessment (2017)5 allocates a chapter to “Potential Surprises: Compound Extremes
and Tipping Elements.” Chapter 15 of the Assessment notes the significant ways in
which “average” projections could be decidedly worse. It observes that “climate models
are more likely to underestimate than to overestimate the amount of long-term future
change.” It notes that “compound extreme events (such as simultaneous heat and
drought, wildfires associated with hot and dry conditions, or flooding associated with
high precipitation on top of snow or waterlogged ground) can be greater than the sum
of the parts.” “Tipping points” are generally stable conditions that can be “tipped” into
highly unstable ones by a small increment of climate change – a needle that breaks the
camel’s back – such as a small degree of Antarctic warming that could release a rapid
disintegration and melting of glacial ice, raising sea levels more rapidly than humans
are prepared to adapt to them. It warns us that as devastating as linear effects of climate
change will be, the non-linear effects may be far more so because we are unprepared to
cope with them.

In Oregon those effects might include a dramatic die-off of forests (such as has occurred
already in Canadian and Alaskan boreal forests, and in the Russian taiga forests), or
unlooked for sea level rise that swamps Oregon coastal communities, economies and
highways.

3
  Forest carbon only becomes carbon dioxide when the fiber burns (oxidizes). We can restate quantities of forest
carbon as a “carbon dioxide equivalent” to allow one-to-one comparisons of carbon stored in trees with carbon
dioxide emissions released when fossil fuels are burned using standard conversion factors.
4
  For reference, note that Oregon’s total annual Sector Inventory emissions are about 60 million metric tonnes
CO2e. A metric tonne is equal to 2200 pounds, or 1.1 short tons.
5
  US Global Change Research Program, Volume 1, Chapter 15. 2017
Draft Version October 12, 2018 for Commission Review – Not Final Until Commission Adopts

Oil Companies: A Final Note
We applaud the real progress Oregon has made in resetting our electric utilities toward
a low carbon future, and regret our failure to do the same in transportation. Much of
this slow slog is due to the well-financed6 resistance from oil companies determined to
extract the last dollar of profit out of a product that has no place in a decarbonized
world. Upton Sinclair, quotable muckraker from this country’s first Gilded Age, said it
best:

          It is difficult to get a man to understand something when his salary
          depends upon his not understanding it.

But even Upton Sinclair could not have imagined the irony of this same oil industry,
while pumping more US oil than ever before and laboring to protect its markets, at the
same time asking for oceanfront “protection” from rising sea levels along the Texas Gulf
coast. The State of Texas is seeking $12 Billion in federal funding to build “a 60-mile
spine of concrete seawalls, earthern barriers, floating gates and steel levees” to protect
one of the world’s largest concentrations of petrochemical facilities, including most of
Texas’ 30 refineries, which represent 30% of the nation’s refining capacity.” The spine
would reach from Louisiana to south of Houston.

“Our overall economy . . . is so much at risk from a high storm surge,” said Republican
Bazoria County judge Matt Sebesta. Republican Senators John Cornyn and Ted Cruz
both support this use of taxpayer funds to protect the oil industry from, in effect, itself.
The first commitment of $3.9 billion was fast-tracked by the Administration after
Hurricane Harvey hit the Texas coast a year ago, knocking out a quarter of the area’s
oil refining capability.7

Not Upton Sinclair, not Doonesbury, not even The Onion, could imagine theater absurd
as this. I leave readers to draw their own conclusions.

Angus Duncan, Chair
Oregon Global Warming Commission
September 24, 2018

6
  Most recent financial filings in Washington’s Measure 1631, on the ballot this fall, which would establish a carbon
fee in that state, showed >75% of the $16 million received by the No on 1631 campaign are from oil companies.
7
  Associated Press report in The Oregonian/OregonLive 26 August, 2018.
Draft Version October 12, 2018 for Commission Review – Not Final Until Commission Adopts
Section 1: Climate Change Comes to Oregon 2018
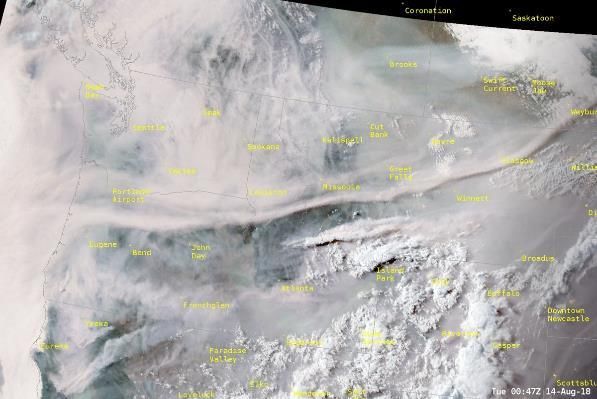
Smoke Across the PNW. National Weather Service Photo 7:28 pm August 13, 2018
The Oregonian for Wednesday, August 15, 2018 led with the story of smoke that “choked” the Portland
airshed from forest fires “filtering into Northeast Oregon from blazes in almost all directions . . .
Washington, British Columbia, Eastern Oregon . . . (and) Northern California.” DEQ issued an air quality
advisory warning people to stay indoors if possible, especially children, seniors, and those with
respiratory conditions.
The Oregon Smoke Blog for August 21 read: “Currently all Oregon counties except Coos and Curry are
under air quality advisories . . . . “8
Less than a year ago Portlanders awoke to a similarly brownish haze obscuring the sky, and the same
public health advisory. DEQ said 2017 was “different” from earlier bad fire years in that “the entire
state is . . . blanketed by smoke” coming from not only the Eagle Creek fire in the Columbia Gorge but a
dozen fires from the Rogue River to Mt. Hood, along with fires in Canada and California. DEQ called the
condition “rare.”
But it’s not, anymore.
8
http://oraqi.deb.state.or.us/home/map
9
Draft Version October 12, 2018 for Commission Review – Not Final Until Commission Adopts

Larger forest and grassland fires are more frequent, a consequence of warmer, drier summers. The fire
season begins earlier and ends later9.
On August 15 of this year the National Interagency Fire Center reported fires burning in all 13 Western
State west of the 100th Meridian; 108 “active large fires”, four of which were contained. On August 22,
the Forest Service reported “23 large fires burning nearly 440,000 acres” in Oregon (@
ForestServiceNW). The 80,000 acre “Substation Fire” near The Dalles, OR, in July burned one to two
million bushels of wheat at a cost of >$5 million. Farmers in the fire’s path “got wiped out, most of their
crop if not all,” said Tara Simpson of the Oregon Wheat Commission.10
At least Oregon communities have been spared the devastation suffered in California: deaths and whole
neighborhoods destroyed in Redding this year, and in Santa Rosa last year. Of California’s 15 largest
fires (by acreage), 12 have occurred since 2000, three of them this year and last11.
Oregon communities have not been spared other impacts, however. Last year’s Eagle Creek fire closed
Interstate 84 for three weeks, disrupting personal and commercial traffic, adding costs and delays to
shipping. The Shakespearean Festival in Ashland had to cancel or relocate 26 performances from its
outdoor theater in 2018, more than in its smoke-plagued 2017 season (each cancellation directly costs
the Festival $50,000 in foregone revenues – an estimated $2 million total loss in 2018 -- and the Ashland
community, thousands more in foregone lodging, food and drink revenues from missing playgoers).12 In
2017 the Central Oregon town of Sisters canceled its September Folk Festival, a signal tourist draw and
community money maker (estimated lost community earnings in excess of $1 million).
Here’s how the Oregon Climate Change Research Institute (OCCRI), in its 2017 Oregon Climate
Assessment, described prevailing conditions:
        “Over the last several decades, warmer and drier conditions during the summer months have
        contributed to an increase in fuel aridity and enabled more frequent large fires, an increase in
        the total area burned, and a longer fire season. . . .13”
And here is OCCRI’s forward look at forest wildfire, from its 2010 Assessment:

        “Wildfire is projected to increase in all Oregon forest types in the coming decades. Warmer
        and drier summers leave forests more vulnerable to the stresses from fire danger west of the
        Cascades. Wildfire in forests east of the Cascades is mainly influenced by vegetation growth in
        the winters that provides fuel for future fires. An in- crease in fire activity is expected for all
        major forest types in the state under climate change. Large fires could become more common in
        western Oregon forests14.

Even earlier, the University of Washington Climate Impacts Group wrote, in 1999:
        “. . . the net direct effect of the climatic changes is not likely to be favorable to the productivity
        and stability of existing forests. Warmer summers, leading to increased evapotranspiration, are
        likely to overwhelm any benefits of increased CO fertilization. Predicted climatic changes are

9
  See OCCRI Third Climate Assessment, Chapter 5 Forest Ecosystems, January 2017
10
   Reported in The Oregonian/Oregon Live July 20
11
   Berke, Business Insider July 31, 2018 (https://www.businessinsider.com/ventura-county-la-fires-california-
worsening-trend-2017-12).
12 “Wildfire smoke costs famed Oregon Shakespeare Festival”Associated Press report 25 September, 2018
13
   FOOTNOTE
14
   FOOTNOTE

                                                                                                                10
Draft Version October 12, 2018 for Commission Review – Not Final Until Commission Adopts
likely to have profound. . . immediate and easily observed impacts . . . most obvious in the case
of fire where increased summer temperatures and moisture deficits will substantially increase
the potential for the occurrence, intensity, and extent of wildfires.15”
Past Reports to the Legislature from the Global Warming Commission (OGWC) and OCCRI have been
heavy on predicting what Oregonians can expect in the future if climate change is not brought under
control. But those climate effects predicted for Oregon in 2010 and earlier have arrived on our doorstep
in 2018: fire, flooding, drought, disease and health impacts, heat, sea level rise, erosion of Oregon’s
coastline, and damage to fragile forest, grassland, aquatic and alpine ecosystems and the plants and
animals they contain.
The personal and economic consequences that once were distant predictions are becoming
accomplished fact.
So this Report will be different. It reports, below, how those earlier predictions are coming true. It
reports not the future but the present.
It’s not a comforting sight.
______________________________________________
Elsewhere in the country in 2018, summer fires raged across California. Yosemite Valley closed for three
weeks due to smoke and fire risk. Residences in large sections of Santa Rosa (2017) and Redding (2018)
burned with loss of life and property. Notwithstanding adequate soil moisture content from winter
precipitation in both 2017 and 2018, California experienced intense fires.
“The factor that clearly made the difference in 2017, and again in 2018, is heat,” said Professor Park
Williams of Columbia University. “Last summer was record-breaking, or near record-breaking, hot across
much of the West, and I believe July 2018 will break records or come close to it again this year. Even if
the deep soils are wet following winter and spring, a hot and dry atmosphere seems to be able to
overwhelm that effect.” In fact July 2018 was the hottest month California has ever recorded16.
And, with reference to increased extent of forest fires: “We estimate that human-caused climate change
contributed to an additional 4.2 million ha of forest fire area during 1984–2015, nearly doubling the
forest fire area expected in its absence.17”
Elsewhere on the planet in 2018, intense and rapidly moving fires in Greece this summer left 97 dead
and communities devastated, with more than 1000 buildings destroyed or damaged18. Europe coped
with its worst heat wave and drought in decades; countries as far north as Sweden were fighting forest
15
Mote, P.W., and 18 co-authors, 1999: Impacts of climate variability and change: Pacific Northwest. Page 67.
Report of the JISAO/SMA Climate Impacts Group.
16
“Why the Wildfires of 2018 Have Been So Ferocious: It’s the heat, not the humidity.” Robinson Meyer,
The Atlantic August 10, 2018
17
Abatzoglou and Williams, “Impact of anthropogenic climate change on wildfire across western US forests,”
Proceedings of the National Academy of Sciences, October 10, 2016
18
Wikipedia article “2018 Attica Wildfires”
11Draft Version October 12, 2018 for Commission Review – Not Final Until Commission Adopts
fires above the Arctic Circle19. Millions of hectares (one hectare = 2.47 acres) of Russian/Siberian taiga
forest appear to have burned in 201820.
Although predictions of these and other climate impacts can be summoned up from three or four
decades back, just reading the OCCRI 2010 and 2017 Assessments side by side should be sobering to
Oregonians and their leaders alike.
A note of qualification for what follows: heat waves, drought, intense storms, forest fires and other
inconveniences and disasters have been suffered throughout human history. Oregon has seen its share
of these events, such as the very large west-side fires during a cyclical dry period21 in the 1930’s. The
difference today is in the amplification of naturally-occurring weather events. The National Academy of
Sciences stated (in 2016) that:
“In many cases, it is now often possible to make and defend quantitative statements about the
extent to which human-induced climate change (or another causal factor, such as a specific
mode of natural variability) has influenced either the magnitude or the probability of occurrence
of specific types of events or event classes.22”
Thus climate change does not start forest fires (either lightning or careless humans do this) but climate
change lengthens the calendar window for weather conducive to such fires and supplies the fire with
more tinder-dry fuel that can contribute to larger and more persistent fires.
A parallel might be a baseball player who might naturally hit 40 home runs a season; playing with
performance-enhancing drugs, he might hit 60 instead. The drugs don’t make him a better hitter but
increase his chances, each time he bats, of sending one into the bleachers.
So what other climate change predictions are coming about, and with what consequences? The
following references should be read as illustrative; for a complete accounting, look to OCCRI’s most
recent (2017) assessment report.23 Note that both data-based and anecdotal evidence of current effects
are 2018 snapshots; these effects will continue to intensify in future years even if emissions growth is
reversed today and systematically reduced over the next two decades or so. The “Then” predictions are
from the OCCRI 2010 Assessment unless noted otherwise.
19
London Express July 25, 2018
20
Reported in the Siberian Times 13 July 2018.
21
The recurring Pacific Decadal Oscillation is a naturally-occurring climate cycle of roughly 30 years duration
alternating between drier and wetter weather periods. Another naturally occurring, shorter-term cycle affecting
the Pacific Northwest is from El Nino (drier; warmer) to La Nina (wetter, cooler). Climate change is superimposed
on these cycles, amplifying warmer effects and, in different geographies, amplifying or diminishing precipitation.
22
National Academies of Sciences, Engineering, and Medicine, 2016: Attribution of Extreme Weather Events in the
Context of Climate Change. Washington, DC: National Academies Press. doi: 10.17226/21852.
23
The Third Oregon Climate Assessment, January 2017, at:
http://www.occri.net/media/1042/ocar3_final_125_web.pdf)
12Draft Version October 12, 2018 for Commission Review – Not Final Until Commission Adopts
Heat
Then . . . the 2010 Assessment predicted Oregon would see average temperature increases of
“0.2-1º ̊F” per decade;
Now . . . Oregon’s average temperature has risen 1ºF in the last 30 years24. By August 22 of this
year, Portland had set a new record for hottest days (30 days above 90ºF)25. Higher maximum
night-time temperatures also were recorded over the last century.
“. . . rising greenhouse gases have added almost 2ºF to the Northwest’s average temperature
over the past 100 years. It follows, then, that when Oregon experienced a year (2015) that was
about 5°F warmer than the 20th century average, greenhouse gases contributed about 2°F of
that.26”
Elsewhere . . . globally, 2018 is on track to be the fourth hottest year on record; with 2018, the
hottest four years have been the last four; and 17 of the 18 warmest years have occurred since
200127. Heat waves and record temperatures have been recorded across the globe, from the
Arctic to the tropics. The World Meteorological Society reports that “. . . heat is drying out
forests and making them more susceptible to burn. A recent study found Earth’s boreal forests
are now burning at a rate unseen in at least 10,000 years28.”
Globally, each of the decades since 1950 has been warmer than any of the decades preceding.
2010-2019 is on a course to be 1.31º warmer than the 1951-1980 mean temperature29.
NOAA reported in 2015 that “nighttime temperatures are slightly outpacing daytime
temperatures in the rate of warming (and in 2017 hit)a nationally averaged minimum . . . 60.9 ºF
in the contiguous US – 2.5ºF above average.30” The inability of cities and their inhabitants,
especially, to cool off at night is a public health threat, and a greater one in many third world
cities (and “third world neighborhoods” in a first world country like the US) where air
conditioning is rare and humidity levels are high, limiting the ability of bodies to shed heat.
Warmer nighttime temperatures close off what firefighters call the “nighttime recovery
window,” and allow fires to burn hot through the night, make containment more difficult.31
24
. . . and two degrees F since 1895, per OCCRI and Associated Press, June 18, 2018
25
Reported in Willamette Week, August 22, 2018
26
Abatzoglou, J., D.E. Rupp, and P.W. Mote, 2014: Understanding seasonal climate variability and change in the
Pacific Northwest of the United States. J. Climate, 27, 2125–2142 doi: 10.1175/JCLI-D-13-00218.1.
27
Reported in New York Times August 9, 2018
28
World Meteorological Society, reported in The Washington Post 30 July, 2018 (Angela Fritz)
29
NASA combined land-surface air and sea-surface water temperature anomalies, 2018.
30
National Oceanic and Atmospheric Administration, 2015-17, reported in InsideClimateNews 11 July 2018,
updated 7 September with record summer 2018 temperatures.
31
Reported in Salem Statesman Journal 10 August 2018.
13Draft Version October 12, 2018 for Commission Review – Not Final Until Commission Adopts
(In 2018) The El Paso Chapin High School Huskies football team starts its practices at 6 am, when
it’s a cool 82º in August, instead of the more usual mid-afternoon schedule when it’s expected
to go above 100º32.
Scientists analyzed the exceptionally deadly 2003 heat wave in Europe – the hottest summer on
record since 1540 – to which 70,000 deaths were attributed. They found that in Paris – the
hottest city – 70% of the deaths (506 out of 735) could be ascribed to climate change amplifying
the heat33.
Public Health
Apart from the direct effects of heat stress and other weather extremes on those without the
means of protection – usually the poor – climate change can aggravate certain chronic disease
conditions like asthma and heart disease and increase exposure to illnesses usually associated
with warmer climates.
Then . . . The 2010 Assessment warns of “Incidents of extreme weather (such as floods,
droughts, severe storms, heat waves and fires) can directly affect human health . . . heat-related
morbidity and mortality, especially among vulnerable populations . . . threat of vector-borne
diseases and emerging infections. Respiratory insults, especially among persons with preexisting
lung health problems would be exacerbated by exposure to smoke from wild land and forest
fires . . . allergies, asthma and other respiratory conditions among susceptible populations.34”
Now . . . “In Oregon, analysis of hospitalization and climate data showed that each 1ºF increase
in daily maximum temperature was associated with a nearly 3-fold increase in the incidence of
heat-related illness.35” The Oregon Health Authority recorded a 29% rise in emergency room
visits for respiratory symptoms in the metro region during the 2017 Eagle Creek fire,36 indicative
of health risks of smoke from more extensive wildfire.
The Oregon Health Authority issues health “advisories” to warn Oregonians of health risks.
These include recreational use advisories for cyanotoxins produced by harmful algae blooms
(HABs) that can arise in freshwater bodies across the state. The recreational use advisories warn
Oregonians against ingesting water affected by the toxins through swimming, water skiing, and
other water-based recreational activities. Health risks can range from gastrointestinal illness
and dizziness to seizures and liver failure; young children, dogs, and livestock are especially
susceptible. Conditions that foster freshwater HABs are increasing – higher air temperatures,
more sunlight, lower snowpack (and thus higher water temperatures), and more intense rain
events causing higher runoff of organic matter to water bodies. While recreational use
advisories have become a routine spring-through-fall occurrence, in May, 2018 Oregon
experienced its first-ever drinking water advisory due to cyanotoxins in finished drinking water.
Detroit Reservoir, the source of drinking water supplies for the City of Salem and other
32
“As Temperatures Keep Trending Up,” The Washington Post August 29, 2018
33
“Attributing human mortality during extreme heat waves to anthropogenic climate change.” Mitchell,
Heaviside et al in IOPScience 8 July 2016. Overall, France recorded 14,802 heat-related deaths in 2003.
34
2010 OCCRI Assessment, p. 403
35
Mote, Snover, “Climate Change in the Northwest.” Island Press. Available at www.occri.net/reports.
36
Statewide Fire Activation Surveillance Report (090517-090617), Oregon Health Authority
14Draft Version October 12, 2018 for Commission Review – Not Final Until Commission Adopts
communities, experienced a persistent algae bloom that resulted not only in recreational use
advisories at Detroit Lake, but also led to levels of cyanotoxin above safe drinking water levels
for sensitive populations such as children, the elderly, and those with compromised immune
systems in downstream communities. The State declared a “state of emergency” and the
Oregon National Guard distributed drinking water in affected communities.37
Forest wildfire generates higher levels of particulate (PM2.5) in western states including Oregon;
fires 2008-2012 result in higher premature deaths and respiratory ailments with long term US
costs, principally in the west and southeast upwards of $450 billion38. As fires and smoke
become more ubiquitous, disease and cost impacts will rise.
Annual mean levels of PM2.5
attributable to wildfire (2008);
levels in excess of 10 μg/m3 (in red)
considered unhealthy by WHO.
Elsewhere . . . Of 244 US cities analyzed for increased risk of mosquito-borne diseases (including
Zika, West Nile, and Dengue fever), 94% saw significant increases in days warm enough to
sustain disease-carrying mosquito species. While most of these are southern cities, they include
middle and northern urban areas such as San Francisco (47 more days since 1970), Helena MT
and Erie PN. Ironically, some southern cities (Phoenix AZ) may see a lower risk . . . because it
becomes too hot for the mosquitos to survive39.
Drought and Snowpack
37
Reported by Oregon Public Broadcasting (Erin Ross) 7 June 2018; and Oregon Environmental Council at
https://oeconline.maps.arcgis.com/apps/MapJournal/index.html?appid=5aacb7b363684c90945d0c4e8e77964a#
map
38
The health impacts and economic value of wildland fire episodes in the US: 2008-2012. Neal, Fanna et al, Elsevier
January 2018. Annual mean levels of PM2.5 considered safe by the World Health Organization rates as safe for
human health annual mean PM2.5 levels that do not exceed 10 μg/m3 (micrograms per cubic meter)
39
“Rise in Mosquito Disease Days”, Climate Central August 8, 2018
15Draft Version October 12, 2018 for Commission Review – Not Final Until Commission Adopts
Detroit Reservoir 2015 Hoodoo Ski Summit Feb 2015 Hoodoo webcam Dave
Reinert, Oregon State University 23 February 2015
Then . . . “By mid (21st) century, Cascade mountain snowpacks are projected to be less than half
of what they were in the 20th Century . . . .”
Now . . . while total precipitation shows no great variance, as predicted it shows more moisture
arriving as rain than as snow. The 3rd Assessment reports on 2015, in which this effect was
exceptional:
“The 2015 snow drought as a glimpse into Oregon’s future. Precipitation during the winter of
that year (2015) was near normal, but winter temperatures that were 5–6°F above average
caused the precipitation that did fall to fall as rain instead of snow, reducing mountain
snowpack accumulation (Mote et al., 2016). This resulted in record low snowpack across the
state, earning official drought declarations for 25 of Oregon’s 36 counties40. . . . for each 1.8°F of
warming, peak snow water equivalent in the Cascade Range can be expected to decline 22%–
30%41. . . . Spring snowpack . . . decreased at nearly all stations in Oregon over the period 1955–
2015 with an average decline of about 37% (Mote and Sharp, 2015)42.”
40
OCCRI Third Assessment, page 13. January 2017
41
Cooper et al, 2016 in OCCRI Third Assessment 2017, page 14
42
Mote and Sharp, 2015 in OCCRI Third Assessment 2017, page 19
16Draft Version October 12, 2018 for Commission Review – Not Final Until Commission Adopts
Image Credit: Northwest Climate Toolbox, OCCRI
OCCRI Director Dr. Phil Mote and colleagues confirmed earlier predictions in reporting “. . . a
decline in average April 1 snow water equivalent since mid-century is roughly 15-30% . . . .
Declining trends (in western winter snowpack) are observed across all months, states and
climates, but are largest in spring, in the Pacific states, and in locations with mild winter
climate.43”
That’s Oregon.
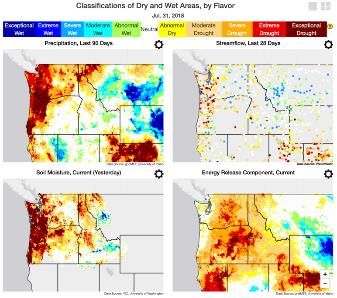
OCCRI’s website posting includes an August 2, 2018 article by Dr. John Abatzoglou titled
“Drought Returns to the Pacific Northwest” in which the author identifies five “flavors” of
drought including low precipitation but also low surface supply and low snowpack. He then
maps these effects for 2018 to date, and observes that “the maps all show an awful lot of red,
indicating extreme to exceptional drought across parts of western Oregon (with) impacts that
cover the gamut from fire to farms to fish.44”
OCCRI Deputy Director Kathie Dello summarized the Institute’s review of the 2017/18 drought
summers as “low snowpack and a hot and dry summer caused water shortages for livestock,
small water systems and stressed forests and other ecosystems. Multiple years of hot and dry
summers (have) caused damage to Douglas Fir trees in western Oregon.45
Elsewhere: The Mote article also showed snowpack decreases in excess of 70 percent also
occurred at locations in California, Montana, Washington, Idaho and Arizona46.” The Arizona
State Climate Office reports that the state “is currently in our 21st year of a long-term drought.
While California has a long history of wet and dry periods, in 2015 the state “experienced its
lowest snowpack in at least 500 years (and) the 2012-15 period was the driest in at least 1200
43
Mote, Li et al, “Dramatic declines in snowpack in the western US.” Climate and Atmospheric Sciences 2 March
2018
44
Abatzoglou, “Drought Returns to the Pacific Northwest,” OCCRI Climate Circulator 2 August 2018
45
Personal communication/Email from Kathie Dello to Angus Duncan, 1 October 2018.
46
Mote, Li et al, Dramatic declines in snowpack in the western US. Science Daily March 2, 2018
17Draft Version October 12, 2018 for Commission Review – Not Final Until Commission Adopts
years.47” A related study ascribes “8-27% of the observed anomaly in 2012-2014” to global
warming48.
A 2016 NASA study found that drought conditions beginning in 1998 and afflicting countries in
the Middle East “. . . is likely the worst drought of the past nine centuries . . .” and well outside
the range of natural variability for modern times49.”
Droughts in 2018 affected countries from western and northern Europe to South Africa to
Australia. Another NASA study suggests, consistent with predictions of climate effects, that
there is a “redistribution” of fresh water supplies from the middle latitudes (SW US/Mexico;
north Africa and the Middle East; India) to the north and south. The data are not sufficient to
discern a clear climate fingerprint, says Jay Famiglietti, one of the NASA researchers, but it sure .
. . matches that pattern (and is) cause for concern.50”
Extreme Weather and Flooding; Sea Level Rise
Then . . . Stronger ocean storms and coastal flooding; “significant physical impacts along the
coast and estuarine shorelands of Oregon . . . increased erosion and inundation . . . wetland loss
. . . > 1.0 meter sea level rise by 2100 . . . increasing storm intensities and the heights of the
waves . . .
Now . . . In 2007, Vernonia in Oregon’s coast range suffered severe flooding for the third time in
19 years as the Nehalem River responded to 6.5” to 7.5” of rain in 24 hours; other north coastal
towns were hit as well. In November, 2015, flooding shut down US 101 in Tillamook, OR. Other
incidents of heavier than expected rain events have been associated with storm activity in the
past two decades. However it is not yet clear whether these eventful recent precipitation
patterns have resulted in significant new levels of winter flooding in Oregon that can be
“fingerprinted” as climate-change induced.
47
Wikipedia, “Droughts in California”; and Griffin, Anchukaitis, “How unusual is the 2012-2015 Californai drought?”
in Geophysical Research Letters, 3 December 2014
48
Park; et al. (2015). "Contribution of anthropogenic warming to California drought during 2012–
2014". Geophysical Research Letters
49
Cook, Anchukaitis et al, “Spatiotemporal drought variability in the Mediterranean over the last 900 years”,
Journal of Geophysical Research 4 February 2016
50
Results of 2002-2016 GRACE Mission, reported in the Washington Post 16 May 2018.
18Draft Version October 12, 2018 for Commission Review – Not Final Until Commission Adopts
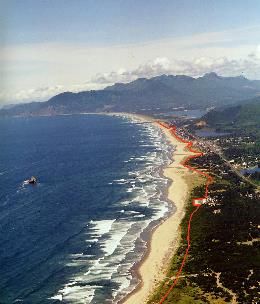
1997 2008
North Oregon coast showing 1997 high water line moving inland (red line) by 2008. 51 (Photos by Don Best)
Closer to the ocean, some 7400 north coast people live in the “inundation” zone52 at risk from
predicted 2100 sea level rise. . . . sea level rise has been accelerating . . . to (at least) 3.2
mm/year since 1993 (up from 1.2mm/year 1901-1990); “Tall waves, intense storms and El Nino
combine with sea level rise to produce amplified coastal erosion . . . the cost of adaptation to
sea level rise and storm surge may be on the order of $1.5 billion through 210053.”
Elsewhere . . . On average global sea levels are rising at more than 3 mm/year (and rose 17
centimeters during the 20th Century54, or almost 7 inches, from two effects of climate change:
melting ice sheets and thermal expansion of ocean waters. The effect puts at risk coastal
populations around the world; threatens to submerge many low-lying island nations; increases
risk of coastal flooding from stronger storm surges acting on higher sea levels (see Hurricanes
Florence, Harvey, Irma, Sandy, Katrina etc.), and of contamination of fresh water supplies with
salt water; and alters ecological habitats for many animal and plant species.
“100 year” flood zones are becoming 50-year or riskier zones. New York City, battered by
flooding into lower Manhattan from Hurricane Sandy, is planning for the much worse flooding
expected with a 2.5 foot global sea level rise by 2050. Some 40% of US population lives in
coastal zones, while elsewhere around the world much poorer populations are at risk equivalent
to New York City but without the means to construct barriers and other coping structures.
Hurricane Florence is pounding the Carolinas as this is being written with rainfall 50% greater
than it would have been without climate change, according to new analytic tools for
51
“Implications of Climate Change to the Oregon Coast”, Jonathan Allen, 2008. Oregon Department of Geology and
Mineral Industries (DOGAMI)
52
Defined as “within reach of the mean highest high tide projected for 2100.” Page 35, OCCRI 2017 Assessment
53
OCCRI 2017 Assessment, pp 34- 35
54
NASA, at https://climate.nasa.gov/resources/education/pbs_modules/lesson3Overview/
19Draft Version October 12, 2018 for Commission Review – Not Final Until Commission Adopts
distinguishing the climate “footprint” in extreme weather events. Fueled by ocean
temperatures 2º to 4º F above historic averages, the storm was larger (8% to 9%) and slower-
moving (allowing more rain intensity) than it would have been without the climate change
bump55.
In August 2017 Hurricane Harvey flooded Houston with up to 51 inches of rain in some areas –
30 trillion gallons of water56, causing some 106 deaths and $125 billion in damages. Harvey’s
precipitation accumulations appear to have been + 38% higher than absent climate change
effects57.
In the United States, 2017 was notable for its destructive hurricane season, with Irma and Maria
piling atop Harvey. Updated casualty figures attributed 2975 deaths in Puerto Rico to Maria,
along with major impacts to infrastructure (e.g., nearly a year’s delays in restoring electrical
service island-wide; estimated damage costs of $90 billion). Earlier, New Orleans has yet to
recover from 2005’s Katrina (1833 deaths; $160 billion in damages).58
2018 saw extreme flooding events in Japan (200 dead)59, India (350 dead; 800,000 displaced)60,
Southeast Asia (notable for the 12 teenage soccer players rescued from their flooded cave in
Thailand) and elsewhere.
While the impacts of tropical storms and flooding are hardly unknown in human history, their
extent, intensity (wind strength) and moisture content (rainfall) have measurably increased as
climate change effects have become more pronounced61. Category 5-equivalent Typhoon
Mangkut hit the Philippines with winds up to 125 mph and gusts over 200 mph62, doubling down
on the destruction from last year’s Typhoon Haima and from 2013’s deadly Haiyan (Yolanda --
sustained winds of 195 mph, more than 7000 people dead or missing and estimated damages of
$14.5 Billion63). There is emerging consensus that such extreme storm events in the Pacific are
becoming more intense and destructive, and these changes are fueled by warming ocean
temperatures64
55
https://www.somas.stonybrook.edu/2018/09/13/estimating-the-potential-impact-of-climate-change-on-
hurricane-florence/
56
Mimi Schwartz, “What we didn’t learn from Harvey”, in New York Times 25 August 2018.
57
Per Dr. Michael Wehner, LBNL: “Attributable Human-Induced Changes in the Likelihood and Magnitude of the
Observed Extreme Precipitation during Hurricane Harvey.”
58
Reported in The Economist pp. 54-55. 22 September 2018.
59
Reported by CNN 12 July, 2018
60
“Flooding (in) the Indian State of Kerala,” reported in Business Insider 19 August 2018
61
Tropical cyclones and climate change, reported in Wikipedia
62
Reported by BBC News 15 September, 2018
63
Reported by Bloomberg November 11, 2013
64
“…typhoons in the north-west Pacific had intensified by 12–15% on average since 1977. The proportion of the
most violent storms - categories 4 and 5 - doubled and even tripled in some regions over that time and the
intensification was most marked for those storms which hit land. . . . The intensity of a typhoon is measured by the
maximum sustained wind speed, but the damage caused by its high winds, storm surges, intense rains and floods
increases disproportionately, meaning a 15% rise in intensity leads to a 50% rise in destructive power.” Nature
Geoscience 5 September, 2016, quoted in The Guardian 5 September, 2016. And, “the strongest future storms will
20Draft Version October 12, 2018 for Commission Review – Not Final Until Commission Adopts
Ocean Conditions
Then . . . In the OCCRI 2010 Assessment: “Substantial increases in water temperatures in the
ocean are likely and will exceed natural variability. The ocean also absorbs carbon dioxide (CO2)
from the atmosphere, which forms carbonic acid and is making waters corrosive to certain
species. . . . The combination of these climate and nearshore ocean changes will exert stress on
the communities of near-coastal and estuarine organisms.”65
Now . . . “ the West Coast has already reached (an acidification) threshold and negative impacts
are already evident, such as dissolved shells in pteropod populations and impaired oyster
hatchery operations. . . . 60% of the dissolved inorganic carbon in surface waters off Oregon’s
coast in 2013 is attributed to increasing greenhouse gas concentrations.66” Heat in OR offshore
waters is contributing to marine harmful algal blooms (HABs) adverse to the $50 million annual
Oregon Dungeness crab catch67; also impacts to salmon food species.68” “Ocean acidification . .
. impairs the ability (of shellfish) to build shells69.” Scientists project that the west coast “will
face some of the earliest, most severe changes in ocean carbon chemistry (driven by climate
change, including) intensification and expansion of low dissolved oxygen – or hypoxic – zones.70”
Oregon’s commercial and recreational fisheries together amount to around $200mm annually.71
Elsewhere . . . 1982-2016 saw a doubling of the number of marine heat waves (exceeding the
99th percentile) globally, affecting phytoplankton72 that are the base of the ocean food chain. . .
the “Blob,” a large area of persistent warm Pacific Ocean water present 2013-2016, reflecting
wider abnormal ocean temperatures that depressed phytoplankton production causing
widespread declines in the ocean food web that, among other effects, let to death by starvation
for thousands of California sea lion pups73.”
Infrastructure
Then . . . “Projected climate changes in precipitation rates and temperatures are likely to
threaten the integrity of the built environment, including buildings, roads, highways and
exceed the strength of any in the past.” Ramstorf, Emanuel et al, “Does Global Warming Make Tropical Cyclones
Stronger?” at RealClimate website (www.realclimate.org/)
65
Legislative Summary, and Executive Summary Chapter 6, 2010 Oregon Climate Assessment, OCCRI
66
OCCRI, Third Oregon Climate Assessment Report January 2017, page
67
McCabe et al., 2016. An unprecedented coastwide toxic algal bloom linked to anomalous ocean conditions.
Geophys. Res. Lett., 43(19), 10,366–10,376.
68
Cavole et al., 2016. Biological impacts of the 2013–2015 warm-water anomaly in the Northeast Pacific: Winners,
losers, and the future. Oceanography, 29(2), 273–285, http://dx.doi.org/10.5670/oceanog.2016.32; and direct
communication from Dr. Caren Braby, ODFW, October 2, 2018 re: value of Oregon Dungeness crab fishery.
69
2017 OCCRI Climate Assessment p. 36
70
West Coast Ocean Acidification and Hypoxia Science Panel, “Major Findings, Recommendations and Actions,”
SCCWRP Technical Report 926, April 2016
71
Economic Impact of Oregon’s Commercial and Recreational Ocean Fisheries, Oregon Department of Fish and
Wildlife web site (https://www.dfw.state.or.us/agency/economic_impact.asp).
72
Thomas L. Frölicher, Erich M. Fischer & Nicolas Gruber, 2018. Marine heatwaves under global warming. Nature,
560, 360–364.
73
Cavole et al., 2016. Biological impacts of the 2013–2015 warm-water anomaly in the Northeast Pacific: Winners,
losers, and the future. Oceanography, 29(2), 273–285, http://dx.doi.org/10.5670/oceanog.2016.32.
21Draft Version October 12, 2018 for Commission Review – Not Final Until Commission Adopts
railroads, water and sewage systems, and energy facilities throughout Oregon (CLI 2008,
2010)74”.
Now… The Eagle Creek fire interrupts commercial traffic on I-84; flooding (Vernonia, 2007);
unseasonable warming in November, 2006 that melted ice and released a rock slide that closed
OR 35 for >30 days (OR 35 has history of such washouts, more than 20 since 1907; five have
occurred since 1998)75 . . . Less predictable river/reservoir flows make scheduling flood
drawdowns and hydro generation more difficult76; while potential low summer stream flows put
Oregon’s irrigated agriculture sector at risk.
Some 2800 miles of roads in OR and WA are in the 100-year floodplain; some highways may face
increased inundation with two feet of sea level rise77. From an ODOT 2012 analysis, “Oregon’s
coastal roadways already experience the effects of climate change. U.S. Highway 101 near the
City of Seaside, Oregon experiences habitual flooding problems causing road closures and delays
multiple times every year.” Impacts to coastal roadways will come, according to ODOT, from “2-
4 feet of sea level rise by 2100 . . . Increases in wave heights . . . (and) inundation and erosion
(leading to slides) along entire coastline.78”
Summer 2018 heat in Portland forces MAX lines to slow down when temperatures exceed 95ºF,
in turn slowing the overall commute.79
Elsewhere . . . The integrity of dikes and levees in The Netherlands is threatened in 2018’s
drought by scarcity of the fresh water flows necessary to offset sea water pressure80.
Elsewhere, hurricanes Sandy (New York City subway flooding), Katrina (all New Orleans city
services interrupted) and Maria (Puerto Rico electricity service failed and not fully restored for
almost a year) illustrate the infrastructure impacts potential, always remembering that third
world infrastructure is already often unsteady and fragile, prone to interruption from lesser
forces than those threatened by climate change, and far slower to recovery (see Puerto Rico
power system recovery).
The US Government Accountability Office reported in 2017 direct federal government costs for
responding to “extreme weather and fire events” of $350 billion over the prior decade.81 The
Report referenced The 3rd National Climate Assessment that: “the impacts and costs of extreme
events—such as floods, drought, and other events—will increase in significance as what are
considered rare events become more common and intense because of climate change.”
74
2010 OCCRI Climate Assessment, p. 393.
75
Wikipedia article “Oregon Route 35”
76
“Climate Change Initiative Briefing” to NW Power Planning Council, July 13, 2011. BPA, BuRec, COE
77
Mote, Snover, “Climate Change in the Northwest” 2013
78
ODOT, Climate Change Adaptation Strategy Report April 2012, page 16
79
Oregonian/Oregon Live, “Why do TriMet Max and WES trains have to slow down in the heat?”, 4 August 2016
80
London Express July 25, 2018
81
USGAO Report 28 September, 2017, relying on US Office of Management and Budget FY 2017 Budget:
“including $205 billion for domestic disaster response and relief; $90 billion for crop and flood insurance; $34
billion for wildland fire management; and $28 billion for maintenance and repairs to federal facilities and federally
managed lands, infrastructure, and waterways.”
22You can also read