Organic carbon densities and accumulation rates in surface sediments of the North Sea and Skagerrak
←
→
Page content transcription
If your browser does not render page correctly, please read the page content below
Biogeosciences, 18, 2139–2160, 2021
https://doi.org/10.5194/bg-18-2139-2021
© Author(s) 2021. This work is distributed under
the Creative Commons Attribution 4.0 License.

Organic carbon densities and accumulation rates in surface
sediments of the North Sea and Skagerrak
Markus Diesing, Terje Thorsnes, and Lilja Rún Bjarnadóttir
Geological Survey of Norway, P.O. Box 6315, Torgarden, 7491 Trondheim, Norway

Correspondence: Markus Diesing (markus.diesing@ngu.no)

Received: 24 September 2020 – Discussion started: 6 October 2020
Revised: 18 February 2021 – Accepted: 18 February 2021 – Published: 24 March 2021

Abstract. Continental shelf sediments are places of both           1   Introduction
rapid organic carbon turnover and accumulation, while at the
same time increasingly subjected to human-induced distur-          Marine sediments are an important sink for organic car-
bances. Recent research suggests that shelf sediments might        bon (OC) on Earth, with estimates of OC burial in ma-
have a role to play as a natural climate solution, e.g. by stor-   rine sediments ranging from 126 Tg C yr−1 (Berner, 1982) to
ing organic carbon if left undisturbed from anthropogenic ac-      350 Tg C yr−1 (Keil, 2017). The major hotspots for OC burial
tivity. However, we have an incomplete understanding about         in the global ocean are the coastal margins (Bianchi et al.,
the centres of organic carbon accumulation and storage on          2018). Burdige (2007) estimated that 80 % (248 Tg C yr−1 )
continental shelves. To better constrain the rate of accumu-       of all OC buried in marine sediments is occurring in conti-
lation and the mass of organic carbon that is stored in sedi-      nental margin sediments. However, other estimates do also
ments, we developed and applied a spatial modelling frame-         exist (Bauer et al., 2013; Duarte et al., 2005; Hedges and
work that allows us to estimate those quantities from sparse       Keil, 1995), ranging from 45.2 to 300 Tg C yr−1 , and budgets
observations and predictor variables known or suspected to         are generally not well constrained (Burdige, 2007). Estimates
influence the spatial patterns of these parameters. This pa-       of the amount of OC stored in marine surface sediments also
per presents spatial distribution patterns of organic carbon       vary considerably, ranging from 87 Pg C (Lee et al., 2019)
densities and accumulation rates in the North Sea and Sk-          via 168 Pg C (LaRowe et al., 2020) to 3117 Pg C (Atwood et
agerrak. We found that organic carbon stocks and accumula-         al., 2020). Such differences can be attributed only partly to
tion rates are highest in the Norwegian Trough, while large        differences in the reference depths being considered, ranging
parts of the North Sea are characterised by low stocks and         from 0–5 cm (Lee et al., 2019) to the bioturbated Holocene
zero net accumulation. The total stock of organic carbon           layer, which is assumed to be 0–10 cm (LaRowe et al., 2020)
that is stored in the upper 0.1 m of sediments amounted to         or 0–1 m (Atwood et al., 2020).
230.5 ± 134.5 Tg C, of which approximately 26 % is stored             In recent years, attempts have been made to construct car-
in the Norwegian Trough. Rates of organic carbon accumula-         bon budgets for entire continental shelf systems. However,
tion in the Norwegian Trough are comparable with those re-         these studies have not included spatially explicit estimates of
ported from nearby fjords. We provide baseline datasets that       OC stock and burial (Fennel et al., 2019; Najjar et al., 2018)
could be used in marine management, e.g. for the establish-        or concluded that both stocks and burial rates were associated
ment of “carbon protection zones”. Additionally, we high-          with considerable uncertainty (Legge et al., 2020).
light the complex nature of continental shelves with zones            Given the importance of continental margins in OC cy-
of rapid carbon cycling and accumulation juxtaposed, which         cling, it is therefore of great importance to develop ade-
will require further detailed and spatially explicit analyses to   quate methods that better constrain stocks, flows, and bud-
constrain sedimentary organic carbon stocks and accumula-          gets of OC and quantify the uncertainty of the predictions.
tion rates globally.                                               In particular, spatially explicit methods that predict the vari-
                                                                   ation of OC in space by means of geostatistics or machine-
                                                                   learning spatial prediction are promising, and much can be

Published by Copernicus Publications on behalf of the European Geosciences Union.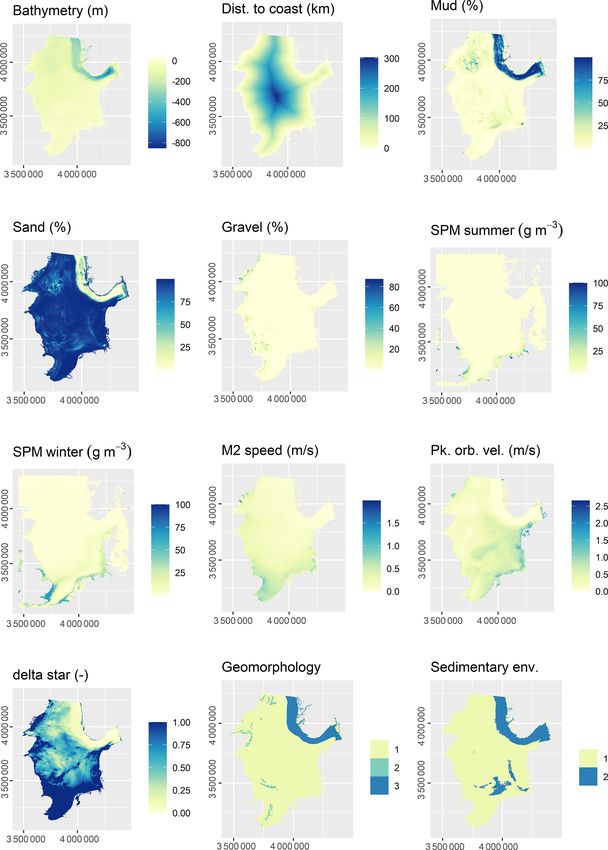
2140                               M. Diesing et al.: Organic carbon densities and accumulation rates in surface sediments

learnt from related terrestrial disciplines such as digital soil    tion, but OC accumulation in marine sediments is currently
mapping (Hengl et al., 2014, 2017; McBratney et al., 2003).         not considered (Anonymous, 2013). Consequently, a ques-
Recent studies appear to prefer machine-learning approaches         tion has been raised about whether those stocks should be
over geostatistical approaches (Seiter et al., 2004) due to their   considered part of national carbon accounting and poten-
performance, flexibility, and generality (Hengl et al., 2018),      tial greenhouse gas mitigation strategies and be subject to
and estimates of OC stored in marine sediments at a global          management against human-induced disturbance (Avelar et
(Atwood et al., 2020; Lee et al., 2019) and sea-basin scale         al., 2017). The socio-economic importance of marine carbon
(Diesing et al., 2017; Wilson et al., 2018) have been derived.      storage has recently been assessed in a scenario analysis of
However, no spatially explicit estimates of OC accumulation         increased human and climate pressures over a 25-year period.
and burial rates exist to our knowledge.                            It was estimated that damage costs of up to USD 12.5 bil-
   It is important to stress the difference between OC burial       lion from carbon release linked to disturbance of coastal
and OC accumulation here. Burial is the deposition of OC            (areal loss of seagrass habitats, sediment OC loss from salt
below the zone of active degradation (Keil, 2015). OC               marshes) and shelf sea sediment (resuspension by bottom
degradation in surficial seafloor sediments happens via var-        contact fishing) carbon stores could arise in the United King-
ious processes including aerobic respiration, denitrification,      dom (Luisetti et al., 2019). However, the transboundary na-
manganese reduction, iron reduction, sulfate reduction, and         ture of carbon flows in the marine environment poses sig-
methanogenesis (Berner, 1980). Burial thus is the removal of        nificant challenges for carbon accounting and requires new
OC from the active carbon cycle, and the burial rate can be         guidance and governance frameworks to manage these stocks
expressed as the product of sediment accumulation and OC            (Luisetti et al., 2020).
content at the depth below which no further degradation of             Marine protected areas (MPAs) might be a suitable man-
OC occurs (Middelburg, 2019). It is, however, difficult to de-      agement measure to effectively protect the carbon storage
termine that depth. Various depth horizons have been used,          ecosystem service of Blue Carbon ecosystems against human
e.g. the lower boundary of the sulfate reduction zone (Jør-         pressures (Zarate-Barrera and Maldonado, 2015) by slowing,
gensen et al., 1990), 15 cm (Hartnett et al., 1998), and 10 cm      halting, or reversing the trend of degradation and loss of, for
(Bakker and Helder, 1993). OC accumulation rates, however,          example, seagrass and mangrove ecosystems. In Indonesia,
can be calculated for any specific depth interval of the sedi-      MPAs reduced mangrove loss by about 140 km2 and avoided
ment column. Due to the difficulties of determining the rele-       emissions of 13 Tg CO2 equivalent between 2000 and 2010
vant depth to estimate burial rates and the scarcity of burial      (Miteva et al., 2015). Further offshore, demersal fishing is
rate data, we decided to estimate OC accumulation rates in-         an important and widespread pressure on continental shelf
stead.                                                              seabed habitats (Amoroso et al., 2018; Halpern et al., 2008).
   Well-constrained estimates of OC stocks and accumula-            Chronic demersal fishing has negative impacts on benthic
tion rates are also required from a marine management per-          biomass, production, and species richness, and it is leading
spective. OC stocks are a measure of the vulnerability poten-       to shifts in the composition of communities (Hiddink et al.,
tial, while accumulation rates are a measure of the mitiga-         2006, 2017; Jennings et al., 2001; Tillin et al., 2006). The
tion potential (Jennerjahn, 2020). The potential of so-called       impact of demersal fishing on the biogeochemistry of the
“Blue Carbon” ecosystems (mangroves, salt marshes, sea-             seafloor and OC storage is less well understood. Several stud-
grass meadows, and potentially macroalgae; Krause-Jensen            ies show lower OC contents in surface sediments of trawled
and Duarte, 2016) to sequester and store OC is an impor-            areas (Bhagirathan et al., 2010; Martín et al., 2014b; Paradis
tant ecosystem service that has been highlighted in recent          et al., 2019, 2020; Pusceddu et al., 2014), while others report
years (Duarte et al., 2005; Mcleod et al., 2011; Nellemann          higher OC contents, presumably due to fertilisation brought
et al., 2009). More recently, it has been shown that fjord          about by resuspension or uplifting of OC from deeper lay-
(Smeaton et al., 2016, 2017) and continental shelf sediments        ers caused by trawling (Palanques et al., 2014; Pusceddu et
(Diesing et al., 2017) harbour considerable amounts of OC.          al., 2005). In the short term, demersal-fishing-induced sed-
In the United Kingdom, the shelf sediment stock (205 Tg C)          iment disturbance stimulates OC mineralisation in cohesive
accounts for 93 % of OC stored in coastal and marine habitats       sediments, likely due to the enhanced decomposition of pre-
(Luisetti et al., 2019) and outweighs combined seagrass and         viously buried refractory OC (van de Velde et al., 2018). In
salt marsh stocks (13.4 Tg C) by a factor of ≈ 15. In Namibia,      the long term, the expected result of repeated and vigorous
the marine sediment OC stock is estimated to be larger than         sediment mixing due to demersal fishing is a general impov-
the soil OC stock (Avelar et al., 2017). Determining national       erishment in OC (Martín et al., 2014a). Given the large areas
carbon stocks is essential to understand the potential vulner-      affected (≈ 10 × 106 km2 ) and the amount of sediment being
ability of those stocks to human activities; however, national      resuspended (≈ 22 Pg yr−1 ) globally (Oberle et al., 2016), it
assessments for greenhouse gas reporting do not account for         is likely that the impact of demersal fishing on shelf sedi-
marine stocks such as organic carbon stored in shelf sedi-          ment OC storage is substantial. Chronic seabed disturbance
ments (Avelar et al., 2017). In Norway, the government has          by demersal fishing might have a sizeable impact on the car-
underlined the significance of OC uptake by marine vegeta-          bon cycle in cohesive sediments on continental shelves by

Biogeosciences, 18, 2139–2160, 2021                                                   https://doi.org/10.5194/bg-18-2139-2021
M. Diesing et al.: Organic carbon densities and accumulation rates in surface sediments                                            2141

keeping coastal seabed biogeochemistry in a transient state,
which translates into reduced OC accumulation rates (van de
Velde et al., 2018). Establishment of MPAs protecting against
demersal fishing could not only facilitate the recovery of ben-
thic species but also promote longer-term carbon uptake by
seabed ecosystems through increased biomass, as well as
prevent further loss of OC stored in sediments (Roberts et
al., 2017).
   The North Sea and Skagerrak are among the most inten-
sively researched regional seas with a wealth of data avail-
able for reuse. At the same time, they are the most heavily im-
pacted by human activities (Halpern et al., 2008). This makes
the area ideal for our study which has the objectives to esti-
mate OC stocks and accumulation rates of surface sediments
in a regional sea that is impacted by human activities. These
estimates will be accompanied by assessments of uncertainty
in the predictions. With the help of these predictions, the fol-
lowing research questions will be addressed:
                                                                   Figure 1. Overview of the study site. Letters refer to localities: DB
    1. What is the importance of seafloor sediment OC stocks       – Dogger Bank; FB – Fisher Bank; SB – Southern Bight. Numbers
       relative to other OC stocks?                                refer to areas of sediment deposition: 1 – Norwegian Trough; 2 –
                                                                   Elbe palaeo-valley; 3 – German Bight; 4 – Oyster Ground; 5 – Outer
    2. Where are the centres of OC accumulation in the North       Silver Pit; 6 – Inner Silver Pit; 7 – Devil’s Hole. Refer to Sect. 3.2
       Sea and Skagerrak?                                          for the delineation of areas of sediment deposition.

    3. Based on the previous results, can we differentiate be-
       tween different zones of OC processing at the seafloor?     3     Data
    4. What are possible implications for marine manage-
                                                                   3.1     Response variables
       ment?
                                                                   3.1.1    Linear sedimentation rate
2    Regional setting
                                                                   Linear sedimentation rate (ω) (measured in cm yr−1 ) is used
The study site encompasses the North Sea and Skagerrak re-         here synonymously with sediment accumulation rate. Data
gional seas as defined by the International Hydrographic Or-       were initially sourced from the EMODnet-Geology por-
ganization (1953). The surface areas of the North Sea and          tal (https://www.emodnet-geology.eu/, last access: 5 Febru-
Skagerrak are approximately 526 000 and 32 000 km2 , re-           ary 2019), which provides a collation of values from the liter-
spectively. The seafloor in the study site is mostly shallow       ature across European sea basins. The dataset was limited to
and flat, generally deepening from south to north (Fig. 1).        the study site and sedimentation rates based on 210 Pb, to en-
The most prominent morphological feature is the Norwe-             sure a consistent integration timescale (Jenkins, 2018). Based
gian Trough, which follows the coast of southern Norway            on a half-life of approximately 22 years, the associated inte-
and reaches water depths of nearly 700 m in the Skager-            gration time is roughly 100 years (Jenkins, 2018). Data from
rak. It forms a major accumulation area for fine-grained ma-       Zuo et al. (1989) were excluded as these were deemed unre-
terial (Eisma and Kalf, 1987; Van Weering, 1981). Large            liable (de Haas et al., 1997).
parts of the continental shelf outside the Norwegian Trough           The reported sedimentation rate data focussed on accumu-
are erosional or non-depositional in nature (de Haas et al.,       lation areas like the Norwegian Trough (Fig. 2). However,
1997), with limited sedimentation occurring in the German          to be able to spatially predict sedimentation rates across the
Bight, the Elbe palaeo-valley, Oyster Ground, Inner Silver         study site it is necessary to include data from areas of ero-
Pit, Outer Silver Pit, and Devil’s Hole (Eisma and Kalf,           sion and non-deposition, which predominate in the North
1987; de Haas et al., 1997). Previous studies (de Haas et al.,     Sea. Therefore, the data by de Haas et al. (1997) were also
1997, 2002; de Haas and van Weering, 1997) have indicated          included. This provided less than 20 data points of zero net-
that most of the OC accumulation occurs in the Norwegian           sedimentation, which was still deemed insufficient. Addi-
Trough (≈ 1 Tg C yr−1 ), while OC accumulation in the re-          tionally, pseudo-observations (Hengl et al., 2017) were also
maining area is low (≈ 0.1 Tg C yr−1 ).                            included. Pseudo-observations are “virtual” samples that are
                                                                   placed in undersampled areas and for which the value of the
                                                                   response variable can be assumed with high certainty. Hengl

https://doi.org/10.5194/bg-18-2139-2021                                                     Biogeosciences, 18, 2139–2160, 2021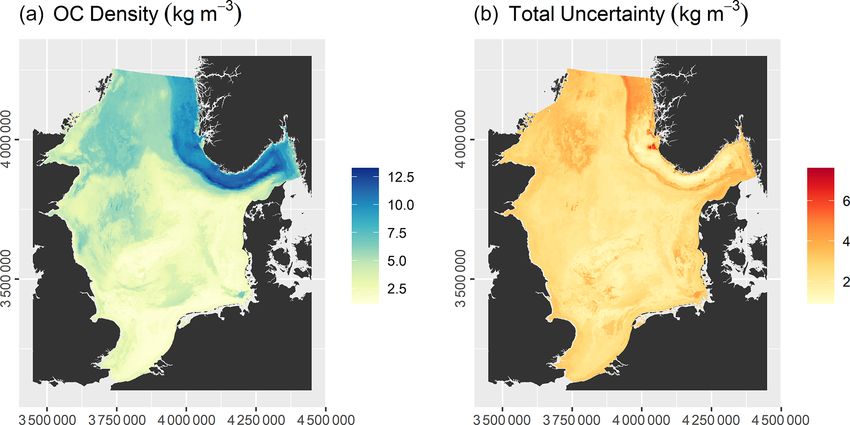
2142 M. Diesing et al.: Organic carbon densities and accumulation rates in surface sediments
et al. (2017) cite 0 % soil OC in the top 2 m of active sand 3.2 Predictor variables
dunes as an example. Mitchell et al. (2021) placed pseudo-
samples in areas of bedrock outcropping at the seabed when The initial selection of environmental predictor variables was
predicting sedimentation rates in the Baltic Sea. The place- based on availability and expected relevance to OC. At this
ment of pseudo-observations was restricted to areas of ero- initial stage of conceptual model building (Guisan and Zim-
sion and non-deposition (based on the sedimentary envi- mermann, 2000), it might be prudent to include a wide range
ronment layer, as described in Sect. 3.2), for which a sedi- of potentially relevant variables. A selection of variables that
mentation rate of 0 cm yr−1 could be assumed. The pseudo- are actually relevant for the model will be performed subse-
observations were placed randomly to avoid human bias. quently. A previous modelling study highlighted mud con-
Some of the sedimentation rate values from non-depositional tent in surficial sediments, bottom water temperature, and
areas reported by de Haas et al. (1997) and van Weering et distance to the closest shoreline as important predictors for
al. (1993) appeared too high, and after a review of the 210 Pb- OC (Diesing et al., 2017). Other environmental controls on
profiles four of them were set to 0 cm yr−1 due to low 210 Pb OC accumulation that have been inferred are sedimentation
activities and indistinct decreases with depth. The full dataset rate (Müller and Suess, 1979), bottom water oxygen concen-
used for subsequent modelling is shown in Fig. 2 and pro- tration (Paropkari et al., 1992), and oxygen exposure time
vided as Table S1 in the Supplement. (Hartnett et al., 1998). There is less information available on
relevant predictors for sedimentation rate, but it is assumed
3.1.2 Organic carbon density that sedimentation is favoured in deep basins with low cur-
rent speeds and wave orbital velocities. Fine-grained sedi-
Previous studies have predicted OC content and sediment ments prevail in these environments and might be indicative
porosity separately to calculate OC stocks (Diesing et al., for areas of sediment accumulation.
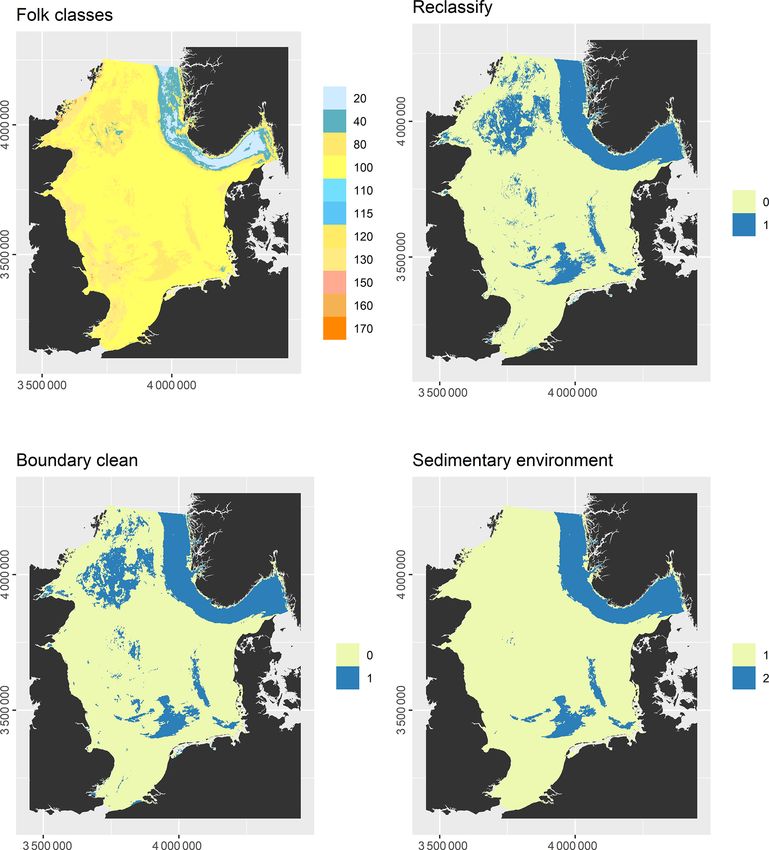
2017; Lee et al., 2019; Wilson et al., 2018). Here, we first cal- Some predictor variables were derived from other data lay-
culate OC density from concurrent measurements of OC con- ers: the geomorphology layer was derived from Harris et
tent and sediment dry bulk densities or porosities. This has al. (2014) and contained the geomorphic features shelf, shelf
two advantages: First, there is no need to transform the re- valley, and glacial trough. The sedimentary environment was
sponse variable as would be necessary in the case of OC con- inferred from modelled Folk classes (Mitchell et al., 2019a).
tent reported as weight percent or fractions. Second, only one Initially, areas covered with mud, sandy mud, and muddy
model instead of two needs to be fitted. This is advantageous sand were assumed to be potentially accumulative. Bound-
as fitting two models would likely increase the uncertainty of aries were subsequently cleaned in ArcGIS to simplify the
the predictions. Initially, a wide range of data sources were regions. These potential accumulation areas were critically
accessed. Ultimately, 373 samples fulfilled the criterion of reviewed in the light of measured sedimentation rates and
providing OC content and dry bulk density/porosity mea- geological interpretations of sediment cores (de Haas et al.,
sured on the same sample. These samples were collected and 1997, and references therein). The remaining main areas of
measured by the Geological Survey of Norway, the Centre net deposition are shown in Fig. 1. The process is shown
for Environment, Fisheries and Aquaculture Science, Bakker in Fig. A1 in Appendix A. Oxygen penetration depth was
and Helder (1993), and de Haas et al. (1997). derived by applying relationships between measured oxy-
OC density ρOC (kg m−3 ) was calculated from data on OC gen penetration depth and mud content (John Barry, personal
content G (g kg−1 ) and dry bulk density ρd (kg m−3 ): communication, 2018, Cefas) to the mud layer (Mitchell et
al., 2019a). Oxygen exposure time was derived by dividing
ρOC = G · ρd . (1) oxygen penetration depth by the modelled linear sedimenta-
tion rate (Hartnett et al., 1998).
All datasets were projected to Lambert azimuthal equal-
If not measured, dry bulk density was calculated from poros- area projection with a resolution of 500 m. The full list of
ity φ and the grain density ρs (2650 kg m−3 ) according to predictor variables is detailed in Table 1.
ρd = (1 − ϕ) ρs . (2)
4 Methods
In the majority of cases (52.8 %), the OC concentrations re-
ferred to the 0–10 cm depth interval, but other depth intervals 4.1 Framework for spatial prediction and uncertainty
were also present; most frequently 0–1 cm (17.7 %), 0–5 cm estimation
(16.4 %), 0–0.5 cm (6.7 %), and 0–2 cm (4.6 %). It was as-
sumed that the reported values were representative of the up- The same modelling framework was used for predicting sed-
per 10 cm of the sediment column. The full dataset used for imentation rates and OC densities. It is based on the quan-
subsequent modelling is shown in Fig. 2 and provided as Ta- tile regression forest (QRF) algorithm (Meinshausen, 2006)
ble S2. to make spatial predictions of the response variables and to
Biogeosciences, 18, 2139–2160, 2021 https://doi.org/10.5194/bg-18-2139-2021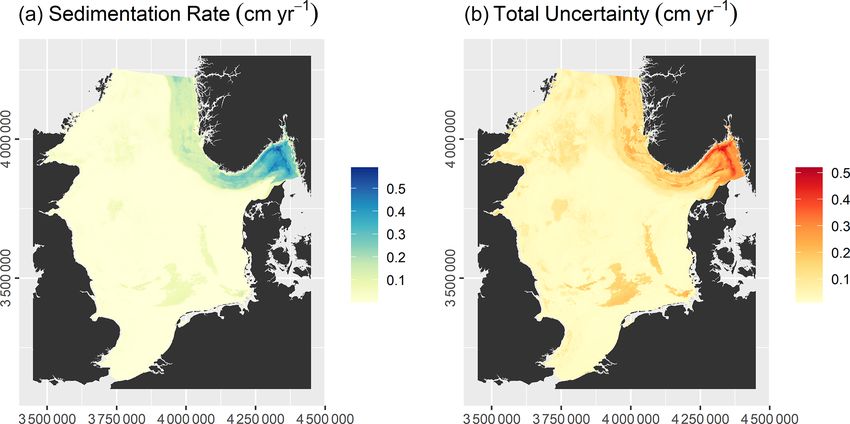
M. Diesing et al.: Organic carbon densities and accumulation rates in surface sediments 2143
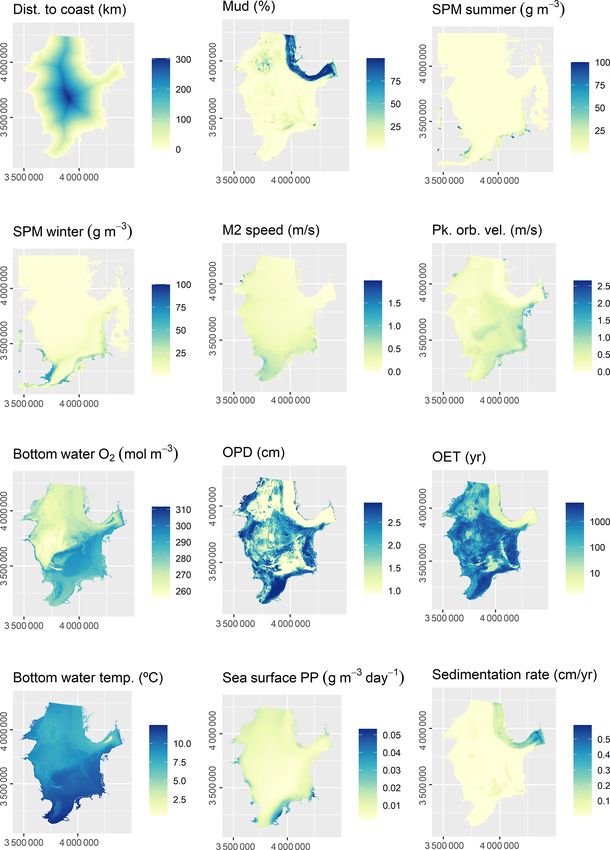
Table 1. Predictor variables used in the sedimentation rate and OC density models.
Predictor variable Unit Model Source
(abbreviation)
Bathymetry (Bathy) m Both EMODnet Bathymetry Consortium (2018),
Mitchell et al. (2019a)
Euclidean distance to shoreline (DistCoast) m Both Calculated
Mud content (Mud) % Both Mitchell et al. (2019a, b)
Sand content (Sand) % Sedimentation Mitchell et al. (2019a, b)
rate
Gravel content (Gravel) % Sedimentation Mitchell et al. (2019a, b)
rate
Folk textural class (Folk) – Sedimentation Mitchell et al. (2019a, b)
rate
Summer suspended particulate matter g m−3 Both Mitchell et al. (2019a, c)
(SPM_summer)
Winter suspended particulate matter g m−3 Both Mitchell et al. (2019a, c)
(SPM_winter)
M2 tidal current speed (M2Speed) m s−1 Both Mitchell et al. (2019a, c)
Peak orbital velocity (PkOrbVel) m s−1 Both Mitchell et al. (2019a, c)
Ratio of tidal boundary layer thickness to water – Sedimentation Williams et al. (2019)
depth (delta_star) rate
Geomorphology (Geomorph) – Sedimentation Derived from Harris et al. (2014)
rate
Sedimentary environment (SedEnv) – Sedimentation Derived from Mitchell et al. (2019a)
rate
Mean bottom water oxygen (O2_mean) mol m−3 OC density http://www.bio-oracle.org/index.php (last access:
17 January 2019), Assis et al. (2018), Tyberghein et
al. (2012)
Oxygen penetration depth (OPD)δ cm OC density Calculated from mud content
(John Barry, personal communication, 2018,
Cefas):
δ = e(1.0745−0.1431· mud) for mud ≤ 8.0 %,
δ = e−0.0706 for mud > 8.0 %
Oxygen exposure time (OET) years OC density Calculated from sedimentation rate and oxygen
penetration depth:
OET = ωδ
Mean bottom water temperature (Temp_mean) ◦C OC density http://www.bio-oracle.org/index.php
Assis et al. (2018), Tyberghein et al. (2012)
Mean sea surface primary production g m−3 d−1 OC density http://www.bio-oracle.org/index.php
(SurfPP_mean) Assis et al. (2018), Tyberghein et al. (2012)
Sedimentation rate (SedRate) cm yr−1 OC density Modelled (this study)
https://doi.org/10.5194/bg-18-2139-2021 Biogeosciences, 18, 2139–2160, 2021
2144                               M. Diesing et al.: Organic carbon densities and accumulation rates in surface sediments

Figure 2. Available samples on sedimentation rate (a) and OC density (b).

estimate the uncertainty in the predictions in a spatially ex-         QRF is based on random forest, we assume that the same
plicit way. QRF is a generalisation of the random forest al-           holds true here. Only limited model tuning was therefore car-
gorithm (Breiman, 2001), which aggregates the conditional              ried out. The number of variables to consider at any given
mean from each tree in a forest to make an ensemble predic-            split (mtry ) was tuned in a grid search using a 10-fold cross-
tion. QRF also returns the whole conditional distribution of           validation scheme with three repeats on the training dataset.
the response variable. This allows us to determine the under-          It is usually sufficient to set the number of trees in the forest
lying variability of an estimate by means of prediction inter-         (ntree ) to a high value; 500 was selected in this case.
vals or the standard deviation.                                           The QRF algorithm provides a means of ranking predictor
   Prediction uncertainty may be divided into four main com-           variables by their importance to prediction accuracy. Variable
ponents: uncertainty in the response data, in the predictor            importance is measured as the mean increase in node purity.
variables, in the model, and in variations of available data           Node purity represents how well the trees in the forest split
(Guevara et al., 2018). It was not possible to address uncer-          the data.
tainty related to the first two components, as information on             The model performance was assessed based on the test
measurement error of the response variables or uncertainty             data of 25 resampling iterations. The root mean square er-
associated with the predictor variables was not available.             ror (RMSE) was calculated according to
However, the modelling framework addresses uncertainty in                     v
the model by calculating the standard deviation of the QRF                    u
                                                                              u1 X n          2
predictions. Furthermore, the sensitivity of the model to vari-        RMSE = t ·     yi − ŷi ,                                    (3)
ations in the available data was estimated by means of re-                      n i=1
sampling. To that end, the response data were repeatedly
(25 times in this case) split into training and test subsets at        whereby n denotes the number of observations, yi represents
a ratio of 7 : 3, and 25 models were subsequently built based          observed values and ŷi represents predicted values. RMSE
on these splits. This resampling scheme is known as Monte              measures how far apart on average predicted values are from
Carlo cross-validation. The sensitivity is derived by calcu-           observed values. It might range from 0 to infinity, with an
lating the standard deviation of the 25 predictions for every          ideal value of 0. It is reported in the same units as the pre-
pixel. The total uncertainty is the sum of the model uncer-            dicted quantity. Additionally, the explained variance (r 2 ) was
tainty and the sensitivity. The methodology was adapted from           calculated from the observed and predicted values.
Guevara et al. (2018).                                                    The analysis was carried out in R 3.6.1 statistical software
   Prior to model building, the predictor variables were sub-          (R Core Team, 2018) and RStudio 1.2.1335. The full work-
mitted to a variable selection process. This was achieved via          flows are documented as R Notebook files (Files S1 and S2
the Boruta variable selection wrapper algorithm (Kursa and             in the Supplement).
Rudnicki, 2010), which identified important predictor vari-
ables. Random forest has been shown to perform well with-              4.2   Calculation of OC stocks
out parameter tuning. Our own experience shows that the
gains made by random forest model tuning are comparatively             The OC stock (mOC ) of surface sediments in the North Sea
small, while at the same time this step might be time con-             and Skagerrak was calculated by summing the predicted OC
suming, especially when tuning an array of parameters. As              densities of all pixels and multiplying with the reference

Biogeosciences, 18, 2139–2160, 2021                                                       https://doi.org/10.5194/bg-18-2139-2021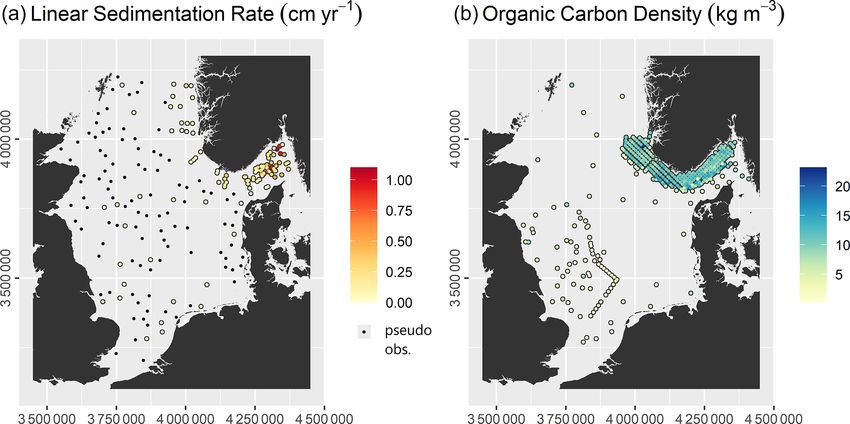
M. Diesing et al.: Organic carbon densities and accumulation rates in surface sediments                                       2145

depth (d = 0.1 m) and the area of a pixel (A = 250 000 m2 ):             The model had an RMSE of 0.13 ± 0.03 cm yr−1 and an
              X                                                       r2 of 0.58 ± 0.09. Predicted sedimentation rates range from
mOC = d · A ·     ρOC .                                  (4)          0 to 0.61 cm yr−1 , while the total uncertainty varies between
                                                                      0.12 and 0.53 cm yr−1 (Fig. 4). Sedimentation rates are high-
The total uncertainty of the predicted OC stock was calcu-            est in the Norwegian Trough. Zero net sedimentation occurs
lated in the same way. OC stocks and uncertainties are re-            in large parts of the North Sea, with slightly elevated sed-
ported in teragrams of carbon (Tg C), where 1 Tg C equals             imentation rates linked to shallow basins such as the inner
1 Mt C or 0.083 Tmol C.                                               German Bight, the Elbe palaeo-valley, the Oyster Ground,
                                                                      the Outer Silver Pit, and Devil’s Hole. The patterns of pre-
4.3    Calculation of OC accumulation rates
                                                                      diction uncertainty follow those of the sedimentation rate.
OC accumulation rates (OCARs in g m−2 yr−1 ) were calcu-
                                                                      5.2   Organic carbon density
lated by multiplying predicted OC densities with predicted
sedimentation rates:                                                  All 13 predictor variables initially selected for model build-
                                                                      ing (Table 1) were deemed important. The five most im-
OCAR = ρOC · ω.                                                (5)
                                                                      portant predictor variables were bathymetry, sedimentation
Uncertainties were propagated by taking the square root of            rate, bottom water temperature, oxygen exposure time, and
the sum of squared relative uncertainties:                            mud content (Fig. 3). The selected predictors are shown in
                                                                      Fig. A3.
                                                                         The model had an RMSE of 2.16 ± 0.25 kg m−3 and an
            s
                δρOC 2
                          2
δOCAR                        δω                                        2
         =               +         ,                   (6)            r of 0.72 ± 0.06. Predicted OC densities range from 1.11
 OCAR            ρOC          ω                                       to 13.59 kg m−3 , while the total uncertainty varies between
whereby δ denotes the uncertainty of a quantity. The full             0.89 and 8.07 kg m−3 (Fig. 5). OC densities are highest in
workflow is documented as an R Notebook file (File S3).               the Norwegian Trough. Intermediate OC densities are found
                                                                      in the northern North Sea and shallow basins, while they are
4.4    Regionalisation                                                lowest on Dogger Bank, in the Southern Bight, and along the
                                                                      Danish coast. Note that uncertainties in parts of the Norwe-
An unsupervised classification was carried out to provide a           gian Trough are comparatively low due to a high sampling
regionalisation of the North Sea environment with regard              density (Fig. 2).
to processing of OC at the seafloor. The following envi-                 The OC stock of surface sediments of the North Sea
ronmental variables were selected: bathymetry, tidal current          and Skagerrak amounts to 230.5 ± 134.5 Tg C, of which
speed, peak orbital velocity, oxygen penetration depth, OC            60.1 ± 18.3 Tg C is stored in the Norwegian Trough. This
density, and OC accumulation rate. These are expected to              means that 25.9 % of the total OC stock is located within the
have a strong impact on OC processing. A k-means cluster-             Norwegian Trough, which accounts for 11 % of the surface
ing was conducted utilising the algorithm of Hartigan and             area.
Wong (1979). Prior to clustering, the input variables were
normalised, and a principal component analysis was carried            5.3   Organic carbon accumulation rates
out to limit co-linearity in the input data. The first four princi-
pal components, accounting for 95.5 % of the variance, were           OCARs vary between 0.02 and 66.18 g m−2 yr−1 , while
selected for further analysis. The selection of the number of         the total uncertainty ranges from 0.20 to 57.90 g m−2 yr−1
clusters to be requested was based on an elbow plot, which            (Fig. 6). OC accumulation rates are effectively zero over
resulted in three clusters. The full workflow is documented           large parts of the North Sea. Marked accumulation of OC
as an R Notebook file (File S4).                                      is restricted to the Norwegian Trough, which accumulates
                                                                      1.24 ± 1.30 Tg C yr−1 . This accounts for nearly 87 % of the
                                                                      total OC accumulation of 1.43 ± 2.07 Tg C yr−1 in the North
5     Results                                                         Sea and Skagerrak.

5.1    Sedimentation rates                                            5.4   Regionalisation

Of the 13 predictor variables initially selected for model            The unsupervised classification resulted in regions that were
building (Table 1), only the Folk textural class was found            distinct regarding bathymetry, hydrodynamics, oxygen pen-
unimportant and hence removed. The five most important                etration, and OC (Fig. 7). Region 2 (green) is characterised
predictor variables were the M2 tidal current velocity, the ra-       by shallow water, strong hydrodynamics, deep oxygen pen-
tio of tidal boundary layer thickness to water depth, the peak        etration, low OC densities, and OC accumulation close to
orbital velocity, sand content, and mud content (Fig. 3). The         zero. Region 3 (dark blue) is characterised by deep water,
selected predictors are shown in Fig. A2.                             weak hydrodynamics, shallow oxygen penetration, high OC

https://doi.org/10.5194/bg-18-2139-2021                                                       Biogeosciences, 18, 2139–2160, 2021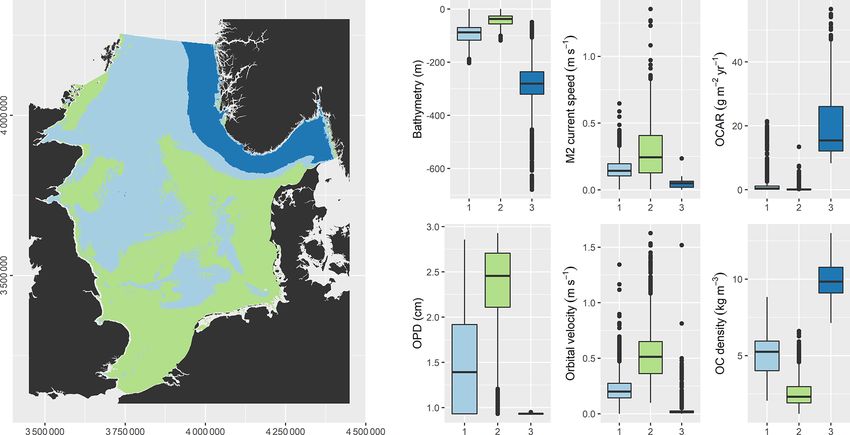
2146                                M. Diesing et al.: Organic carbon densities and accumulation rates in surface sediments

Figure 3. Selected predictor variables and relative variable importance of the sedimentation rate (a) and organic carbon density (b) models.

Figure 4. Predicted sedimentation rate (a) and associated uncertainty in the predictions (b).

densities, and high OC accumulation. Region 1 (light blue)               habitats, and terrestrial soils, which have been highlighted as
has characteristics that lie intermediate between those of re-           significant OC stores. We further discuss zones of OC pro-
gions 2 and 3.                                                           cessing at the seafloor based on our regionalisation, with po-
                                                                         tential implications for marine management and suggestions
                                                                         for future research.
6   Discussion
                                                                         6.1    Relevance
We have presented estimates of OC stocks and accumulation
rates and their associated spatially explicit uncertainties that         The surface sediments of the North Sea and Skagerrak store
were derived with the same modelling framework. Our re-                  230.5 ± 134.5 Tg of OC. This compares with 9.6 to 25.0 Pg C
sults show that a substantial amount of OC, 231 Tg C within              stored globally in bioturbated Holocene shelf sediments (0–
the upper 0.1 m of seabed sediment, is stored in surface sed-            10 cm) as estimated by LaRowe et al. (2020). Hence, sedi-
iments of the North Sea and Skagerrak. OC accumulation is                ments in the North Sea and Skagerrak store approximately
effectively restricted to the Norwegian Trough, which accu-              0.9 %–2.4 % of the global stock in an area that accounts for
mulates 1.2 Tg C annually. In the following we discuss the               ≈ 1.7 % of the global continental shelf.
relevance of our results by comparing them with other esti-                 When comparing uncertainties in OC stock estimates
mates of OC stored in shelf sea sediments, coastal vegetated             with other reported values of spatial predictions at a re-

Biogeosciences, 18, 2139–2160, 2021                                                             https://doi.org/10.5194/bg-18-2139-2021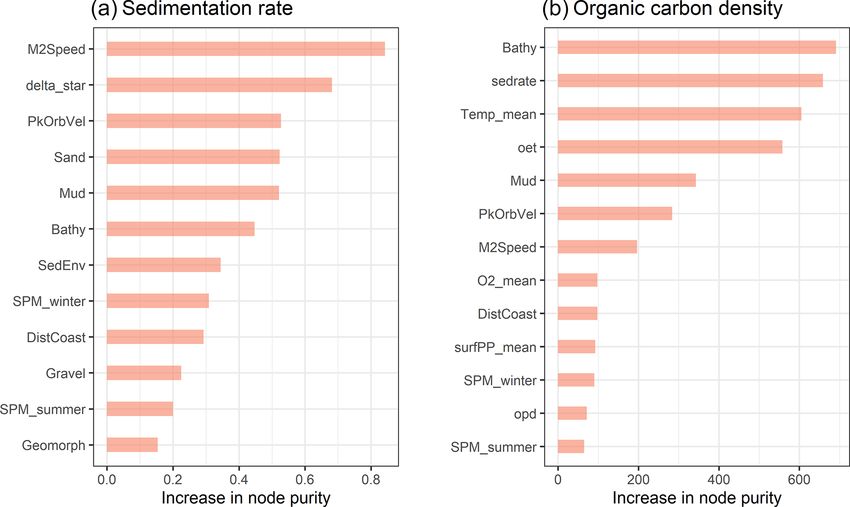
M. Diesing et al.: Organic carbon densities and accumulation rates in surface sediments                                           2147

Figure 5. Predicted OC density (a) and associated uncertainty in the predictions (b).

Figure 6. Calculated OC accumulation rate (a) and associated uncertainty (b).

gional to global scale, we find that our value of 58 % (100 ·            to uncertainty assessment is very robust as it estimates uncer-
134.5 Tg C/230.5 Tg C) is similar to that reported by Lee et             tainty in the model and in variations of available data.
al. (2019), amounting to 49 %, while other studies did not                  Previous estimates of OC stocks in the upper 10 cm of
report any estimates of uncertainty (Diesing et al., 2017;               the sediment column of the north-west European continen-
LaRowe et al., 2020). Lower uncertainties have been reported             tal shelf amount to 230–882 Tg C (Diesing et al., 2017). The
from local studies (e.g. Hunt et al., 2020), presumably due              estimated stock of 230.5 ± 134.5 Tg C contained in the up-
to a tighter coupling between response and predictor vari-               per 10 cm of the sediments of the North Sea and Skager-
able. An intrinsic assumption of modelling approaches such               rak, which account for approximately 50 % of the area of
as the one presented here is that the measured response vari-            the north-west European continental shelf, falls well within
able is representative at the scale of the pixel size of pre-            this estimate. Of this stock, approximately 60 Tg C or 26 %
dictor variables. The likelihood for this being true increases           is stored within the Norwegian Trough, indicating the impor-
when the pixel size approaches the size of the seabed area               tance of this glacial feature as a store of OC.
that was sampled with a grab or corer. Higher-resolution pre-               To gauge the importance of North Sea shelf sediments as
dictor variables, as frequently used in local studies, might             an OC store, we compare them with coastal habitats and
therefore have lower uncertainties associated with the pre-              terrestrial soils as follows: coastal vegetated habitats (salt
dictions. It should also be considered that the ways in which            marsh, seagrass, kelp, and tidal flat) are known to bury
uncertainty is estimated and reported vary, thereby limiting             large amounts of carbon despite occupying only 0.2 % of
the scope of such comparisons. We believe that our approach              the global ocean surface (Duarte et al., 2005, 2013). Coastal
                                                                         habitats on the north-west European continental shelf store

https://doi.org/10.5194/bg-18-2139-2021                                                         Biogeosciences, 18, 2139–2160, 2021
2148 M. Diesing et al.: Organic carbon densities and accumulation rates in surface sediments
Figure 7. Regionalisation of the North Sea and Skagerrak: region 1 (light blue) – transition zone; region 2 (green) – turnover zone; and
region 3 (dark blue) – burial zone. Note that boxplots are based on 10 000 randomly placed points rather than all pixels.
between 8.3 and 40.8 Tg C in the upper 10 cm in an area concentrations (Smeaton and Austin, 2019) and hence also
of 20 900–35 000 km2 (Legge et al., 2020), equating to OC OC accumulation. Judging from published sediment maps
densities between 24 and 195 kg m−3 . This indicates that (e.g. Elvenes et al., 2019), the same applies to fjords in Nor-
shelf sediment stocks (230.5 Tg C) are approximately an or- way. Conversely, the Norwegian Trough is characterised by
der of magnitude larger despite lower OC densities of 1.1 to fine-grained sediments (Mitchell et al., 2019a), and OC ac-
13.6 kg m−3 . cumulation occurs throughout the geomorphological struc-
Soils are the largest carbon store on land; globally they ture. Additionally, the area of the Norwegian Trough is much
are estimated to hold 1325 Pg C in the upper 1 m (Köchy larger than even the largest fjords in Norway, highlighting its
et al., 2015). Topsoil (0–10 cm) OC stocks based on Soil- relevance as the most important place of OC accumulation in
Grids250m (Hengl et al., 2017) of the countries bordering the North Sea and Skagerrak.
on the North Sea and Skagerrak are shown in Table 2. Note Collectively, the sediments of the Norwegian Trough
that topsoil OC stocks refer to the entire area of the re- accumulate 1.24 Tg C yr−1 over an area of approximately
spective country, while marine OC stocks refer to the pro- 62 000 km2 , but the uncertainty in this estimate is on the same
portion of the Exclusive Economic Zone (EEZ) that falls order of magnitude as the estimate. Nevertheless, this esti-
within our study area. While marine sediment OC stocks are mate is in good agreement with an earlier published value
generally lower than their soil counterparts, marine stocks of 1 Tg C yr−1 (de Haas and van Weering, 1997). For com-
are not negligible in several countries. These additional OC parison, 3.53 ± 2.90 Tg C yr−1 is accumulated in the muddy
stocks amount to 7.5 %, 7.1 %, and 6.6 % of topsoil stocks in basins of the Baltic Sea (area: 164 800 km2 ) (Leipe et al.,
Denmark, the Netherlands, and the United Kingdom, respec- 2011). Coastal habitats (salt marsh, seagrass, kelp, and tidal
tively. Furthermore, some countries have EEZs considerably flat) on the north-west European continental shelf have been
larger than their share of the North Sea and Skagerrak consid- estimated to accumulate 0.2–0.7 Tg C yr−1 (Legge et al.,
ered here. Hence, there is potential for an even larger marine 2020).
OC stock.
The accumulation of OC is effectively limited to the Nor- 6.2 Zones of organic carbon processing at the seafloor
wegian Trough, with the highest rates found in the Skager-
rak. Predicted OCARs vary between approximately 4 and The regionalisation based on selected characteristic parame-
66 g m−2 yr−1 in the Norwegian Trough, with a mean OCAR ters pertaining to OC accumulation and storage (Fig. 7) has
of 19.4 g m−2 yr−1 . Reported OCARs measured in fjord sed- shown that the North Sea and Skagerrak can be divided into
iments in Norway and Sweden bordering on the North Sea distinct zones. The results indicate that shelf sediments can
range from 12 to 54 g m−2 yr−1 (Huguet et al., 2007; Müller, act in distinctly different ways in the context of OC process-
2001; Nordberg et al., 2001, 2009; Skei, 1983; Smittenberg ing at the seafloor. In a way, they also reflect the scientific dis-
et al., 2004, 2005; Velinsky and Fogel, 1999), indicating that course over the last half century or so: initially, process stud-
OCARs in the Norwegian Trough are of a comparable mag- ies on OC cycling on the continental shelf (e.g. Balzer, 1984;
nitude. However, fjords in Scotland and Ireland have been Jørgensen, 1977; Martens and Val Klump, 1984) focussed
shown to be heterogeneous in sediment distribution and OC on fine-grained sediments associated with hydrodynamically
quiet environments, relatively constant sediment accumula-
Biogeosciences, 18, 2139–2160, 2021 https://doi.org/10.5194/bg-18-2139-2021M. Diesing et al.: Organic carbon densities and accumulation rates in surface sediments 2149
Table 2. Breakdown of topsoil (0–10 cm) OC stocks by country (Hengl et al., 2017) compared with marine sediment OC stocks. Topsoil
OC stocks refer to the entire area of the respective country bordering on the North Sea and Skagerrak, while marine OC stocks refer to the
proportion of the EEZ that falls within our study area.
Country Soil OC Marine sediment OC Marine sediment OC, Mapped area,
(0–10 cm), Tg C (0–10 cm), Tg C % of soil OC % of total EEZ
Belgium 109.3 0.7 0.7 95.3
Denmark 236.6 17.8 7.5 55.1
France 2026.1 0.4 0.0 0.5
Germany 1808.9 8.8 0.5 64.4
the Netherlands 198.0 14.1 7.1 91.5
Norway 2253.6 83.9 3.7 13.7
Sweden 3333.2 5.0 0.1 3.7
United Kingdom 1572.3 103.1 6.6 32.7
tion, and diffusion-dominated porewater transport. This has processing might equate to the turnover zone of Huettel and
led to the notion of rapidly accumulating coastal sediments Rusch (2000).
associated with high sedimentation, high OC burial rates, and Conversely, the seabed of the Norwegian Trough is char-
low oxygen penetration depths (Aller, 2014; Canfield, 1994; acterised by water depths in excess of 200 m and experi-
Middelburg, 2019; Middelburg et al., 1997). ences very subdued wave and current agitation. Fluid trans-
However, approximately 50 % (Hall, 2002) to 70 % port in the sediment is therefore driven by molecular diffu-
(Emery, 1968) of the global continental shelf consists of sion, mediated by bioturbation. Bioturbation contributes to
coarse-grained sediments (gravel and sand) with high perme- a balance in the sedimentary OC budget by transporting la-
abilities. Unidirectional and wave orbital water flows inter- bile OC to deeper horizons where degradation efficiency is
acting with microscale topography (e.g. ripples and biogenic lower (Zhang et al., 2019). The lack of advective oxidation
mounds) at the water–sediment interface lead to increased (Huettel et al., 2014; Huettel and Rusch, 2000) translates into
fluid exchange rates compared to exchange by molecular dif- slower OC degradation. Fine-grained sediments provide min-
fusion (Huettel et al., 1996; Precht and Huettel, 2003). Inter- eral protection (Hedges and Keil, 1995; Hemingway et al.,
action of flows with surface microtopography increases oxy- 2019; Keil and Hedges, 1993; Mayer, 1994), which also pro-
gen penetration depths (Huettel and Rusch, 2000). As a con- motes OC preservation. Short oxygen exposure times (Hart-
sequence of advective porewater flows, permeable sediments nett et al., 1998) due to shallow oxygen penetration depths
may act as biocatalytic filters, notable for their high reac- and relatively high sedimentation rates limit the time for aer-
tion rates, intense recycling, and extreme spatial and tem- obic mineralisation. Collectively, this leads to high OC den-
poral dynamics of biogeochemical processes (Huettel et al., sities and accumulation rates. This zone might be termed a
2003, 2014). burial zone according to Huettel and Rusch (2000). However,
The seafloor in the Southern Bight, Dogger Bank, and for consistency with our analysis we term this zone an accu-
Fisher Bank, as well as in the proximity of west-facing coast- mulation zone.
lines (apart from the Norwegian west coast), is characterised De Haas and van Weering (1997) estimated that only 10 %
by shallow water depths, high tidal current speeds, and high of the OC deposited in the Norwegian Trough is derived from
wave orbital velocities. The probability that the seabed gets local primary production and that the remainder originates
disturbed by waves and currents to a depth of 3 cm at least from other sources. A large part of this allochthonous OC
once a year is above 50 % in these areas (Aldridge et al., is transported into the Norwegian Trough along the Dutch,
2015: Fig. 17a). It can therefore be assumed that ripples are German, and Danish coasts by an anticlockwise residual cir-
present in these areas at least temporarily and that the in- culation (de Haas et al., 2002). This transport is thought to
teraction of unidirectional and oscillatory currents with these be intermittent, with the rate of transport dependent on the
roughness elements leads to enhanced fluid exchange, as sed- strength of wind-induced waves and currents (de Haas and
iments are sufficiently permeable. The advective supply of van Weering, 1997). The OC being deposited in the Norwe-
oxygen to the sedimentary microbial community facilitates gian Trough is mostly refractory, as it has undergone several
the effective degradation of OC (Huettel et al., 2014). Conse- erosion–transport–deposition cycles prior to final deposition
quently, oxygen penetrates deep into these sediments and OC (de Haas et al., 2002).
density is low. The potential for longer-term accumulation of A third zone is situated in the northern North Sea and the
OC is very low, as these environments are characterised by shallow depositional areas of the southern North Sea. It has a
repeated erosion–redeposition cycles. This zone of rapid OC transitional character with water depths, current speeds, wave
orbital velocities, and oxygen penetration depths intermedi-
https://doi.org/10.5194/bg-18-2139-2021 Biogeosciences, 18, 2139–2160, 20212150 M. Diesing et al.: Organic carbon densities and accumulation rates in surface sediments
ate between those of the turnover and the burial zones. OC ment in OC in the long term (Martín et al., 2014a). Pro-
densities are also intermediate, while OC accumulation is tecting regional hotspots of OC accumulation from fishing-
negligible in this transitional zone. induced disturbance might therefore be a suitable measure
to increase the climate mitigation potential of the seabed.
6.3 Implications for management Likely sites that might benefit from protection are to be found
in the accumulation zone (i.e. the Norwegian Trough), while
We have shown that seabed sediments of the North Sea and it is unlikely that the turnover zone yields any potential areas
Skagerrak are an important store of OC. Furthermore, the worth protecting in this context. Our results could be used
Norwegian Trough is an important centre of OC accumula- jointly with maps showing the footprint of demersal fishing
tion, with rates comparable with neighbouring fjords. Based (Eigaard et al., 2016) and other resources to identify poten-
on those results it was possible to identify zones of rapid OC tial sites for the establishment of “carbon protection zones”.
turnover and zones of OC accumulation. These zones have Such management measures that limit the impacted surface
different roles in terms of OC processing and storage and area, allowing carbon stocks and faunal communities in the
hence will have different relevance in the context of manag- sediment to recover from a disturbance and resulting in the
ing OC stores at the seabed. recovery of carbon accumulation, might be preferable over
Marine sediment OC stocks are presently not considered in technical modifications that reduce the penetration depth of
the context of national carbon inventories for greenhouse gas fishing gear (De Borger et al., 2020). Recent research also
reporting. The question has been raised about whether those highlights that temporal closures of fishing grounds might
stocks should be considered part of national carbon account- not be sufficient to restore the seafloor (Paradis et al., 2020).
ing (Avelar et al., 2017). It is becoming clearer that marine It must also be considered that the OC stocks, as mapped
sediments store sizeable amounts of OC (Diesing et al., 2017; in this study, likely have been affected already by decades
Lee et al., 2019; Luisetti et al., 2019), which might be vulner- of demersal fishing. Our maps therefore do not represent a
able to human activities such as demersal fishing (Paradis et baseline in a sense of an undisturbed state.
al., 2020). Likewise, there exist hotspots of OC accumulation Additionally, more research on the reactivity of OC is re-
(Bianchi et al., 2018) like the Norwegian Trough, as demon- quired to better understand the relationships between OC
strated here. A further exploration as to how management mineralisation and seabed disturbance. The mineralisation
of marine sediment OC could contribute towards national of predominantly refractory OC caused by demersal fishing
greenhouse gas emission reduction targets might therefore might be limited or even negligible. In the Skagerrak, oxy-
be prudent; however, this requires new accounting guidance gen micro-profile measurements indicated that mineralisa-
and governance frameworks (Luisetti et al., 2020). The as- tion rates were independent of OC content but related to the
sessment of the OC stock size should be coupled with an as- input of fresh OC by primary production (Bakker and Helder,
sessment of the anthropogenic impacts on that stock (Avelar 1993). This suggests that preferentially fresh labile OC was
et al., 2017). When assessed in the context of naturally occur- mineralised, while allochthonous OC that accounts for 90 %
ring disturbance (e.g. by currents and waves), this will con- of the OC in the Norwegian Trough (de Haas and van Weer-
tribute towards a more complete picture of the vulnerability ing, 1997) might be largely unreactive. Conversely, van de
of marine sediment OC stocks to remineralisation and poten- Velde et al. (2018) suggested that OC mineralisation is stim-
tial release of CO2 to the atmosphere (Atwood et al., 2020). ulated after sediment disturbance, likely due to the enhanced
We provide spatially explicit information on stock sizes and decomposition of previously buried refractory OC when it
the uncertainty in the estimates, which could be utilised in comes into contact with labile OC, a process known as prim-
such vulnerability assessments. ing (Steen et al., 2016). Another question of interest is to
While the importance of Blue Carbon ecosystems for OC what extent a potential reduction in mineralisation rates due
drawdown has been highlighted in the past (Duarte et al., to areal protection of OC stocks might influence primary pro-
2005; Mcleod et al., 2011; Nellemann et al., 2009), the an- duction and thus supply of OC to the seabed.
nual rate of OC accumulation by coastal vegetated habitats
(Legge et al., 2020) is less than that of seafloor sediments at 6.4 Suggestions for future research
a sea-basin scale. It might therefore be prudent to further ex-
plore the idea of MPAs as a tool to mitigate climate change We have utilised a modelling scheme that allowed us to esti-
by protecting and enhancing marine sedimentary OC stores mate the uncertainty in the model and in variations of avail-
(Roberts et al., 2017), especially as the climate mitigation able data. However, this robust methodology led to relatively
potential of marine natural climate solutions (Griscom et al., high uncertainties in the predictions. We assume that the
2017) has so far been overlooked. most likely reason for this is the nature of the available sam-
Although more research is needed, it is becoming clearer ple datasets. As we utilised archived samples collected over
now that seabed disturbance by demersal fishing leads to in- many years by different organisations for various purposes,
creased OC mineralisation in cohesive sediments in the short this has led to a somewhat heterogeneous dataset with bi-
term (van de Velde et al., 2018) and a general impoverish- ases regarding coverage of the temporal, geographical, and
Biogeosciences, 18, 2139–2160, 2021 https://doi.org/10.5194/bg-18-2139-2021M. Diesing et al.: Organic carbon densities and accumulation rates in surface sediments 2151
environmental (i.e. predictor variable) space. While we be- Finally, it would be desirable to complement OC data
lieve that making best use of existing data is important and with measurements on C/N ratios and δ 13 C to estimate
yields worthwhile insights, this study also highlights the lim- the marine versus terrigenous fraction of OC (e.g. Faust
itations of such an approach. Consequently, there is a need and Knies, 2019). A quantification of the autochthonous
for the collection and analysis of new samples on OC con- and allochthonous OC contributions could be achieved
tent, dry bulk density, sedimentation rates, and ancillary pa- with a two-endmember mixing model (Thornton and Mc-
rameters (e.g. grain size). Sampling design might be guided Manus, 1994). Knowledge of the sources of OC is required
by the uncertainty maps provided here. The information gain for a better understanding of OC sequestration in shelf
that additional data could give is expected to be highest in sediments but would also be a basic requirement in the
areas of high predictive uncertainty. Reducing uncertainty in context of carbon offset credits (Macreadie et al., 2019),
predictions might have large economic benefits, as has re- should such a system be extended to include shelf sedi-
cently been demonstrated for the biological carbon pump (Jin ments. For example, the Verified Carbon Standard VM0033
et al., 2020). These authors developed an analytical model (https://verra.org/methodology/vm0033-methodology-for-
of the economic effects of global carbon emissions includ- tidal-wetland-and-seagrass-restoration-v1-0/, last access:
ing uncertainty about biological carbon pump sequestration 22 March 2021), the first voluntary market methodology
and estimated that the benefit to narrow the range of uncer- for blue carbon ecosystems, stipulates that offset credits
tainty about ocean carbon sequestration is on the order of are not allocated under the framework for allochthonous
USD 0.5 trillion. It may be assumed that sizeable economic OC because of the risk of duplicating C sequestration gains
benefits could also be achieved by reducing the uncertainty that may have been accounted for in adjacent ecosystems
in the predictions of seafloor OC stocks and accumulation (Macreadie et al., 2019).
rates.
Alternatively, if the goal were to create a new baseline
dataset covering the whole North Sea and Skagerrak, this 7 Conclusions
might be best achieved by sampling the environmental vari-
This work highlights distinct zones of OC processing at the
able space in a representative way. The relative importance
seafloor of the North Sea and Skagerrak. While rapid OC
of environmental variables on the distribution of OC is rela-
processing and turnover are commonplace in the southern
tively well known both based on general knowledge and the
and eastern parts of the North Sea, the Norwegian Trough
results of this and other modelling studies. Several methods
stands out as a hotspot of OC accumulation with rates com-
for optimising sampling design exist, including generalised
parable with nearby fjords. We expect that this dual charac-
random tessellation stratified sampling (Stevens and Olsen,
ter of the continental shelf in terms of OC processing and
2003) and conditioned Latin hypercube sampling (Minasny
storage can be found across the global continental shelf, re-
and McBratney, 2006), among others. These could be utilised
quiring further detailed and spatially explicit analyses to con-
to effectively sample seafloor sediments, thereby minimising
strain sedimentary OC stocks and accumulation rates glob-
sampling effort and prediction uncertainty at the same time.
ally. Such estimates are urgently needed to better understand
Finally, future process studies might compare results from
the potential of shelf sediments as a natural climate solution,
different zones of OC processing as shown in Fig. 7.
e.g. by protecting suitable areas against human disturbance.
Further gains could be achieved by the standardisation of
the collection of OC measurements. This includes sampling
methods, the measured sediment fraction, defined depth hori-
zons, and the reporting of results, among others. Such a stan-
dardisation would increase the comparability of the collected
data and could be modelled on the experience of the global
soil mapping community (Hengl et al., 2014). Although fa-
cilities to store and retrieve quality-controlled seafloor data
centrally exist (e.g. EMODnet, ICES), it would still be ad-
vantageous to establish global data archives that are more
specific to marine sedimentary carbon such as MOSAIC (van
der Voort et al., 2020).
https://doi.org/10.5194/bg-18-2139-2021 Biogeosciences, 18, 2139–2160, 2021You can also read


