April 2019 - Organized Crime and Violence in Mexico - Laura Y. Calderón, Kimberly Heinle, Octavio Rodríguez Ferreira, and David A. Shirk - Justice ...
←
→
Page content transcription
If your browser does not render page correctly, please read the page content below
Analysis Through 2018                  Organized Crime
                                           and Violence
                                              in Mexico

                         Laura Y. Calderón, Kimberly Heinle,
                         Octavio Rodríguez Ferreira, and David A. Shirk

                        Justice in Mexico
                        Department of Political Science & International Relations
                        University of San Diego

                                                               April 2019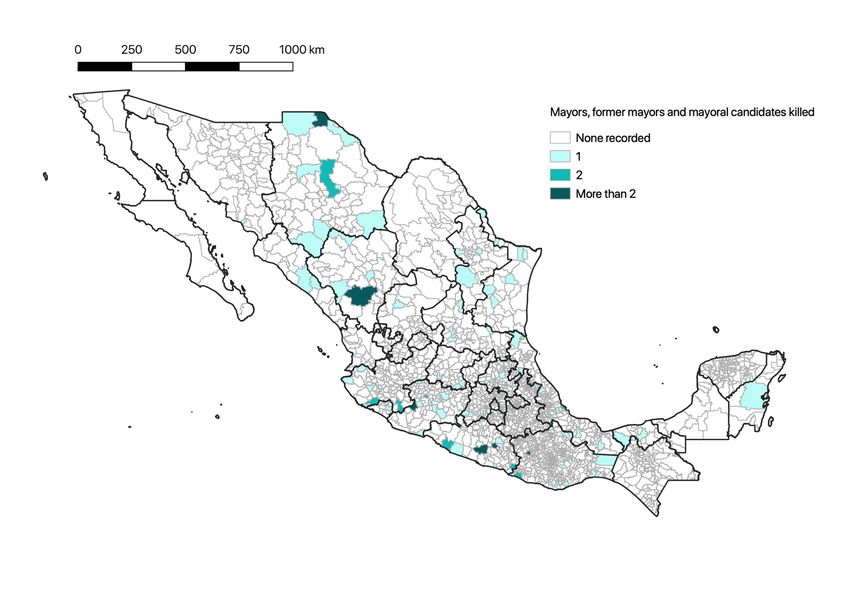
About Justice in Mexico:
Started in 2001, Justice in Mexico (www.justiceinmexico.org) works to improve citizen security, strengthen the
rule of law, and protect human rights in Mexico. We generate cutting edge research, promote informed dialogue,
and work to find solutions to address these enormously complex issues. As a U.S.-based initiative, our program
partners with key stakeholders, experts, and decision makers, lending international support to help analyze the
challenges at hand, build consensus about how to resolve them, and foster policies and programs that can bring
about change. Our program is presently based at the Department of Political Science and International Relations at
the University of San Diego (USD), and involves university faculty, students, and volunteers from the United States
and Mexico. From 2005-2013, the project was based at the USD Trans-Border Institute at the Joan B. Kroc School
of Peace Studies, and from 2001-2005 it was based at the Center for U.S.-Mexican Studies at the University of
California-San Diego.

About the Report:
This is 10th edition of a series of reports published by Justice in Mexico examining issues related to crime and
violence, judicial sector reform, and human rights in Mexico. Since 2010, the Drug Violence in Mexico report
series examined patterns of crime and violence attributable to organized crime, and particularly drug trafficking
organizations. In commemoration of the 10th year anniversary, the authors have changed the series’ name to
“Organized Crime and Violence in Mexico” to reflect the diversification of organized crime over the last decade.
This report was authored by Laura Y. Calderón, Kimberly Heinle, Octavio Rodríguez Ferreira, and David A. Shirk,
and builds on the work of past Drug Violence in Mexico reports. This publication does not represent the views or
opinions of the University of San Diego or Justice in Mexico’s sponsoring organizations

© Copyright Justice in Mexico, April 2019.

ISBN-10: 0-9988199-1-3
ISBN-13: 978-0-9988199-1-4

Justice in Mexico
Department of Political Science & International Relations
University of San Diego
5998 Alcalá Park
San Diego, CA 92110
Organized Crime
       and Violence
           in Mexico
                            Analysis Through 2018

                           Laura Y. Calderón,
                              Kimberly Heinle,
                   Octavio Rodríguez Ferreira,
                            and David A. Shirk

Justice in Mexico
Department of Political Science & International Relations
University of San Diego

                                 April 2019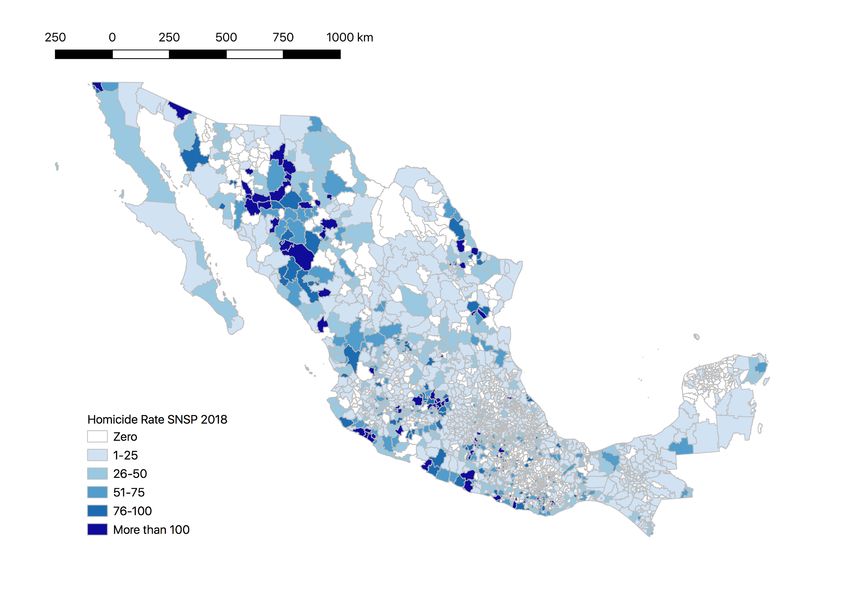
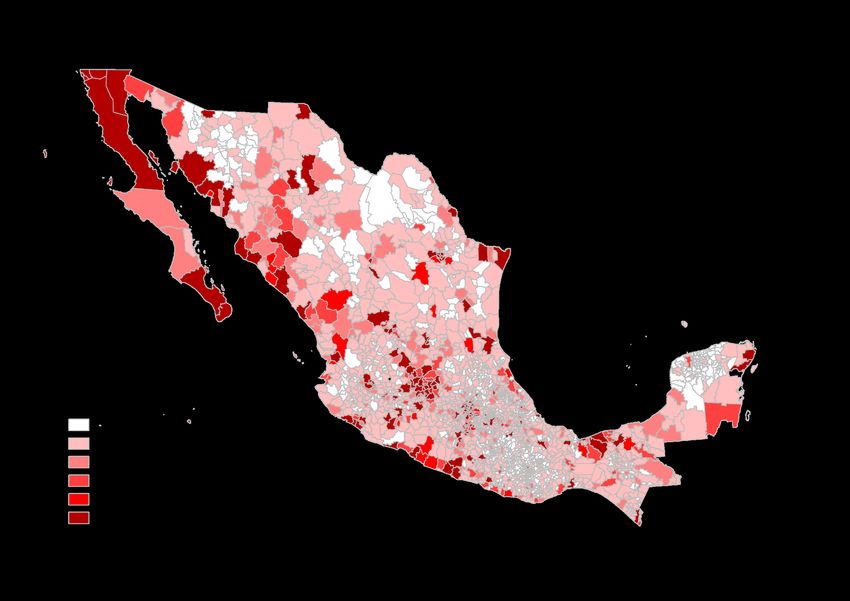
TABLE OF CONTENTS

LIST OF ACRONYMS.................................................................................................................................................... 1
EXECUTIVE SUMMARY ............................................................................................................................................... 3
I. INTRODUCTION ..................................................................................................................................................... 7
II. UNDERSTANDING MEXICO’S RECENT VIOLENCE ................................................................................ 8
III. FINDINGS: ORGANIZED CRIME AND VIOLENCE IN MEXICO .....................................................11
    A. Record Levels of Homicide Continue in 2018 .............................................................................................................. 11
    B. Organized-Crime-Style Killings Constitute Major Share of Homicides in 2018 ............................................... 14
    C. Shifting Geographic Patterns of Violence....................................................................................................................... 17
        1. Geographic Dispersion Decreases in 2018 ....................................................................................................................................... 17
        2. Significant Increases in State and Local Centers of Violence....................................................................................................... 22
        3. Distribution of Organized-Crime-Style Homicides ........................................................................................................................ 27
    D. Special Victims: Gender, Politics, and the Press ........................................................................................................... 29
        1. Males ................................................................................................................................................................................................................. 30
        2. Mayors.............................................................................................................................................................................................................. 31
        3. Journalists ........................................................................................................................................................................................................ 34
    E. Comparing Presidential Administrations .......................................................................................................................... 38
IV. ANALYZING RECENT DEVELOPMENTS IN 2018 .................................................................................39
    A. The Shifting Landscape of Organized Crime .................................................................................................................. 40
    B. The Trial of “El Chapo” Guzmán........................................................................................................................................ 41
    C. Changing of the Guard: A New President Takes Office............................................................................................ 43
    D. Addressing the Socio-Economic Roots of Violent Crime......................................................................................... 45
    E. Re-Inventing the Federal Prosecutor’s Office................................................................................................................. 46
    F. Debating the Military’s Role in Internal Affairs ............................................................................................................... 48
        1. Internal Security Law .................................................................................................................................................................................. 49
        2. The National Guard.................................................................................................................................................................................... 50
    G. Changing U.S.-Mexico Security Relations ....................................................................................................................... 52
        1. Border Security ............................................................................................................................................................................................ 52
        2. NAFTA and the USMCA.......................................................................................................................................................................... 52
        3. Mérida Initiative Cooperation ................................................................................................................................................................. 53
V. CONCLUDING OBSERVATIONS & RECOMMENDATIONS ..............................................................53
    A. Better Monitoring and Analysis of Mexico’s Rule of Law Challenges ................................................................... 54
    B. Enhancing Mexican Policing and Prosecutions ............................................................................................................... 54
    C. Special Measures to Address Political Violence ............................................................................................................ 54
    D. Reinvigorating Mexico’s Anti-Corruption Efforts ........................................................................................................ 55
IV. APPENDIX: DEFINITIONS, DATA, AND METHODOLOGIES ...........................................................56
    A. Defining the Problem.............................................................................................................................................................. 56
    B. The Available Data Sources and Their Limitations....................................................................................................... 57
    C. Government Data on Homicide ........................................................................................................................................ 58
    D. Organized Crime-Style Homicides.................................................................................................................................... 59
    E. Analytical and Methodological Concerns ......................................................................................................................... 61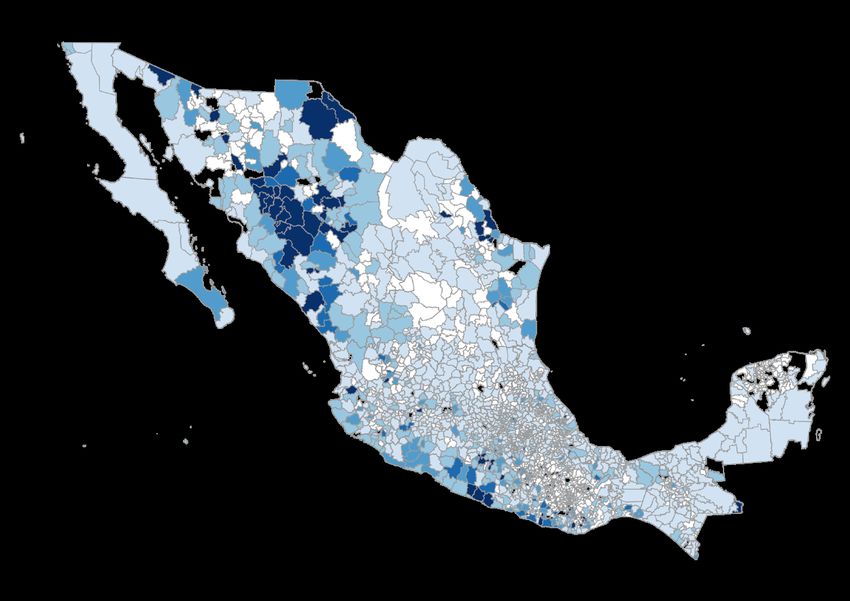

LIST OF ACRONYMS

AFO         Arellano Felix Organization, an organized crime group from Tijuana
AK-type     Avtomat Kalashnikova, assault rifle used by organized crime groups, e.g., AK-
            47
AMLO        Andres Manuel López Obrador
AR-type     Assault rifle typically used by organized crime groups, e.g., AR-15
BC Sur      Baja California Sur, a state in western Mexico
BLO         Beltran Leyva Organization, an organized crime group
CDG         Cartel del Golfo (Gulf Cartel), an organized crime group
CENAPI      Centro Nacional de Planeación, Análisis e Información Para el Combate a la
            Delincuencia (Mexican National Center for Planning, Analysis and Information
            for Combating Crime)
CIDA        Cartel Independiente de Acapulco (Independent Cartel of Acapulco), an
            organized crime group
CIDE        Centro de Investigación y Docencia Económicas, a Mexican center for
            teaching and research in the Social Sciences
CISEN       Centro de Investigación y Seguridad Nacional (Mexican Intelligence Agency)
CJNG        Cartel de Jalisco Nueva Generación (Jalisco New Generation Cartel), an
            organized crime group
CNDH        Comisión Nacional de los Derechos Humanos (National Human Rights
            Commission)
CONAPO      Consejo Nacional de Población (National Population Council), a national
            agency for population estimates
CPJ         Committee to Protect Journalists
CPS         Cartel del Pacífico Sur (South Pacific Cartel), an organized crime group
CSN         Consejo de Seguridad Nacional (National Security Council)
CSRL        Cartel Santa Rosa de Lima (Santa Rosa de Lima Cartel, CSRL), an organized
            crime group
DEA         Drug Enforcement Agency, an agency within the U.S. Department of Justice
DTO         Drug trafficking organization
ENVIPE      Encuesta Nacional de Victimización y Percepción sobre Seguridad Pública
            (National Victimization and Public Security Perception Survey)
Edomex      Estado de México, a state in central Mexico
FAM         Fuerza Aeréa Mexicana (Mexican Air Force), an aerial unit of SEDENA, the
            Mexican army
FBI         Federal Bureau of Investigation, an agency within the U.S. Department of
            Justice
INEGI       Instituto Nacional de Estadística, Geografía, e Informática (National Institute of
            Statistics, Geography, and Information)
KTO         Knights Templar Organization, an organized crime group based in Michoacán
LFM         La Familia Michoacana, an organized crime group
LSI         Ley de Seguridad Interior (Internal Security Law), passed in 2017 to regulate
            military intervention in domestic security matters.
MC          Movimiento Ciudadano (Citizen’s Movement), political party previously known
            as Convergencia por la Democracia

                                          1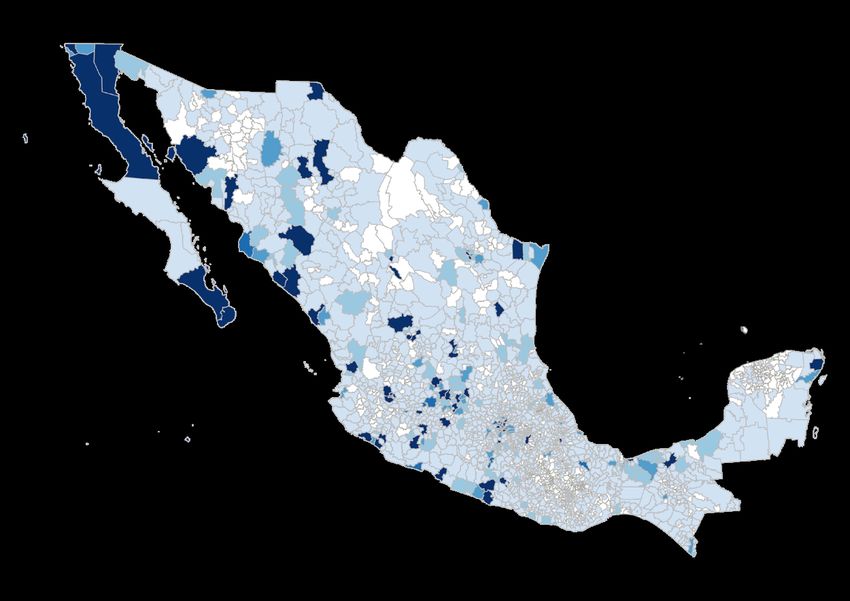
OCG      Organized crime group
MORENA   Movimiento Regeneración Nacional (National Regeneration Movement),
         Mexican political party
PAN      Partido Acción Nacional (National Action Party), Mexican political party
PES      Social Encounter Party (Partido Encuentro Social), Mexican political party
PGR      Procuraduría General de la República (Attorney General's Office)
PRD      Partido de la Revolución Democrática (Democratic Revolution Party), Mexican
         political party
PRI      Partido Revolucionario Institucional (Institutional Revolutionary Party),
         Mexican political party
PT       Partido de Trabajo (Work Party), Mexican political party
SCJN     Suprema Corte de Justicia Nacional (National Supreme Court of Justice),
         Mexico’s Supreme Court
SEIDO    Subprocuraduría Especializada en Investigación de Delincuencia Organizada,
         Mexico’s Specialized Assistant Attorney General for Investigation of Organized
         Crime (2003-2012)
SIEDO    Subprocuraduría de Investigación Especializada en Delincuencia Organizada,
         Mexico’s Assistant Attorney General for Special Investigation of Organized
         Crime (2012-present)
SEDENA   Secretaría de la Defensa Nacional (Mexican Secretary of Defense, Army and
         Air Force)
SEGOB    Secretaría de Gobernación (Mexican Interior Ministry)
SEMAR    Secretaría de Marina (Mexican Secretary of the Navy)
SNSP     Sistema Nacional de Seguridad Pública (Mexican National Security System)
SSP      Secretaria de Seguridad Publica (Public Security Ministry)
UNODC    United Nations Office on Drugs and Crime
U.S.     United States
USA      United States of America

                                      2
EXECUTIVE SUMMARY

•   This report examines trends in organized crime and violence in Mexico through
    2018. For the past ten years, the Justice in Mexico program has compiled the latest
    available data and analysis of trends to help better understand the facets, implications,
    and possible remedies to the ongoing crisis of violent crime, corruption, and human
    rights violations in Mexico, with special attention to the fallout of the War on Drugs.
    This tenth report is published under a new title—Organized Crime and Violence in
    Mexico—in acknowledgement of the gradual shift that has occurred over several years
    with the restructuring of the illicit drug trade and the proliferation of new forms of
    organized crime. Several factors contributing to this shift have been documented in
    past reports, including the fragmentation of Mexican criminal organizations, the
    decriminalization and legalization of certain psychotropic substances (most notably
    marijuana), and the diversification of criminal enterprises in search of new sources of
    illicit revenue. Accordingly, this report offers a broad assessment of the factors
    contributing to Mexico’s ongoing problems with organized crime and violence.

•   Mexico experienced large increases in the level of violent crime for more than a
    decade. The number of intentional homicides documented by Mexico’s National
    Institute of Statistics, Geography, and Information (INEGI) declined significantly under
    both presidents Ernesto Zedillo (1994-2000) and Vicente Fox (2000-2006), but rose
    dramatically after 2007, the first year in office for President Felipe Calderón (2006-
    2012). All told, throughout the Calderón administration, INEGI reported 121,669
    homicides, an average of over 20,000 people per year, more than 55 people per day,
    or just over two people every hour. Over that period, no other country in the Western
    Hemisphere had seen such a large increase either in its homicide rate or in the
    absolute number of homicides.

•   Mexico’s national homicide rate per 100,000 people has increased significantly since
    2015. Based on CONAPO population figures, the authors estimate that rising violence
    increased Mexico’s homicide rate to around 25.7 per 100,000 in 2017, the latest year
    for which data is available from INEGI. Based on recent SNSP figures, the national
    homicide rate increased again to 27.3 per 100,000 in 2018, and INEGI figures released
    in late 2019 are likely to reflect a similar rate. Thus, there has been a substantial
    increase in Mexico’s homicide rate from the 16.9 murders per 100,000 inhabitants
    noted by the UNODC in 2015. This means that Mexico’s homicide rate has become
    higher than “average” for the Americas, now rivaling those last reported by the
    UNODC for Brazil and Colombia.

•   Mexico saw record violence in 2018, with 28,816 homicide cases and 33,341
    victims. There were 28,816 homicide cases and 33,341 victims reported by SNSP in
    2018. SNSP reports information on the number of homicide cases and victims
    identified by law enforcement at the national and state level on a monthly basis. In
    addition to the law enforcement figures reported by SNSP, INEGI provides an

                                              3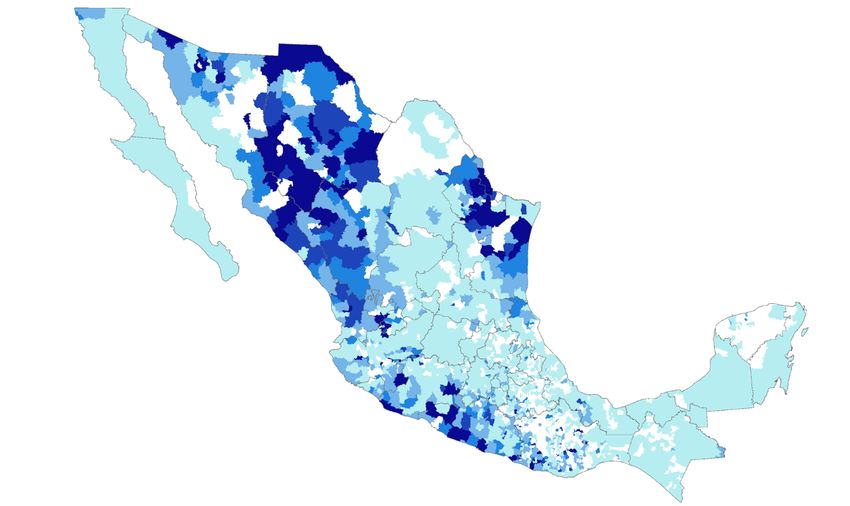
independent tally of individual causes of death, including intentional homicides at the
    municipal level, which is typically reported in the latter half of the next calendar year.
    For 2018, the authors estimate that INEGI will report approximately 33,794 homicide
    victims, quite close to the number of victims reported by SNSP.

•   Organized crime is a major contributor to Mexico’s problems of crime and
    violence. According to this and past reports, a major portion—between a third and
    half—of Mexico’s homicides since 2006 can be attributed to organized crime groups
    (OCGs), especially drug trafficking organizations (DTOs). For 2018, the most
    conservative estimates suggest that about 20% of all homicides in Mexico were
    attributable to organized crime, while high-end estimates suggest that more than two-
    thirds of all homicides were attributable to organized crime. This report presents a
    comprehensive assessment of the publicly available data to help understand Mexico’s
    ongoing public security crisis, and specifically the role of organized crime in relation
    to this problem.

•   Mexican organized crime groups are more fragmented and their activities more
    diversified. In recent years, the nature of violence has changed as the country’s major
    drug trafficking organizations, or cartels, have become more fragmented,
    decentralized, and diversified in their activities, this has contributed to a proliferation
    of smaller, regional and local criminal organizations and a more complex set of
    challenges for the Mexican government.

•   Violent crime has spread, but remains concentrated in a small number of specific
    locations. While there is a general perception that Mexico’s violence is pervasive and
    persistent throughout the country, violence has been highly localized, sporadic, and
    geographically specific (albeit more dispersed) over the years. To be sure, according to
    the latest INEGI figures available, the number of municipalities with zero homicides
    decreased in 2017 to just 721—only about 30% of municipalities—the lowest number
    since 1990. However, homicides have been regionally concentrated in the major drug
    trafficking zones in the northwest and the Pacific Coast. All told, the top ten most
    violent municipalities in Mexico accounted 33.6% of all homicide cases in Mexico in
    2018 (with 24.7% concentrated in the just top five): Tijuana (2,246), Ciudad Juárez
    (1,004), Acapulco (839), Cancún-Benito Juárez (537), Culiacán (500), Guadalajara
    (374), Irapuato (374), León (350), Tlaquepaque (329), and Ecatepec (317).

•   In per capita terms, Acapulco ranked above Tijuana in the rate of homicide cases per
    100k. Tijuana’s rate of 115 homicide cases (not individual victims) per 100,000
    inhabitants ranked second to Acapulco’s rate of 127 cases per 100,000. While SNSP
    does not report homicide data at the local level for all municipalities, in the case of
    Tijuana, the Baja California State’s Secretary of Public Security (SSP) reports cases and
    victims on a monthly basis at the municipal level and even at the neighborhood level.
    For 2018, SSP reported a total of 2,519 victims of intentional homicide in Tijuana
    (resulting in a rate of 129 per 100,000 inhabitants), a significant increase —by 41%—

                                               4
compared to the 1,781 victims reported by the same agency in 2017 (91 per 100,000
inhabitants).
• Violence increased in the state of Guanajuato due to the rise of Santa Rosa de Lima
Cartel. One of the most striking surges in homicides was found in the state of
Guanajuato. Much of that increase was concentrated in the cities of Irapuato (374
murders) and León (350), but several smaller towns registered dozens of homicides
each, including at least nine municipalities with homicide rates in excess of 100 per
100,000 (namely, Apaseo El Alto, Cortazar, Jarral el Progreso, Penjamo, Pueblo
Nuevo, Salamanca, Salvatierra, and Santiago Maravatio). Much of this violence
appears to be linked to the problem of petroleum theft (huachicol) and the Santa Rosa
de Lima Cartel (Cártel de Santa Rosa de Lima, CSRL). Petroleum thieves are commonly
known as huachicoleros, a name adopted by gasoline truck drivers to refer to the
stolen hydrocarbon, or chupaductos (pipeline suckers).
• Despite concerns about femicides, violence continues to disproportionately affect
men. Gender-specific crimes targeting women —known as “femicides”—have been of
special concern in Mexico, and there are specific laws and initiatives to address the
problem of femicide. However, Mexican men are more than 8.3 times more likely to
be homicide victims than women, according to the latest available data from INEGI in
2017. Of the total of 32,079 homicide victims nationwide, there were 28,522 male
homicide victims (88.9%), 3,430 female homicide victims (10.7%), and 127 homicide
victims of unspecified gender (0.4%) in 2017, according to INEGI, which is fairly
consistent with the average distribution of violence by gender in Mexico since
1990. The fact that men are 830% more likely than women to be murdered suggests
that special consideration is needed to identify the factors that contribute to violence
among men, and how gender intersects with other social and economic variables.
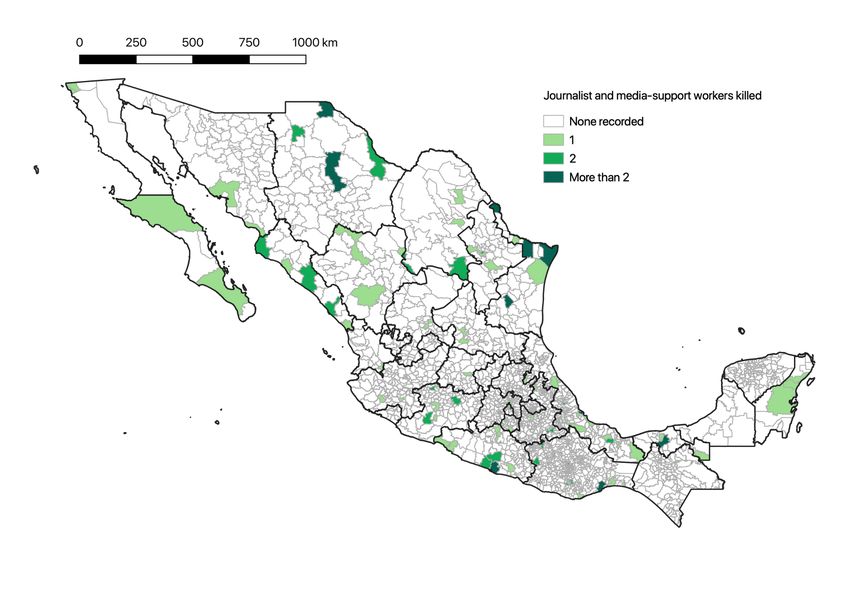
• As a monumental election year, 2018 saw greater violence for politicians and
journalists. As with homicides generally, 2018 marked a record high for killings of
mayors, mayoral candidates, and former-mayors, with 37 such victims. This number
was up slightly 35 cases in 2017, and a considerable increase from Justice in Mexico’s
tally of 14 victims in 2015 and six victims in 2016. The murdered politicians included
partisans from the PRI (10), PRD (6), PVEM (5), PAN (4), MORENA (3), Independent
(2), PES (1), and Movimiento Ciudadano (1). Meanwhile, there were 16 journalists and
media workers killed in the states of Baja California Sur, Chiapas Guerrero, Mexico
City, Mexico State, Nuevo Laredo, Quintana Roo, Tabasco, Tamaulipas, and Veracruz.
The media workers killed included journalists, reporters, photojournalists,
correspondents, photographers, station directors, and activists. A 2018 study found that
in recent years Mexican journalists were at least three times more likely to be
murdered than the general population, while mayors were at least nine times more
likely.
• Enrique Peña Nieto’s presidency (2012-18) saw the most homicides in recent
history. Based on INEGI’s official figures from 2013 through 2017 and the authors’
5projections for 2018, it appears that over 150,000 people were murdered over the six
years of the Peña Nieto administration. This constitutes an average of around 30,000
homicides per year during Peña Nieto’s term, nearly 10,000 more per year on average
than under Calderón, whose first two and last two years saw lower levels of homicide
compared to Peña Nieto. On average, there were more than 82 homicides per day
under the Peña Nieto administration, or more than 3.4 murders every hour.
• Mexican president Andres Manuel López Obrador faces difficult context on taking
office. Several major developments contributed to 2018 being Mexico’s most violent
year on record. These include the Mexico’s socioeconomic deficits, dynamic and
dramatic battles for OCG hierarchy, and the downfall of “El Chapo” Guzmán.
Mexico’s new president seeks to make headway in improving the country’s security
situation by placing greater emphasis on citizen security, major changes to federal law
enforcement, and efforts to minimize tensions in U.S.-Mexico relations.
6Organized Crime and Violence in Mexico
Analysis Through 2018
I. INTRODUCTION
Mexico has experienced dramatic surges in crime and violence over the last decade. For the past
ten years, the Justice in Mexico program has compiled the latest available data and analysis of
trends to help better understand the facets, implications, and possible remedies to the ongoing
crisis of violent crime, corruption, and human rights violations in Mexico, with special attention to
the fallout of the War on Drugs. This tenth report is published under a new title—Organized
Crime and Violence in Mexico—in acknowledgement of the gradual shift that has been occurring
over several years as a result of the restructuring of the illicit drug trade. Several factors
contributing to this shift have been documented in past reports, including the fragmentation of
Mexican criminal organizations, the decriminalization and legalization of certain psychotropic
substances (most notably marijuana), and the diversification of criminal enterprises in search of
new sources of illicit revenue. Accordingly, this report offers a broad assessment of the factors
contributing to Mexico’s ongoing problems with organized crime and violence.
Mexico’s violent crime wave has been most visibly exemplified by dramatic increases in the
number of homicides. The number of intentional homicides documented by Mexico’s National
Institute of Statistics and Geography (INEGI) had declined significantly under both presidents
Ernesto Zedillo (1994-2000) and Vicente Fox (2000-2006), but rose dramatically after 2007, the
first year in office for President Felipe Calderón (2006-2012). While homicides declined from
2011 through 2014, the number began to rebound during the last half of the administration of
President Enrique Peña Nieto (2012-2018), with levels exceeding those of the Calderón
administration. Preliminary figures for 2018 reported by Mexico’s National Public Security System
(SNSP) suggest that over the course of Peña Nieto’s six years in office, there were more than
150,000 homicides, amounting to at least 68 murders per day, or nearly three murders every hour.
All told, more than 332,000 people have been murdered in Mexico since the start of the twenty-
first century, a figure that excludes a substantial number of forced disappearances and
undocumented homicides.
A large portion of Mexico’s surge in violent crime over the last decade has been attributed to
organized crime groups, particularly those engaged in drug trafficking and other illicit activities.
This study is the latest in a series of annual reports produced by Justice in Mexico since 2010 to
examine trends in organized crime and violence in Mexico using the latest available data and
analysis. When the first report was published in 2010, there was an urgent need to reconcile often
imperfect, confusing, and even conflicting information from both official and non-governmental
sources regarding trends in violence and organized crime, and particularly “drug-related”
violence, as we discuss in more detail in Appendix A: Defining Drug-Related Violence.
In the ensuing years, it is important to acknowledge that there has been notable increase and
improvement in the regularity, reliability, and rigor of official statistics related to crime and
violence. Since the Calderón administration, Mexico’s National Public Security System has
7endeavored to provide regular monthly updates on violent crimes committed throughout the
country, a remarkable feat in national-level crime reporting. There has also been a significant
increase in the quantity and quality of scholarly research and analysis on these topics. That said,
the ongoing nature of Mexico’s public security crisis indicates that there is still a need for
continued attention to the problem and ideas about how to confront rampant crime and violence.
As the tenth annual report in this series, this study compiles the latest available data and analysis
in an effort to inform public discourse and policy decisions related to crime and violence trends in
Mexico. According to this and past reports, a major portion—between a third and half—of
Mexico’s homicides can be attributed to organized crime groups (OCGs), especially drug
trafficking organizations (DTOs). However, as the country’s major drug trafficking organizations,
or cartels, have become more fragmented, decentralized, and diversified in their activities, this has
contributed to a more complex set of challenges for the Mexican government. This report presents
a comprehensive assessment of the publicly available data to help understand Mexico’s ongoing
public security crisis, and specifically the role of organized crime in relation to this problem.
II. UNDERSTANDING MEXICO’S RECENT VIOLENCE
In the analysis of crime and violence, alarm or frustration about a given situation sometimes
makes it easy to slip into impassioned claims and hyperbole. In 2017, a widely-publicized report
from the International Institute for Strategic Studies suggested that Mexico was the second most
violent country in the world (after Syria), and asserted that all 23,000 homicides that occurred in
2016 were attributable to organized crime.1 This unfounded claim was seized upon and
politicized by U.S. President Donald Trump (2016-present) as a means to proliferate fear and
animosity toward Mexico, which has been a favorite target of Mr. Trump’s attacks. With this in
mind, the authors of the 2018 report on Organized Crime and Violence in Mexico have
endeavored to provide a more careful and balanced assessment of Mexico’s situation.
To begin, it is necessary to point out that homicide levels and rates are actually far worse
elsewhere in the Western Hemisphere. Indeed, with nearly two times Mexico’s population, Brazil
continues to lead the hemisphere in the total number of homicides, as it has for at least the last
decade according to the latest available cross-national data from the United Nations Office of
Drugs and Crime (UNODC). Brazil’s 2015 homicide rate of 26.7 per 100,000 also greatly
exceeded Mexico’s rate of 16.4 per 100,000 that year. Moreover, due to the magnifying effect of
population-based homicide rate calculations, Mexico’s per capita homicide rate tends to rank well
below those of smaller countries, like Belize, Colombia, Guatemala, Honduras, Jamaica, and
Venezuela. Hence, in per capita terms, the number of homicides in Mexico was still somewhat
“average” for the Western Hemisphere circa 2015: Mexico is home to about 13% of the region’s
population and roughly the same proportion of the region’s homicides.
1
Specifically, the report falsely asserts that “Mexico’s 2016 intentional homicide total, 23,000, is second only to
Syria.” Antônio Sampaio, “Mexico’s spiraling murder rate,” http://www.iiss.org/en/regions/latin-america-and-the-
caribbean/mexico-murder-rate-9f41
8Figure 1: Homicide Rates Elsewhere in the Americas (circa 2016)
90.0
82.8
80.0
70.0
60.0 56.5 56.3
50.0 47.0
37.6 36.5
40.0
29.5 28.4
27.3
30.0 25.5
18.5 18.4
20.0 15.2
13.0 11.9
10.2 9.7
7.7 7.7 7.4 6.3 5.9
10.0 5.9 5.4 5.3 5.0
3.5
1.7
-
re SA
ba
Pa ada
ne ras
Ca ile
on dor
ca na
Pu lom la
da
G ham l
tio ic ru
om G ico
ta a
B s
r
na e
ge f)
Ec tina
sta a
G Rica
d
to a
.
G Be a
te s
ina N P y
Ur ama
Ba razi
Be Rep
am la
do
e
ua a
l S gu
aic
d
a
er bi
re liz
lan
Ar e o
Co ma
din
e
Ch
gu
e
ini uya
na
Cu
Co rmu
Ve du
U
R
na ara
n
lva
zu
ua
n
en
n
u
re
t
n
Sa
J
H
G
El
e
th
D
nd
lur
ta
(P
en
ia
nc
liv
Vi
Bo
int
Sa
Source: UNODC homicide data for 2016 or latest year available. More recent comparative data were not
available at the time of release for this report.
That said, the fact that Mexico’s population is approaching 130 million means that the overall toll
of violence is much greater in Mexico than in smaller countries with higher homicide rates.
Indeed, from 2000 through 2015, the most recent years for which there is comparable data, the
number of homicides in Mexico (256,347) amounted to more than the combined total for those
same years across several countries with much higher homicide rates, including Belize (1,523),
Dominican Republic (28,208), El Salvador (54,548), Guatemala (70,012), Honduras (75,679), and
Jamaica (20,508).2
Unfortunately, Mexico’s national homicide rate has worsened considerably since 2015. Based on
CONAPO population figures, this report estimates that Mexico’s homicide rate was around 25.7
per 100,000 in 2017, the latest year for which data is available from INEGI. As we discuss below,
based on SNSP figures, the rate for 2018 has increased to 27.3 per 100,000, and INEGI figures
released in late 2019 are likely to produce a similar rate. Thus, there has been a substantial
increase in Mexico’s homicide rate from the 16.9 murders per 100,000 inhabitants noted by the
UNODC in 2015. This means that Mexico’s homicide rate may no longer be considered
“average” for the region, since its rate now rivals those last reported by UNODC for Brazil and
Colombia. Of course, a proper comparison would require similar updates on figures from other
countries in the region.
2
During that same period, the total number of homicides in Mexico was also slightly higher than the total for the
United States (254,983), which has nearly three times Mexico’s population.
9Figure 2: Number of Homicides in Selected Latin American Countries, 2000-2016
70000
60000
50000
40000
30000
20000
10000
0
2000 2001 2002 2003 2004 2005 2006 2007 2008 2009 2010 2011 2012 2013 2014 2015 2016
Colombia Honduras Mexico El Salvador
Peru Brazil USA Venezuela
Source: UNDOC, 2019.
What is clearly different about Mexico is that, even after more than a decade of elevated homicide
levels, the problem of internal violence is relatively new. For many Latin American countries,
political violence was a recurring problem during much of the 20 century, due to military
th
interventions, civil wars, and insurgencies that led to mass killing, disappearances, and human
rights violations.3 Mexico, of course, experienced considerable violence during the massive social
revolution that took place from 1910 to 1917, and the occasional aftershocks that followed.
However, from the 1930s onward, Mexico experienced a relatively high degree of political
stability and low levels of internal conflict for the remainder of the 20th century. In terms of
interpersonal violence, historical data show that homicide in Mexico generally declined from the
1930s into the mid-2000s.4
Over the last decade, however, no country in the hemisphere has seen as large an increase in the
absolute number or rate of homicides as Mexico. Thus, it is clear that the rise in violence in
Mexico over the past decade represents an urgent problem that needs no exaggeration to merit
serious consideration from scholars and policy makers. This tragic loss of Mexican lives should be
cause for serious concern, not hyperbolic claims or political gamesmanship.
3
Tina Rosenberg, Children of Cain: Violence and the Violent in Latin America, (New York: Penguin, 1991).
4
See David A. Shirk and Alejandra Ríos Cázares. "Reforming the Administration of Justice in Mexico." In
Reforming the Administration of Justice in Mexico, edited by Wayne A. Cornelius and David A. Shirk. Notre
Dame; La Jolla: University of Notre Dame Press; Center for U.S.-Mexican Studies, 2007; Fernando Escalante
Gonzalbo. "Homicidios 1990-2007." Nexos, 2009.
10III. FINDINGS: ORGANIZED CRIME AND VIOLENCE IN MEXICO
To better understand the general trends in violent crime in Mexico—and organized-crime-style
violence, in particular—the remainder of this report examines the indicators and patterns
identified in recent years, with an emphasis on the latest available data for 2018. Previous reports
prepared by Justice in Mexico over the past ten years discuss the general trends in organized crime
homicides for years prior to 2018 in considerable detail. The reports are available under the title
Drug Violence in Mexico via the “Publications” link at www.justiceinmexico.org. At the same
time, because many of the same unfortunate patterns have continued over the years, the structure
and content of this report follows a similar format and structure, and draws heavily on the findings
of past reports.
A. Record Levels of Homicide Continue in 2018
Homicide levels in Mexico increased substantially in 2018, continuing a multi-year upward trend
that began in 2015. Both of Mexico’s official data sources on homicides—SNSP and INEGI—have
been consistent in documenting these trends, despite slightly different methodologies and tallies
(See Appendix).5 Using a new methodology first introduced in 2014, SNSP reported a total of
28,816 homicide cases in 2018 (including multiple homicide cases), which reflects an increase of
16% from the previous year (See Figure 3). Using this same methodology, SNSP reported a total of
33,341 homicide victims in 2018, also an increase of 16%. That is, the number of individual
homicides reported by SNSP jumped by 3,910 cases and 4,607 individual victims. Taken
together, 2018 saw the highest number of homicide cases and individual homicides on record
since 1990, surpassing the record figures (24,906 cases and 28,734 individual homicides)
reported by SNSP in 2017.
In addition to the law enforcement figures reported by SNSP, INEGI provides an independent tally
of individual homicides, which for any given year is typically reported in the latter half of the next
calendar year. Thus, the latest available figures for INEGI come from 2017, when the agency
reported a total of 32,082 homicide victims, compared to the 28,734 homicide victims reported
by SNSP for that same year. Drawing on the difference between the figures reported in recent
years by INEGI and SNSP, in this and past reports the authors have generated annual estimates of
the number of homicides likely to be reported by INEGI (illustrated in the grey bars in Figure 3).6
For 2018, the authors estimate that INEGI will report approximately 33,794 homicide victims,
5
INEGI reports the number of individual homicide victims identified by medical examiners and makes these data
available at the state and municipal level for both federal (fuero federal) and local jurisdiction (fuero común)
crimes since 1990. SNSP reports homicide cases handled by law enforcement investigations and makes these
data available for the number of homicide cases (including cases that include more than one victim) from 1997 to
2013. Importantly, SNSP also began to report the number of individual homicide victims starting in 2014. There is
some disparity between INEGI and SNSP figures due to the noted differences in methodology. While it appears
obvious that law enforcement authorities have not been handling some of the cases reported by medical
examiners in recent years, the authors have no explanation for why SNSP’s figures consistently exceeded those of
INEGI up to 2007.
6
This figure is based on the average variance in the number of homicides reported by INEGI and SNSP over
multiple years. This method has resulted in a fairly reliable and conservative estimate for past reports, with a mean
of +/- 3% difference from the actual number subsequently reported by INEGI from 2013-17.
11quite close to the number of victims reported by SNSP.7 If this estimate proves correct, it suggests
that the methodologies used by SNSP and INEGI have become more consistent and more reliable
over time. This would be an important finding, since there has been substantial debate about the
credibility of SNSP’s figures, compared to those of INEGI, an autonomous government agency.
Figure 3: Homicides by Year as Reported by INEGI and SNSP (1990-2017)
40,000
SNSP Cases (Old Method)
35,000 INEGI Victims
SNSP Cases (New Method)
30,000
SNSP Victims (New Method)
25,000 INEGI Victims (Authors' Estimate)
20,000
15,000
10,000
5,000
-
1990
1991
1992
1993
1994
1995
1996
1997
1998
1999
2000
2001
2002
2003
2004
2005
2006
2007
2008
2009
2010
2011
2012
2013
2014
2015
2016
2017
2018
Source: INEGI, SNSP.
As illustrated below in Figure 4, annualized data tend to obscure patterns that can be better
identified in data reported on a monthly basis. For example, while the monthly spikes in
homicides were higher in 2010, the annual total was higher for 2011, previously the two worst
years on record. Still, the largest monthly surges and the annual totals for 2017 and 2018 surpass
those seen in either of the two previous years. For this reason, as has been widely reported, the
number of homicides in 2017 and 2018 surpassed the totals for all other years since 1990.
7
In the 2018 Drug Violence in Mexico report, the actual figure for 2017 reported by INEGI in mid-2018 was
31,041, compared to the authors’ estimate of 30,548 homicides, a difference of about 1,533 murders or about
2%. To account for changes in SNSP’s methodology and data gathering efforts starting in 2014, the authors base
their 2018 estimate for the likely INEGI figure on a reduced range including the INEGI/SNSP variance over only
the past three years.
12Figure 4: Homicides by Month as Reported by INEGI and SNSP (1990-2018)
3000
INEGI
2500
SNSP Cases (New Method)
SNSP Cases
2000
1500
1000
500
0
90 91 92 93 94 95 96 97 98 99 00 01 02 03 04 05 06 07 08 09 10 11 12 13 14 15 16 17 18
Source: INEGI, SNSP.
Figure 5: Homicide Rate, Based on INEGI and SNSP Data (1990-2017)
30.0 27.3
25.7
24.2
25.0 23.3
22.6 23.8 23.6
20.1
19.4 18.9 20.6
20.0 16.9 16.4 17.5 16.7 16.9 21.0
17.4
15.4 14.9 20.2 15.1
15.1 17.4
14.4 14.4 14.7 18.5 19.0 14.8
13.8 16.9
15.0 13.3 13.7 13.6
12.7 12.8
15.8 14.4
12.1
13.8 11.0 13.6
10.5 10.9 9.3 14.3
13.4
12.2
10.0 10.6 10.0 11.8
9.7 9.5 9.6
8.8 9.3
8.1
5.0
0.0
1990
1991
1992
1993
1994
1995
1996
1997
1998
1999
2000
2001
2002
2003
2004
2005
2006
2007
2008
2009
2010
2011
2012
2013
2014
2015
2016
2017
2018
INEGI Rate (Victims) SNSP Rate (Cases) SNSP Rate (Victims) SNSP Rate (Cases) NM
Source: INEGI, SNSP. Calculation of 2018 INEGI homicide rate based on authors’ estimates. “NM” refers to “new
methodology.”
Of course, to properly analyze crime trends over time, it is necessary to account for per capita
rates and population growth. CONAPO projections based on the 2010 census suggest that
13Mexico’s population rose from roughly 112 million people in 2010 to nearly 122 million people
in 2018, an increase of about 10 million people. Still, even accounting for this roughly 9% overall
increase in population over eight years, the number of homicide investigations reported by SNSP
in 2018 exceeded the number in 2010 by 39%, which translates into a definitive increase in
Mexico’s homicide rate per capita.8 Indeed, as illustrated in Figure 5, SNSP’s updated
methodology indicates that Mexico’s national homicide rate reached an unprecedented 27.3
homicide victims per 100,000 inhabitants in 2018.9 If the authors’ estimates for INEGI are correct,
the homicide rate based on INEGI’s final figures for 2018 will be approximately 27.7 per 100,000
inhabitants. Whatever the final calculation for these years, there has been a substantial increase in
Mexico’s homicide rate from the 16.9 murders per 100,000 inhabitants noted by the UNODC in
2015.
B. Organized-Crime-Style Killings Constitute Major Share of Homicides in 2018
A review of available data shows that many homicides in recent years bore characteristics
typically associated with organized crime-style violence: group executions, torture, beheadings,
dismemberment, assault weapons, “narco” messages, mass graves, and other methods used by
organized crime groups. The bar chart for Figure 6 presents INEGI (1990-2017) and SNSP (1997-
2018) homicide data alongside a line graph tracing available data on organized-crime-style
homicides from SNSP (2007-2013), Reforma (2006-2012 and 2013-2016), and Milenio (2007-
2016), which are described in more detail in the Appendix.10 In total, for 2018, Lantia reported
22,365 organized-crime-style homicides, Milenio reported 15,887, and Reforma reported 7,513. It
is worth noting that Reforma’s figures represent a decrease of nearly 24% in the number of
organized-crime-style homicides reported by the same publication in 2017, while Milenio
reported an increase of almost 27% and Lantia reported an increase of more than 18% from
2017.11 This is a substantial deviation in Reforma’s figures and appears to be a result of a change
in methodology, according to author inquiries to the news organization.12
8
Again, it is important to mention that SNSP’s methodology for counting homicide investigations was revised in
2014. Even so, the large difference in the number of homicide investigations in 2018 compared to 2010 —a
difference of 8,136 cases (39.3%)— does not seem likely to be solely attributable to this change in methodology
or to the increase in population over eight years.
9
While SNSP did not report figures for homicide victims prior to 2014, the homicide rate derived from SNSP’s
2018 figures exceeds the rate of 23.8 derived from its figures for 2017. SNSP’s rate also exceeds the rates derived
from INEGI’s figures for the record surge in 2017 (25.7 per 100,000) and the previous peak in 2011 (24.2 per
100,000).
10
As noted in the methodological discussion in the Appendix, one of the limitations of both official and non-
governmental tallies of organized-crime-style homicides is that there are significant gaps in reporting by some
sources, notably SNSP and Reforma.
11
In 2017, the number of organized-crime-style homicides reported by Reforma was 9,883, while Milenio
reported 12,532 and Lantia reported 18,898.
12
Reforma journalist Rolando Herrera responded to author inquiries about this topic by noting that in 2018 the
newspaper shifted from internal reports by its own correspondents to a review of regional newspapers and reports
by local prosecutors. Email correspondence with the authors dated April 19, 2019.
14Figure 6: Comparison of Homicide and Organized Crime Homicide Data from Multiple Sources,
1990 through 2018
40,000
INEGI Victims SNSP Cases
35,000
SNSP Victims INEGI (Authors' Projections)
30,000 SNSP (OCG) CNDH (OCG)
REFORMA (OCG) MILENIO (OCG)
25,000
LANTIA (OCG)
20,000
15,000
10,000
5,000
0
1990
1991
1992
1993
1994
1995
1996
1997
1998
1999
2000
2001
2002
2003
2004
2005
2006
2007
2008
2009
2010
2011
2012
2013
2014
2015
2016
2017
2018
Sources: INEGI, SNSP, Reforma, Milenio, Lantia, CNDH.
Regarding the proportions underlying the above comparison, Table 1 below identifies the share of
homicides attributed to organized crime by various counts. In contrast to past reports, here the
authors only compare the proportion of organized-crime-style homicides as a percentage of the
number of individual victims reported by INEGI and SNSP.13 This modification allows a more
precise comparison of available sources, which shows that as few as a 34.2% and as many as
51.1% of all homicides in Mexico from 2006 to 2018 bore characteristics of organized crime-style
violence. For 2018, the most conservative estimate (comparing Reforma data with the authors’
homicide projections for INEGI) suggests that only about 20% of all homicides in Mexico were
attributable to organized crime, while the most generous estimate (comparing Lantia data with
SNSP) suggests that more than two-thirds of all homicides were attributable to organized crime.
Given the changes in Reforma’s methodology for 2018 noted above, the low-end estimate seems
improbable. Of the three estimates for organized crime homicides used, Reforma’s is now the
least closely correlated with other measures, as illustrated in Table 6 in the Appendix.
13
The authors made this change because the five-year timeframe in which SNSP has been reporting individual
homicides makes it less necessary and relevant to attempt to identify the proportion of individual organized-
crime-style homicides compared to the number of cases.
15Table 1: Percentage of INEGI and SNSP Homicides Attributed to Organized Crime-Style
Homicide in Reforma, Milenio, and Lantia Tallies, 2006-2018
YEAR SNSP SNSP REFORMA REFORMA MILENIO MILENIO LANTIA LANTIA
OCG OCG OCG (as % OCG (as % OCG OCG OCG OCG
(as % (as % INEGI SNSP (as % (as % (as % (as %
INEGI SNSP Victims) Victims) INEGI SNSP INEGI SNSP
Victims) Victims) Victims) Victims) Victims) Victims)
2006 n/d n/d 20.3% n/d n/d n/d
2007 19.8% 27.6% 25.6% n/d 31.3% n/d
2008 34.5% 52.0% 36.0% n/d 39.8% n/d
2009 36.9% 59.6% 33.3% n/d 41.8% n/d
2010 55.7% 73.9% 44.4% n/d 48.5% n/d
2011 63.3% 71.8% 45.1% n/d 44.8% n/d
2012 53.7% 55.6% 38.3% n/d 47.9% n/d
2013 56.2% 60.0% 31.8% n/d 44.8% n/d n/d n/d
2014 32.7% 36.9% 40.9% 51.1% 37.5% 43.3%
2015 24.5% 27.3% 42.2% 49.5% 39.1% 45.4%
2016 26.3% 28.0% 45.6% 52.8% 36.0% 39.1%
2017 28.7% 34.4% 36.4% 50.3% 54.8% 65.8%
2018 19.8% 22.5% 41.9% 55.1% 59.0% 67.1%
AVG. 45.7% 57.2% 34.2% 36.9% 42.5% 51.1% 37.5% 43.3%
Sources: INEGI, SNSP, Reforma, Milenio, Lantia, and CNDH.
Finally, the authors compare the monthly data available from 2018 for intentional homicides
reported by SNSP and organized crime-style homicides reported by Reforma, Milenio, and Lantia,
as illustrated in Figure 7. Over the course of 2018, Milenio and Lantia recorded higher tallies of
organized crime-style homicides than Reforma. Yet, the monthly increases or decreases in
homicides reported by Milenio and Lantia varied considerably over course of the year, often
moving in opposite directions. As a result, there was almost no correlation between these two
tallies. That is, if Milenio reported an increase in a given month, there was a relatively low
likelihood that Lantia would also report an increase. By contrast, there was a fairly strong positive
correlation in the monthly tallies reported by Reforma and Lantia, with the two tallies showing
fairly consistent shifts in the level of violence from month to month. Indeed, both Lantia and
Reforma’s figures appeared to more consistently than Milenio’s in the same direction as those
reported each month by SNSP.
16Figure 7: Homicides and OCG-Style Homicides (By Month) in 2018
3500
3000
2500
2000
1500
1000
500
0
J F M A M J J A S O N D
SNSP Cases (New Method) SNSP VICTIMS REFORMA (OCG)
MILENIO (OCG) LANTIA (OCG)
Sources: SNSP, Milenio, Reforma, Lantia.
Meanwhile, Justice in Mexico maintains its own database of organized crime-style homicides
documented by various media sources. As noted in past reports, using the Justice in Mexico
Memoria database, the authors have found that the vast majority of victims of organized crime-
style violence—at least 75%—were identified as men, with just 9% of the victims identified as
female (the remainder were unidentified). Surprisingly, the average age of victims of organized-
crime-style homicides is about 33 years, which appears to contradict widespread assumptions that
organized crime violence involves uneducated, unemployed, and disaffected youths. However, it
is also the case that the deaths of older persons—especially those of government personnel—are
more likely to be over-reported in the media sources used to build the Memoria database, so these
figures may illustrate the biases inherent in information gleaned from media reports.
C. Shifting Geographic Patterns of Violence
While there is a general perception that Mexico’s violence is pervasive and persistent throughout
the country, violence has been highly localized, sporadic, and geographically specific (albeit more
dispersed) over the years. Using the data on homicides and organized crime-related homicides
available at the municipal and state levels, respectively, the authors review some of the trends and
shifts in the geographic distribution of violence below.
1. Geographic Dispersion Decreases in 2018
Past versions of this report have paid close attention to the geographic dispersion of violence in
Mexico at the municipal level. In 2007, the historic low point in homicide rates in Mexico, INEGI
reported that approximately 1,108 of Mexico’s 2,466 municipalities (about 46%) had zero
17homicides, as illustrated in Figure 8.14 Indeed, for the entire Fox administration (2000-2006) and
the first year of the Calderón administration (2006-2012), there was a historically unprecedented
period in which over 40% of Mexican municipalities registered no murders at all.15
From 2007 to 2013, however, Mexico experienced a steady decline in the number of “murder-
free” municipalities each year, reaching a low of 817 municipalities (about 33%) in 2013.
Moreover, between 2007 and 2012, there was dramatic increase in the number of municipalities
(from 65 to 179) registering more than 25 homicides. During that time period, the number of
municipalities with more than 100 homicides quadrupled from ten in 2007 to 41 in 2012. From
2012 to 2015, however, the number of “violence free” municipalities increased slightly (reaching
889, or about 36%, in 2015), the number of municipalities with more than 25 homicides declined
(falling to 157 in 2015), and the number of municipalities with more than 100 homicides also
dropped (falling to 32 in 2015). While not quite the kind of “positive peace” advocated by the
Mexico Peace Index (produced annually by the Institute for Economics and Peace), the absence of
violence in more places was a welcome shift.
14
These figures are approximate because there is no data for some municipalities. Also, the number of
municipalities in Mexico changes from time to time as new ones are created. From 2012 to 2013, for example, it
appears that dozens of new municipalities were added to INEGI’s homicide dataset.
15
The figures we report here, which differ slightly from previous reports, are based on more recent, corrected data
from INEGI for the number of homicides that occurred in these years. Adjustments to the INEGI dataset are made
each year to differentiate between the number of murders that were “registered” in a given year and those which
actually “occurred” in that year. Here we give preference to INEGI data over SNSP because they refer to
individual homicides and because SNSP data are not available for as long a time series and are not as complete
across years.
18Figure 8: Concentrations of Violence at the Municipal Level, 1990-2018
100%
90%
80%
70%
60%
50%
40%
30%
20%
10%
0%
1990
1991
1992
1993
1994
1995
1996
1997
1998
1999
2000
2001
2002
2003
2004
2005
2006
2007
2008
2009
2010
2011
2012
2013
2014
2015
2016
2017
Zero Homicides Less than 25 26-50 Homicides
51-75 Homicides 76-100 Homicides More than 100 homicides
Source: INEGI.
The latest available data from INEGI suggest that there has been a continued resurgence in the
geographic dispersion of violence in Mexico that surpasses levels set in previous years. Indeed, the
number of municipalities with zero homicides decreased in 2017 to just 721—only about 30% of
municipalities—the lowest number since 1990.16 Meanwhile, the number of municipalities with
more than 100 homicides increased from a record 50 in 2016 to a new record 69 in 2017. Given
the increase in homicides indicated by SNSP for 2018, it seems likely that in late-2019 INEGI will
report that the number of homicide-free municipalities continued to decline and the number of
high-homicide municipalities also increased.
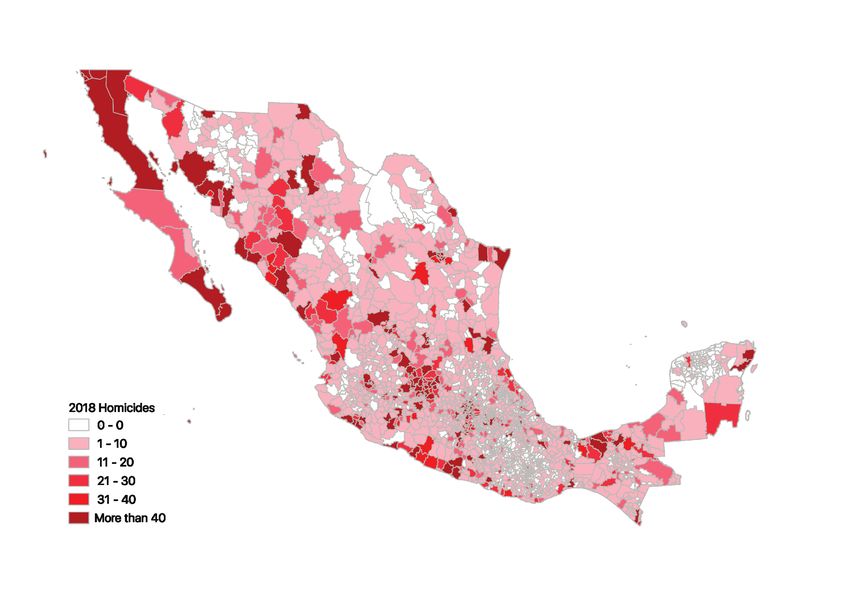
The maps in Figure 9 further illustrate the geographic distribution of violence in Mexico, showing
municipal homicide levels from 1999 through 2017, as reported by INEGI. Because INEGI data
are not yet available for 2018, the maps in Figure 10 show both the number of homicide cases (in
red) and the homicide rate per 100,000 inhabitants (in blue) using data reported by SNSP at the
municipal level and using CONAPO population estimates.17 These maps also show that
homicides have been regionally concentrated in the major drug trafficking zones in the northwest,
16
Last year, the authors reported that the number of municipalities without homicide had dropped from 889 in
2015 to 846 in 2016 (on par with 2014).
17
It is necessary to underscore again this year that SNSP data are preliminary. There were several municipalities
for which SNSP reported incomplete data at the time that authors downloaded and began working with these
data in January 2016, as was the case in our reports for previous years. Also, it is important to note that the
municipal level data from SNSP reflect the number of homicide cases (not the number of individual victims)
because victim level data has only been reported by SNSP at the state level since it began reporting these figures
over the past three years.
19You can also read