Origin, burial and preservation of late Pleistocene-age glacier ice in Arctic permafrost (Bylot Island, NU, Canada)
←
→
Page content transcription
If your browser does not render page correctly, please read the page content below
The Cryosphere, 13, 97–111, 2019
https://doi.org/10.5194/tc-13-97-2019
© Author(s) 2019. This work is distributed under
the Creative Commons Attribution 4.0 License.

Origin, burial and preservation of late Pleistocene-age glacier ice in
Arctic permafrost (Bylot Island, NU, Canada)
Stephanie Coulombe1,2,3 , Daniel Fortier2,3,5 , Denis Lacelle4 , Mikhail Kanevskiy5 , and Yuri Shur5,6
1 Polar  Knowledge Canada, Cambridge Bay, X0B 0C0, Canada
2 Department   of Geography, Université de Montréal, Montréal, H2V 2B8, Canada
3 Centre for Northern Studies, Université Laval, Quebec City, G1V 0A6, Canada
4 Department of Geography, Environment and Geomatics, University of Ottawa, Ottawa, K1N 6N5, Canada
5 Institute of Northern Engineering, University of Alaska Fairbanks, Fairbanks, 99775-5910, USA
6 Department of Civil and Environmental Engineering, University of Alaska Fairbanks, Fairbanks, 99775-5960, USA

Correspondence: Stephanie Coulombe (stephanie.coulombe@polar.gc.ca)

Received: 30 May 2018 – Discussion started: 19 June 2018
Revised: 6 November 2018 – Accepted: 23 November 2018 – Published: 11 January 2019

Abstract. Over the past decades, observations of buried           on permafrost geosystem landscape dynamics, terrestrial and
glacier ice exposed in coastal bluffs and headwalls of ret-       aquatic ecosystems and infrastructure.
rogressive thaw slumps of the Arctic have indicated that con-
siderable amounts of late Pleistocene glacier ice survived the
deglaciation and are still preserved in permafrost. In expo-
sures, relict glacier ice and intrasedimental ice often coexist   1   Introduction
and look alike but their genesis is strikingly different. This
paper aims to present a detailed description and infer the        In the Arctic, extensive areas of ridged and hummocky
origin of a massive ice body preserved in the permafrost of       moraines are underlain by buried glacier ice (Dyke and
Bylot Island (Nunavut). The massive ice exposure and core         Savelle, 2000; Kokelj et al., 2017; Solomatin, 1986).
samples were described according to the cryostratigraphic         Massive-ice bodies within these landscapes are important
approach, combining the analysis of permafrost cryofacies         indicators of past glacial, hydrologic and hydrogeologic
and cryostructures, ice crystallography, stable O-H isotopes      conditions and are used to reconstruct regional palaeo-
and cation contents. The ice was clear to whitish in appear-      environments and palaeo-climates (Jorgenson and Shur,
ance with large crystals (cm) and small gas inclusions (mm)       2008; Murton et al., 2005; Lacelle et al., 2018). Areas with
at crystal intersections, similar to observations of englacial    buried glacier ice are also becoming increasingly vulnerable
ice facies commonly found on contemporary glaciers and            to climate warming (Kokelj et al., 2017). Glacier ice is the
ice sheets. However, the δ 18 O composition (−34.0 ± 0.4 ‰)       most common type of buried ice in permafrost and its oc-
of the massive ice was markedly lower than contemporary           currence was reported in Russia (Astakhov, 1986; Belova et
glacier ice and was consistent with the late Pleistocene age      al., 2008; Ingólfsson and Lokrantz, 2003; Kaplanskaya and
ice in the Barnes Ice Cap. This ice predates the aggrada-         Tarnogradskiy, 1986; Solomatin, 1986), the Canadian Arc-
tion of the surrounding permafrost and can be used as an          tic (Dallimore and Wolfe, 1988; French and Harry, 1990),
archive to infer palaeo-environmental conditions at the study     Alaska (Jorgenson and Shur, 2008; Kanevskiy et al., 2013)
site. As most of the glaciated Arctic landscapes are still        and Antarctica (Sugden et al., 1995; Swanger, 2017). Buried
strongly determined by their glacial legacy, the melting of       glacier ice has been commonly observed in the proglacial
these large ice bodies could lead to extensive slope failures     zone of contemporary glaciers and can be preserved in for-
and settlement of the ground surface, with significant impact     merly glaciated areas (the paraglacial to periglacial zones)
                                                                  within large moraine belts, hummocky till and glaciofluvial
                                                                  deposits (Everest and Bradwell, 2003; Tonkin et al., 2016).

Published by Copernicus Publications on behalf of the European Geosciences Union.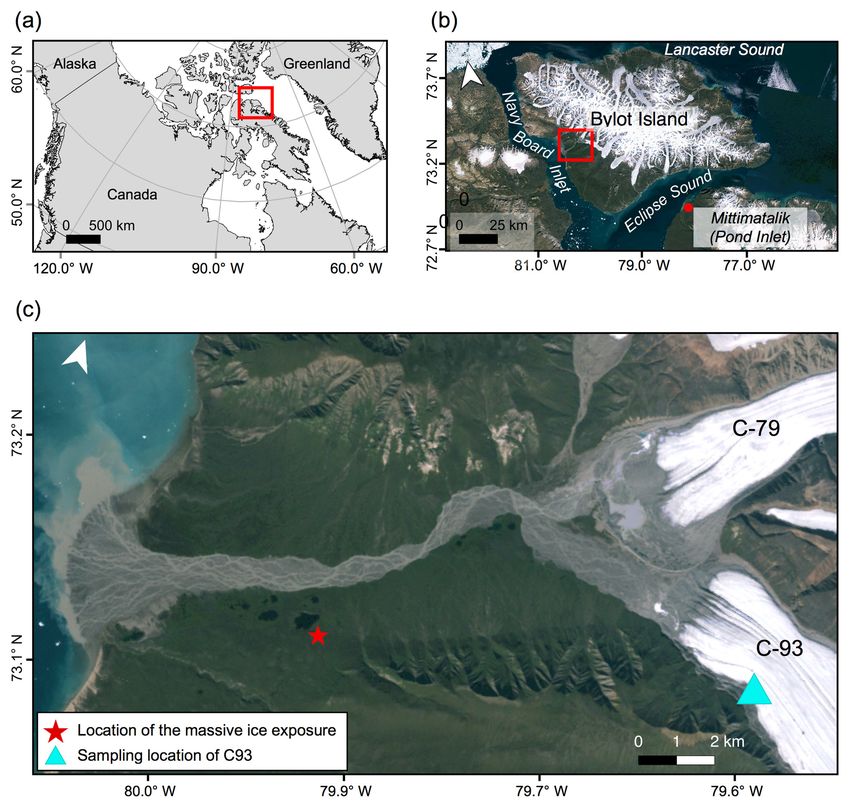
98                                       S. Coulombe et al.: Buried Pleistocene glacier ice in the permafrost of Bylot Island

In the Canadian Arctic, buried glacier ice has been mainly          proach was used to delineate cryostratigraphic units on the
reported in the western and central regions, especially in          basis of their cryostructures, physical properties and thaw
the Mackenzie Delta region (French and Harry, 1990), Tuk-           unconformities (French and Shur, 2010; Gilbert et al., 2016),
toyaktuk Coastlands (Murton et al., 2005), Herschel Island          combined with crystallography and geochemical analyses of
(Fritz et al., 2011), Yukon (Lacelle et al., 2007), Banks Island    the different ground-ice types. The origin of the massive ice
(Lakeman and England, 2012) and Victoria Island (Dyke and           is discussed.
Savelle, 2000; Lorrain and Demeur, 1985). While the per-
mafrost of the eastern Canadian Arctic is expected to contain
remnants of Pleistocene ice sheets or glaciers, very few have       2   Regional setting
been reported so far.
   Distinguishing between buried glacier ice and other types        With ice-capped summits dominating the central highlands
of massive ground ice in the permafrost is usually based on         and glaciated valleys that extend near the coast, the moun-
cryostratigraphy combined with detailed studies of physical,        tainous central section forms a striking contrast with the rel-
geochemical and isotopic properties of the ice that may also        atively flat coastal lowlands. The Byam Martin Mountains
include analyses of occluded gases (Cardyn et al., 2007; Fritz      (∼ 1400 m a.s.l.) consist primarily of Archean–Aphebian
et al., 2011; Ingólfsson and Lokrantz, 2003). When classify-        crystalline igneous rocks and Proterozoic metasedimen-
ing glacier ice facies, a distinction is made between englacial     tary and metamorphic rocks (Jackson and Davidson, 1975).
and basal ice facies (Fortier et al., 2012; Lawson, 1979).          Klassen (1993) suggested that alpine glaciers, larger but sim-
The englacial (firn-derived) ice facies is formed by the grad-      ilar in size to those present today, occupied Bylot Island
ual snow compaction and recrystallization, a process called         during the late Wisconsinan. At the Last Glacial Maximum
firnification, and has a low debris content (Benn and Evans,        (LGM), ice streams of the Laurentide Ice Sheet (LIS) flowed
2010). Basal ice has distinctive physical and chemical char-        in adjacent marine channels (Lancaster Sound, Navy Board
acteristics and has a much higher debris content than the           Inlet and Eclipse Sound) and reached Bylot Island (De Ange-
overlying englacial ice as a result of subglacial processes         lis and Kleman, 2007). The study area is situated in the Qar-
operating at the glacier bed: regelation, glaciohydraulic su-       likturvik Valley (73◦ 090 N, 79◦ 570 W, 25 m a.s.l.) on south-
percooling accretion, net basal adfreezing, incorporation of        west Bylot Island at about 80 km north-west of Mittimata-
ice and sediments by overriding ice during glacier advance,         lik (Pond Inlet; Fig. 1b). This valley was eroded through a
glacio-tectonics, ice lens aggradation and downward propa-          Cretaceous–Tertiary sequence of poorly consolidated sand-
gation of cold temperature in the sediment at the glacier bed       stone and shale (Jackson and Davidson, 1975).
(congelation) (Alley et al., 1998; Fortier et al., 2012; Hub-          The Qarlikturvik Valley is a typical U-shaped glacial val-
bard and Sharp, 1995; Knight, 1997; Lawson, 1979; Sharp et          ley with surface sediments reflecting the complex history of
al., 1994). Both types of glacier ice may experience burial but     the valley: presence of unconsolidated glacial, colluvial, allu-
basal ice is probably the most common form of buried glacier        vial, marine, aeolian and organic deposits dating back to the
ice according to reports from various circumpolar permafrost        Late Pleistocene and Holocene (Allard, 1996; Fortier and Al-
regions (Belova et al., 2008; Fritz et al., 2011; Murton et         lard, 2004). The valley comprises low-lying ice-wedge poly-
al., 2005; St-Onge and McMartin, 1999). The process of              gon terraces bordering a proglacial braided river running in
burial of glacier ice has been described by Shur (1988), Solo-      a glaciofluvial outwash plain and forming a delta in Navy
matin (1986), Harris and Murton (2005) and citations therein.       Board Inlet. During the Holocene glaciers C-93 and C-79
Burial of glacier ice may occur as a result of (1) accumula-        retreated up-valley and today they are located about 14 km
tion of fluvial, lacustrine, aeolian or slope sediments on top      from the coast. Following glacial retreat, the valley became
of the ice; (2) glaciotectonic processes or (3) formation of        partially submerged between 11 335 to 6020 cal yr BP as a
insulating blanket of supraglacial melt-out till. With the lat-     result of a marine transgression (Allard, 1996). Alternating
ter scenario, sediment-rich basal ice has a greater potential to    layers of peat and aeolian sands and silts (∼ 2–3 m) cover
persist in a buried state than englacial ice with little debris.    the glaciofluvial terraces of the valley, where an extensive
Buried glacier ice remains stable for a long period of time         network of syngenetic ice-wedge polygons have developed
only if the soil temperature is below freezing, and the active-     after 6000 cal yr BP (Fortier and Allard, 2004). Mounds of
layer thickness does not exceed a depth to the massive ice          reworked till and ice-contact-stratified sediments mark a for-
body (Shur, 1988).                                                  mer position of the glacier in the valley.
   In this study, we describe the occurrence of massive ice            Bylot Island belongs to the Arctic Cordillera and the north-
preserved in the permafrost of the Qarlikturvik Valley, south-      ern Arctic terrestrial ecozones. The mean annual air temper-
western Bylot Island (NU, Arctic Canada). We investigated           ature between 1971 and 2000 in Pond Inlet (NU, Canada)
the physical and geochemical properties of a recently ex-           was −15.1 ± 5.1 ◦ C, increasing slightly to −14.6 ± 4.9 ◦ C
posed body of massive ice and compared them with those              between the 1981 and 2010 (Environment Canada, 2015).
of other ice types in the region (snow, glacier ice, wedge          No significant trends in precipitation have been observed
ice, segregated ice) to infer its origin. A cryostratigraphic ap-   over the last decades, with a mean annual precipitation of

The Cryosphere, 13, 97–111, 2019                                                           www.the-cryosphere.net/13/97/2019/
S. Coulombe et al.: Buried Pleistocene glacier ice in the permafrost of Bylot Island 99
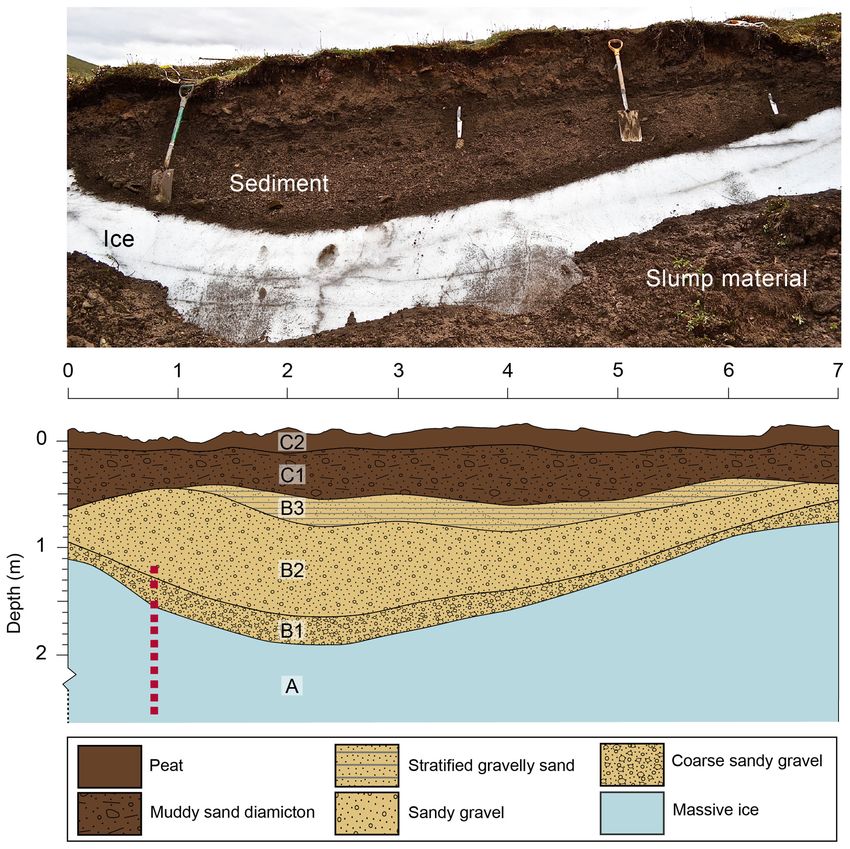
Figure 1. (a) Location of Bylot Island, (b) location of the Qarlikturvik valley, (c) location of the study area within the Qarlikturvik Valley
(valley of glaciers C-79 and C-93), Bylot Island, Nunavut, Canada. Wedge ice, segregated ice and snow were also sampled near (< 1 km) the
massive ice exposure. The thaw depths were measured with a steel probe at every 10 m along a 150 m transect.
189 mm, much of it falling as snow. Thawing and freezing 3 Material and methods
indices averaged (1981–2010) 473 degree days above 0 ◦ C
and 5736.1 degree days below 0 ◦ C respectively (Environ- A large body of massive ice was found exposed beneath
ment Canada, 2015). Vegetation in the valley is typical of ∼ 1.7 m of sediments along the headwall of a thaw slump in
Arctic tundra environments and is largely determined by soil the Qarlikturvik Valley, ∼ 10 km from the terminus of C-93
moisture and slope (Duclos et al., 2006). Wetlands occur in and C-79 glaciers (Fig. 1c). Since a great amount of slump
low-lying areas, commonly with low-centred polygons, and material covered the ice, the exposure was cleaned and en-
are typically dominated by grasses and sedges. Mesic tundra larged to allow a better description and sampling. The ex-
is found in areas characterized by better-drained soils (i.e. cavated section along the headwall of the slump attained a
uplands and hillslopes). The climatic and vegetation condi- height exceeding 7 m and extended laterally over 10 m. The
tions determine the presence of continuous permafrost in the lower and lateral contacts between the ice body and the sur-
ice-free areas of Bylot Island. Locally, permafrost thickness rounding sediments could not be delineated. The exposure
> 400 m has been detected from thermal measurements on was subdivided into three units from the bottom: (a) mas-
the nearby Somerset and Devon islands (Smith and Burgess, sive ice, (b) sand and gravel and (c) muddy sand diamicton
2002). Active-layer thickness varies from ∼ 1 m in drained overlaid by peat (Fig. 2). The thaw depths were measured
unvegetated sands and gravels to ∼ 0.3–0.7 m in peaty and with a steel probe at every 10 m along a 150 m transect that
silty soils (Allard et al., 2016). started at the upper headwall of the thaw slumps. Samples
from the massive ice (unit A) were collected using an axe and
a portable core drill equipped with an 8 cm diamond carbide
core barrel. Between 2011 and 2013, ice cores were extracted
www.the-cryosphere.net/13/97/2019/ The Cryosphere, 13, 97–111, 2019
100                                       S. Coulombe et al.: Buried Pleistocene glacier ice in the permafrost of Bylot Island

                                                                      64), a technique that allows visualizing and reconstructing
                                                                      the internal structure (2-D and 3-D) of permafrost samples at
                                                                      < 1 mm resolution (Calmels et al., 2010; Dillon et al., 2008;
                                                                      Fortier et al., 2012). The complete CT-scanning procedure
                                                                      used in this study is presented in Appendix A. Crystallo-
                                                                      graphic analysis of the massive ice and modern glacier ice
                                                                      was conducted to measure their crystal size and shape (sur-
                                                                      face area, long axis and circularity ratio) as these parameters
                                                                      contain information about the conditions under which the ice
                                                                      was formed (French and Shur, 2010). The crystalline struc-
                                                                      ture was investigated through thin sections of ice mounted on
                                                                      a glass slide under cross-polarized light. Thin sections were
                                                                      made by cutting the ice sample vertically and/or horizontally
                                                                      into thin slices (thickness: 0.2 to 0.4 mm). C-axis orienta-
                                                                      tions of the crystals have not been measured since the hori-
                                                                      zontal orientation of the ice samples was not preserved fol-
                                                                      lowing the sampling. Fiji image analysis software was used
                                                                      to measure the area, long axis and circularity ratio of each
                                                                      crystal (Schindelin et al., 2012). Differences in the crystal
                                                                      shape (area, long axis, circularity ratio) of horizontal and ver-
                                                                      tical thin sections were tested with the Mann–Whitney U test
Figure 2. A photograph and a schematic cross section showing gen-     using R, which is a programming language software for data
eralized stratigraphy of the massive ice exposure and the overlying
                                                                      analysis and graphics (R Development Core Team, 2016).
sediments. The lower and lateral contacts of the massive ice have
not been reached. The thaw depths measured in late July (2013) at
                                                                         The massive ice body, along with glacier C-93 ice, ice
the headwall reaches 55 cm. The red star indicates the sampling lo-   wedges, intrasedimental ice and snow, were analyzed for
cation of the organic material and the red dots show the sampling     their geochemical and isotopic (δ 18 O, δD) composition, an
points for stable O-H isotope and hydrochemistry.                     approach that can shed light into the origin of ground ice
                                                                      (Lacelle and Vasil’chuk, 2013). Sampling of the massive ice
                                                                      body was done at 10 cm vertical intervals or less, depending
every 10 cm or less from depths ranging from 1 to 3 m below           on the unit change; prior to sampling, at least 10 cm of the
the surface (Fig. 2) without reaching the bottom of the ice           ice surface was removed with an ice axe. In 2013, all sam-
body. For comparison, modern glacier ice (englacial ice) was          ples (n = 80) were melted, filtered (0.45 µm diameter filter)
sampled from freshly collapsed ice blocks at the margin of            and acidified in the laboratory in sealed polyethylene bot-
glacier C-93 located a few kilometres up the valley (Fig. 1c).        tles prior to analyses. The concentration of major cations in
Wedge ice, segregated ice and snow were also sampled for              the ice and snow (Altot , Ca2+ , Fetot , K+ , Mg2+ , Mntot , Na+ )
geochemical analysis at the site located near (< 1 km) the            was determined by inductively coupled plasma optical emis-
massive ice exposure. Samples (n = 5) from the sediments              sion spectrometry (Vista Pro ICP-OES) at the University of
(units B and C) overlying the massive ice were collected              Ottawa. Solutes are expressed in milligrams per litre and an-
and characterized. All samples were kept frozen, shipped and          alytical reproducibility was ±1 %. The stable isotope ratios
stored in our laboratory for further analysis.                        of oxygen (18 O/16 O) and hydrogen (D/H) were determined
   A cryostratigraphic approach was used to describe the              using a Los Gatos Research high-precision liquid water ana-
massive-ice body and the overlying sediments (Fortier et al.,         lyzer coupled to a CTC LC-PAL autosampler. The results are
2012; French and Shur, 2010; Gilbert et al., 2016; Murton             presented using the δ-notation (δ 18 O and δD), where δ repre-
and French, 1994). Cryostratigraphic units were delineated            sents the parts per thousand differences for 18 O/16 O or D/H
based on cryostructures and cryofacies. Cryofacies are bod-           in a sample with respect to Vienna Standard Mean Ocean
ies of frozen sediment that are visually distinct from adjacent       Water (VSMOW). Analytical reproducibility for δ 18 O and
frozen sediments based on their cryostructures, volumetric            δD was ±0.3 ‰ and ±1 ‰, respectively.
ice content, ice-crystal size and sediment texture. Cryostruc-           The origin of the sediment overlying the massive ice was
tures refer to the shape, amount and distribution of ice within       inferred from particle-size distribution, the clasts and sand-
the frozen sediment. Gas inclusions visible within the ice and        size quartz grain morphoscopy and the geochemical and iso-
the deformation structures in the ice and sediments were also         topic (δD-δ 18 O) composition of pore water. Particle-size dis-
described (Hambrey and Lawson, 2000). To further investi-             tributions were determined by dry sieving at 1/2ϕ intervals
gate the cryostratigraphic characteristics of the massive ice         (size ranges −12 to 4ϕ). The hydrometer method was used
body, all samples were observed under X-ray-computed to-              to determine the distribution of the finer particles smaller
mography (CT) scanning (Siemens SOMATOM Sensation                     than 4ϕ (ASTM Standard D422, 2007). Descriptive statistics

The Cryosphere, 13, 97–111, 2019                                                              www.the-cryosphere.net/13/97/2019/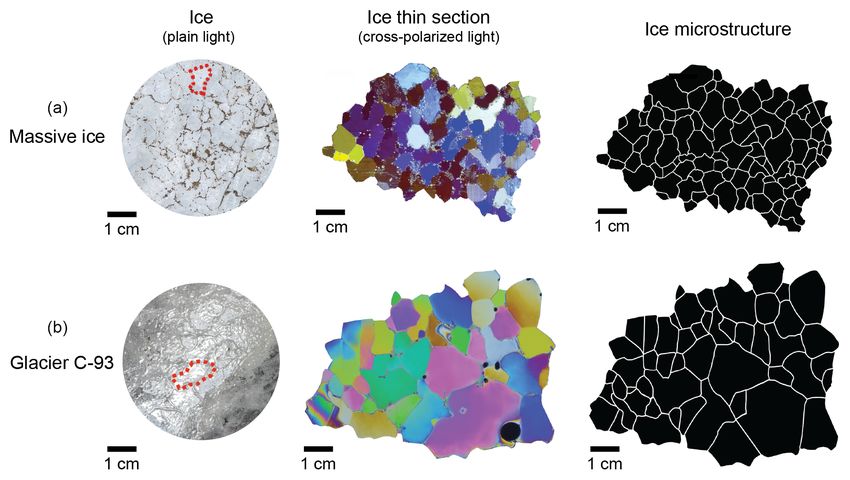
S. Coulombe et al.: Buried Pleistocene glacier ice in the permafrost of Bylot Island 101
Figure 4. Comparison between the massive ice body and modern
glacier ice (glacier C-93, Bylot Island). The first column shows un-
processed photographs of the ice taken under a plain light with sur-
ficial sediment inclusions highlighting the crystal boundaries. The
dotted red line highlights one crystal. The second column shows
thin sections of ice sample viewed under direct cross-polarized
light. The third column shows the microstructure (crystal bound-
aries) extracted from the thin-section photograph.
Figure 3. Photographs (left) and CT scans (right) of the massive ice
body. (a) Pure-ice facies. The dotted red line highlights one single
crystal; (b) ice-poor sediment (sands and gravels) with suspended
content (Fig. 3a). With a volumetric ice content near 100 %,
and crustal cryostructures forming a band in the massive ice. it refers to the “pure ice” cryofacies described by Mur-
ton and French (1994). Occasional thin bands of sediments
(sands and gravels) with suspended and crustal cryostruc-
(mean grain size, sorting, skewness) and Folk and Ward sedi- tures were cutting across the ice (Fig. 3b). These discrete
ment classes were determined using the RYSGRAN package and planar bands were < 2 cm thick, subparallel to one an-
for R (Gilbert et al., 2014; R Development Core Team, 2016). other and showed a dip direction (21 to 31◦ ) down the ice
Fifty in situ pebble- to cobble-sized clasts were randomly body in the south-eastern direction. Crystallographic analy-
collected from the uppermost unit (Unit C). These clasts sis of thin sections of the massive ice under cross-polarized
were analyzed for shape, roundness and lithology using tech- light showed that the crystals had mostly bluish colours, sug-
niques described by Benn (2004). Morphoscopic analyses gesting that the ice crystals had similar orientations (Figs. 4
of small quartz grains (0.5–1.0 mm) were conducted using and 5a). Coarse-grained ice crystals characterized the mas-
a binocular microscope (Cailleux and Tricart, 1963). Addi- sive ice body: long-axis average of 7.97 ± 2.97 mm (3.13–
tionally, the ground ice in the sediments was analyzed for 16.58 mm); average surface area of 34.9 ± 25 mm2 (5.8 and
soluble ions (major cations) and δD-δ 18 O composition fol- 153.5 mm2 ); and average circularity ratio of 0.65 ± 0.09, in-
lowing the method described above. A fragment of poorly dicating the crystals were relatively rounded (Fig. 6). No
decomposed peat sampled in unit B was radiocarbon dated significant differences in the shape properties (surface area,
by accelerator mass spectroscopy (AMS) (ULA-6505, Cen- long axis, circularity ratio) were observed between the hori-
tre for Northern Studies, Université Laval). Radiocarbon age zontal and vertical thin sections (Mann–Whitney–Wilcoxon
was calculated as −8033ln (F14 C) and reported in 14 C yr BP test, p > 0.05), indicating that the ice crystals were nearly
(BP = AD 1950) (Stuiver and Polach, 1977) and then cor- equiaxial. The glacier C-93 ice displayed ice crystals with
rected to calendar years (cal yr BP) using Calib 7.10 and the varying colours (Fig. 4). The ice crystals were larger (av-
IntCal13 calibration curve (Reimer et al., 2013; Stuiver et erage surface area of 125.29 ± 148 mm2 ) than those of the
al., 2017). massive ice body (Figs. 4 and 6). Glacier C-93 ice con-
sists of relatively rounded crystals as their mean circularity
ratio averaged 0.65 ± 0.01. The total volumetric content of
4 Results gas inclusions varied from 2 % to 10 % for both the massive
ice and glacier C-93 ice, with bubbles being mostly located
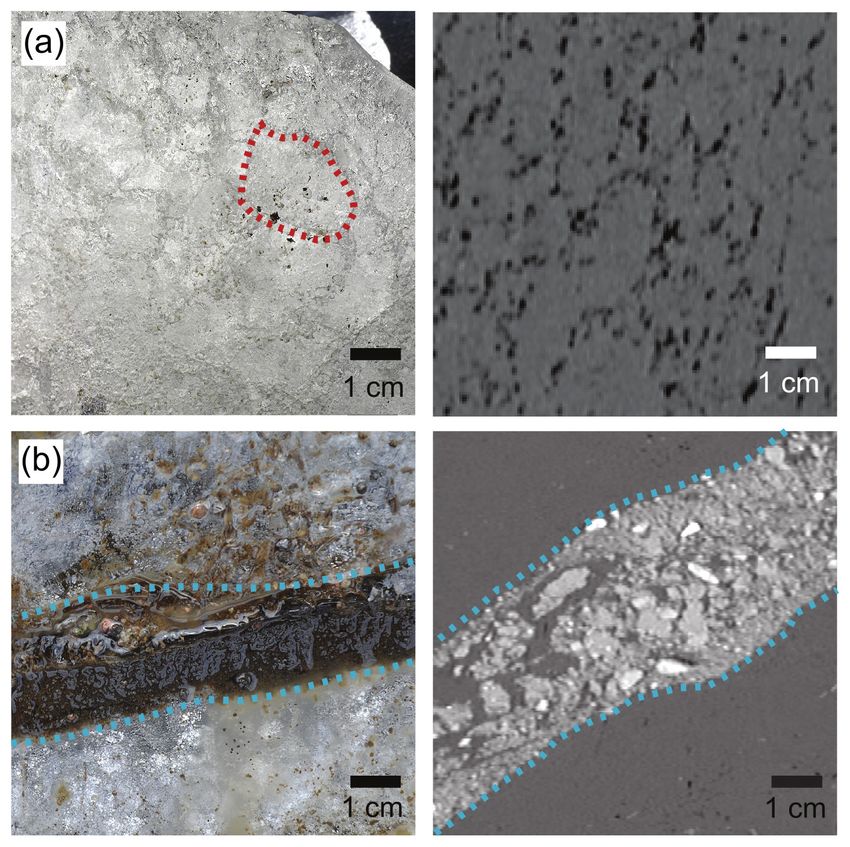
4.1 Cryostratigraphy and properties of the massive ice along grain boundaries (Fig. 5a). The massive ice body con-
body tained three types of gas inclusions: (A) spherical bubbles,
(B) flattened disks and (C) clusters of deformed and coa-
The exposed massive ice body (unit A) was > 10 m thick and lescent bubbles (Fig. 5b, c, d). The tiny gas bubbles had a
had a clear to milky white appearance due to its high bubble mean surface area of 0.85 ± 1.04 mm2 with circularity ratio
www.the-cryosphere.net/13/97/2019/ The Cryosphere, 13, 97–111, 2019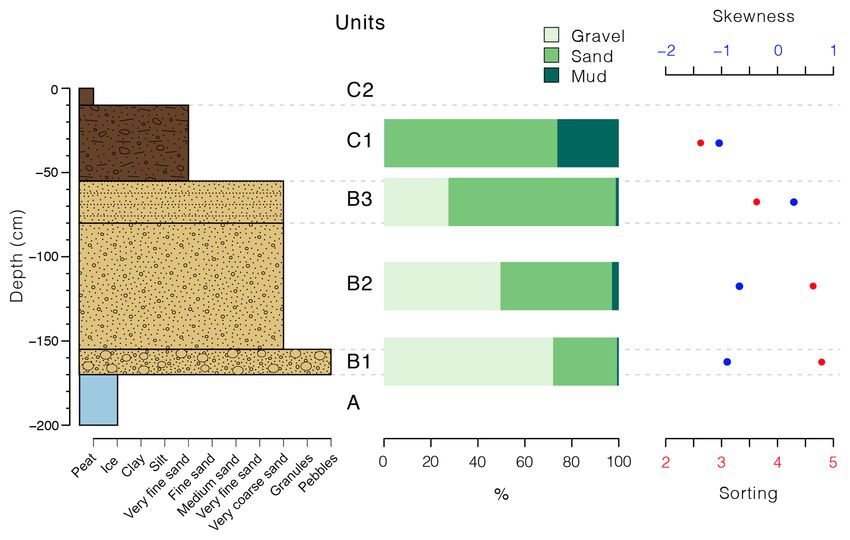
102                                        S. Coulombe et al.: Buried Pleistocene glacier ice in the permafrost of Bylot Island

                                                                        Figure 6. Box plots comparing the distribution of ice crystal charac-
Figure 5. (a) A thin section of the massive ice viewed under cross-     teristics (area, long axis, circularity ratio) of horizontal thin sections
polarized light and a transverse cross section from a scan showing      (H) and vertical thin sections (V) obtained from massive ice sam-
the gas inclusions within the ice. (air is black; ice is dark grey).    ples. C-93 represents data obtained from a sample of modern glacier
Photos to the right show patterns of gas inclusions; (b) small (sub-    ice sampled from glacier C-93.
millimetre to millimetre) spherical bubbles (vertical bars are from
measuring ruler of microscope stage); (c) small disks up to 6 mm in
diameter; (d) coalescent bubbles and small disks all flattened in the
same direction.
                                                                        tween 19 and 55 cm (mean: 30 ± 9 cm). A sharp, subplanar
                                                                        and unconformable contact separated the ice from the over-
averaging 0.89 ± 0.17. Gas bubbles observed in glacier C-               lying sediments (units B and C) along the exposed section
93 were mostly spherical and small, with a few clusters of              (Fig. 2). Unit B (∼ 115 cm thick) directly overlaid the mas-
deformed coalescent bubbles. The gas bubbles had a mean                 sive ice body and has ice-poor sediment cryofacies with a
surface area of 0.13 ± 0.41 mm2 and an average circularity              structureless cryostructure, essentially made of pore ice. Unit
ratio of 0.89 ± 0.18.                                                   B is subdivided into three subunits: B1 is coarse sandy gravel,
   Major cations in the massive ice body (i.e. Ca2+ , Na+               B2 is sandy gravel, and B3 is stratified gravelly sand. All sub-
Mg2+ and K+ ) all occurred in low concentrations (mean <                units were texturally similar, consisting mostly of sands and
1.76 mg L−1 ; Fig. 7). The cation concentrations of glacier C-          gravels, with silt- and clay-sized particles constituting < 3 %
93 ice were very similar to those of the massive ice, whereas           of the sediment (Fig. 9). The grain-size fraction > 32 mm
the ice wedge had slightly higher cation concentrations, with           was not included in profile distribution, but abundant cob-
average concentrations ranging from 1.11 ± 0.18 mg L−1 for              bles were observed within the bottom subunits. Sediments
Mg2+ , to 3.32±0.44 mg L−1 for Ca2+ . The δD-δ 18 O compo-              were poorly sorted to very poorly sorted (sorting values rang-
sition of the massive ice, along with those from glacier C-93           ing between 3 and 5) and were coarser at the base and finer
and other types of ground ice present in the valley are shown           near the top (Fig. 9). Subunits B1 and B2 were both char-
in Fig. 8b. The δ 18 O composition of the massive ice had a             acterized by unstratified sandy gravel that became finer to-
narrow range (average δ 18 O: −34.0 ± 0.4 ‰) with D-excess              wards the uppermost subunit B3 , which consisted of strati-
(d = δD – 8δ 18 O) averaging 6.6 ± 2.5 ‰. The δ 18 O compo-             fied gravelly sand with thin subhorizontal laminae (< 1 cm).
sition of the massive ice was much lower than that of the               Morphoscopic analysis of subunit B3 showed that quartz
snow (average δ 18 O: −30.4±1.8 ‰), ice-wedge ice (average              grains were mostly angular (70 %) to subangular (smooth
δ 18 O: −25.6 ± 0.95 ‰) and glacier C-93 ice (average δ 18 O:           and polished, glazing grains: 25 %). Rounded and frosted
−25.0 ± 3.1 ‰). The D-excess of snow, ice wedge, glacier                grains represented < 5 % of the total sand fraction. Plants
C-93 and ground ice (unit B) samples averages 8.9 ± 3.4 ‰;              fragments located at the base of subunit B3 were dated to
9.3±7.1 ‰, 5.2±5.8 ‰ and −52.4±31.4 ‰ respectively. In                  885 ± 1514 C yr BP (1164 cal yr BP; 1σ range: 1058–1204).
a δD-δ 18 O diagram, the samples from the massive ice, glacier          The sand and gravel sequence of unit B was sharply overlain
C-93, snow and ice wedges were distributed along linear re-             by ∼ 55 cm of an unstratified (massive) thawed diamicton,
gression slope values of 6.0 (R 2 = 0.44), 7.1 (R 2 = 0.95),            with abundant pebble- to cobble-sized clasts (unit C; Figs. 2
6.6 (R 2 = 0.96) and 5.2 (R 2 = 0.36) respectively.                     and 9). The matrix (sandy silt) was very poorly sorted and
                                                                        the grain-size distribution tended to be fine skewed. Clasts
4.2   Cryostratigraphy and properties of the overlying                  had a wide range of shapes, with predominance in the suban-
      sediments                                                         gular and subrounded classes (76 %). Only 24 % of all clasts
                                                                        were rounded or angular. Gneiss was the dominant cobble
The massive ice body was covered by ∼ 1.7 m of sediments.               type with an average of 60 % in the matrix, whereas sedi-
The thaw depths measured in late July (2013) ranges be-                 mentary and igneous rocks averaged 36 % and 4 %. A thin,

The Cryosphere, 13, 97–111, 2019                                                                  www.the-cryosphere.net/13/97/2019/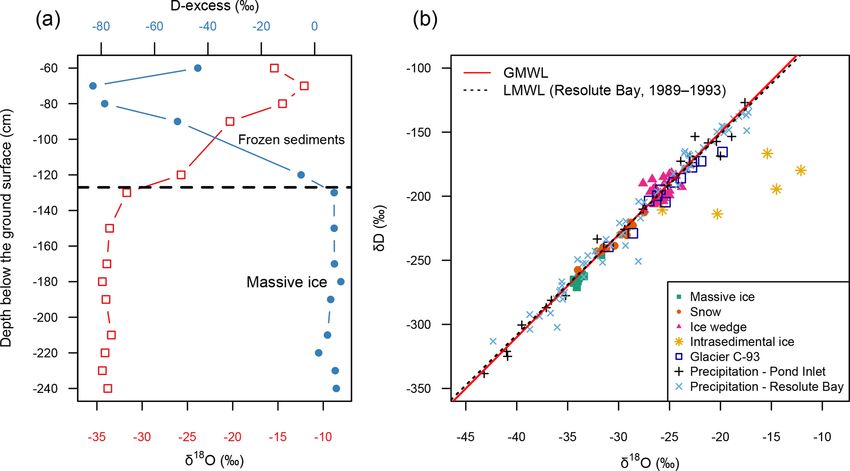
S. Coulombe et al.: Buried Pleistocene glacier ice in the permafrost of Bylot Island                                                  103

Figure 7. Box plots showing soluble cation concentration of the massive ice, ice wedge, glacier C-93 and intrasedimental ice sampled within
the sediments layers covering the massive ice unit.

Figure 8. (a) δ 18 O and D-excess depth profiles including both the massive ice unit and the intrasedimental ice from the sediment cover;
(b) δ 18 O-δD diagram of the massive ice and other types of ground ice (ice wedge, intrasedimental ice), snow and modern glacier ice (C-93)
sampled on Bylot Island. The solid red line represents the Global Meteoric Water Line (GMWL): d = δD–8δ 18 O+10 (Dansgaard, 1964).
Also shown are the δ 18 O and δD values of precipitation recorded at Pond Inlet (1990–1992) and Resolute Bay (1989–1993; IAEA/WMO,
2016). LMWL is the local meteoric water line for Resolute Bay, Nunavut (δD = 7.8δ 18 O +5.33; IAEA/WMO, 2016) and Pond Inlet, Nunavut
(δD = 8.0δ 18 O +10.55; IAEA/WMO, 2016).

continuous and irregular layer of dark fibrous peat with roots          5     Discussion
(subunit C2) overlaid the diamicton.
   Supernatant water samples (n = 5) from the ice-poor sed-             5.1    Origin of the massive ice
iments in unit B showed markedly higher δ 18 O and cation
values compared to the underlying massive-ice body (Figs.
                                                                        The cryostratigraphic and crystallographic properties of the
7 and 8a). In unit B, the δ 18 O values became progressively
                                                                        massive ice along with its isotopic and geochemical com-
higher, from −25.7 ‰ to −15.4 ‰, as we moved upward
                                                                        position indicate that the exposed ice consists of relict Pleis-
from the ice–sediment contact towards the surface (Fig. 8a).
                                                                        tocene englacial ice buried and preserved in the permafrost of
The cations content in the ice-poor sediment was 1 to 2 or-
                                                                        Bylot Island. Table 1 summarizes the cryostratigraphic and
ders of magnitude higher than in the massive ice and also
                                                                        crystallographic properties of different types of tabular mas-
shifted to higher concentrations towards the surface (Fig. 7).
                                                                        sive ice described in the literature: buried glacier ice (basal

www.the-cryosphere.net/13/97/2019/                                                                 The Cryosphere, 13, 97–111, 2019
S. Coulombe et al.: Buried Pleistocene glacier ice in the permafrost of Bylot Island
www.the-cryosphere.net/13/97/2019/
Table 1. Comparisons of the physical properties of different massive tabular ground ice found in the permafrost.
Ice type General appearance Texture Fabric Gas inclusions Reference (location, country)
Intrasedimental Massive – Clear – Variable crystal size but – Preferred – Bubble-poor to bubble-rich Pollard, 1990 (Hershel Island,
ice segregated- – Sediment-free to mostly medium to large near-vertical – Small (millimetre to cen- Canada)
intrusive ice sediment-poor grains (centimetre scale) oriented timetre scale) Yoshikawa, 1993 (Spitsbergen,
– Slightly c-axis1 – Elongated and tubular Norway)
elongated crystals1 bubbles1 Harry et al., 1988 (Yukon Coastal
– Ahnedral to subhedral – Trains of small spherical Plain, Canada)
bubbles1 Gell, 1976 (Mackenzie Delta,
– Inter- and intra-crystalline Canada)
Dallimore and Wolfe, 1998
(Richards Island, Canada)
Buried surface Buried – Clear to milky white – Wide range of crystal – Random or – Bubble-poor to bubble-rich Pollard, 1990 (Hershel Island,
ice glacier ice – Deformation structures2 sizes (submillmetre to tens preferred – Located at crystal junctions Canada)
(englacial) – Foliations of bubble-poor of centimetres) c-axis – Bubbles truncated at the ice– Gow, 1963 (Ross Ice Shield,
and bubble-rich ice – Mostly large grains orientation3 sediment contact Antarctica)
(centimetre scale) Tison and Hubbard, 2000
– Equigranular (Glacier de Tsanfleuron,
Interlocked crystal bound- Switzerland)
aries
Buried – High sediment content – Small grains – Weak to strongly – Bubble-free to bubble-poor Sharp et al., 1994 (Variegated
glacier ice – Debris laminations (millimetre scale) oriented c-axis – Small (µm to millimetre Glacier, U.S.A.)
(basal) – Deformation structures2 – Ahnedral to subhedral scale) Sugden et al., 1995 (Beacon
– Suspended pebbles and – Flattened bubbles Valley, Antarctica)
cobbles – Bubbles truncated at the ice– Murton et al., 2005 (Tuktoyaktuk
sediment contact Coastlands, Canada)
– Located at crystal junctions Ingólfsson and Lokrantz, 2003
(Yugorski Peninsula, Russia)
Buried – Milky white to light – Small grains – Random c-axis – Bubble-rich Lacelle et al., 2009 (central
The Cryosphere, 13, 97–111, 2019
snowbank brown (millimetre scale) orientation – Layers of bubbles and Yukon, Canada)
– Loosely compacted – Crystal size area usually dispersed in the ice Pollard and Dallimore, 1988
structure reaches a few mm2 – Small spherical bubbles (Yukon Coastal Plain, Canada)
– Bands of nearly horizon- – Subhedral to euhedral (µm- to millimetre scale) Ostrem, 1963 (Barnes Ice Cap,
tal pale brown ice – Equigranular – Elongated and tubular Canada; Kebnekaise, Sweden;
– Organic inclusions (e.g. bubbles Jotunheimen, Norway)
twigs and leaf fragments) – Vertically oriented bubbles
1 Parallel to the heat flow direction, indicating that freezing is downward. 2 Occurrences of debris bands, boudinage and pinch-and-swell structures, folding and thrust faulting. 3 Depending on the position of the ice within the glacier or ice sheet at the time it
becomes buried.
104S. Coulombe et al.: Buried Pleistocene glacier ice in the permafrost of Bylot Island 105 Figure 9. Sedimentological data from the stratigraphic section. From left to right: a stratigraphic log showing the mean grain size of each unit; gravel, sand and mud percentages; and skewness and sorting. and englacial), massive segregated-intrusive ice and buried calculated between δD-δ 18 O of the buried ice, lower than snowbanks. The appearance and structure of the buried mas- the Global Meteoric Water Line (slope = 8; Craig, 1961), sive ice body are similar to those of englacial ice typically this was due to the small range of the data (δ 18 O: −34.4 ‰ observed at the margin of glaciers, ice caps or ice sheets. to −33.4 ‰), which prevented the calculation of a reliable The buried massive ice body has a whitish appearance ow- regression slope. The δD-δ 18 O values of the buried mas- ing to its high concentration of air bubbles. Coarse-bubbly sive ice are similar to those of Pleistocene-age ice from the ice is the most abundant type (90 %–95 %) of englacial ice Barnes Ice Cap on the adjacent Baffin Island (median δ 18 O: found in glaciers (Allen et al., 1960). Our results also show −33.1 ‰; Zdanowicz et al., 2002). This is supported by the that the cross-sectional area of the crystals of the buried mas- average D-excess of 6.6 ± 2.5 ‰ for the buried massive ice, sive ice is smaller than that of neighbouring C-93 glacier ice, which is within the range of the values of Barnes Ice Cap but there is no significant difference in their circularity ra- (Lacelle et al., 2018) and glacier C-93 (5.2 ± 5.8 ‰) on By- tio (Mann–Whitney–Wilcoxon test, p = 0.89). However, the lot Island. difference in ice crystal size is not unforeseen since the ones The average δ 18 O value of the buried massive ice (−34.0± from glacier ice can show variations of the order of a few 0.4 ‰) is much lower than that of the other ice types sampled millimetres to several centimetres in diameter (Gow, 1963; in the study area (Fig. 8b). The δ 18 O values of the buried Thorsteinsson et al., 1997). Patterns of preferred crystal ori- massive ice are also lower than in the ice of Penny Ice Cap entation combined with the occurrence of deformation fea- from the last glacial period (δ 18 O ∼ −31.3 ± 1.1 ‰; Fisher tures in the form of debris bands suggest that the ice has been et al., 1998), but in the range of the late Pleistocene ice of subjected to long-continued shear stress caused by the mo- Barnes Ice Cap (Zdanowicz et al., 2002). The late Pleistocene tion of a glacier (Benn and Evans, 2010; Lawson, 1979). The δ 18 O values on Barnes Ice Cap were 6 ‰–10 ‰ lower than debris bands cross-cutting the buried glacier ice are compa- the expected δ 18 O [modern – last glacial maximum] and in- rable to those observed in the terminus zone of Stagnation terpreted to be the product of two factors: (1) temperature ef- Glacier on Bylot Island, where basal sediments were trans- fect – cold climate during the last glacial period that caused a ported to the glacier surface through shear planes (Moorman δ 18 O shift of 6 ‰–7 ‰ at that latitude (Fisher and Alt, 1985) and Michel, 2000). – and (2) elevation effect – ice sourced from higher eleva- Cations and stable water isotopes measured in the buried tion on Foxe Dome (∼ 2200–2400 m), which caused an ad- massive ice also support its glacial origin. The low cation ditional depletion in δ 18 O of local precipitation (Hooke and content in the buried massive ice is statistically similar to Clausen, 1982; Zdanowicz et al., 2002). Klassen (1993) sug- that of the ice of glacier C-93. Although a slope of 6.0 was gested that the alpine glaciers on Bylot Island were larger www.the-cryosphere.net/13/97/2019/ The Cryosphere, 13, 97–111, 2019
106                                     S. Coulombe et al.: Buried Pleistocene glacier ice in the permafrost of Bylot Island

but did not change much in elevation during the late Pleis-           A clear discontinuity in the δ 18 O and cations profiles is ob-
tocene; however, the δ 18 O values of our buried ice require       served at the ice–sediment contact and in the overlying units
ice sourced from elevations in the 2150–2350 m range and           (Figs. 7 and 8a). Strong contrasting profiles between buried
as such was likely sourced from the Foxe Dome (Lacelle             ice and the overlying sediment are related to different sources
et al., 2018). Mega-scale glacial lineations and streamlined       of water and formation history. The supernatant water from
landforms were mapped on the floor of Navy Board Inlet,            the ground ice in the overlying sediments (units B and C) has
Eclipse Sound and Lancaster Sound by De Angelis and Kle-           much higher average δ 18 O values of −17.6 ± 5.4 ‰. These
man (2007) and interpreted as a product of LIS ice streams.        values are comparable to δ 18 O values obtained from pre-
We proposed that the study area was most likely an area            cipitation at Pond Inlet between 1990 and 1992 (−23.8 ‰;
of confluence of LIS ice and local alpine glaciers during          IAEA/WMO, 2016) and modern segregation ice which gen-
the LGM as an ice stream moved through Navy Board In-              erally has δ 18 O values of −18 ‰ to −22 ‰ (Michel, 2011).
let and onto south-western Bylot as proposed by Dyke and           The average concentrations of Ca2+ , Na+ Mg2+ and K+ in
Hooper (2001).                                                     units B and C are 10–86 times greater than those in the buried
                                                                   glacier ice. The substantial increase observed in the cation
                                                                   content from the sediment layers can be attributed to the great
5.2   Burial and preservation of late Pleistocene glacier
                                                                   amount of mineral dissolution before the water freezes (La-
      ice in permafrost
                                                                   celle and Vasil’chuk, 2013).
                                                                      The formation of these ice-cored landforms follows a typ-
The texture (sand and gravel), stratification and poorly sorted    ical sequence of events where the ice is first buried under
nature of the sediments (unit B) directly overlying the buried     a sufficient amount of sediments exceeding the active-layer
glacier ice suggest a glaciofluvial ice-contact deposit. Simi-     thickness (Lukas et al., 2005; Benn and Evans, 2010). Be-
lar sediment characteristics were obtained by Fortier and Al-      yond the active margins of many glaciers and ice sheets,
lard (2004) for glaciofluvial sands (angular grains: 75 %) lo-     there are broad areas of glacial deposits, till and outwash
cated a few kilometres away from the study site. The abun-         underlain by glacier ice. Gravitational and glaciofluvial pro-
dance of angular grains (70 %) in unit B indicates little abra-    cesses are often identified as the most important processes
sion, which is consistent with transport by glaciofluvial water    of sediment deposition and reworking that lead to the burial
whereby grains were carried over short distances allowing          of englacial ice (Benn and Evans, 2010). In basal zones of
little wear. Furthermore, the sharp and unconformable con-         glaciers and ice sheets, in situ melting of stagnant debris-rich
tact between the buried glacier ice and the overlying sedi-        basal ice produces a supraglacial sediment cover (i.e. melt-
ment suggests that thermal erosion caused by sediment-laden        out till) that accumulates on the ice, which inhibits its abla-
water flow affected the top of the ice of unit A. Our inter-       tion. Both stagnant englacial and basal ice becomes progres-
pretation is similar to other studies that reported the burial     sively isolated from the upper active-flowing ice. These ice-
of glacier ice by glaciofluvial sedimentation (Dallimore and       cored landforms adjust to non-glacial conditions and their
Wolfe, 1988; Kaplanskaya and Tarnogradskiy, 1986; Ingólf-          evolution is strongly linked with climate-driven processes
sson and Lokrantz, 2003; Belova et al., 2008). The upper-          (e.g. active-layer deepening due to warmer atmospheric tem-
most unit (C) is a diamicton, which has undergone reworking        perature or active-layer detachment slides following heavy
by non-glacial processes such as gravitational mass wasting        rains). In the Arctic, large blocks of buried late Pleistocene
(e.g. slumping and solifluction). In ice-contact environments,     glacier ice were left undisturbed for several millennia ow-
the sediment cover is subject to several cycles of subsidence      ing to cold and dry climatic conditions that favoured per-
and redeposition as the ice undergoes progressive and partial      mafrost aggradation following deglaciation. Such ice-cored
melting (Schomacker, 2008). The shape of the clasts found          landforms inherited from the partial melting of buried glacier
within this unit provides evidence that it has experienced ac-     ice are common in formerly glaciated permafrost regions
tive glacial transport, which is also supported by the occur-      across northern Canada and Siberia but their spatial distribu-
rence of erratic clasts (gneiss) derived from distal bedrock lo-   tion remains poorly known (Belova et al., 2008; Ingólfsson
cated several kilometres from the study site. To summarize,        and Lokrantz, 2003; Kokelj et al., 2017; Dyke and Savelle,
large stagnant ice blocks could have been covered by glacio-       2000; Lakeman and England, 2012). In this study, the depo-
genic sediments at or near the ice margins during the advance      sition of a cover of coarse and well-drained sediment exceed-
and stagnation of a glacier within the Qarlikturvik Valley.        ing the average active-layer thickness of the area has proba-
The burial of the ice occurred as meltwater streams deposited      bly been the most important factor limiting the melting of
sediments in direct contact with glacier ice followed by the       the ice. Furthermore, plant colonization and the development
reworking and redeposition of supraglacial sediments, which        of a continuous vegetation cover with organic accumulation
formed a surficial cover of mud and sand, later affected by        have changed the thermal properties of the ground, which re-
cryoturbations as is indicated by the incorporation of or-         duced heat flow from the atmosphere to the permafrost dur-
ganic material dated at 885±1514 C yr BP (1164 cal yr BP; 1σ       ing the summer and favoured heat loss during winter. This
range: 1058–1204).                                                 resulted in a thinner active layer (the permafrost table moved

The Cryosphere, 13, 97–111, 2019                                                           www.the-cryosphere.net/13/97/2019/
S. Coulombe et al.: Buried Pleistocene glacier ice in the permafrost of Bylot Island 107 upward) and ground ice aggradation. The preservation poten- active-layer deepening and increased activity of slope pro- tial of buried glacier ice on a millennial timescale following cesses, such as active-layer detachment slides, thaw slump- the glacial retreat depends on the complex interactions be- ing and thermo-erosional gullying, will very likely expose tween climate, geomorphology and the physical properties buried glacier ice and initiate major landscape changes, with of the sediment cover. Between 1999 and 2016, ground ther- cascade effects on the ecosystems. mal regime monitoring in an intact low-centred polygon near the study site showed maximum active-layer depths varying between 0.3 and 0.7 m, while the buried ice is located > 1 m Data availability. The isotope data are available for download below the ground surface. While the properties of the sedi- at the public data repositories of Nordicana D, managed by ment cover had positive feedback on the long-term preserva- the Centre for Northern Studies (https://doi.org/10.5885/45564CE- tion of the buried ice, thaw slumping activity, and not atmo- 8A9A55185FBD4283; Fortier et al., 2018). spheric temperature per say, was a fundamental driver of its degradation by exposing the ice and accelerating its melting. 6 Conclusions This study confirms that the permafrost of Bylot Island con- tains remnants of Pleistocene glacier ice that survived the last deglaciation. Geomorphic and cryostratigraphic obser- vations along with the crystallographic properties of the massive ice suggest its englacial origin. Evidence that sup- port the englacial origin of the massive ice are (1) sharp and unconformable upper contact between the ice and the overlying glaciofluvial sediments; (2) clear to whitish ice, with large crystals; (3) bubble-rich ice, with small gas in- clusions (∼ mm) mainly located at crystal junctions; (4) oc- casional debris bands of sand and fine gravel cross-cutting older debris-free ice; (5) geochemical similarities with con- temporary glacier ice. The geochemical data show a clear discontinuity at the buried ice–sediment contact as well as the very low cation content similar to that of modern glacier ice. An origin of massive ice from a Pleistocene glaciation is suggested based on the isotope data: the buried englacial ice is strongly depleted in heavy isotopes, similarly to regional Pleistocene glacier ice. Glacier-derived permafrost contains ice that predates the aggradation of the permafrost and rep- resents unique environmental archives to reconstruct palaeo- environmental conditions at the study site. Although stable isotopes cannot yield information on absolute ages, these data show that the glacier ice body originated from an ice stream flowing from the Foxe Dome of the Laurentide Ice Sheet, which was subsequently buried and preserved in the permafrost of Bylot Island for thousands of years. The sedi- mentological data and interpretations presented in this study demonstrate that the first phase in the burial of the ice in- volved glaciofluvial deposition directly on the ice, which was followed by mass wasting and plant colonization. Knowledge regarding the occurrence, origin and preservation of buried glacier ice is of a great interest due to its potential impacts on the landscape stability upon melting. Since Bylot Island has experienced several periods of native and foreign Pleistocene glaciations and based on our findings, we propose that buried glacier ice should occur elsewhere on the island and proba- bly on adjacent Baffin Island. In a context of climate change, www.the-cryosphere.net/13/97/2019/ The Cryosphere, 13, 97–111, 2019
108                                      S. Coulombe et al.: Buried Pleistocene glacier ice in the permafrost of Bylot Island

Appendix A                                                           has been used to segment images into regions of ice, gas and
                                                                     sediment in order to quantify the volumetric content of the
                                                                     sample scanned (Calmels et al., 2010; Dillon et al., 2008).

                                                                     Appendix C

                                                                     The typical method of measuring ice texture and fabric re-
                                                                     quires that an ice core or block is sliced into 1 cm thick
                                                                     vertical and horizontal sections with a band saw and then
                                                                     thinned to the desired thickness (< 0.5 mm) following the
                                                                     standard microtoming procedure. Three photographs were
                                                                     taken of each sample at different angles (0◦ , 45◦ , 90◦ ) un-
                                                                     der cross-polarized light in order to show the crystal bound-
                                                                     aries as clearly as possible. The analysis is based mostly on
                                                                     qualitative observations, although statistics on crystal dimen-
                                                                     sions and geometry were obtained from a digital analysis of
                                                                     thin-section photographs. It should be noted that the values
Figure A1. Grain-size distribution curves of the sedimentary units   obtained from these parameters do not represent exact val-
(two samples per subunit). The gravel fraction was removed prior     ues and give limited information since a thin section is only
to analysis.                                                         a two-dimensional representation of the crystals (sectioning
                                                                     effect). A digital image analysis using ImageJ software al-
                                                                     lowed us to delineate and measure three geometrical param-
Appendix B                                                           eters of each crystal. The area (mm2 ), the long axis (mm)
                                                                     and the circularity ratio determine the crystal texture (size
To further investigate the cryostratigraphic characteristics of      and shape). The long axis is a measurement of the primary
the ice, all samples were observed under X-ray-computed to-          axis of the best-fit ellipse to an ice crystal. The circularity
mography (CT) scanning (Siemens SOMATOM Sensation                    ratio (C) is a dimensionless parameter used to quantitatively
64). This technique relies on the calculation of the linear at-      describe the shape or outline form of a crystal. It is a function
tenuation coefficient that measured the density of an object         of the perimeter P and the area A:
passed through an X-ray beam at different angles. A CT scan
                                                                          4π A
produces cross-sectional images (usually 512 by 512 pixels           C=        .                                                 (C1)
matrix) of an object where each pixel of the image is assigned             P2
an X-ray attenuation value (µ), also called a CT number. CT          As C approaches 1, crystals become more circular, and as it
numbers are then standardized using the Hounsfield scale,            approaches 0, crystals become very narrow relative to their
where the radiodensity of water (µwater ) is arbitrarily defined     length. Therefore, the circularity ratio is a measure of the de-
as 0 HU (Hounsfield units) according to Eq. (1). Different           viation of a crystal cross-section shape from a perfect circle.
shades of grey are assigned specific CT numbers to create
the displayed image using a specific image processing soft-
ware (Fiji) dedicated to DICOM (Digital Imaging and Com-
munications in Medicine) images. In permafrost samples, un-
consolidated sediments and rock (high-density minerals) ap-
pear white, as the attenuation of these materials is very high.
Gases inclusions and water appear black, and other materi-
als, such as ice, can have various shades of grey depending
on their density.
              µ − µwater
HU value =               × 1000                             (B1)
                µwater
This tool helps to refine cryostratigraphic characterization
of permafrost cores as it can reveal characteristics otherwise
difficult or even impossible to observe with the naked eye. It
allows visualization and characterization of the internal com-
ponents of the frozen sample, such as the ice, grain-size vari-
ations and gas inclusions. From a quantitative perspective, it

The Cryosphere, 13, 97–111, 2019                                                            www.the-cryosphere.net/13/97/2019/
S. Coulombe et al.: Buried Pleistocene glacier ice in the permafrost of Bylot Island 109
Author contributions. The study was conceived by SC, DF and DL. Benn, D. I. and Evans, D. J. A.: Glaciers and Glaciations, 2nd ed.,
The manuscript was written by SC and all authors contributed to Hodder Education, London, 2010.
editing and revision. Cailleux, A. and Tricart, J.: Initiation à l’étude des sables et des
galets, Centre de documentation universitaire, 1963.
Calmels, F., Clavano, W., and Froese, D. G.: Progress on X-ray
Competing interests. The authors declare that they have no conflict computed tomography (CT) scanning in permafrost studies, in:
of interest. Proceedings of the Join 63rd Canadian Geotechnical Conference
& 6th Canadian Permafrost Conference, 1353–1358, Calgary,
Alberta., 2010.
Acknowledgements. We are grateful to Etienne Godin, Katryne Cardyn, R., Clark, I. D., Lacelle, D., Lauriol, B., Zdanowicz,
Larrivée, Naïm Perreault, Audrey Veillette, Jonathan Lasnier, C., and Calmels, F.: Molar gas ratios of air entrapped in
Michel Paquette and Sabine Veuille, for their help in the field and ice: A new tool to determine the origin of relict massive
in the laboratory. We also thank the team of Gilles Gauthier (U. ground ice bodies in permafrost, Quaternary Res., 68, 239–248,
Laval) and the staff of the Sirmilik National Park for logistical https://doi.org/10.1016/j.yqres.2007.05.003, 2007.
support and access to Bylot Island. This project was funded by Craig, H.: Isotopic Variations in Meteoric Waters, Science,
ArcticNet, the Natural Sciences and Engineering Research Council 133, 1702–1703, https://doi.org/10.1126/science.133.3465.1702,
of Canada (NSERC), Fonds de Recherche du Québec – Nature et 1961.
technologies (FRQNT), the W. Garfield Weston Foundation and the Dallimore, S. R. and Wolfe, S. A.: Massive ground ice associated
Polar Continental Shelf Program (PCSP), the Northern Scientific with glaciofluvial sediments, Richards Island, N. W. T., Canada,
Training Program (NSTP) of the Canadian Polar Commission, in Proceedings, Fifth International Permafrost Conference, Tapir,
the NSERC Discovery Frontiers grant “Arctic Development and Trondheim, Norway, Vol. 1, 132–137, 1988.
Adaptation to Permafrost in Transition” (ADAPT). Finally, this De Angelis, H. and Kleman, J.: Palaeo-ice streams
paper has benefited from constructive comments from Michael in the Foxe/Baffin sector of the Laurentide Ice
Fritz and one anonymous reviewer. We would also like to thank the Sheet, Quaternary Sci. Rev., 26, 1313–1331,
handling editor, Julia Boike. https://doi.org/10.1016/j.quascirev.2007.02.010, 2007.
Dillon, M., Fortier, D., Kanevskiy, M., and Shur, Y.: Tomodensito-
Edited by: Julia Boike metric Analysis of Basal Ice, in: Proceedings, Ninth International
Reviewed by: Michael Fritz and one anonymous referee Conference on Permafrost, 361–366, Fairbanks, USA, 2008.
Duclos, I., Lévesque, E., Gratton, D., and Bordeleau, P.-A.: Vege-
tation mapping of Bylot Island and Sirmilik National Park: Final
report, Unpublished report, Parks Canada, Iqaluit, 2006.
References Dansgaard, W.: Stable isotopes in precipitation, Tellus, 16, 436–
468, https://doi.org/10.1111/j.2153-3490.1964.tb00181.x, 1964.
Allard, M.: Geomorphological changes and permafrost dynamics: Dyke, A. S. and Hooper, J. M. G.: Deglaciation of North-
key factors in changing arctic ecosystems. An example from west Baffin Island, Nunavut, Geological Survey of Canada,
Bylot Island, Nunavut, Canada, Geoscience Canada, 205–212, https://doi.org/10.4095/212484, 2001.
1996. Dyke, A. S. and Savelle, J. M.: Major end moraines of Younger
Allard, M., Sarrazin, D., and L’Herault, E.: Borehole and near- Dryas age on Wollaston Peninsula, Victoria Island, Cana-
surface ground temperatures in northeastern Canada, Nordicana dian Arctic: implications for paleoclimate and for forma-
D8, 2016. tion of hummocky moraine, Can. J. Earth Sci., 37, 601–619,
Allen, C. R., Kamb, W. B., Meier, M. F., and Sharp, R. P.: Structure https://doi.org/10.1139/cjes-37-4-601, 2000.
of the lower Blue glacier, Washington, The J. Geol., 68, 601–625, Environment Canada: Canadian Climate Normals Pond Inlet Sta-
https://doi.org/10.1086/626700, 1960. tion Data, available at: http://climate.weather.gc.ca/climate_
Alley, R. B., Lawson, D. E., Evenson, E. B., Strasser, J. C., and Lar- normals/ (last access: 8 February 2018), 2015.
son, G. J.: Glaciohydraulic supercooling: a freeze-on mechanism Everest, J. and Bradwell, T.: Buried glacier ice in southern Ice-
to create stratified, debris-rich basal ice: II. Theory, J. Glaciol., land and its wider significance, Geomorphology, 52, 347–358,
44, 563–568, 1998. https://doi.org/10.1016/S0169-555X(02)00277-5, 2003.
Astakhov, V. I.: Geological conditions for the burial of Pleistocene Fisher, D. A. and Alt, B. T.: A global oxygen isotope model –
glacier ice on the Yenisey, Polar Geogr. Geol., 10, 286–295, Semi-empirical, zonally averaged, Ann. Glaciol., 7, 117–124,
https://doi.org/10.1080/10889378609377298, 1986. doi:https://doi.org/10.3189/S0260305500006017, 1985.
ASTM Standard D422: Standard test method for particle-size anal- Fisher, D. A., Koerner, R. M., Bourgeois, J. C., Zielinski,
ysis of soils, available at: https://www.astm.org/ (last access: G., Wake, C., Hammer, C. U., Clausen, H. B., Gundestrup,
8 February 2018), 2007. N., Johnsen, S., Goto-Azuma, K., Hondoh, T., Blake, E.,
Belova, N. G., Solomatin, V. I., and Romanenko, F. A.: Massive and Gerasimoff, M.: Penny Ice Cap Cores, Baffin Island,
ground ice on the Ural coast of Baydaratskaya Bay, Kara Sea, Canada, and the Wisconsinan Foxe Dome Connection: Two
Russia, in: Proceedings of Ninth International Conference on States of Hudson Bay Ice Cover, Science, 279, 692–695,
Permafrost, 1, 107–112, 2008. https://doi.org/10.1126/science.279.5351.692, 1998.
Benn, D. I.: Clast morphology, in: A Practical Guide to the Study Fortier, D. and Allard, M.: Late Holocene syngenetic ice-
of Glacial Sediments, edited by: Evan, D. J. A. and Benn, D. I., wedge polygons development, Bylot Island, Canadian
2004.
www.the-cryosphere.net/13/97/2019/ The Cryosphere, 13, 97–111, 2019You can also read