ORIGINAL ARTICLE Rapid succession drives spring community dynamics of small protists at Helgoland Roads, North Sea - AWI
←
→
Page content transcription
If your browser does not render page correctly, please read the page content below
Journal of
Plankton Research

                                                                                                                                                        Downloaded from https://academic.oup.com/plankt/article-abstract/42/3/305/5836911 by Alfred Wegener Institut fuer Polar- und Meeresforschung Bibliothek user on 23 July 2020
                                                                                             academic.oup.com/plankt

J. Plankton Res. (2020) 305–319. First published online May 14, 2020 doi:10.1093/plankt/fbaa017

ORIGINAL ARTICLE
Rapid succession drives spring
community dynamics of small protists at
Helgoland Roads, North Sea
LAURA KÄSE   1, *, ALEXANDRA C. KRABERG2 , KATJA METFIES2,3 , STEFAN NEUHAUS2 , PIM A.A. SPRONG2 ,

BERNHARD M. FUCHS4 , MAARTEN BOERSMA1,5 AND KAREN H. WILTSHIRE1,6
1
  alfred-wegener-institut, helmholtz-zentrum für polar- und meeresforschung, biologische anstalt helgoland, 27498 helgoland,
germany, 2 alfred-wegener-institut, helmholtz-zentrum für polar- und meeresforschung, 27570 bremerhaven, germany,
3
  helmholtz-institut für funktionelle marine biodiversität, 26129 oldenburg, germany, 4 department of molecular ecology, max planck
institute for marine microbiology, 28359 bremen, germany, 5 university of bremen, 28359 bremen, germany, and 6 alfred-wegener-institut,
helmholtz-zentrum für polar- und meeresforschung, wadden sea station, 25992 list auf sylt, germany

*corresponding author: laura.kaese@awi.de

Received October 14, 2019; editorial decision March 13, 2020; accepted March 13, 2020

Corresponding editor: John Dolan

The dynamics of diatoms and dinoflagellates have been monitored for many decades at the Helgoland Roads Long-
Term Ecological Research site and are relatively well understood. In contrast, small-sized eukaryotic microbes and
their community changes are still much more elusive, mainly due to their small size and uniform morphology, which
makes them difficult to identify microscopically. By using next-generation sequencing, we wanted to shed light on
the Helgoland planktonic community dynamics, including nano- and picoplankton, during a spring bloom. We took
samples from March to May 2016 and sequenced the V4 region of the 18S rDNA. Our results showed that mixotrophic
and heterotrophic taxa were more abundant than autotrophic diatoms. Dinoflagellates dominated the sequence
assemblage, and several small-sized eukaryotic microbes like Haptophyta, Choanoflagellata, Marine Stramenopiles
and Syndiniales were identified. A diverse background community including taxa from all size classes was present
during the whole sampling period. Five phases with several communities were distinguished. The fastest changes in
community composition took place in phase 3, while the communities from phases 1 to 5 were more similar to each
other despite contrasting environmental conditions. Synergy effects of next-generation sequencing and traditional
methods may be exploited in future long-term observations.

KEYWORDS: phytoplankton; diversity; German bight; Illumina MiSeq sequencing; Long-Term Ecological Research
(LTER)

available online at academic.oup.com/plankt
© The Author(s) 2020. Published by Oxford University Press.
This is an Open Access article distributed under the terms of the Creative Commons Attribution License (http://creativecommons.org/licenses/by/4.0/),
which permits unrestricted reuse, distribution, and reproduction in any medium, provided the original work is properly cited.
JOURNAL OF PLANKTON RESEARCH           VOLUME 42      NUMBER 3     PAGES 305–319      2020

INTRODUCTION                                                       and Wiltshire, 2019). Traditionally in spring blooms in

                                                                                                                                  Downloaded from https://academic.oup.com/plankt/article-abstract/42/3/305/5836911 by Alfred Wegener Institut fuer Polar- und Meeresforschung Bibliothek user on 23 July 2020
                                                                   temperate regions, e.g. at the Long-Term Ecological
Planktonic eukaryotic microbes as encompassed by                   Research (LTER) site Helgoland Roads in the German
the term “phytoplankton” represent a diverse array                 Bight (Wiltshire et al., 2010), diatoms are considered as
of plankton groups of all size classes including pico-             the major phytoplankton bloom components, showing
and nanoplankton. They comprise the most frequent                  distinct and massive blooming patterns (Mieruch et al.,
autotrophic groups such as diatoms, coccolithophores,              2010). The bloom of autotrophic phytoplankton is
green algae and cyanobacteria, but also dinoflagellates,            then typically followed by dinoflagellates, heterotrophic
which contain autotrophs, as well as heterotrophs and              plankton or larger zooplankton such as copepods
mixotrophs (Sournia et al., 1991; Simon et al., 2009).             (Lewandowska et al., 2015; Wiltshire et al., 2015).
Photoautotrophic phytoplankton is responsible for half                The knowledge of spring bloom dynamics in specific
of the global primary production (Field et al., 1998).             regions can be validated and extended by implemented
Primary producers are important not only as a food                 time series like the Continuous Plankton Recorder Survey
source for their consumers but also for bacterial plankton,        (Reid et al., 2003; McQuatters-Gollop et al., 2015), the
as bacteria can feed on their excretory products or                L4 coastal time-series station (Harris, 2010) or Helgoland
internal storage compounds after cell death in the form            Roads LTER (Wiltshire and Manly, 2004; Wiltshire et al.,
of dissolved or particulate organic matter (Sherr and              2015; Scharfe and Wiltshire, 2019). One potential prob-
Sherr, 2002). Microbial mixotrophic and heterotrophic              lem, however, is that traditional time series currently rely
consumers (e.g. choanoflagellates, cryptophytes, dinoflag-           on microscopy techniques, such as the Utermöhl method,
ellates) can feed on the heterotrophic bacterioplankton            which is time-consuming and limited by the size of organ-
(bacterivorous protists) or on phytoplankton (herbivorous          isms (Stern et al., 2018). This means that the smallest
protists) and are themselves food for the higher trophic           organisms cannot be assigned to taxonomic level accu-
zooplankton. Thus, planktonic eukaryotic microbes                  rately (Culverhouse, 2015). Therefore, especially small
play an important role in the so-called microbial loop             protists are barely investigated due to the resolution limit
(Azam et al., 1983; Sherr and Sherr, 2002; Caron                   of the identification methods used in traditional long-
and Hu, 2019). All size classes, including nano- and               term observations.
picoplankton, are present at different trophic levels of the          New molecular methods, and especially next-generation
planktonic community. However, thus far, these are barely          sequencing (NGS), could have a high potential for very
identifiable to species level by traditional microscopic            detailed monitoring (Ebenezer et al., 2012; Stern et al.,
methods because of their miniscule size and uniform                2018) as these molecular methods reliably capture the
morphology.                                                        entire phytoplankton community including nano- and
   On a global scale, phytoplankton growth periods vary            picoplanktonic components. For example, seasonality
depending on the climate zone; while long growth periods           patterns could be found for at the Adventfjorden time-
with low biomass occur mostly in tropical and subtropical          series station using 454 sequencing (Marquardt et al.,
regions, short growing periods with high biomass have              2016) and in the Mediterranean Sea using Illumina
been recorded for high-latitude regions (Racault et al.,           sequencing (Giner et al., 2019). Seasonal patterns as well
2012). How different components of the eukaryotic                  as diel shifts in activity could be found using the V4
microbial community are present throughout the year                region of RNA and DNA in Illumina sequencing in the
in the North Sea and at Helgoland is governed by many              North Pacific (Hu et al., 2016, 2018). Other studies have
abiotic and biotic factors (Reid et al., 1990; Wiltshire et al.,   been conducted, focusing on different European coastal
2015), and species often show distinct seasonal succession         waters like the L4 time-series station in the Western
patterns (Scharfe and Wiltshire, 2019). During winter              English Channel (Taylor and Cunliffe, 2014), several
there is not much light available, and temperature is low          stations along the European coast within the BioMarKs
in temperate regions; however, towards the end of winter,          project (Logares et al., 2014; Massana et al., 2014, 2015)
nutrient concentrations are high due to remineralization.          or estuaries, e.g. in the eastern English Channel (Bazin
This leaves optimal conditions specifically for autotrophic         et al., 2014). Some studies only focus on certain taxa,
organisms like diatoms to bloom once temperature                   e.g. uncultured marine heterotrophic flagellates (Logares
and, more importantly, light availability increase. These          et al., 2012) or Chlorophyta (Tragin et al., 2018). With
spring blooms neither manifest with the same species,              regard to prokaryotic monitoring, several NGS studies
nor are they dominated by one species throughout the               were conducted at Helgoland (Lucas et al., 2015, 2016;
bloom. Instead they are often a mixture of species                 Teeling et al., 2016; Chafee et al., 2018). While several
at the beginning and show a distinct succession on                 studies have been conducted in the general North
different timescales (Lewandowska et al., 2015; Scharfe            Atlantic at large, only a few studies focusing on specific

                                                               306
L. KÄSE ET AL.   SPRING COMMUNITY DYNAMICS OF SMALL PROTISTS

groups of small-sized eukaryotic protists have been          DNA extraction and pooling of samples

                                                                                                                                Downloaded from https://academic.oup.com/plankt/article-abstract/42/3/305/5836911 by Alfred Wegener Institut fuer Polar- und Meeresforschung Bibliothek user on 23 July 2020
done using other molecular methods, which are focused        The DNA extraction from 0.2 μm filters was conducted
specifically on Helgoland (Medlin et al., 2006, 2017;         as described previously at the Max Planck Institute for
Gescher et al., 2008; Knefelkamp, 2009; Metfies et al.,       Marine Microbiology (Bremen, Germany) (Sapp et al.,
2010).                                                       2007). In short, lysozyme (1 mg mL−1 ) and sodium
   This study aims to (1) understand the community struc-    dodecyl sulphate (1%) were used for cell lysis; DNA was
ture and dynamics of eukaryotic protists including the       extracted with a phenol/chloroform/isoamyl alcohol
pico- and nanoplankton fraction during spring and (2)        mixture (25:24:1) and precipitated with isopropanol,
discover if the typical spring bloom succession of diatoms   before the DNA extracts were eluted in sterile water.
and dinoflagellates can be detected using NGS data at         This fraction, which was previously used for 16S analysis,
Helgoland Roads from 15 March to 31 May 2016. (3) We         was then added to the other fractions to include all
also aim to relate abiotic dynamics in the water column      potential eukaryotes in all size ranges. The DNA from
to taxonomic group shifts in the community during the        the 10 and 3 μm filters was extracted following the
spring bloom based on a much more detailed assessment        manual of the Macherey–Nagel NucleoSpin® Plant II
of phytoplankton biodiversity.                               Kit, and all extracts were stored at −20◦ C. To include
                                                             the whole eukaryotic plankton community from all size
                                                             classes, equal volumes of the DNA extracts of the smallest
MATERIALS AND METHODS                                        size fraction (0.2 μm pore-size filters) were then pooled
In total, we took 50 plankton samples during spring 2016,    with the DNA extracts of the remaining size fractions
analysed these samples using next-generation sequencing      (3 and 10 μm) to obtain one sample per sampling date.
(18S) and investigated successional patterns.                Measurement of nucleic acid content of the pools was
                                                             conducted with a fluorometer (QuantiFluor® dsDNA
Study site and sampling                                      System, Promega, USA).

Sampling was conducted at the Helgoland Roads LTER
sampling site at the station “Kabeltonne” (54◦ 11.03 N,     MiSeqTM Illumina sequencing
7◦ 54.00 E, Germany) (Wiltshire and Dürselen, 2004).        After pooling, the samples were prepared for MiSeqTM
The sampling site is situated between the main island        Illumina sequencing following the Nextera XT DNA
and the dune island of Helgoland. The generally well-        Library Preparation protocol (Illumina, USA) with the
mixed water column fluctuates between 6 and 10 m              following modifications: a fragment (V4 region) of the
depth, depending on the tides (Callies and Scharfe, 2015).   18S ribosomal (r) DNA was amplified using KAPA HiFi
Samples were taken from 1 m depth between 15 March           HotStartReadyMix (Kapa Biosystems, Inc., USA) and the
and 31 May 2016. Sampling frequency was work-daily,          following primer set: 528iF (GCG GTA ATT CCA GCT
according to the LTER sampling. About 1 L of seawater        CCA A) and 964iR (ACTTT CGT TCT TGA TYR R)
was sequentially filtered using 10 μm polycarbonate filters    (Fadeev et al., 2018). The success of this amplicon PCR
(PC), 3 μm PC filters and 0.2 μM polyvinylidene fluo-          was confirmed with gel electrophoresis using 2 μL of the
ride filters (Millipore, Schwalbach, Germany) to obtain       PCR product. If no bands were detected, the amplicon
the whole prokaryotic and eukaryotic plankton commu-         PCR was repeated with an increased template volume (up
nity (Teeling et al., 2016). Secchi depth and temperature    to 5 μL). If this still was not sufficient to detect the respec-
were measured directly in the water at the sampling          tive band, five additional cycles were added to the original
site. Other parameters, including salinity and nutrients     program (eight samples). Before library normalization
such as silicate, phosphate and inorganic nitrogen using     and pooling, the DNA concentration was once again
the methods of Grasshoff (1976), were measured in the        measured using a Quantus Fluorometer (Promega, USA)
laboratory according to the LTER protocols (Hickel et al.,   and diluted accordingly. Amplicon sequencing was then
1993; Wiltshire et al., 2008, 2010). Daily observations of   performed on an Illumina MiSeqTM sequencer (Illumina,
sunshine duration in hours were downloaded from the          USA), and about 6.3 million 2 × 300 bp paired-end reads
Deutscher Wetterdienst, Climate Data Centre (2019). To       were produced in total.
check whether the spring of 2016 showed a typical phy-
toplankton community succession of diatoms followed by
dinoflagellates as observed in the LTER, we used total        Bioinformatics processing
diatom and total dinoflagellate counts and chlorophyll a      Sequence processing, operational taxonomic unit (OTU)
measured by HPLC modified after Zapata et al. (2000)          clustering and annotation were done with an internally
from 1st March to 31st May.                                  developed pipeline at the Alfred Wegener Institute as

                                                         307
JOURNAL OF PLANKTON RESEARCH VOLUME 42 NUMBER 3 PAGES 305–319 2020
described below (detailed description as Supplemental gridExtra (Auguie and Antonov, 2017). For significance
Downloaded from https://academic.oup.com/plankt/article-abstract/42/3/305/5836911 by Alfred Wegener Institut fuer Polar- und Meeresforschung Bibliothek user on 23 July 2020
Material), wrapping common bioinformatics tools and tests, the significance level was set at P < 0.05.
“GNU parallel” (Tange, 2011) for fast and massive parallel For identification of significant abiotic correlations to
workflow execution. The low-quality 3 -ends of the reads our OTU abundance table, which was normalized to the
were trimmed by Trimmomatic, version 0.38 (Bolger total number of reads per sample, temperature, salinity,
et al., 2014), and the paired-ends were merged by PEAR, Secchi depth, tide and sunshine duration as well as sil-
version 0.9.10 (Zhang et al., 2014). Cutadapt, version icate, nitrate, ammonium and phosphate concentrations
1.17 (Martin, 2011), was used to adjust the sequence were added to a “Constrained Ordination Model”. This
orientation and remove the forward and reverse primer model was based on an ANOVA-like permutation test
matching sequence segments. Sequences were only kept for canonical correspondence analysis (CCA) to assess
if both primer matching segments could be detected. the significance of the constraining factors, by testing
The remaining sequences were filtered by VSEARCH, for single term additions (Oksanen et al., 2019). Single
version 2.3.0 (Rognes et al., 2016), and sequences were variables were chosen by their significance and added to
discarded, (i) if they were 50 bp longer or shorter than the next step in the model, before the next significant
the median length of the targeted amplicon (376 bp), (ii) variable was added in the next step. If several variables
if they carried any ambiguity or (iii) if the expected base were given as significant, the variable with the lowest
error (sum of all base error probabilities) of a sequence Akaike information criterion (AIC) value was chosen first
was above 0.5. Chimeric sequences were sample-wise to minimize the information loss (Akaike, 1974).
predicted by VSEARCH, version 2.3.0, in de novo mode After calculation of the alpha diversity of the different
with default settings and removed from the sample files. taxonomic levels, the proportion of unclassified taxa—
Only samples with at least 10 000 sequences after fil- taxa that could not be determined and assigned by the
tering were considered for further analyses (49 out of PR2 database—were summarized and compared. Non-
50 samples). The remaining 4.3 million sequences were metrical multidimensional scaling (NMDS) plots were
clustered into OTUs by the tool swarm, version 2.1.8 created in vegan with Bray–Curtis dissimilarities to com-
(Mahé et al., 2014, 2015), with default settings. For each pare the community composition of the samples on dif-
OTU the most abundant amplicon was selected as rep- ferent taxonomic levels (Oksanen et al., 2019). Hereby, the
resentative and taxonomically annotated with the default data were converted to presence–absence data at genus
classifier implemented in mothur, version 1.38.1 (Schloss and at phylum level. Beta diversity was calculated on
et al., 2009). As reference the Protist Ribosomal Refer- genus level using the betadiver function vegan (Oksanen
ence database (PR2), version 4.10 (Guillou et al., 2013), et al., 2019) and Whittaker index (Whittaker, 1960). To
was chosen and the confidence cut-off was set to a visualize the matrix, it was converted into a cluster with
value of 90. the hclust function. The phases that were chosen after
A conservative threshold of 0.005% (of total reads) comparing the NMDS plot with the beta diversity clusters
after Bokulich et al. (2013) was applied to the remaining were then tested for significance with an Analysis of
37 608 OTUs, leaving 694 OTUs present in the 49 Similarities (ANOSIM). A distance matrix of the phases
samples. After removal of Metazoa alignments, 587 defined by the beta diversity analysis was compared to
OTUs were used for further analysis to determine the the significant environmental parameters separately as
protist community. Identification up to genus level was they were defined by the CCA using a Mantel test from
accepted as species annotations were generally poor. the ade4 package (Dray and Dufour, 2007; Bougeard
Higher taxonomic levels included family, class, order, and Dray, 2018). For the dissimilarity matrices of the
phylum and kingdom level. For taxa that could not be determined phases and of environmental parameters, a
further identified, the previous higher taxonomic level Euclidean distance metric was used. To determine the
was adopted and additions to the name were attached most abundant genera, further analysis was based on the
(e.g. unclassified) and counted as a different taxon on the relative abundance of the Illumina reads per sample. To
respective taxonomic level. calculate the relative abundance, the dataset was normal-
ized to the total number of reads per sample. Here, the
most abundant genera had a relative sequence abundance
Statistical analysis of more than 5% in at least one sample during the whole
All statistical analyses were conducted in R, version 3.5.0 period.
(R Core Team, 2018). The following packages were used To define OTUs of interest, we conducted a Similarity
for visualization: ggplot2 (Wickham, 2016), dendextend Percentage analysis (SIMPER). The SIMPER analysis
(Galili, 2015), ampvis2 (Andersen et al., 2018), RColor- helps to identify those OTUs that contribute the most
Brewer (Neuwirth, 2014), gplots (Warnes et al., 2019) and to the variation between the different phases. Using the
308L. KÄSE ET AL. SPRING COMMUNITY DYNAMICS OF SMALL PROTISTS
Downloaded from https://academic.oup.com/plankt/article-abstract/42/3/305/5836911 by Alfred Wegener Institut fuer Polar- und Meeresforschung Bibliothek user on 23 July 2020
Fig. 1. Profiles of temperature [◦ C], salinity, silicate [μM], nitrite [μM], nitrate [μM], ammonium [μM], phosphate [μM], Secchi depth [m] and
sunshine duration [h] at Helgoland Roads LTER sampling station during spring 2016; vertical dotted lines indicate the different phases as defined
by beta diversity analysis.
phases that were defined based on the beta diversity cal- validated by manual estimation and comparison of the
culation in the simper.pretty function (Steinberger, 2018), confidence interval to the respective P-values.
the OTUs with the biggest contributions to the similarity
between two phases were identified. Hereby, OTUs that
contributed less than 1% were removed. Afterwards the RESULTS
kruskal.pretty function (Steinberger, 2018) was used to
find significant differences across the phases that were Environmental parameters and spring
defined by the beta diversity calculation. The signifi- bloom succession as observed in the LTER
cant OTUs were then assigned to their respective gen- The water temperature at Helgoland Roads was 5.9◦ C
era and visualized as a heatmap. To find clusters of on 15 March and gradually increased to 13◦ C until the
OTUs on presence–absence level, we used hierarchical end of May (Fig. 1, Supplementary Table SI). Salinity
cluster analysis with multiscale bootstrap in the parallel ranged from 31.5 to 33.7, showing fluctuations through-
parPvclust function using the package pvclust (Suzuki out the period. Silicate concentrations rose from 5.3 μM
and Shimodaira, 2006; Ryota Suzuki and Shimodaira, to reach a maximum on 21st March with 13.4 μM. At
2015). By development of a dendrogram with additional the end of March, concentrations declined and remained
bootstrapping procedures, it is possible to calculate the below 3 μM. Secchi depth varied throughout the sampling
significance of each cluster in the dendrogram. The num- period between 1.8 and 7.0 m with several fluctuations.
ber of bootstraps was elevated to 20 000 to minimize the Daily sunshine duration varied greatly from day to day
standard error of the resulting clusters of OTUs. The cal- and ranged from 0 h of sunshine on 5th, 13th and 29th
culation of distances for the hierarchical cluster was based April and from 23rd May to 26th May up to 14.4 h of
on the asymmetric binary method, because the data are sunshine (12th May).
based on presence–absence level. For agglomeration, the The LTER microscopic counts revealed a pattern,
complete linkage method (farthest neighbour clustering) which resembled a typical spring phytoplankton suc-
was set. The pvpick function was used to find clusters with cession with high diatom abundances, followed by a
significant P-values. Support of data for these clusters was peak in dinoflagellates (Fig. 2a). Diatoms showed highest
309JOURNAL OF PLANKTON RESEARCH VOLUME 42 NUMBER 3 PAGES 305–319 2020
Downloaded from https://academic.oup.com/plankt/article-abstract/42/3/305/5836911 by Alfred Wegener Institut fuer Polar- und Meeresforschung Bibliothek user on 23 July 2020
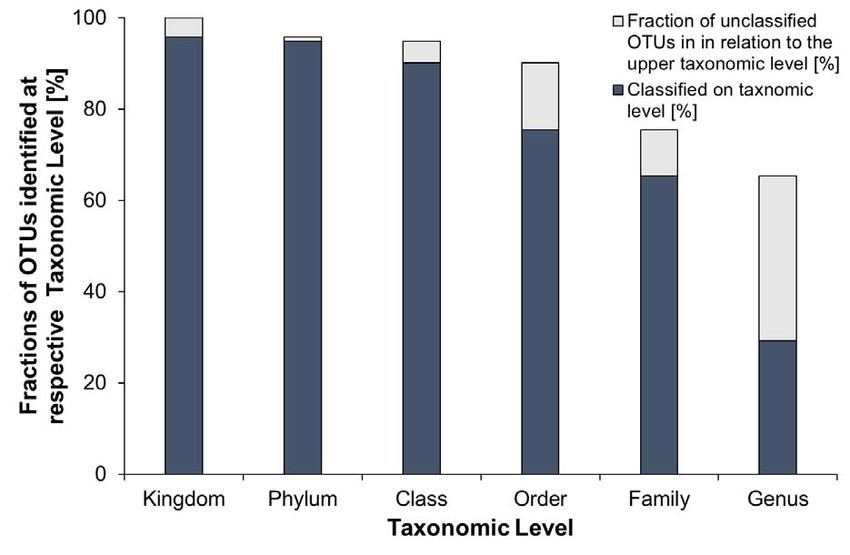
Fig. 3. Fractions of OTUs identified at respective taxonomic level: dark
grey indicates that identification on the respective taxonomic level was
successful, light grey indicates that identification information did not go
beyond the previous level; it includes all unclassified taxa (marked with
a suffix_unclassified) and taxa where monophyly could not be insured
(marked with a suffix_X according to the database).
which was assigned to seven OTUs. Overall, reliable
identification at genus level was possible for only 29.3%
Fig. 2. (a) Counts of diatoms and dinoflagellates [103 cells L−1 ] and
of OTUs (83 genera), which indicates that the biggest
chlorophyll a [μg L−1 ] measured with HPLC at Helgoland Roads LTER information gap regarding taxonomic assignments occurs
station from March 1 to 31 May 2016; (b) relative abundance [%] of between family and genus level.
Bacillariophyta and Dinoflagellata from 15 March to 31 May 2016.
abundances (3116∗103 cells L−1 ) from week 14 to 16 Temporal dynamics in the community
(April) as well as during week 19 (May) (2795∗103 cells As shown in the 2D NMDS plots of community dissimi-
L−1 ). Dinoflagellate total counts revealed a maximum larities at presence–absence level (See online supplemen-
abundance at the end of May (week 21) (111∗103 cells tary Fig. S1 for a colour version of this figure), a temporal
L−1 ). In the beginning of March, HPLC chlorophyll a pattern was found at genus level. However, the different
(Fig. 2a) was below 1.00 μg L−1 and increased to reach a communities are not visible at phylum level, since all phyla
first peak on 17th March (3.97 μg L−1 ). In contrast to the are represented by several genera that are always present.
diatom maximum peak, chlorophyll a reached its peak In general, beta diversity revealed a maximum species
on 29th March (week 13) with 6.77 μg L−1 . Afterwards turnover of ∼25% (Fig. 4). Five different phases could be
the concentration gradually declined with two maxima identified during the spring bloom: phase 1 during week
interrupting this trend on 19th April and 10th May, at 11, phase 2 from week 12 to week 14, phase 3 from week
2.61 and 2.39 μg L−1 , respectively. 14 to week 16, phase 4 from week 16 to week 19 and
phase 5 from week 19 to week 22 (see also Supplementary
Table SI). The ANOSIM confirmed the significance of
General description of the sequencing these clusters (R = 0.7, significance = 0.001).
dataset For this spring bloom period, temperature (AIC =
After quality control, 587 OTUs were assigned to 21 251.73, P = 0.005) was found to be the most impor-
phyla. Identification was conducted up to genus level tant environmental parameter based on the CCA
(Fig. 3). Based on the total number of OTUs that was model, followed by silicate (AIC = 247.26, P = 0.005),
analysed, approximately 96% could be assigned at king- salinity (AIC = 245.95, P = 0.005), sunshine duration
dom level. Assignment at phylum and class level was (AIC = 245.75, P = 0.005) and tide (AIC = 245.66,
possible with more than 90% of the OTUs. At order and P = 0.005). Other parameters tested in the model that
family level, 76 and 65% of all OTUs could be assigned, were not significant were nitrate, phosphate, ammonium
respectively. Most genera were represented by several and Secchi depth. The CCA plot (Fig. 5) indicated that
OTUs. Examples are the dinoflagellate Gyrodinium, which at the beginning of the study period, the community
was represented by nine OTUs, or the diatom Chaetoceros, was mostly correlated with silicate concentration. During
310L. KÄSE ET AL. SPRING COMMUNITY DYNAMICS OF SMALL PROTISTS
Downloaded from https://academic.oup.com/plankt/article-abstract/42/3/305/5836911 by Alfred Wegener Institut fuer Polar- und Meeresforschung Bibliothek user on 23 July 2020
Fig. 4. Beta diversity of the different samples during spring 2016. It was calculated using the betadiver function (vegan package) and Whittaker
index; visualization of the matrix was done with the hclust function.
April, this correlation shifted towards salinity which
increased in April. Especially samples from the end of
April and beginning of May were correlated to sunshine
duration and low tide (information on tides can be found
in Supplementary Table SI). The strongest correlation
for the May community was with higher temperature.
The follow-up Mantel test revealed that the environ-
mental factors temperature (r = 0.5738, P = 0.001) and
salinity (r = 0.3483, P = 0.001) were significantly corre-
lated to the beta diversity patterns, while silicate, sun-
shine duration and tide were not. Especially in phase
3, high variations in the community assemblage could
be observed. Compared to the other phases, there were
greater daily fluctuations in the community composition
during phase 3. Three samples (13th, 18th, 20th April),
which were taken during the same period, where the
community of phase 3 was identified, showed higher
variations in community composition and therefore could
not be assigned to any phase. Fig. 5. Canonical correspondence analysis (CCA) of the samples (black
SIMPER analysis showed that 53 OTUs explained at asterisks with sampling date) including abiotic factors in dark grey:
temperature (Temp), salinity (Sal), silicate (SiO4 ), sunshine duration
least 1% each of the variation between the five phases. (Sun) and tide (Low Tide); OTUs in a light grey plus symbol, 37.9%
With a Kruskal–Wallis test, 37 of these OTUs were found of total inertia, could be explained by all variables, CCA1 explained
to be significantly different (Supplementary Table SII). 17.5% of the variance and CCA2 explained 10.5%.
These OTUs were from six different phyla and 28 gen-
era, respectively. The number of contributing OTUs was (Fig. 6). Out of these 21 genera, 10 could not be assigned
increasing with later phases, and the highest number at genus level and 10 genera belonged to dinoflagel-
was found for phase 5 (15 OTUs). In total, 21 gen- lates. Unclassified Gymnodiniales and unclassified Dino-
era of 8 different phyla were found as most abundant phyceae OTUs contributed the most to the communities
311JOURNAL OF PLANKTON RESEARCH VOLUME 42 NUMBER 3 PAGES 305–319 2020
Downloaded from https://academic.oup.com/plankt/article-abstract/42/3/305/5836911 by Alfred Wegener Institut fuer Polar- und Meeresforschung Bibliothek user on 23 July 2020
Fig. 6. Most abundant genera from 15 March to 31 May 2016. Number of OTUs per genus indicated in parentheses. Shown are all genera with
a relative sequence abundance of more than 5% in at least one sample during the whole timeframe.
during all phases. The Ochrophyta genus Ditylum, fol- (on average ∼60% in total) and 40% of heterotrophs
lowed by Pseudo-nitzschia, also contributed to the change (see Supplementary Table SIII for summarized suggested
in the overall community in all compared phases (Sup- trophic modes; trophic modes were defined based on
plementary Table SII). Ditylum had the highest relative the taxonomy and known information from literature
abundance during phase 1 and was declining at a fast as Gómez (2012), Kubiszyn et al. (2014) and the Tara
rate during phase 2 and absent beyond phase 3 (Fig. 6). Oceans Database W4 from the Companion Website of
When comparing phases 2 and 3, unclassified Dino- the article of de Vargas et al. (2015); if the last identified
phyceae were identified as the biggest contributor to taxon was on a higher taxonomic level, we assumed
changes in the community, followed by the dinoflagellate the likelier/more frequent trophic mode when suitable,
Heterocapsa and heterotrophic Marine Stramenopiles-1A otherwise no trophic mode was assigned.). For all other
(MAST-1A). Regarding phase 3, 12 out of 16 OTUs, phases, heterotroph OTUs contributed the most with over
which contributed to the variation when compared to 50%. Ochrophyta (See online supplementary Fig. S2 for
phase 4, belonged to dinoflagellate genera. At the end of a colour version of this figure), which were mostly repre-
phase 3 to the beginning of phase 4, a peak of Phaeocystis sented by autotroph Bacillariophyta (diatoms, See online
sp. abundances could be observed. Abundances of the supplementary Fig. S3 for a colour version of this figure),
nanoplanktonic coccolithophore Emiliania sp. rose to a were most abundant in phase 1. Single genera like Chaeto-
peak during phase 4, with approximately 30% in relative ceros or Pseudo-nitzschia were also abundant during phases
abundance on 18 May 2016. This single Emiliania OTU 3 and 4 (Fig. 6). During phase 5, diatom abundances were
had the biggest influence on the changes in community always low (L. KÄSE ET AL. SPRING COMMUNITY DYNAMICS OF SMALL PROTISTS
consist of mostly bigger sized dinoflagellates, Syndiniales clustered together. Reads for these OTUs were available
Downloaded from https://academic.oup.com/plankt/article-abstract/42/3/305/5836911 by Alfred Wegener Institut fuer Polar- und Meeresforschung Bibliothek user on 23 July 2020
consist of mostly picoplanktonic parasites. Dinophyceae in phase 1, partially phase 4 and in phase 5.
were the biggest contributors to the community for most
days, followed by Syndiniales, which were the biggest
contributor in phases 3 and 5. The high contribution of DISCUSSION
dinoflagellate taxa was also visible in the number of taxa
that were most abundant during this timeframe. In this work, we could gather new information on several
The next most important phylum was Haptophyta (See small-sized eukaryotic microbes. We identified nano- and
online supplementary Fig. S2 for a colour version of this picoplankton such as several Syndiniales (Dino-Groups)
figure). This pico- and nanoplanktonic phylum increased and MAST groups, Phaeocystis sp. and Emiliania sp., which
steadily in abundance during phases 1 and 2. High abun- contributed to the communities with high abundances.
dances with a maximum of 32.2% started from phase Additionally, we observed that our sequence assemblage
3 onwards until the end of phase 5. Other phyla (See was dominated by dinoflagellates, in contrast to the
online supplementary Fig. S2 for a colour version of this microscopic count data, and a peak of diatoms was not
figure) included the heterotroph Cercozoa (mostly unclas- observed in the dataset.
sified), which showed high abundances during phase 2
(maximum 19.9%), but were generally low (JOURNAL OF PLANKTON RESEARCH VOLUME 42 NUMBER 3 PAGES 305–319 2020
unclassified Cercozoa. Here, heterotrophic Cercozoa does not correlate with the LTER counts, where abun-
Downloaded from https://academic.oup.com/plankt/article-abstract/42/3/305/5836911 by Alfred Wegener Institut fuer Polar- und Meeresforschung Bibliothek user on 23 July 2020
could have ingested chlorophyll-containing cells, or the dances steadily grew throughout the sampling period.
Cercozoa were represented by chlorarachniophytes, Both datasets, however, showed the highest abundances
which contain chloroplasts (Ishida et al., 1999). Also, it in week 21.
has to be noted that chlorophyll a sampling frequency So, what drives this conflicting information between
was lower (two times a week), compared to the LTER microscopic counts and sequencing results? First, it has to
counting data (five times a week). be taken into account that the high abundances might be
If we compare the sequencing abundances regarding influenced by different dinoflagellate gene copy numbers.
diatom and dinoflagellate abundances to the LTER total The generally high abundance of dinoflagellate genera
counts, we do not find a good match, even though the was similar in previous studies. For instance, Massana
sampling frequency was similar and the high sampling et al. (2015) and Massana (2011) found mostly dinoflagel-
frequency minimizes the chance that we missed indi- lates including several parasitic Syndiniales in European
vidual abundance peaks that were seen in the micro- coastal waters. Similar high abundances of Syndiniales
scopic counts. In addition, the typical decline in silicate and Gymnodiniales were found by Taylor and Cunliffe
concentration supports the presence of diatoms in high (2014) at the L4 coastal LTER station (Western English
abundances. For example, as Chaetoceros socialis is known as Channel). One issue is the use of relative abundances for
a colonizing and mucous forming species; potential aggre- comparison of communities that is influenced by gene
gation of cells needs to be taken into account (Riebesell, copy numbers per cell, which differ greatly in between
1993). It is unclear to what extent aggregation potential of species. Several studies have emphasized the different
single species can influence the match in peak abundances rDNA copies among protist taxa like diatoms (Connolly
for both methods, since aggregates in either sample might et al., 2008) or dinoflagellates (LaJeunesse et al., 2005;
lead to overestimation. Hong et al., 2016). Therefore, an approach based only
With respect to diatoms in general (Ochrophyta), the on relative abundances is difficult to interpret. Several
highest abundances in our sequencing dataset were found analyses in our study such as NMDS and OTU cluster-
in phase 1 at the beginning of the sampling period (week ing were conducted at presence–absence level to avoid
11), with single genera also abundant during later phases. this phenomenon. However, one problem in using this
In total they did not show a distinct peak, but most genera approach was that most genera in this analysis were
found were in accordance with typical diatoms occur- present at any time during the sampling period. In addi-
ring in the area in spring (Hoppenrath, 2004; Wiltshire tion, since a comprehensive and reliable resolution at
and Dürselen, 2004; Kraberg et al., 2015; Wollschläger species level is not possible so far, it is necessary to include
et al., 2015). However, important species such as Guinardia the relative abundances as well, if we want to see changes
delicatula, Thalassionema nitzschioides and Odontella aurita, and relationships in the community. Furthermore, species
which are known to have growth periods fitting to our that might be abundant at Helgoland and visible in the
sampling period, could not be found in high abundances. traditional long-term series when using microscopy might
It has been shown that shifts in blooming periods and not be available in our dataset. Reasons for this could
widening of occurrences of single species occurred in be the threshold we used, or a bias in DNA extraction,
the past (Wiltshire et al., 2010; Schlüter et al., 2012), PCR and sequencing procedures. At the same time, it is
which could explain the absence of these species in our possible that dinoflagellate occurrence in the environment
sequence assemblage. Comparison to the regular long- is underestimated in microscopic studies, since several
term microscopic counts revealed that O. aurita and T. small-sized taxa cannot be identified.
nitzschioides were only reported for four and two times, Several factors might influence the reliability of
respectively, during this timeframe. For G. delicatula, counts sequence identification. Considerable difficulties and
revealed that the species was mostly present from March possible sources of biases include the use of target
to April (data not shown), which is in accordance with the molecules (e.g. RNA, rDNA), regions (e.g. V4, V9) and
sequencing results. databases like PR2 (Guillou et al., 2013) or SILVA (Pruesse
As the primer set used was engineered to better match et al., 2007). These databases are not of equal detail for
contributions of diatoms and Phaeocystis sp. to the com- different taxon groups. For example, identification on
munity, a sequencing bias should be unlikely. However, genus level for both databases was poor, and a direct
instead of a diatom-dominated community, our sequence comparison between PR2 and SILVA sometimes revealed
assemblage was dominated by several dinoflagellate taxa. contradictory results. In our dataset, barely any OTU
These included a wide diversity of large-sized species, could be differentiated down to species level, and a
but also potential parasites from different Syndiniales major proportion of OTUs could not be named at
groups. The constant high abundance of dinoflagellates genus or higher levels either, indicating a considerable
314L. KÄSE ET AL. SPRING COMMUNITY DYNAMICS OF SMALL PROTISTS
degree of hidden diversity in our dataset. For example, Since most abundant genera were available in our dataset
Downloaded from https://academic.oup.com/plankt/article-abstract/42/3/305/5836911 by Alfred Wegener Institut fuer Polar- und Meeresforschung Bibliothek user on 23 July 2020
a high amount of big-sized dinoflagellate taxa could during the whole sampling period, we can assume that
not be identified further, but might be identifiable using these influence the community the most. Especially Phaeo-
microscopy. However, for microscopy, too, it has to be cystis sp. and Emiliania sp. could be identified as impor-
noted that resolution at species level is mostly depending tant blooming small-sized eukaryotic microbes. It has
on taxonomic expertise, although resolution limits might to be noted that our study is the first study using Illu-
not be as important for some easily identifiable taxa mina sequencing in this temporal resolution at Helgoland
(Zingone et al., 2015). Moreover, the choice of target Roads. Therefore, it is not possible to compare our find-
molecules and different regions influence the quality ings with sequencing data from previous years. However,
of the database alignment, since the genetic diversity several campaigns and efforts have been made to sam-
of the target region might not be specific enough for ple certain taxa or neighbouring areas. In the following
identification at species level. paragraphs, we try to compare these findings by several
different molecular methods with our results regarding
the different taxa and small-sized eukaryotes.
Connections to environmental parameters
and community dynamics
The CCA explained 37.9% of total inertia, which Diversity of nano- and picoplankton taxa
indicates that one or several additional factors, not A considerable amount of new information about the
yet taken into account, influenced the community at spring bloom community on nano- and picoplankton
Helgoland Roads significantly. For example, Callies and composition was gained through this study, providing
Scharfe (2015) found hydrodynamic transport in regard new insights into heterotrophic and possible parasitic
to currents to be the most influential forcing parameter components of the microbial loop communities.
during spring, which was not considered in this study. The Nano- and picoplankton taxa such as Syndiniales
interplay between freshwater introducing influence by (Dino-Groups), Emiliania sp., Phaeocystis sp. and Choanoflag-
river discharge and marine water could only be discussed ellida groups (Stephanoecidae Group D) were found in
in regard to the rapid changes in salinity. In addition to the relatively high abundances and showed a distinctive
high influence of hydrodynamic transport and weather blooming pattern during spring. Out of these taxa,
conditions, internal influences due to species interactions only Phaeocystis sp. is counted at Helgoland Roads
and grazing by zooplankton need to be taken into account currently, while coccolithophorids like Emiliania and
as well in the future. choanoflagellates cannot be identified on genus level.
We observed five distinct phases in the spring bloom of For other regions of the North Sea especially Phaeo-
2016. As different analyses like the hierarchical clustering cystis and coccolithophorids are already known to be
and NMDS showed, the community in phase 3 was hav- important compartments of the spring bloom community
ing rapid changes compared to other phases. In addition, (Widdicombe et al., 2010). Despite their small cell size,
three samples that were taken in between samples from Phaeocystis sp. are resistant against grazing by small-sized
phase 3 could not be assigned to any phase, since they copepods due to their forming of gelatinous colonies
were more diverse. This indicates that additional com- and production of deterring chemicals, while different
munities might undergo rapid changes and would not be microzooplankton such as ciliates and heterotrophic
visible with a lower sampling frequency. It is noteworthy dinoflagellates are known to feed on single Phaeocystis
that this timeframe coincides with the maximum of the cells and on colonies (Hamm, 2000; Stelfox-Widdicombe
total counts of diatoms at the LTER site. et al., 2004; Schoemann et al., 2005). A shift from diatom
The results regarding community composition showed blooms to Phaeocystis-dominated blooms therefore would
that phases 1 and 5 were more similar to each other than influence the grazing success of the known copepods such
the communities during phases 3 and 4. Comparing the as Acartia spp. and Temora spp. and change the whole food
beta diversity matrix with the environmental parameters, web dynamics at Helgoland.
a significant correlation to temperature and salinity was If we look at other heterotroph small-sized eukaryotic
shown. This result suggests that the contrasting environ- microbes like the MAST groups, which are also not
mental conditions like temperature differences did not included in the LTER, we found a high amount of OTUs,
inhibit the development of similar communities, which of which several were present in all samples and clustered
decreases the influence of temperature on community within the biggest cluster (cluster 4). This cluster included
succession. most OTUs that were present during the whole sampling
The most abundant genera were found in the OTUs period and represents a diverse background community.
with the greatest contributions by our SIMPER analyses. Accordingly, Logares et al. (2012) and Massana et al.
315JOURNAL OF PLANKTON RESEARCH VOLUME 42 NUMBER 3 PAGES 305–319 2020
(2014), who used data from several stations from Euro- such as Emiliania and Phaeocystis. Pico- and nanoplankton
Downloaded from https://academic.oup.com/plankt/article-abstract/42/3/305/5836911 by Alfred Wegener Institut fuer Polar- und Meeresforschung Bibliothek user on 23 July 2020
pean coasts, found the biggest contributions of different are part of a core community, vary in bloom timing and
MAST groups in the pico- but also in the nanoplankton form community clusters. Taking into account the abiotic
fraction. factors used in our analysis, temperature and salinity were
Furthermore, cluster 22 stood out with mostly Hacro- the abiotic parameters with the biggest correlations to
bia OTUs. In general, the OTUs in this cluster appear the microbial communities present during our sampling
to play a role in early and late spring (phases 1 and period. However, it needs to be mentioned that contrast-
5), hinting that they might be suppressed by blooming ing conditions in these parameters did not prevent similar
plankton fractions, such as other Hacrobia like Phaeocystis communities to evolve. Also, there are still unknown vari-
and Emiliania. The cryptophytes from this cluster coincide ables, which also influence the community structure that
well with findings from earlier studies (Metfies et al., 2010). have not been taken into account. Since previous knowl-
Further analysis by Medlin et al. (2017) identified Teleaulax, edge relies on microscopy, such as the known diatom
Plagioselmis and Geminigera spp. as possible important cryp- spring bloom peak, which could not be identified in our
tophytes during the spring bloom. In accordance with our dataset, there is a need to compare methods in more detail
results, these genera were abundant during the early and to overcome this issue and identify gaps and possibilities
late phases of our spring bloom, but did not significantly of synergy effects of the different datasets.
contribute to the statistical similarities.
Diverse communities, such as represented by cluster 31,
included taxa, which belonged to diatoms, heterotrophic DATA ARCHIVING
flagellates or ciliate taxa. For example, choanoflagellates, Sequence data for this study have been deposited in
as part of the heterotrophic nanoplankton, are a big con- the European Nucleotide Archive (ENA) at EMBL-EBI
tributor to carbon cycling in marine food webs, since they under accession number PRJEB37135 (https://www.e
are grazing on bacteria and detritus but are themselves bi.ac.uk/ena/data/view/PRJEB37135), using the data
food for larger predators (King, 2005). The present fungi brokerage service of the German Federation for Biologi-
or fungi-like organisms act as decomposers of organic cal Data (GFBio, Diepenbroek et al., 2014), in compliance
matter but can also be parasites of autotrophic primary with the Minimal Information about any (X) Sequence
producers and control their growth (Jobard et al., 2010). (MIxS) standard (Yilmaz et al., 2011).
For Helgoland, it has been found that selective graz-
ing by microzooplankton is important for phytoplankton
spring bloom development and the occurrence of ciliates SUPPLEMENTARY DATA
is dependent on specific preys (Löder et al., 2011). As
Supplementary data can be found at Journal of Plankton Research online.
these taxa cluster occurred during the early phases, where
we observed the highest diatom abundances, a similar
relationship can be suggested for our study.
ACKNOWLEDGEMENTS
We wish to thank the crew of the research vessel “Aade”, our
CONCLUSION technicians Kristine Carstens and Silvia Peters for collecting all
LTER data and the MPI sampling team: David Probandt, Greta
In order to achieve new insights to the Helgoland Roads Giljan, Karen Krüger, Laura Zeugner, Lennart Kappelmann
eukaryotic microbial community during spring, we anal- and Meghan Chafee. Additionally, we want to thank Karl Peter
ysed the sequence assemblage and identified main abiotic Rücknagel and Sabine Kühn for DNA extraction of the 0.2 μm
filter samples as well as Swantje Rogge and Kerstin Oetjen for
correlations to the community dynamics. We obtained their support on the sequencing procedure. We would also like
several unexpected results, which should be addressed to thank Mirco Scharfe and Cédric Meunier for their support
in future observations. Most prominently, we observed and suggestions on the manuscript.
a low occurrence of diatoms in our molecular dataset,
despite the high sampling frequency, which we expect to CONFLICT OF INTEREST
be mainly caused by methodological constraints. Instead, The authors declare that there is no conflict of interest.
our assemblage was mainly dominated by dinoflagellate
OTUs. We could identify several taxa that occur at Hel-
goland during the whole period. At the same time, a rapid FUNDING
phytoplankton succession was observed, with some taxa This work was supported by the Alfred-Wegener-Institut Helmholtz-
only making occasional appearances. In accordance with Zentrum für Polar- und Meeresforschung. We further acknowledge sup-
our aim, we could identify many small-sized eukaryotic port by the Open Access Publication Funds of Alfred-Wegener-Institut
microbes, which showed a distinctive blooming pattern Helmholtz-Zentrum für Polar- und Meeresforschung.
316L. KÄSE ET AL. SPRING COMMUNITY DYNAMICS OF SMALL PROTISTS
REFERENCES Fadeev, E., Salter, I., Schourup-Kristensen, V., Nöthig, E.-M., Metfies,
Downloaded from https://academic.oup.com/plankt/article-abstract/42/3/305/5836911 by Alfred Wegener Institut fuer Polar- und Meeresforschung Bibliothek user on 23 July 2020
K., Engel, A., Piontek, J., Boetius, A. et al. (2018) Microbial commu-
Akaike, H. (1974) A new look at the statistical model identification. IEEE nities in the east and west Fram Strait during sea ice melting season.
Trans. Automat. Contr., 19, 716–723. Front. Mar. Sci., 5, 1–21.
Andersen, S. K., Kirkegaard, R. H., Karst, S. M. and Albertsen, Field, C. B., Behrenfeld, M. J., Randerson, J. T. and Falkowski, P.
M. (2018) ampvis2: an R package to analyse and visualise 16S (1998) Primary production of the biosphere: integrating terrestrial
rRNA amplicon data. bioRxiv [Preprint], available at https://doi and oceanic components. Science (80-.), 281, 237–240.
.org/10.1101/299537.
Galili, T. (2015) Dendextend: an R package for visualizing, adjusting
Auguie, B. and Antonov, A. (2017) gridExtra: Miscellaneous Functions and comparing trees of hierarchical clustering. Bioinformatics, 31,
for grid Graphics. R package version 2.3, available at https://CRA 3718–3720.
N.R-project.org/package=gridExtra.
Gescher, C., Metfies, K., Frickenhaus, S., Knefelkamp, B., Wiltshire, K.
Azam, F., Fenchel, T., Field, J. G., Gray, J. S., Meyer-Reil, L. A. and H. and Medlin, L. K. (2008) Feasibility of assessing the community
Thingstad, F. (1983) The ecological role of water-column microbes composition of prasinophytes at the Helgoland roads sampling site
in the sea. Mar. Ecol. Prog. Ser., 10, 257–263. with a DNA microarray. Appl. Environ. Microbiol., 74, 5305–5316.
Bazin, P., Jouenne, F., Friedl, T., Deton-Cabanillas, A. F., Le Roy,
Giner, C. R., Balagué, V., Krabberød, A. K., Ferrera, I., Reñé, A.,
B. and Véron, B. (2014) Phytoplankton diversity and community
Garcés, E., Gasol, J. M., Logares, R. et al. (2019) Quantifying long-
composition along the estuarine gradient of a temperate macrotidal
term recurrence in planktonic microbial eukaryotes. Mol. Ecol., 28,
ecosystem: combined morphological and molecular approaches. PLoS
923–935.
One, 9, e94110.
Bokulich, N. A., Subramanian, S., Faith, J. J., Gevers, D., Gordon, Gómez, F. (2012) A quantitative review of the lifestyle, habitat and
J. I., Knight, R., Mills, D. A. and Caporaso, J. G. (2013) Quality- trophic diversity of dinoflagellates (Dinoflagellata, Alveolata). Syst.
filtering vastly improves diversity estimates from Illumina amplicon Biodivers., 10, 267–275.
sequencing. Nat. Methods, 10, 57–59. Grasshoff, K. (1976) Methods of Seawater Analysis, Verlag Chemie, Wein-
Bolger, A. M., Lohse, M. and Usadel, B. (2014) Trimmomatic: a flexible heim and New York.
trimmer for Illumina sequence data. Bioinformatics, 30, 2114–2120. Guillou, L., Bachar, D., Audic, S., Bass, D., Berney, C., Bittner, L.,
Bougeard, S. and Dray, S. (2018) Supervised multiblock analysis in R Boutte, C. et al. (2013) The Protist ribosomal reference database
with the ade4 package. J. Stat. Softw., 86, 1–17. (PR2): a catalog of unicellular eukaryote small sub-unit rRNA
sequences with curated taxonomy. Nucleic Acids Res., 41, 597–604.
Callies, U. and Scharfe, M. (2015) Mean spring conditions at Helgoland
roads, North Sea: graphical modeling of the influence of hydro- Hamm, C. E. (2000) Architecture, ecology and biogeochemistry of
climatic forcing and Elbe River discharge. J. Sea Res., 101, 1–11. Phaeocystis colonies. J. Sea Res., 43, 307–315.
Caron, D. A. and Hu, S. K. (2019) Are we overestimating protistan Harris, R. (2010) The L4 time-series: the first 20 years. J. Plankton Res.,
diversity in nature? Trends Microbiol., 27, 197–205. 32, 577–583.
Carstensen, J., Klais, R. and Cloern, J. E. (2015) Phytoplankton blooms Hickel, W., Mangelsdorf , P. and Berg, J. (1993) The human impact in
in estuarine and coastal waters: seasonal patterns and key species. the German bight: eutrophication during three decades (1962-1991).
Estuar. Coast. Shelf Sci., 162, 98–109. Helgoländer Meeresuntersuchungen, 47, 243–263.
Chafee, M., Fernàndez-Guerra, A., Buttigieg, P. L., Gerdts, G., Eren, Hong, H. H., Lee, H. G., Jo, J., Kim, H. M., Kim, S. M., Park, J. Y., Jeon,
A. M., Teeling, H. and Amann, R. I. (2018) Recurrent patterns of C. B., Kang, H. S. et al. (2016) The exceptionally large genome of the
microdiversity in a temperate coastal marine environment. ISME J., harmful red tide dinoflagellate cochlodinium polykrikoides Margalef
12, 237–252. (Dinophyceae): determination by flow cytometry. Algae, 31, 373–378.
Connolly, J. A., Oliver, M. J., Beaulieu, J. M., Knight, C. A., Tomanek, Hoppenrath, M. (2004) A revised checklist of planktonic diatoms and
L. and Moline, M. A. (2008) Correlated evolution of genome size and dinoflagellates from Helgoland (North Sea, German bight). Helgol.
cell volume in diatoms (Bacillariophyceae). J. Phycol., 44, 124–131. Mar. Res., 58, 243–251.
Culverhouse, P. F. (2015) Biological oceanography needs new tools to Hu, S. K., Campbell, V., Connell, P., Gellene, A. G., Liu, Z., Terrado, R.
automate sample analysis. J. Mar. Biol. Aquac., 1, 1–2. and Caron, D. A. (2016) Protistan diversity and activity inferred from
Diepenbroek, M., Glöckner, F., Grobe, P., Güntsch, A., Huber, R., RNA and DNA at a coastal ocean site in the eastern North Pacific.
König-Ries, B., Kostadinov, I., Nieschulze, J. et al. (2014, 2014) FEMS Microbiol. Ecol., 92, fiw050.
Towards an integrated biodiversity and ecological research data man- Hu, S. K., Connell, P. E., Mesrop, L. Y. and Caron, D. A. (2018) A hard
agement and archiving platform: The German Federation for the Day’s night: Diel shifts in microbial eukaryotic activity in the North
curation of biological data (GFBio). In Plödereder, E., Grunske, L., Pacific subtropical gyre. Front. Mar. Sci., 5, 1–17.
Schneider, E. and Ull, D. (eds.), Informatik 2014 – Big Data Komplexität Ishida, K., Green, B. R. and Cavalier-Smith, T. (1999) Diversification
meistern. GI-Edition: Lecture Notes in Informatics (LNI) – Proceedings, Vol. of a Chimaeric algal group, the Chlorarachniophytes: phylogeny of
232, Köllen Verlag, Bonn, pp. 1711–1724. nuclear and Nucleomorph small-subunit rRNA genes. Mol. Biol. Evol.,
Dray, S. and Dufour, A. B. (2007) The ade4 package: implementing the 16, 321–331.
duality diagram for ecologists. J. Stat. Softw., 22, 1–20. Jobard, M., Rasconi, S. and Sime-Ngando, T. (2010) Diversity and
DWD Climate Data Center (CDC) (2019) Daily Station Observations of functions of microscopic fungi: a missing component in pelagic food
Sunshine Duration in Hours for GERMANY , version v19.3, last accessed webs. Aquat. Sci., 72, 255–268.
24 August 2019. King, N. (2005) Choanoflagellates. Curr. Biol., 15, 113–114.
Ebenezer, V., Medlin, L. K. and Ki, J. S. (2012) Molecular detec- Knefelkamp, B. (2009) An Investigation of the Eukaryotic Picoplankton Com-
tion, quantification, and diversity evaluation of microalgae. Marine munity in the German North Sea by Different Methods, University Bremen,
Biotechnol., 14, 129–142. Bremen.
317You can also read