Our leadership in smart beta and Factor investing positions PowerShares for strong future growth - September 2016
←
→
Page content transcription
If your browser does not render page correctly, please read the page content below

Our leadership in smart beta and Factor
investing positions PowerShares for strong
future growth
September 2016

Forward-looking statements

This presentation, and comments made in the associated Web cast today, may include “forward-looking
statements.” Forward-looking statements include information concerning future results of our operations,
expenses, earnings, liquidity, cash flow and capital expenditures, industry or market conditions, AUM,
acquisitions and divestitures, debt and our ability to obtain additional financing or make payments, regulatory
developments, demand for and pricing of our products and other aspects of our business or general economic
conditions. In addition, words such as “believes,” “expects,” “anticipates,” “intends,” “plans,” “estimates,”
“projects,” “forecasts,” and future or conditional verbs such as “will,” “may,” “could,” “should,” and “would” as
well as any other statement that necessarily depends on future events, are intended to identify forward-
looking statements.
Forward-looking statements are not guarantees, and they involve risks, uncertainties and assumptions. There
can be no assurance that actual results will not differ materially from our expectations. We caution investors
not to rely unduly on any forward-looking statements and urge you to carefully consider the risks described in
our most recent Form 10-K and subsequent Forms 10-Q, filed with the Securities and Exchange Commission.
You may obtain these reports from the SEC’s website at www.sec.gov. We expressly disclaim any obligation to
update the information in any public disclosure if any forward-looking statement later turns out to be
inaccurate.
All material presented is compiled from sources believed to be reliable and current, but accuracy cannot be
guaranteed. This presentation is provided for informational purposes only and is not to be construed as an
offer to buy or sell any financial instruments and should not be relied upon as the sole factor in an investment
making decision. As with all investments there are associated inherent risks. Please obtain and review all
financial material carefully before investing. This does not constitute a recommendation of the suitability of
any investment strategy for a particular investor. The opinions expressed are based on current market
conditions and are subject to change without notice. Past performance is not a guarantee of future results. All
products and services mentioned in this document are made available via affiliated entities of Invesco Ltd.

2                                                                                                         US10880

Our speakers today

Dan Draper            Lorraine Wang             Eric Pollackov
Global Head of        Head of Global            Head of Global ETF
Invesco PowerShares   ETF Products & Research   Capital Markets

3

Agenda

Introduction

Factor-based investing

ETF market landscape

Smart beta ETFs

Product strategy & research

Institutional

Capital markets

Questions

4
Introduction

5

We manage Invesco with a single focus: to help clients achieve their investment objectives Every client has a unique set of investment objectives, which can be achieved in a variety of ways Invesco’s comprehensive range of high-conviction investment capabilities has been constructed over many years to help clients achieve their investment objectives Our fundamental and factor-based methodologies aim to deliver client outcomes that go beyond the limitations of traditional passive investing and benchmark-centric active management We believe this high-conviction approach provides better tools to build portfolios in a more precise and impactful way 6

We’ve positioned our business ahead of
client demand trends
Client demand themes Invesco’s positioning
Search for yield In 2007, began expansion of global fixed income platform, which
today supports the full range of single-sector and multi-sector
capabilities
Continue to expand the full range of income-related capabilities,
including equities, fixed income and alternatives
“Barbelling” and the Continued to expand our comprehensive range of all-weather, high-
shift to passive, beta conviction capabilities
and ETF products Began factor investing in 1983
Added PowerShares in 2006 – smart beta line remains broadest,
most diverse in the industry
Continue to accelerate our ETF business globally
Multi-asset strategies Introduced risk parity strategy in 2008
and absolute return Built new Invesco Perpetual multi-asset team beginning in 2012;
expanding to new markets
Invesco Quantitative Strategies (IQS) added global market neutral
capability in 2008
7
We’ve positioned our business ahead of
client demand trends
Client demand themes Invesco’s positioning
Growing demand Entered direct real estate business in 1991; completed the
for alternatives globalization of our real estate capabilities by adding the Asia team
in 2010
Expanded into private equity through WL Ross & Co. in 2006
Continued to broaden our range of alternative strategies with the
launch of more than 40 liquid alternatives offerings globally
beginning in 2011; today the range represents one of the most
comprehensive lineups in the industry
Increasing demand Invesco Solutions builds and manages goal-oriented, multi-asset
for solutions and new strategies aligned to client outcomes
advice models Early entrant into the digital advice space through the addition of
Jemstep in 2016
8
We enable outcomes that help clients around the
world achieve their investment objectives
Our comprehensive range of investment capabilities …
Equity Fixed Income and Balanced Alternative
Money Market
$349B AUM $269B AUM $47B AUM $116B AUM
Global/Multi-Region Multi-Sector Traditional Directional Strategies Macro Strategies
Global Global Agg/Core Plus Global Balanced Long/Short Equity Global Macro
Global ex Domestic Multi-Sector Credit Domestic Balanced Private Equity
Relative Value/
Emerging Markets Strategic Income Bank Loans
Non-Traditional Absolute Return
Regional/ Single-Sector Risk Parity Inflation-Protection Market Neutral Equity
Single Country Investment Grade Target Maturity Commodities Unconstrained Bond
Asian/Asia ex Japan High Yield Target Risk Public Real Estate
Financial Structures
Australian Structured Securities Custom Solutions Securities
Credit Arbitrage
Greater China Convertibles Private Real Estate
Opportunistic
Japanese Municipal Bonds
European/UK
Specialty
US
EM Debt
Canadian
Stable Value
Sector-Based Global Liquidity
… are delivered through diverse investment vehicles …
Institutional Collective Mutual funds Exchange-traded
Unit investment trusts (UITs)
separate accounts trusts (open/closed-end, on/offshore) funds (ETFs)
Private Sub-advised Separately managed accounts/ Variable
Customized solutions
placements portfolios Unified managed accounts insurance funds
… to enable key outcomes that help our clients around
the world achieve their investment objectives
Income Capital preservation Growth
* All data as of June 30, 2016.
9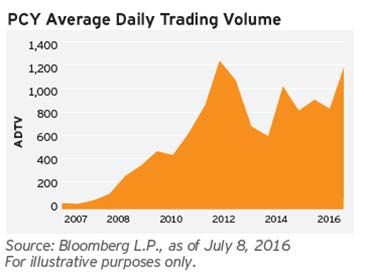
We help clients build better portfolios through
high-conviction investing

                                                        High conviction
Fundamental Benchmark
                                      Fundamental active
            centric
             Benchmark-centric        Strategies constructed through active security selection to
             fundamental strategies   generate alpha

Factor-based Traditional                                              Factor-based
                                      Smart beta
             beta                                                     active
             Replication of market-   Transparent, rules-based        Strategies that
             cap-weighted             strategies that provide         systematically apply active
             benchmarks               alternatives to market-cap-     insights to target specific
                                      weighted indices by isolating   risk/return expectations
                                      specific factors to provide
                                      exposure and/or seek to
                                      mitigate risk
                Passive                                                               Active

10
Our entire organization is focused on helping
clients achieve their investment objectives
Success driver Invesco position
Deep Deep knowledge of clients and their evolving needs
understanding Comprehensive, all-weather, high-conviction, fundamental and factor investing
of client needs product line
Demonstrated ability to combine a broad range of capabilities to construct portfolios
aligned with client investment objectives by channel and by region
Pure focus on No competing lines of business to support
investment Strong investment reputation
management
Independence
Infrastructure and client support platforms that enable our investors to spend more
time focused on investing
Experienced, Specialized, stable investment teams with discrete investment perspectives and
stable and experience across diverse market cycles
accountable Disciplined, repeatable investment philosophy and processes
investment
leadership Strong risk management and oversight
Compensation aligned with performance and client interests
Organizational Broad and deep global presence in key markets
strength Solid margins, financial strength, and resources to ensure long-term investment in
the business
6,500+ highly engaged and motivated employees focused on client needs
Proven management team with a solid track record
Source: Data as of June 20, 2016.
11Invesco’s ability to help clients achieve their
objectives differentiates us in the market
It is the totality of our organization that makes Invesco highly differentiated in the
marketplace and positions us for growth and success over the long term
Independent Depth and breadth of Diversification across
capabilities channels, asset classes
and geographies
Search for yield
Barbelling (factor and
fundamental investing) Channels
Multi-asset solutions and
absolute return
Asset classes
Growing demand for Geographies
alternatives
Increasing demand for
solutions
For illustrative purposes only
12Invesco is an innovative leader in factor investing
with $150B in AUM and 40 years’ experience
Factor based investment strategies
Invesco Quantitative Invesco Unit Trust
PowerShares
Strategies (IQS)
$96.1bn in AUM $34.5bn in AUM $19.2bn in AUM
4th largest ETF provider* Global presence with teams 2nd largest unit trust provider
Factor-based smart beta across four continents Factor-based smart beta
pioneer since 2003 Factor-based active packaged in unit trusts
11 investment professionals since 1983 since 1975
140 ETFs 43 investment professionals 19 investment professionals
Globally delivered through 74 unit trusts
mutual funds, collective trusts
and separate accounts
Differentiating attributes
Diverse, time-tested investment strategies
All vehicles available to meet investor needs
Product specialists and field wholesaler depth
Education and thought leadership support
*Bloomberg L.P. Data as of June 30, 2016
Source: Data as of June 30, 2016.
13Factor-based investing 14
Which is better – active or passive?
Invesco believes this is the wrong question to ask A more
important
At Invesco, we believe in striving for superior client question: “are
experience through high-conviction investing – going you willing to
beyond the limitations of traditional passive investing and settle for
benchmark-centric active management average”
High conviction means our fundamental-based active
managers trust their research, have confidence in their
discipline and build portfolios that are a reflection of their
beliefs – not benchmarks
It also means that our factor-based active and smart
beta strategies go beyond the traditional, market-cap-
weighted passive benchmark approach
15Moving the industry from “Mass Production” to
“Mass Customization”
Invesco believes this is occurring largely due to Factor investing
supports a
Investors behavioral biases better
diversified
Harvesting of Factor Risk Premium portfolio
Stronger expression of Investment views
More efficient risk-adjusted performance
Evolution away from cap-weighted benchmarks
16Factor investing is to look at the investable
world through a particular lens
What is a Factor?
A factor is a quantifiable characteristic of an asset
– Can be directly observable characteristics such as size, momentum or value
– Can refer to statistical relationships such as the part of price moves that can be
explained by a variable such as inflation, consumption, etc.
They explain the return and risk characteristic of portfolios
Are often associated with a risk premium that investors receive for either bearing an
undesirable return profile (i.e. low returns in bad times) or for behavioral reasons that
prevent arbitrage of such factors
What is Factor Investing?
Factor investing is to look at the investable world through a particular lens
Tradable securities (e.g. stocks) are used as the instruments to achieve the factor
exposures
A factor portfolio may target exposure to a single factor or a combination of factors
Similar to other investments, factors possess observable risk and return profiles
Diversification & Factor Allocation involves the choice of allocation across factors in a
way that trades off these risk and return profiles to achieve particular investment goals
17Factor strategies should have a robust investment case and be implemented using well designed products Investment case Evidence – empirical evidence must support the Factor Belief – understand the economic and/or behavioral rational Sustainability – consider the factor is likely be competed away in the future Well designed products Systematic – a repeatable process that does not signify discretionary management Broad – large opportunity set to minimize risk coming from individual securities Simple – transparent and only as complicated as needed to achieve investment goals Cost effective – fees and costs should be considered in all stage of the process 18
ETF Market Landscape

19
We believe our leadership in smart beta/factor
investing positions PowerShares for strong
future growth
PowerShares is a pioneer of smart beta ETFs with a launch of its Our leadership
multi-factor range of Intellidex ETFs in 2003 – today’s smart betain smart
range of 93 ETFs is over $42B in AUM
beta/factor
Over the past 13 years PowerShares has created the most investing keeps
comprehensive range of smart beta and factor ETFs in the industry us competitive
– spanning equities, fixed income and alternatives
against existing
Over 70% of our smart beta and factor ETFs have greater than a players/new
5 year historical track record
entrants and
PowerShares has successfully partnered with a number of positions us for
Invesco’s active investment teams to create leading ETFs, e.g., future growth
senior bank loans and real estate
and success.
PowerShares is well positioned to become a leading component
provider for emerging packaged solutions, e.g. Rhode Island 529
plan, digital advice, etc.
PowerShares is one of a handful of ETF players with global
capabilities highlighted by local ETF platforms in the U.S., Canada
and EMEA
PowerShares is investing in strong and scalable infrastructure in
preparation for the expected high growth of smart beta and factor
ETFs in the future
Source: PowerShares Global ETF Products & Research, as of June 30, 2016.
204th largest US ETF provider:
Focused on smart beta & access
Top 3
ETF Industry Products
No. of AUM Market 12 Month Net as a %
Rank Firm Description Products ($B) Share Flows ($B) of AUM
1 iShares Diversified 340 873 39% 91 19%
2 Vanguard Low Cost 70 540 24% 76 27%
3 State Street SPY, GLD + Sector SPDRs 164 434 19% 20 54%
4 PowerShares Smart beta + Access 140 96 4% 0 17%*
5 Schwab Low Cost 21 48 2% 14 37%
6 WisdomTree Dividend Weighted 96 38 2% (14) 51%
7 First Trust Smart beta 103 37 2% (3) 24%
8 Guggenheim Access 76 28 1% (2) 43%
9 Van Eck Access 55 28 1% 2 56%
10 ProShares Access 150 26 1% 5 25%
*Ex-QQQ, 49% with QQQ included
Source: Bloomberg L.P. Data as of June 30, 2016.
21ETF industry flows are positive across all
categories though total flows were flat vs. 2014
Domestic calendar year net flows 2016 flows are
300 currently at $67B
(6/30/16)
250
Fixed Income
200
products are
leading 2016
Net flows ($B)
150
flows with $17B
100
50
0
2010 2011 2012 2013 2014 2015
Total industry flows
Source: Bloomberg L.P. Data as of Dec. 31, 2015. Net flow differences may be due to rounding.
22ETF industry trends
1
Global ETF asset growth continues
Total global ETF AUM = $3.2 trillion*
US constitutes 73% of globally managed AUM
Global landscape for ETFs continues to expand with new opportunities coming from various regions
including other parts of NA and Asia Pacific
2
“Smart beta” strategies are growing faster (on a 3YR & 10YR CAGR) than the overall ETF market
and represent 12% of the US ETF market
Growing use of smart beta strategies by both institutional and retail investors in the US
Non-US investor demand is at an early stage (remains in the “awareness” stage)
Rapidly growing adoption of factor investing within smart beta. Factor investing, multi-factor strategies
have led smart beta fund launches (84) 2015 through YTD 2016 (9)
3
Rapidly growing smart beta competition from large existing competitors and new entrants
including traditional active asset managers
Proliferation of new smart beta launches
Crowded market with existing players makes it challenging for new entrants to differentiate their
messaging
4
Investors’ quest for yield, low volatility and quality investment continues
Fixed income has led all categories in terms of flows over the last 12 months, attracting over $87 billion
in flows between both taxable and municipal based products
Rising apprehension related to traditional bond investing is prompting investors to diversify their fixed
income holdings and turn to alternative multi-asset (including dividends, preferreds, international bond,
real estate, equity income, MLPs etc.)
Investors continue to flock to managed volatility products and have been adopting other factors including
momentum and quality gaining popularity more recently
Source: PowerShares Global ETF Products & Research, as of June 30, 2016.
*Source: ETFGI as of June 30, 2016.
23ETF industry trends (cont’d)
Department of Labor (DOL) proposed fiduciary rule for retirement accounts
5 US retail advisors and RIA’s are likely to see increased pressure to steer client toward low cost passive
product with the advent of the new DOL ruling
ETFs may benefit from the DOL rule
Growing use of smart beta & factors by institutions and advisors
6 Increasing demand from some institutions, including sovereign wealth funds and pensions, to factor
investing strategies away from alternatives
Institutional demand for ETFs are growing at a faster rate than retail in the US driven in large part by
increasing demand in fixed income and factor ETFs
Active ETF’s potential to be a growth driver remains untapped
7 The first non-transparent active ETF launched this year was met with a lot of skepticism to date has very
little volume and minimal assets
Different transparency standards and other operational differences between active ETFs and mutual funds
are key inhibitors
Active ETFs represent only 1% of industry assets and 3% of 12 month flows
More providers filed for non-transparent active ETF exemption
Source: PowerShares Global ETF Products & Research, as of June 30, 2016
24Smart beta ETFs 25
Growth of index-based investing

         1890s                      1920s                      1970s                      1990s              2000s
         First price              First market cap             First index                                 First smart beta
                                                                                       First ETF (1993)4
      weighted index2             weighted index2             mutual fund3                                   ETF (2003)5

For illustrative purposes only.

    From 2010 to 2015
    Smart beta ETFs captured over 22%
    of US ETF equity inflows and now
    represent 12% of total industry
    assets.1
    We anticipate that this trend will
    continue in 2016.

1   Source: Bloomberg, L.P. as of June 30, 2016
2   Source: S&P Dow Jones Indices, djindexes.com
3   Vanguard, vanguard.com
4   State Street Global Advisors, spdrs.com. 5) Guggenheim , Guggenheiminvestments.com; PowerShares,
    PowerShares.com. An investor cannot invest directly in an index.

26
Common industry definitions
“The common thread among [smart beta ETFs] is that they seek to either
improve their return profile or alter their risk profile relative to more
traditional market benchmarks.” 1
– Ben Johnson, Director of Passive Funds Research, Morningstar
Common definitions for smart beta ETFs
Also known as:
Alternative Beta
Alternative Indexing
Based on Strategic Beta
Predetermined Rules, Not Market Can Track a Advanced Beta
Systematically Cap Weighted Variety of Factors
Rebalanced
1 Source: “The Strategic Factor of Smart Beta” Morningstar Magazine, April/May 2014
Beta is a measure of risk representing how a security is expected to respond to general market movements.
Smart beta: an alternative and selection index based methodology that may outperform a benchmark or
mitigate portfolio risk, or both in active or passive vehicles. Smart beta funds may underperform cap-
weighted benchmarks and increase portfolio risk.
27PowerShares definition
Employing features of
both worlds:
May outperform a
benchmark*
Replicates an index with
rules-based methodology
Provides broad market
Passive exposure
cap-weighted Smart beta Active
Ability to potentially
reduce risk through
diversification beyond a
single security**
Liquidity1
Lower costs2
Transparency3
Beta: is a measure of risk representing how a security is expected to respond to general market movements.
Smart beta: an alternative and selection index based methodology that may outperform a benchmark or mitigate portfolio risk, or
both in active or passive vehicles.
*Smart beta funds may underperform cap-weighted benchmarks and increase portfolio risk. There is no assurance that
an investment strategy will outperform or achieve its investment objectives.
** Diversification does not guarantee a profit or eliminate the risk of loss.
1 Liquidity: Shares are not individually redeemable and owners of the shares may acquire those shares from the Fund and tender
those shares for redemption to the Fund in Creation Unit aggregations only, typically consisting of 50,000, 75,000, 100,000 or
200,000 shares.
2 Low Cost: Since ordinary brokerage commissions apply for each buy and sell transaction, frequent activity may increase the cost
of ETFs.
3 Transparency: ETFs disclose their holdings daily.
28Like everything else, how we invest has evolved
Alpha Alpha Alpha
Smart
beta/factor
investing
Beta Beta
Time
For illustrative purposes only and should not be deemed as an asset allocation recommendation.
29Global financial crisis
The global financial Coming out of 2008, many of our
crises created: clients have placed a renewed
emphasis on:
Extreme market uncertainty Tactical asset allocation
(vs. buy & hold strategic
Record-high volatility asset allocation)
Sharp portfolio drawdowns Intraday liquidity1
Steep capital gain tax Daily transparency2
consequences
Cost3
Tax efficiency4
1 Liquidity: Shares are not individually redeemable and owners of the shares may acquire those shares from the
Fund and tender those shares for redemption to the Fund in Creation Unit aggregations only, typically
consisting of 50,000, 75,000, 100,000 or 200,000 shares.
2 Transparency: ETFs disclose their holdings daily.
3 Cost: Since ordinary brokerage commissions apply for each buy and sell transaction, frequent activity may
increase the cost of ETFs.
4 Tax Efficiency is a measure of performance for an investment or a fund that is calculated by dividing the after-
tax return by the pre-tax return. PowerShares does not offer tax advice. Please consult your own tax advisor
for information regarding your own tax situation.
30Core PowerShares competencies To be a global leader requires strength and presence in both the retail and institutional channels PowerShares maintains unique competitive advantages (US advisor market, smart beta, innovation, brand) Fast moving and fierce competition requires ETF leaders to be bold and nimble ETFs present a unique asset management opportunity to globally “passport” a product line Specialized and strong infrastructure (e.g., portfolio implementation, investment operations & technology, trading, product development, and legal) is a critical competitive edge in scaling an ETF business globally Organizational alignment, focused investment, governance, and accountability are necessary 31
The smart beta market has grown faster than the
overall ETF industry over the past 10 years
ETF growth rates ETF industry has
grown from
1400%
$426B in 2007 to
1200% 2.3T in 2016
1000% Smart beta AUM
has grown from
800%
an AUM of $21B in
600% 2007 to $273B in
2016
400%
200%
0%
2007 2008 2009 2010 2011 2012 2013 2014 2015 2016
Industry Growth Smart Beta Growth
Source: PowerShares Product Strategy & Research, as of June 30, 2016.
32Demand for smart beta ETFs has continued to
increase and is projected to reach $602B in 2020
ETF AUM by investing style Smart beta
2016 2020 industry AUM is
1% 1% currently $272B
12% 15%
Smart beta ETFs
are expected to
18% 15% grow to 15% of
the ETF market
69% 69% by 2020
Investing style percentage Investing style percentage
Pure passive 69% Pure passive 69%
Passive access 18% Passive access 15%
Smart beta 12% Smart beta 15%
Active 1% Active 1%
Source: Bloomberg L.P. Data as of June 30, 2016. Invesco estimates based on 3-Year CAGRs.
33PowerShares YTD net flows into smart beta are
the most diverse (11% HHI) amongst our
largest smart beta competitors
Net Flows ($M) YTD Herfindahl- Herfindahl-
Market
AUM Market Hirschman Hirschman
Rank Provider Share
($B) Share Index* Index*
% June YTD 1 Yr
Change (AUM) (Flows)
1 iShares 60 22.6% 3,009 13,962 18,239 5.95% 16% 25%
2 PowerShares 42 15.7% 885 2,712 2,929 0.89% 6% 11%
3 WisdomTree 36 13.6% (2,378) (10,328) (13,229) -6.44% 13% 14%
4 Vanguard 36 13.6% 672 2,924 3,287 1.29% 52% 53%
5 State Street 29 11.1% 16 (1,657) (222) -0.87% 25% 17%
6 First Trust 24 9.1% (284) (3,107) (4,707) -1.93% 5% 23%
7 Guggenheim 15 5.8% 123 (882) (2,145) -0.52% 41% 30%
8 Schwab 8 3.2% 492 1,666 3,022 0.65% 28% 20%
Northern Trust
9 4 1.4% 67 797 949 0.27% 21% 46%
FlexShares
10 Goldman Sachs 2 0.6% 154 695 1,556 0.27% 21% 35%
Remainder 8 3.2% 402 1,225 1,132 0.44% N/A 46%
Total 264 100% 3,157 8,007 10,811
*Herfindahl-Hirschman Index is a measure of the firm’s AUM or Flow concentration by product. A lower value indicates the firm’s AUM or flows are
diversified across their product line. Calculation: where si is the market share of firm i in the market, and N is the number of firms.
Source: PowerShares Global ETF Products & Research, as of June 30, 2016
View includes FoF for all firms
34Smart beta pioneers since 2003
PowerShares industry leadership in first-to-market ETF innovation:
Total Funds
in PowerShares
Year Index Methodology Introduced PowerShares ETF Example (Ticker) Family¹
2003 Quantitative Constructed Dynamic Large Cap Value (PWV) 15
International Dividend International Dividend AchieversTM (PID) 1
2005
Fundamentals Weighted Equity FTSE RAFI US 1000 (PRF) 15
2006 Share Buybacks Buyback AchieversTM ( PKW ) 2
Emerging Sovereign Debt Emerging Markets Sovereign Debt (PCY ) 2
2007 Momentum DWA Momentum (PDP) 15
Options S&P 500® BuyWrite Portfolio (PBP) 1
High Quality Weighted S&P 500® Quality (SPHQ)² 2
2010 Fundamentals Weighted/Fixed-Income Fundamental High YieldTM Corporate Bond (PHB) 3
Yield Weighted REIT KBW Premium Yield Equity REIT Portfolio (KBWY) 1
Volatility-Weighted S&P 500® Low Volatility (SPLV) 10
2011
Beta-Weighted S&P 500® High Beta (SPHB) 3
Multi-Strategy Alternative Multi-Strategy Alternative Portfolio (LALT 1
2014
Laddered Corporate Bond LadderRite 0-5 Year Corporate Bond (LDRI) 1
1 Represents the number of funds in the PowerShares ETF Family that utilize the corresponding methodology
introduced.
2 On March 18, 2016, at the close of markets, changes to the Fund's name were made. For more information
about the changes, please see the Funds’ prospectus.
35Product Strategy & Research 36
We believe our product line is well positioned
to succeed
Product innovation is in our DNA
The strength of our product line offers competitive
advantages
Transform product innovation into “client innovation”
37Product innovation is in our DNA
Single focus on leading the smart beta ETF revolution since 2003,
with major product innovations
Pioneered the first factor- The first smart beta Invented the first smart beta
based equity ETF in 2003 commodity ETF in 2006 fixed income ETF in 2007
Nine of our top 10 ETFs are first-to-market/first-of-its-kind
Ticker Fund AUM ($M) First to market/First of its kind
SPLV Powershares S&P 500 Low Volatility Portfolio 7,645
BKLN PowerShares Senior Loan Portfolio 5,188
PGX PowerShares Preferred Portfolio 4,717
PRF PowerShares FTSE RAFI US 1000 Portfolio 4,314
PCY Powershares Emerging Markets Sovereign Debt 3,835
Portfolio
SPHD PowerShares S&P 500 High Dividend Low Volatility 2,677
Portfolio
DBC PowerShares DB Commodity Index Tracking Fund 2,404
PGF PowerShares Financial Preferred Portfolio 1,842
PRFZ PowerShares FTSE RAFI US 1500 Small-Mid Portfolio 1,480
PDP PowerShares DWA Momentum Portfolio 1,433
Source: PowerShares Global Products & Research, as of August 31, 2016.
38While the barriers to entry for ETFs are low, the barriers to gain scale are high due to first mover advantages There is a significant first mover advantage in ETFs - the first mover gets an automatic, and potentially insurmountable boost in assets The rationale for first mover advantage is due to liquidity, size and familiarity with the ticker Industry statistics had shown that in 71% of all product segments, the first mover had the most assets Subsequent entrants tend to compete with a first mover fund on price though not always successfully We spend a lot of time and effort developing first-of-its-kind ETFs. Among the 20 largest PowerShares ETFs, 17 were first-to-market ETFs, 13 of them are still the leaders in the space they cover Source: PowerShares Global Products & Research, as of August 31, 2016. 39
Strong product development track record

We raised $21 billion from new products launched over the last five years,
the 2nd highest in the industry.

Product development trend (2011-2016)
                              Total AUM raised from                        # new products
                            new product launches ($B)                         launched
             iShares                                               107.8                  174
     PowerShares                    21.2                                        41
            Schwab                 17.8                                    10
         Vanguard                 15.9                                     7
                SSgA             13.5                                                73
        First Trust             12.8                                                60
     Guggemheim               6.0                                              28
            Van Eck           4.9                                              35
        ProShares            4.8                                                    59
     WisdomTree              2.9                                                    56

Source: PowerShares Global Products & Research, as of August 19, 2016.

40
Our product line offers competitive advantages
A diverse, all-weather line-up of 141 ETFs covering major asset classes and
strategies to help meet investors’ changing needs.
PowerShares product line by asset class
Int'l Equity
$6 B
Fixed Income
$22 B
US Equity
$73 B
Commodities
& Currencies
$6 B
A complete tool box to facilitate the delivery of value-added solutions
Minimizes product concentration risk
41We are well positioned to participate in fixed
income growth
We have $22B in fixed income ETFs and rank #4 in industry’s fixed income AUM
YTD, net flow into fixed income ETFs makes up 64% of our total and is the industry’s
3rd highest
Our 19 fixed income ETFs cut across markets, credit and duration spectrum. Seven of
our fixed income ETFs have AUM>$1B due to early mover advantage
Latest innovation: PowerShares Variable Rate Investment Grade Portfolio
Fixed Income
AUM ($B) YTD Net Flows ($B)
iShares 232.5 35.9
Vanguard 103.8 16.9
State Street 42.7 3.7
PowerShares 21.6 4.8
PIMCO 12.1 0.8
Guggenheim 8.4 1.5
Van Eck 8.2 2.2
Schwab 6.4 1.7
Northern Trust 2.6 0.1
First Trust 2.2 1.0
WisdomTree 0.8 (0.1)
Source: Bloomberg L.P. Data, as of August 31, 2016.
42Our product line is diverse
Our product line consists of tools to help investors:
Extract alpha and/or manage risk - smart beta ETFs
Gain precise market exposures - Access ETFs
PowerShares product line by strategy
Access
Smart beta Access ex-QQQ
Non-market cap weighted $21 B Market-cap weighted
Single factor building Exposure to:
blocks Sectors
Multi-factor Industries
Fundamental or equal Smart beta Themes
weighted $44 B
Top 3 PowerShares ETFs: QQQ Top 3 PowerShares ETFs:
S&P 500 Low Volatility $40 B QQQ
FTSE RAFI US 1000 Bank Loan Portfolio
S&P 500 High Dividend Preferred Portfolio
Low Volatility
Source: PowerShares Global Products & Research, as of August 31, 2016.
43Our product line has continued to gain scale
The number of our billion-dollar ETFs has increased from 8 to 19
over the last five years
Number of PowerShares ETFs with AUM > $1 Billion
19
8
2011 2016
Source: PowerShares Global Products & Research, as of August 31, 2016.
44Our smart beta line-up is well established
Scale: The 2nd largest provider with $44 Billion in smart beta AUM
Breadth: The broadest smart beta line-up with 85 ETFs. Top competitors’ smart beta
AUM are concentrated in dividend ETFs.
Track record: The most number of smart beta ETFs with track record > 5 years
Depth: The most number of smart beta ETFs with AUM > $500M
The 2nd Largest The Broadest The Most The Most
smart beta Provider smart beta Line-Up Number of SB ETFs Number of SB ETFs
with at least a 5-yr with AUM>$500M
Track Record
15% 19%
21% 35%
$44B 85 62 20
smart beta smart beta
in smart beta smart beta
ETFs with at ETFs with
AUM ETFs
least a 5-year AUM>$500M
track record
PowerShares as % of Industry
Source: PowerShares as of August 31, 2016. The smart beta category includes ETFs that have an alternative and
selection index based methodology that seeks to outperform a benchmark or reduce portfolio risk, or both. Industry
remainder represents all ETF products that meet this criteria, excluding PowerShares smart beta products. Smart
beta funds may underperform cap-weighted benchmarks and increase portfolio risk. Beta is a measure of risk
representing how a security is expected to respond to general market movements.
45Transform product innovation into “client
innovation”
Leverage our diverse, all-weather line-up to build product loyalty through
differentiated, value-added client engagement tools and services.
Portfolio Thought leadership &
Digital offering
construction research
Custom ETF solutions Online platform will Smart beta
to meet specific be a key channel
objectives/outcome driving demand for Factor investing
ETFs
Factor DNA analysis
ETFs and digital
advice may benefit
from the new DOL
rule
Exploit synergies
between
PowerShares and
Jemstep to offer
superior online
experience
46Institutional 47
US Institutional demand for ETFs is growing faster than retail Certain institutional channels are increasingly adding ETFs to improve risk budgeting and liquidity profiles of their portfolios and trading strategies PowerShares and Invesco have strong global capital markets relationships with the sell-side which we can further leverage to reach institutional clients PowerShares is currently under-represented in its coverage of institutional clients versus major competitors and the overall industry average PowerShares strength in smart beta ETFs is a unique differentiator to institutions who are increasingly becoming accepting of the benefits of smart beta solutions (e.g., low volatility, high momentum, etc.) 48
Outlook for institutional use

A majority of institutional decision makers plan to increase use of
smart beta ETFs

Expected change in the next 3 years

             Somewhat/Significantly Decrease                 Neither Increase or Decrease
             Somewhat/Significantly Increase

            Smart Beta ETFs   3%         38%                                 59%

           Market Cap Index   13%                39%                                48%

                Active ETFs   8%                  53%                                40%

     Leveraged/Inverse ETFs   12%                           70%                            18%

Evolution of Smart Beta ETFs, Market Strategies International, as of January 2016

49
Institutions plan to increase use of smart beta ETFs
Which types of smart beta ETFs will you likely begin using in the next three years?
Current Usage Expected Usage (Next 3 years)
64% 63%
62%
60%
55%
51%
44% 43%
40% 39% 40% 39%
35%
25%
20% 20%
1% 1%
High Dividend Low Volatility Fundamental Weight Equal Weight High Beta Enhanced Fixed Currency-Hedged Momentum Other
Income
“Forty-five percent of all institutional decision-makers expect to allocate more assets to smart
beta funds moving forward -- proof of the growing acceptance and understanding of the
category. Even among those who haven’t yet used a smart beta ETF, 3 in 10 expect to do so.”
* Evolution of Smart Beta ETFs, Market Strategies International, as of January 2016
Evolution of Smart Beta ETFs, Market Strategies International, as of January 2016
50In the institutional channels, ETFs are often used
when there is a high priority for liquidity,
transparency or convenience
Strategy Objective Pensions, Consultants Insurers OCIO, asset Hedge
Endow. & mgrs & MFs Funds
found
Transition Management Maintain exposure while searching for X X X
new managers
Rebalancing Reduce implementation time to change X X X X
exposures in asset classes
Cash Equitization Maintain liquidity while remaining fully X X X X
invested
Portfolio Completion Aims for portfolio diversification and X X X X X
seeks to minimize benchmark risk
while maintaining performance
objectives.
Securities Lending Potential for additional return X X X
Tactical Adjustments to Over - or underweight certain styles, X X X X
Asset Allocation regions or countries on the basis of
short term view
Long / Short ETF Obtain long or short exposure X
Applications
Taxable Plans Benefit from the tax efficiency of ETFs X X
Fixed Income Duration Fine-tune the target duration and X X X X X
and Credit Adjustments credit quality of fixed income portfolios
Small Institutional Implement the desired asset allocation X X X
Plans regardless of plan size
Source: Invesco
51PowerShares is skewed to retail ownership given
its historical focus on Advisors and smart beta
strategies
We maintain a strong retail
100%
distribution focus
90%
Institutions have not yet fully
80% 42%
embraced smart beta. Only 24%
70% 57%
of firms surveyed in our Cogent Study
used smart beta with an average 60%
allocation of 7% 50%
40%
30% 58%
20% 43%
10%
0%
PowerShares Industry
Institutional Assets Retail
Source: FactSet 13F data as of June 30, 2016.
Source: Cogent Research/PowerShares Institutional Survey, October 2013.
52US Institutional use of smart beta ETF strategies
is expected to increase
53% of institutional clients Reasons for using smart beta ETFs Reasons for not using smart beta ETFs
surveyed in our Cogent
(Top 5) (Top 5)
Study expected to increase
Outperforms
smart beta usage (higher market 31%
Lack of
34%
familiarity
than any other segment) indexes
PowerShares smart beta Lack of
Diversification 18% history/ 12%
has the longest track track record
record in smart beta
space, with competitive
Reduce
performance record volatility/beta
18% No need 11%
Not part
Alternative
of our
weighting 18% 10%
investment
of assets
strategy
Better asset Prefer active
13% 9%
risk return management
Source: Cogent Research/PowerShares Institutional Survey, October 2013
53Capital Markets 54
ETF Capital Markets are a critical component of
the ETF ecosystem

It is imperative to be well coordinated and aligned with both internal and
external functions in order to leverage the opportunity within ETF capital
markets

            Sales                                          Marketing

                                    Capital
                                    Markets

          Product                                            Portfolio
        Development                                        Management

Strong ETF Capital Markets coordination helps ensure liquid markets and a
better client experience

55
Department mandate Our core functions Liquidity & Execution Services: The liquidity and execution services team is in place to help financial advisors and institutional clients navigate the ETF trading process. The team helps clients assess the potential liquidity of PowerShares ETFs, developing a client- specific trading strategy and evaluating the potential impact of a trade Market Maker & Authorized Participant Relationship Management: As ETFs trade in the secondary market and cannot be purchased directly through the ETF issuer, efficient trading is dependent on the ETF market maker community. The PowerShares Global Capital Markets team works with various market making firms, A.Ps and other sell side firms to ensure these parties may effectively make markets in PowerShares products. In addition, the team continuously monitors secondary market activity, assessing and tracking market maker performance, evaluating spreads and monitoring trading activity Research & Content: The PowerShares Global Capital Markets team provides actionable market commentary to our clients. This involves assimilating and distilling high quality buy side and sell side research into ETF investment strategies and providing market perspectives Sales Support: Maintain a strong pulse on sales challenges and opportunities as well as support various sales teams across all channels by providing subject matter expertise 56
How are we ensuring a seamless client experience?

Cost of owning an ETF: Operating Expense Ratio (OER), Trade Commission,
Transaction Costs – Bid/Ask spreads
Example using PowerShares Emerging Markets Sovereign Debt ETF

57
Bid Ask Spreads make up a key component of the
ETF investment wrapper

ABC ETF

          OER1                   Commission              Bid/Ask Spread

                                          Total Cost

XYZ ETF

                OER1                 Commission        Bid/Ask Spread

                                     Total Cost
1 Operating Expense Ratio
For illustrative purposes only

58
We believe our leadership in smart beta/factor
investing positions PowerShares for strong
future growth
PowerShares is a pioneer of smart beta ETFs with a launch of its
multi-factor range of Intellidex ETFs in 2003 – today’s smart beta
Our leadership
range of 93 ETFs is over $42B in AUM in smart
beta/factor
Over the past 13 years PowerShares has created the most
comprehensive range of smart beta and Factor ETFs in the investing
industry – spanning equities, fixed income and alternatives keeps us
Over 70% of our smart beta and factor ETFs have greater than a
competitive
5 year historical track record against
existing
PowerShares has successfully partnered with a number of
Invesco’s active investment teams to create leading ETFs, e.g., players/new
senior bank loans and real estate entrants and
PowerShares is well positioned to become a leading component
positions us for
provider for emerging packaged solutions, e.g. Rhode Island 529 future growth
plan, digital advice, etc. and success.
PowerShares is one of a handful of ETF players with global
capabilities highlighted by local ETF platforms in the U.S., Canada
and EMEA
PowerShares is investing in strong and scalable infrastructure in
preparation for the expected high growth of smart beta and Factor
ETFs in the future
Source: Invesco as of June 30, 2016
59Questions 60 II-PS-PPT-1I 09/16
You can also read