Our performance data ERM Sustainability Report 2021
←
→
Page content transcription
If your browser does not render page correctly, please read the page content below
Our performance data
                                           ERM Sustainability Report 2021

                                           © Copyright 2021 by ERM Worldwide Group Limited and/or its affiliates (‘ERM’). All Rights Reserved.
                                           No part of this work may be reproduced or transmitted in any form or by any means, without prior
                                           written permission of ERM.

Photo credit: Shona King, United Kingdom   The business of sustainability
Overview of content

 Performance data                                                    Pages
 Business conduct & ethics data                                        3-6
 Our people data                                                      7 – 12
 Health, safety & well-being data                                    13 – 20
 Climate-related risk data                                           21 – 33
 Contributing to society & local communities data                    34 - 35
 Client satisfaction data                                            36 - 37

www.erm.com   ERM Sustainability Report 2021: All performance data             2

Business conduct
                                          & ethics data

Photo credit: Tree Raine, United States
PERFORMANCE RESULTS
  Business conduct & ethics data

  Business conduct & ethics new starter training                                      GRI 102-17

  Percentage completion of ERM business conduct and ethics mandatory new starter training requirements¹

                                                               1%

                                                                99%

                                                   Completed        Not completed

¹Data subject to a 1% error rate.

www.erm.com                    ERM Sustainability Report 2021: All performance data                       4
PERFORMANCE RESULTS
  Business conduct & ethics data

  Business conduct & ethics refresher training                                          GRI 404-2

  Percentage completion of required refresher training for employees with designated due dates on or before 31 March 2021¹

                                                                2%

                                                                  98%

                                                    Completed        Not completed

¹Data subject to a 1% error rate.

www.erm.com                    ERM Sustainability Report 2021: All performance data                                          5
PERFORMANCE RESULTS
  Business conduct & ethics data

  Fines or nonmonetary sanctions                                                      GRI 419-1

  Compliance with laws and regulations:

  Fines or nonmonetary sanctions for material noncompliance with laws or regulations:

  • There were no fines or nonmonetary sanctions for material noncompliance with laws or regulations.

¹Data subject to a 1% error rate.

www.erm.com                    ERM Sustainability Report 2021: All performance data                     6

Our people data

Photo credit: ERM, China

PERFORMANCE RESULTS
 Our people data

 Employment contract & type                                          GRI 102-8

 Employees by employment contract, by gender FY21                                 Employees by employment contract, by region FY21

                                  Permanent         Temporary            Total                                     Permanent    Temporary   Total
  Female                             2,540               257             2,797   Asia Pacific                         894            91     985
  Male                               2,540               377             2,917   Europe, Middle East and Africa       1,230          126    1,356
  Nonbinary                             1                 0                 1    Latin America and Caribbean          478            21     499
  Not indicated                         1                 0                 1    North America                        1,888          331    2,219
  Total                              5,082               634             5,716   Global Businesses                    368            60     428
                                                                                 Group                                224             5     229
                                                                                 Total                                5,082          634    5,716
 Employment type, by gender FY21

                                  Permanent         Temporary            Total
  Female                             2,392               405             2,797
  Male                               2,562               355             2,917
  Nonbinary                             1                 0                 1
  Not indicated                         1                 0                 1
  Total                              4,956               760             5,716

www.erm.com       ERM Sustainability Report 2021: All performance data                                                                              8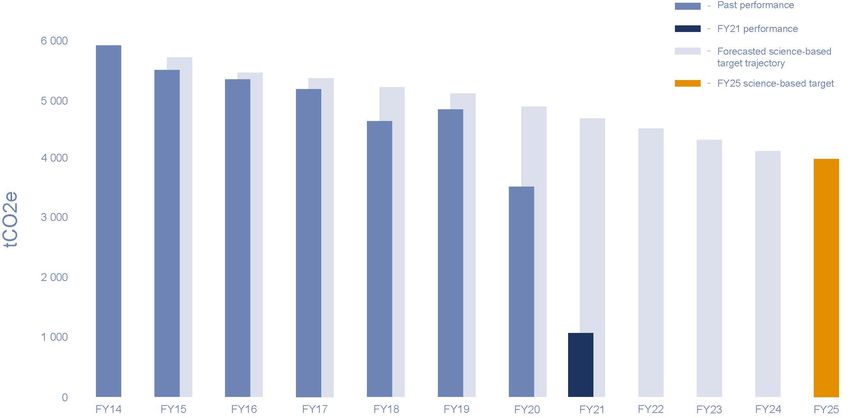
PERFORMANCE
                                                                                                                                                                       PERFORMANCE RESULTS
 Our people data

                                                                                                                                                                                   RESULTS
 New hires                         GRI 401-1

 New hires, by gender FY21                                                                                 New hires, by region FY21

                                            Total Number                    Rate                                                            Total Number   Rate
 Female                                             458                    45.5%                           Asia Pacific                         208        20.7%
 Male                                               540                    53.6%                           Europe, Middle East and Africa       224        22.2%
 Not indicated                                        9                     0.9%                           Latin America and Caribbean          36         3.6%
 Total                                             1,007                                                   North America                        357        35.5%
                                                                                                           Global Businesses                    163        16.2%
 New hires, by career level FY21
                                                                                                           Group                                19         1.9%
                                                                                          Not
                                                      Female                 Male      indicated   Total   Total                               1,007
  Partners                                                 8                     25       0         33
  Senior Consultants¹                                     28                     72       0        100
  Consultants²                                            347                    405      9        761
  Professional Support                                    75                     38       0        113
  Total                                                   458                    540      9        1,007

  ¹ Senior consultants include all consultants at ERM career levels 4 and 5
  ² Consultants include all consultants at ERM career levels entry to level 3.

www.erm.com              ERM Sustainability Report 2021: All performance data                                                                                      9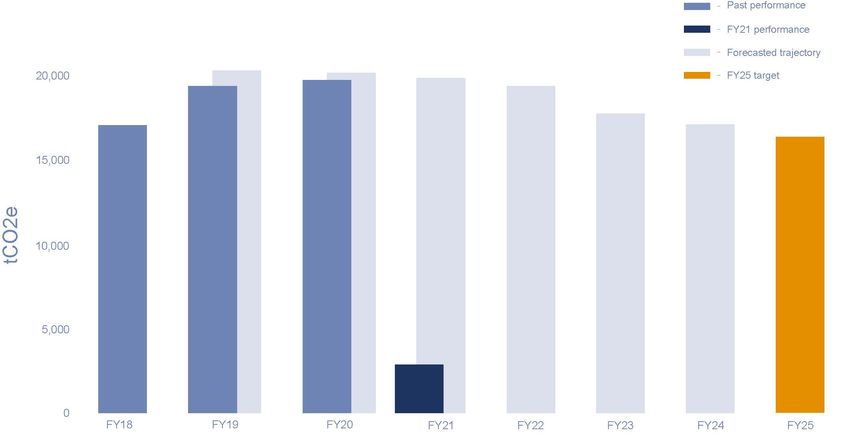
PERFORMANCE RESULTS
 Our people data

 Voluntary turnover                       GRI 403-9

 Voluntary turnover, by gender FY21

                              Total Number              Rate
 Female                              306                12.1%
 Male                                300                11.8%
 Total                               606                12.0%

 Voluntary turnover, by region FY21

                                           Total Number           Rate
 Asia Pacific                                     148            16.3%
 Europe, Middle East and Africa                   147            12.1%
 Latin America and Caribbean                      41             12.0%
 North America                                    219             8.5%
 Global Businesses                                32              8.3%
 Group                                            19             11.3%
 Total                                            606            12.0%

www.erm.com      ERM Sustainability Report 2021: All performance data    10
PERFORMANCE RESULTS
Our people data
Diversity by gender & age GRI 405-1
Percentage of employees, by gender FY19 – FY21
Female FY19 Male
Board of Directors 12.5% 87.5%
Executive Committee 13.3% 86.7%
Partners 23.5% 76.5%
Senior Consultants¹ 34.6% 65.4%
Consultants² 54.4% 45.6%
Professional Staff 75.0% 25.0%
All employees 47.6% 52.4%
Female FY20 Male
Board of Directors 11.1% 88.9%
Executive Committee 18.2% 81.8%
Partners 24.7% 75.3%
Senior Consultants¹ 34.9% 65.1%
Consultants² 52.2% 47.8%
Professional Staff 72.3% 27.7%
All employees 49.7% 50.3%
Female FY21 Male
Board of Directors 11.1% 88.9%
Executive Committee 25.0% 75.0%
Partners 26.1% 73.9%
Senior Consultants¹ 35.4% 64.6%
Consultants² 50.4% 49.3% 0.3% - Not indicated ³
Professional Staff 72.9% 27.1%
All employees 51.0% 48.8% 0.2% - Not indicated ⁴
¹ Senior Consultants include all consultants at ERM career levels 4 and 5.
² Consultants include all consultants at ERM career levels entry to level 3
³ 0.3% of consultants responded that ‘I choose not to indicate’.
⁴ 0.2% of total employees responded that ‘I choose not to indicate’.
www.erm.com ERM Sustainability Report 2021: All performance data 11PERFORMANCE RESULTS
Our people data
Diversity by gender & age GRI 405-1
Percentage of employees, by age group FY21
Under 30 30 - 50 Over 50 Not indicated
Board of Directors 0.0% 22.2% 77.8% 0.0%
Executive Committee 0.0% 0.0% 100.0% 0.0%
Partners 0.0% 44.6% 55.2% 0.2%
Senior Consultants¹ 0.2% 57.0% 42.8% 0.0%
Consultants² 35.9% 55.2% 8.6% 0.3%
Professional Support 11.5% 62.0% 26.1% 0.4%
All employees 22.0% 55.4% 22.3% 0.3%
¹ Senior Consultants include all consultants at ERM career levels 4 and 5.
² Consultants include all consultants at ERM career levels entry to level 3.
www.erm.com ERM Sustainability Report 2021: All performance data 12Health, safety &
well-being data
Photo credit: Mike Everett, South AfricaPERFORMANCE RESULTS
Health, safety & well-being data
DAWC rate
Days away from work case (DAWC) rate FY19 – FY21 ¹ ²
FY19 FY20 FY21
0.2 0.17 0.08 0.17
0.1
0.0
FY19 FY20 FY21
¹ Days away from work cases (DAWC) is the number of days away from work multiplied by 200,000 (with 200,000 hours
equivalent to 100 employees working a 40-hour week for 50 weeks of the year) and divided by the total number of hours
worked by all employees.
² Days away from work cases (DAWC) rate tracks any work-related injuries or illness that results in the injured/ill worker
being unable to work for 1 or more days following the event. ERM tracks this metrics for our sustainability targets and goals.
www.erm.com ERM Sustainability Report 2021: All performance data 14PERFORMANCE
PERFORMANCE RESULTS
Health, safety & well-being data
RESULTS
TRIR GRI 403-9
Total recordable incident rate (TRIR) FY19 – FY21 ¹ ²
FY19 FY20 FY21
0.4 0.36 0.28 0.28
0.3
0.2
0.1
0.0
FY19 FY20 FY21
¹ Data includes ERM employees only.
² Total Recordable Incident Rate (TRIR) is the number of recordable injuries and illnesses multiplied by 200,000 (with
200,000 hours equivalent to 100 employees working a 40-hour week for 50 weeks of the year) and divided by the total
number of hours worked by all employees.
www.erm.com ERM Sustainability Report 2021: All performance data 15PERFORMANCE RESULTS
Health, safety & well-being data
Severity rate GRI 403-9
Severity rate FY19 – FY21 ¹ ² ³ Severity rate, by region FY19 – FY21 ¹ ² ³
FY19 FY20 FY21
3.49 3.58 4.45 FY19 FY20 FY21
5
Asia Pacific 0.00 0.00 0.00
4 Europe, Middle East and Africa 3.84 0.77 3.15
3
Latin America and Caribbean 1.86 2.92 8.57
North America 5.58 7.01 7.06
2
Global Businesses 0.00 0.00 0.00
1 Group 0.00 0.00 0.00
Total 3.49 3.58 4.45
0
FY19 FY20 FY21
¹ Data includes ERM employees only.
² Severity rate is the total number of days away from work and restricted-duty days multiplied by 200,000 (with 200,000
hours equivalent to 100 employees working a 40-hour week for 50 weeks of the year) and divided by the total number of
hours worked by all employees.
³ Severity rates can vary due to number of hours worked, and the severity rate can be highly influenced by a single work-
related injury or illness.
www.erm.com ERM Sustainability Report 2021: All performance data 16PERFORMANCE RESULTS
Health, safety & well-being data
Recordable incidents GRI 403-9
Number of recordable incidents FY19 – FY21 *
FY19 FY20 FY21
20 17 15 13
15
10
5
0
FY19 FY20 FY21
*Data includes ERM employees only.
www.erm.com ERM Sustainability Report 2021: All performance data 17PERFORMANCE RESULTS
Health, safety & well-being data
Recordable incidents by type GRI 403-9
Recordable incidents, by type FY21 Number of recordable incidents, by type FY19 – FY21
FY19 FY20 FY21
Caught ¹ 1 0 0
Exertion ² 1 3 4
Exposure ³ 3 5 1
Hit ⁴ 5 5 4
Security/Violence ⁵ 1 0 1
Slips, trips & falls ⁶ 6 2 3
Total 17 15 13
Caught Exertion ¹ Includes caught on, in or under.
Exposure Hit ² Includes ergonomic (office or field) and fatigue.
Secuirty/Violence Slips, Trips & Falls ³ Includes chemical and environmental exposures.
⁴ Includes hit by and against.
⁵ Includes aggression/threats towards personnel.
⁶ Includes falls on stairs, falls to lower levels, falls from height, falls on same level, and slip/trips from stairs..
www.erm.com ERM Sustainability Report 2021: All performance data 18PERFORMANCE RESULTS
Health, safety & well-being data
Subcontractors GRI 403-9
Subcontractors injury and illness FY19 – FY21 *
FY19 FY20 FY21
Recordable injuries 8 5 1
Injury/illness incidents 43 33 21
Near miss 53 54 28
Total 104 92 50
*This data includes subcontractor workers only. A subcontractor for ERM provides services on an ERM project ultimately for
an ERM-external client. This includes lower-tier subcontractors.
www.erm.com ERM Sustainability Report 2021: All performance data 19PERFORMANCE RESULTS
Health, safety & well-being data
Safety AT ERM Score GRI 403-5
Safety AT ERM Score FY19 – FY21 ¹
FY19 FY20 FY21
Asia Pacific 47.3 92.8 86.4
Europe, Middle East and Africa 52.3 93.5 86.8
Latin America and Caribbean 70.4 82.2 94.3
North America 52.8 89.6 92.0
Global Businesses ² 42.2 65.4 38.4
Group ² 30.0 21.0 31.0
Global score ³ 54.9 90.2 89.9
¹ The Safety AT ERM score includes an evaluation of our overall program. The scores are calculated at the business unit
level, and the global score is derived by calculating a weighted average of each operational business unit score (weighted
based on hours worked). A target of 75 is given to each business unit and region for FY21.
² For Global Businesses, the maximum scoring potential is 75 instead of 100. Group does not have a goal as they are not
considered an operational business unit.
³ The global score does not include Global Business or Group performance, only the four main regions.
www.erm.com ERM Sustainability Report 2021: All performance data 20Climate-related risk data Photo credit: Nina Morrell, Canada
PERFORMANCE RESULTS
  Climate-related risk data

  Total GHG emissions                                             GRI 305-1, GRI 305-2, GRI 305-3

  Total GHG emissions FY19 – FY21 (tCO2e) *                                                                 Total GHG emissions, by region FY19 – FY21 (tCO2e) *

                       FY19                                FY20                                     FY21
                      27,218                              25,976                                    5,617
30,000                                                                                                                                             FY19      FY20    FY21
                                                                                                            Asia Pacific                           4,102    3,570    1,125
25,000
                                                                                                            Europe, Middle East and Africa         4,694    4,531    1,049
20,000
                                                                                                            Latin America and Caribbean            1,475    1,273    207
15,000                                                                                                      North America                         15,386    15,361   3,165
10,000                                                                                                      Global Businesses                       563      503      33

 5,000                                                                                                      Group                                   998      738      38
                                                                                                            Total                                 27,218    25,976   5,617
     0
                        FY19                                   FY20                                 FY21

  * Total GHG emissions include Scopes 1, 2 and 3 emissions.

www.erm.com              ERM Sustainability Report 2021: All performance data                                                                                                22
PERFORMANCE
PERFORMANCE RESULTS
Climate-related risk data
RESULTS
Total GHG emissions intensity GRI 305-4
GHG emissions intensity FY19 – FY21 (tCO2e/FTE) ¹ ²
FY19 FY20 FY21
6.0 5.2 4.9 1.2
5.0
4.0
3.0
2.0
1.0
0.0
FY19 FY20 FY21
¹ Total GHG emissions normalized by average full-time equivalent employees (FTEs).
² The disruption resulting from the COVID-19 pandemic significantly impacted ERM's GHG emissions in FY21.
www.erm.com ERM Sustainability Report 2021: All performance data 23PERFORMANCE RESULTS
Climate-related risk data
Scope 1 emissions GRI 305-1
Scope 1 emissions FY19 – FY21 (tCO2e) ¹ ² Scope 1 emissions, by region FY19 – FY21 (tCO2e) ¹ ²
FY19 FY20 FY21
1,389 1,453 998
1,400
FY19 FY20 FY21
1,200 Asia Pacific 80 77 53
1,000 Europe, Middle East and Africa 512 445 322
Latin America and Caribbean 36 27 15
800
North America 760 903 608
600
Total 1,389 1,453 998
400
200
0
FY19 FY20 FY21
¹ Scope 1 includes direct emissions from operations we own or control.
² Emissions from Global Businesses and Group are included in data for the ERM region in which employees' home offices
are located.
www.erm.com ERM Sustainability Report 2021: All performance data 24PERFORMANCE RESULTS
Climate-related risk data
Scope 2 emissions GRI 305-2
Scope 2 emissions FY19 – FY21 (tCO2e) ¹ ² Scope 2 emissions, by region FY19 – FY21 (tCO2e) ¹ ²
FY19 FY20 FY21
3,491 2,164 89
Location-Based Market-Based
4,000
FY19 FY20 FY21 FY19 FY20 FY21
3,500
Asia Pacific 733 667 443 733 667 12
3,000
2,500 Europe, Middle East and Africa 427 416 268 414 271 2
2,000 Latin America and Caribbean 98 81 45 98 81 0
1,500
North America 2,245 2,179 1,292 2,245 1,145 75
1,000
Total 3,503 3,344 2,048 3,491 2,164 89
500
0
FY19 FY20 FY21
¹ Scope 2 includes indirect emissions from purchased electricity.
² Emissions from Global Businesses and Group are included in the data for the ERM region in which employees' home offices are
located.
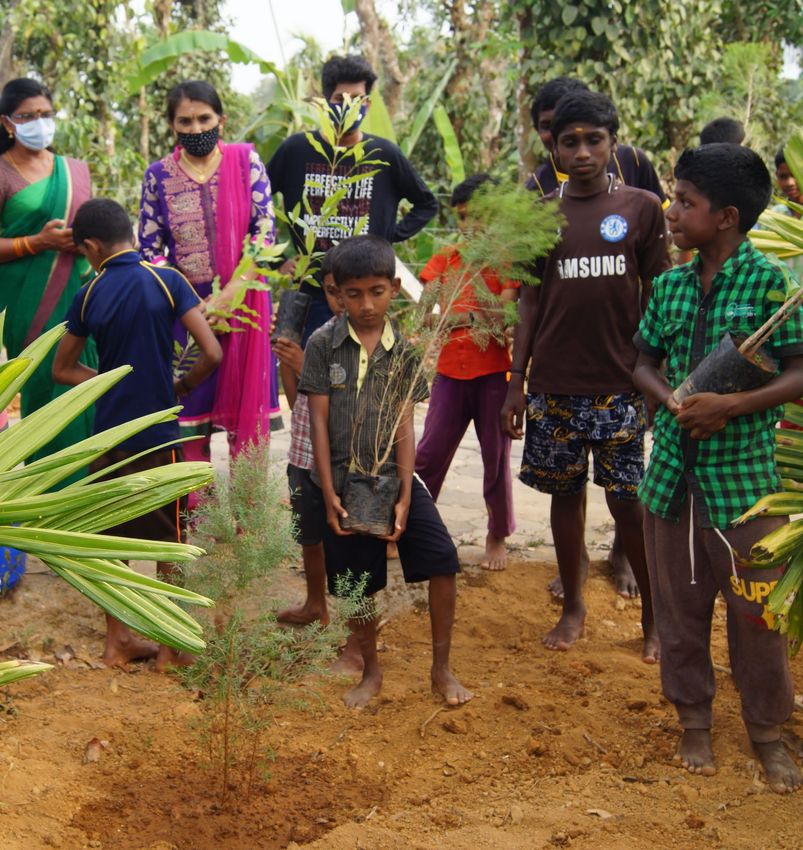
www.erm.com ERM Sustainability Report 2021: All performance data 25PERFORMANCE RESULTS Climate-related risk data Scope 1 & 2 trajectories SBT Scope 1 & 2 performance (tCO2e) www.erm.com ERM Sustainability Report 2021: All performance data 26
PERFORMANCE RESULTS
   Climate-related risk data

   Scope 3 emissions                                       GRI 305-3

   Scope 3 emissions FY19 – FY21 (tCO2e) ¹ ²                                                                               Scope 3 emissions, by region FY19 – FY21 (tCO2e) ¹ ²

                         FY19                                FY20                                   FY21
                        22,427                              22,360                                  4,530
25,000                                                                                                                                                            FY19      FY20    FY21
                                                                                                                           Asia Pacific                           3,288     2,826   1,059
20,000
                                                                                                                           Europe, Middle East and Africa         3,857     3,815   726
15,000                                                                                                                     Latin America and Caribbean            1,340     1,165   192
                                                                                                                           North America                         12,381    13,313   2,482
10,000
                                                                                                                           Global Businesses                      563       503      33
 5,000
                                                                                                                           Group                                  998       738      38

     0                                                                                                                     Total                                 22,427    22,360   4,530
                        FY19                                  FY20                                 FY21

   ¹ Scope 3 includes other indirect emissions that occur outside ERM (business travel, employee commuting, shared space
   electricity, and transmission and distribution losses).

   ² The reduction in Scope 3 emissions in FY21 was caused by significantly less business travel and employee commuting.

 www.erm.com               ERM Sustainability Report 2021: All performance data                                                                                                             27
PERFORMANCE RESULTS Climate-related risk data Scope 3 trajectory SBT Scope 3 performance (tCO2e) * * ERM has set a science-based target for business travel and employee commuting, covering 73% of the total Scope 3 inventory. www.erm.com ERM Sustainability Report 2021: All performance data 28
PERFORMANCE RESULTS
   Climate-related risk data

   Global office energy use                                                GRI 302-1, GRI 302-2, GRI-302-4

   Global office energy use FY19 – FY21 (MWh) ¹ ²                                                                             Global office energy use, by type FY19 – FY21 (MWh) ¹ ²

                         FY19                                FY20                                    FY21
                        16,604                              15,950                                  10,669
18,000                                                                                                                                                                FY19     FY20     FY21
16,000                                                                                                                        Office electricity from non-renewable
                                                                                                                              sources                                 7,649    4,677     22
14,000
12,000                                                                                                                        Electricity from renewable sources       302     3,089    4,924
10,000
 8,000
                                                                                                                              Fuel consumption                        2,954    3,283    2,644
 6,000                                                                                                                        Scope 3 other electricity               5,699    4,901    3,079
 4,000
 2,000                                                                                                                        Total                                   16,604   15,950   10,669
     0
                        FY19                                  FY20                                  FY21

   ¹ Employees from Global Businesses and Group are included in the data for the ERM region in which their home offices are
   located.

   ² For reporting purposes, only MWh using the regular method are included and upstream MWh are excluded.

 www.erm.com               ERM Sustainability Report 2021: All performance data                                                                                                                  29
PERFORMANCE
PERFORMANCE RESULTS
Climate-related risk data
RESULTS
Global energy use intensity GRI 302-1, GRI 302-2, GRI-302-4
Global energy use intensity FY19 - FY21 (KWh/m2) *
FY19 FY20 FY21
203 197 143
250
200
150
100
50
0
FY19 FY20 FY21
* Total global energy use normalized by total office floor space.
www.erm.com ERM Sustainability Report 2021: All performance data 30PERFORMANCE
PERFORMANCE RESULTS
Climate-related risk data
Gas Activity Geography Reference
Passenger car (all sizes and Department for Business, Energy and Industrial Strategy (2020). 2020
RESULTS
CO2, CH4, N2O Europe
fuel types) Government GHG Conversion Factors for Company Reporting.
References EPA (2020). GHG Emission Factors Hub. Center for Corporate Climate
Leadership. March 2020.
Data presented here supports the climate CO2, CH4, N2O
Passenger car (all sizes and North America and countries and
fuel types) outside Europe EPA (2020). Inventory of U.S. Greenhouse Gas Emissions and Sinks: 1990-
risk section of this report. All emissions 2018. United States Environmental Protection Agency.
data presented is expressed as carbon
dioxide equivalent (CO2e) and includes EC (2021). National Inventory Report. Greenhouse Gas Sources and Sinks
CO2, CH4, N2O Gasoline car Canada
all Kyoto gases and refrigerants. ERM in Canada: 1990 - 2019. Environment Canada.
uses the Fifth Assessment Report as a
source of global warming potential Commonwealth of Australia 2020 (Department of the Environment and
CO2, CH4, N2O Gasoline and Diesel cars Australia Energy). National Greenhouse Account Factors (NGA) - Australian National
(GWP) without climate feedback. The Greenhouse Accounts. October 2020.
detailed reference table can be found
below. Department for Business, Energy and Industrial Strategy (2020). 2020
CO2, CH4, N2O Petrol and diesel use Europe
Government GHG Conversion Factors for Company Reporting.
All data has been calculated using a North America and countries EPA (2020). GHG Emission Factors Hub. Center for Corporate Climate
market-based approach, unless CO2, CH4, N2O Gasoline and Diesel use
outside Europe Leadership. March 2020.
otherwise stated. For further information
GHG Protocol Brazil (2020). Ferramenta GHG Protocol 2020. Versão
on market-based methods, please refer CO2, CH4, N2O LPG South America 2020.V1.2. Programa Brasileiro GHG Protocol.
to http://www.ghgprotocol.org. (https://www.ghgprotocolbrasil.com.br/).
Department for Business, Energy and Industrial Strategy (2020). 2020
CO2, CH4, N2O Motorcycle World
Government GHG Conversion Factors for Company Reporting.
Department for Business, Energy and Industrial Strategy (2020). 2020
CO2, CH4, N2O Taxi Europe
Government GHG Conversion Factors for Company Reporting.
EPA (2020). GHG Emission Factors Hub. Center for Corporate Climate
Leadership. March 2020.
CO2, CH4, N2O Trucks US and countries outside Europe and
EPA (2020). Inventory of U.S. Greenhouse Gas Emissions and Sinks: 1990-
2018. United States Environmental Protection Agency.
India GHG Program, India Specific Road Transport Emission Factors
CO2 Auto-rickshaw Asia
(2015).
Department for Business, Energy and Industrial Strategy (2020). 2020
CO2, CH4, N2O Bus Europe
Government GHG Conversion Factors for Company Reporting..
www.erm.com ERM Sustainability Report 2021: All performance data 31PERFORMANCE
PERFORMANCE RESULTS
Climate-related risk data
Gas Activity Geography Reference
North America and countries EPA (2020). GHG Emission Factors Hub. Center for Corporate Climate
RESULTS
CO2, CH4, N2O Bus
outside Europe Leadership. March 2020.
References Department for Business, Energy and Industrial Strategy (2020). 2020
CO2, CH4, N2O Light rail World
Government GHG Conversion Factors for Company Reporting.
Department for Business, Energy and Industrial Strategy (2020). 2020
CO2, CH4, N2O National rail Europe
Government GHG Conversion Factors for Company Reporting.
North America and countries EPA (2020). GHG Emission Factors Hub. Center for Corporate Climate
CO2, CH4, N2O National rail (intercity)
outside Europe Leadership. March 2020.
RENFE (2017). Informe Anual de Responsabilid ad Social, Empresarial y
Gobierno Corporativo.
CO2 AVE Train Spain
(http://www.renfe.com/EN/empresa/RSE/InformesRSEyGobiernoCorporativ
o.html)
SNCF (2018). Information sur la quantité de gaz à effet de serre émise a
CO2e TGV train Europe
l’occasion d’une présentation de transport.
Thalys (2016). Thalys Carbon Footprint 2016.
CO2e Thalys train Europe (https://www.thalys.com/img/1505743154/pdf/developpement.../bilan-
carbone-en.pdf Accessed August 2018).
Department for Business, Energy and Industrial Strategy (2020). 2020
CO2, CH4, N2O Eurostar Europe
Government GHG Conversion Factors for Company Reporting.
Department for Business, Energy and Industrial Strategy (2020). 2020
CO2, CH4, N2O Underground World (except North America)
Government GHG Conversion Factors for Company Reporting.
EPA (2020). GHG Emission Factors Hub. Center for Corporate Climate
CO2, CH4, N2O Transit rail North America
Leadership. March 2020.
Department for Business, Energy and Industrial Strategy (2020). 2020
CO2, CH4, N2O Ferry World
Government GHG Conversion Factors for Company Reporting.
Department for Business, Energy and Industrial Strategy (2020). 2020
CO2, CH4, N2O Flights – all hauls and classes World
Government GHG Conversion Factors for Company Reporting.
IPCC (2006). Revised IPCC Guidelines for National Greenhouse Gas
District heating (natural gas
CO2, CH4, N2O World Inventories: Reference Manual. Intergovernmental Panel on Climate
CHP)
Change. Cambridge University Press, Cambridge.
EPA (2020). GHG Emission Factors Hub. Center for Corporate Climate
CO2, CH4, N2O District heating (steam) North America
Leadership. March 2020.
AGFW (2017). Liste der CO2-Bescheinigungen nach FW 309-6 nach
CO2 District heating Germany
Städten sortiert.
Department for Business, Energy and Industrial Strategy (2020). 2020
CO2, CH4, N2O Electricity (incl. T&D losses) UK
Government GHG Conversion Factors for Company Reporting.
www.erm.com ERM Sustainability Report 2021: All performance data 32PERFORMANCE
PERFORMANCE RESULTS
Climate-related risk data
Gas Activity Geography Reference
EPA (2021). eGrid2019. Release : 23/02/2021.
RESULTS
CO2, CH4, N2O Electricity (incl. T&D losses) US (https://www.epa.gov/energy/emissions-generation-resource-integrated-
References CO2, CH4, N2O Electricity (incl. T&D losses) Canada
database-egrid. Accessed April 6, 2021).
EC (2021). National Inventory Report. Greenhouse Gas Sources and Sinks
in Canada: 1990 - 2019. Environment Canada.
United Nations (2021). UN Statistics Division - Energy Balance
Visualizations. (https://unstats.un.org/unsd/energystats/dataPortal/)
World (except UK, US, Canada and
CO2, CH4, N2O Electricity (incl. T&D losses)
and Australia)
IPCC (2006). Revised IPCC Guidelines for National Greenhouse Gas
Inventories: Reference Manual. Intergovernmental Panel on Climate
Change. Cambridge University Press, Cambridge.
Commonwealth of Australia 2020 (Department of the Environment and
CO2e Electricity (incl. T&D losses) Australia Energy). National Greenhouse Account Factors (NGA) - Australian National
Greenhouse Accounts. October 2020.
AIB (2020). European Residual Mixes 2019. Version 1.0, 29th May 2020.
CO2e Electricity residual mix Europe
Association of Issuing Bodies.
EC (2021). National Inventory Report. Greenhouse Gas Sources and Sinks
CO2, CH4, N2O Natural gas Canada
in Canada: 1990 - 2019. Environment Canada.
Department for Business, Energy and Industrial Strategy (2020). 2020
CO2, CH4, N2O Natural gas Europe
Government GHG Conversion Factors for Company Reporting.
Commonwealth of Australia 2020 (Department of the Environment and
CO2, CH4, N2O Natural gas Australia Energy). National Greenhouse Account Factors (NGA) - Australian National
Greenhouse Accounts. October 2020.
EPA (2020). GHG Emission Factors Hub. Center for Corporate Climate
Leadership. March 2020.
CO2, CH4, N2O Natural gas US
and
EPA (2020). Inventory of U.S. Greenhouse Gas Emissions and Sinks: 1990-
2018. United States Environmental Protection Agency.
HCFC123, R11, R12,
IPCC (2013). IPCC Fifth Assessment Report: Climate Change 2013.
R401a, HFC134a,
Refrigerants World Intergovernmental Panel on Climate Change. Cambridge University Press,
R407c, R410a
Cambridge.
www.erm.com ERM Sustainability Report 2021: All performance data 33Contributing to society &
local communities data
Photo credit: Archana Somasekharan, IndiaPERFORMANCE RESULTS
Contributing to society & local communities data
Society GRI 201-1 Financial information GRI 201-1
Community investments FY19 – FY21 ($’,000)¹ Community investments FY19 – FY21 ($’,000)
FY19 FY20 FY21
Pro bono time – ERM Foundation² 331 269 132 This information can be found in the Financial
Overview section on our website (erm.com). FY21
Pro bono time – Strategic partners³ 281
data will be updated when finalized in
In-kind support⁴ 297 492 198 late 2021.
DIRECT CONTRIBUTIONS Please click here for more information.
Matching funds⁵ 183 185 179
Charitable contributions⁶ 12 12 12
Membership7 182 216 148
Total 1,005 1,175 949
Proportion of profit⁸ 1.05% 1.00% 0.82%
Employee contributions9, 10 141 198 69
¹ From FY21, the presentation of information has changed. In-kind support has been moved from Direct contributions, with pro bono
support to Strategic partners listed separately.
² Pro bono hours are registered by consultants on approved ERM Foundation projects. For ERM Foundation projects, pro bono time is
calculated at 80 percent of hourly chargeout rate.
³ From FY21, the pro bono time of ERM employees provided to ERM's strategic partners has been split out from in-kind support to
provide visibility to this contribution.
⁴ In-kind support includes salaries and direct costs for employees responsible for the ongoing operations of the ERM Foundation. Prior to
FY21 pro bono time provided by ERM to external partners was included in this calculation.
⁵ Matching funds are made on a 75 cents for each dollar donated basis, for most employee donations in all regions. From FY18, a
percentage of this budget was also used for ‘seed funding’ as part of a new program to support longer-term partnerships with nonprofit
organizations, particularly in geographies where employee-led fundraising is more challenging.
⁶ Charitable contributions made to organizations other than The ERM Foundation.
7 Membership fees for global sustainability-focused organizations, where ERM actively contributes to thought leadership activities.
⁸ Calculated from prior fiscal year’s Earnings Before Interest, Tax and Amortization (EBITA).Therefore, FY21 percentage calculated using
FY20 EBITA figure etc.
⁹ Funds raised by employees to support the ERM Foundation and other charities/nonprofit organizations.
¹ºIn FY21, there was a reduction in funds disbursed due to the impacts of the pandemic.
www.erm.com ERM Sustainability Report 2021: All performance data 35Contributing to society &
Client satisfaction data
local communities data
Photo credit: Suhas Fuladi, IndiaPERFORMANCE RESULTS Client satisfaction data Client satisfaction results ERM's services support our clients’ environmental, health, social, safety and sustainability needs across the entire life cycle of the business. Our FY21 target for tracking client satisfaction was to increase the average number of services provided to key clients by 10% (based on a 3-year rolling average). An objective of our key client program is to support our clients across a greater range of their sustainability needs, which would in turn access more of ERM's eight service lines. This metric was designed to be a proxy measurement for satisfaction based on the assumption that if a client has a high level of satisfaction from an engagement, they are more likely to engage ERM in other areas of the business. In FY21, we increased growth in the average number of services provided to key clients by 6% (3-year rolling average). We saw steady growth in the number of key clients accessing the breadth of ERM services in FY21 despite the disruptions caused by the pandemic. Key clients have been working with ERM for a longer period of time and by definition are larger accounts with a wider spectrum of engagements. These strong relationships enabled us to adapt our response to changing client needs. We continue to evolve our measurement of client satisfaction and therefore set a target for FY22 to establish an independent and verifiable client satisfaction process. www.erm.com ERM Sustainability Report 2021: All performance data 37
Photo credit: Suhas Fuladi, India

Contact us                       sustainability@erm.com   www.erm.com/sustainability-report

The business of sustainability
You can also read