OUR RESTAURANTS - AnnualReports.com
←
→
Page content transcription
If your browser does not render page correctly, please read the page content below
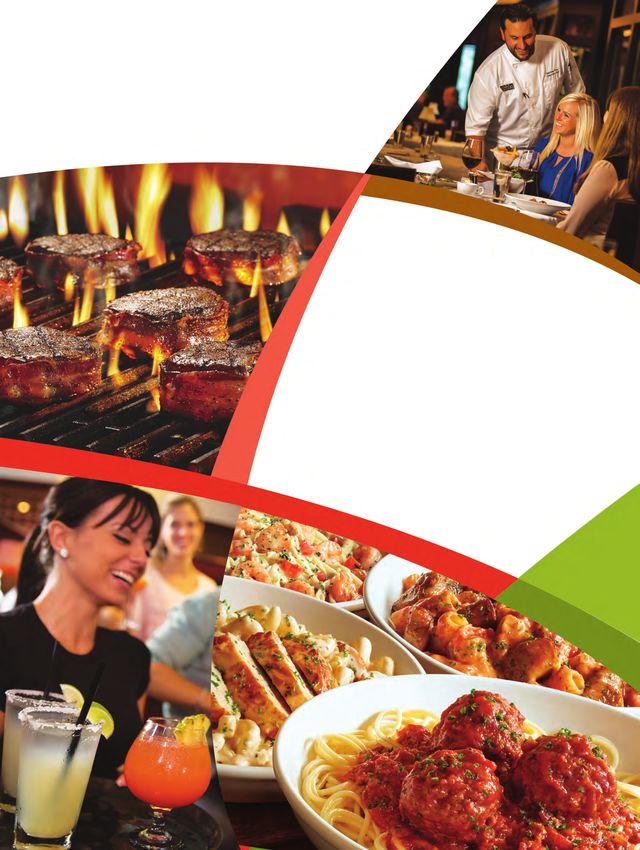
OUR RESTAURANTS
Where people of all ages gather to enjoy the
abundance of great Italian food and wine and
are treated like family.
$3.8 billion in sales
843 units
1000 Darden Center Drive
2016 ANNUAL REPORT
Orlando, FL 32837 The place for people who crave a
407-245-4000 flavorful, boldly seasoned steak in a
down-to-earth setting that feels like
www.darden.com
a rancher’s home.
$1.6 billion in sales
OUR
481 units
COMMITMENT The restaurant of choice for
conscientious adults celebrating
TO YOU the goodness of life without
DARDEN RESTAURANTS, INC.
compromise.
$254 million in sales
40 units
2016 ANNUAL REPORT
The destination to disconnect,
lighten up and have fun.
$218 million in sales
37 units
The modern American gathering place
where beer and food lovers unite.
$507 million in sales
65 units
The ultimate relationship brand,
offering a welcoming and club-like
dining experience.
$408 million in sales
54 units
The destination for a glamorous
®
night out.
$106 million in sales
16 units
137248_DardenAR_CVR.r2.indd 1 8/4/16 12:37 PM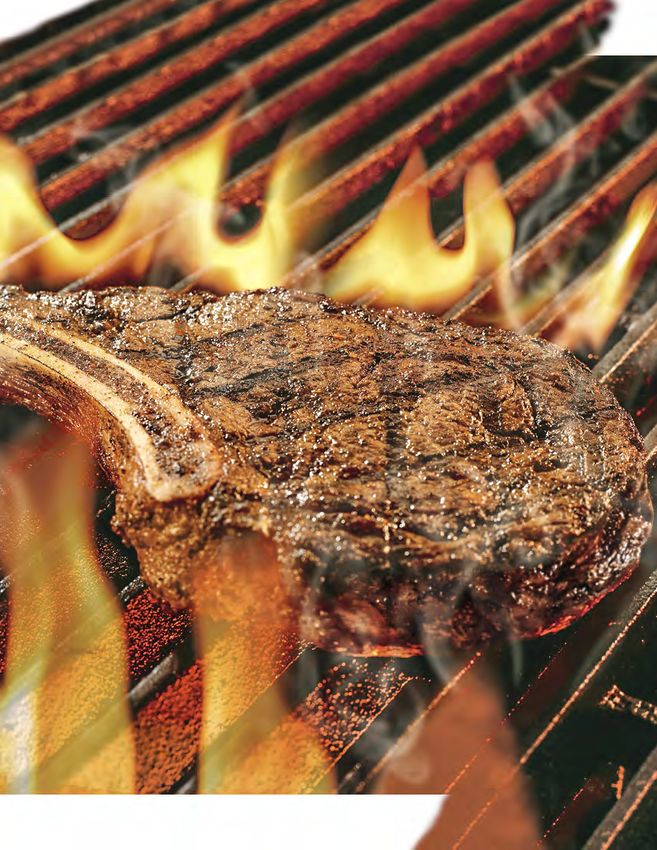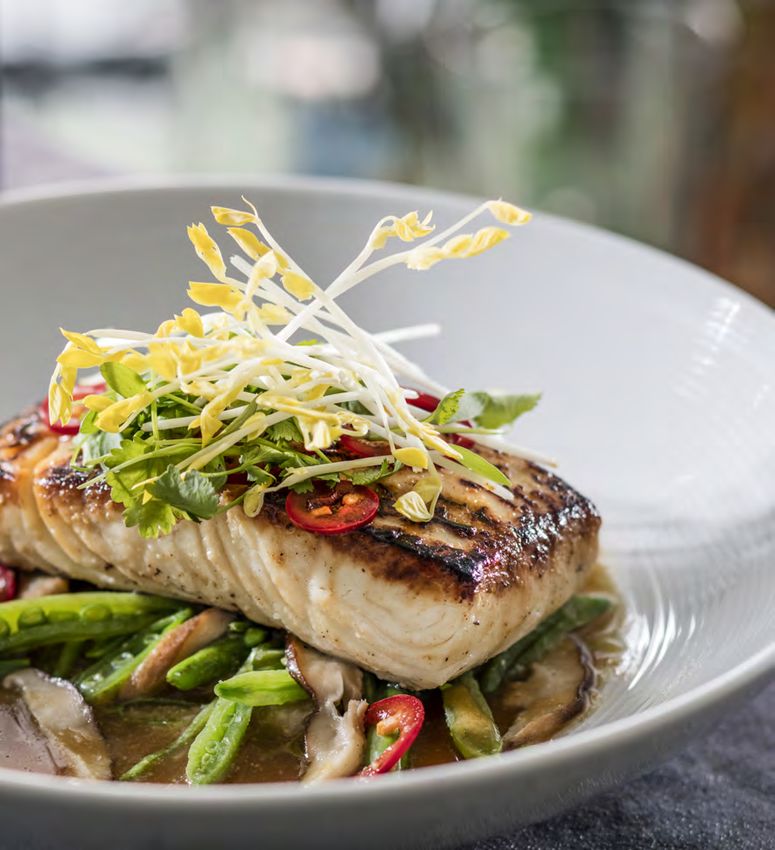
We succeed because of our people, Board of Directors
and with our success comes great DARDEN
opportunity for our team members.
That’s why who we hire is one of our
most important decisions, and why we Margaret Shân Atkins Jean M. Birch
Co-Founder and Managing Director Retired Chief Executive Officer and
invest in our team members’ careers of Chetrum Capital LLC, a private President of Birch Company, LLC, a
investment firm. specialized strategy and leadership
every step of the way. We provide our consulting firm focused on the
hospitality industry.
people with the tools they need to
succeed in their current roles, to grow
COMMITTED TO
personally and professionally, and to
Our People
Bradley D. Blum James P. Fogarty
deliver exceptional experiences to our Founder and Owner of BLUM Enterprises, Former Chief Executive Officer
LLC, a restaurant company focused on of Orchard Brands, a multi-channel
guests each day. restaurant strategy, concept develop- marketer of apparel and home products.
ment and investing.
We are a restaurant company, so food is always top of mind. But what
we do starts with people. Our 150,000 team members are what make
the difference at Darden — they are at the heart of everything we do.
And the results speak for themselves: Cynthia T. Jamison Eugene I. Lee, Jr.
That’s why we strive to hire the best and create an inclusive environment Chairman of the Board of Directors of President
• Our hourly team members, on average, earn nearly $15/hour Tractor Supply Company, the largest Chief Executive Officer
where diversity of thought and background is valued — everyone is operator of retail farm and ranch stores. Darden Restaurants, Inc.
treated with respect, and everyone has opportunities to develop and • We promote nearly 1,000 team members a year into management
grow their careers. • 50% of all our Restaurant Managers are promoted from hourly positions
We’re extremely proud of our results-oriented people culture — one • 99% of our General Managers and Managing Partners are promoted from within
Lionel L. Nowell, III William S. Simon
filled with energy, passion, opportunity and fun. We work hard to • 99% of all Directors of Operations are internal promotions Former Senior Vice President and Former President and
Treasurer of PepsiCo, Inc., one of the Chief Executive Officer of
achieve our goals, and we all win together when we do. world’s largest food and beverage Walmart U.S.
companies.
With more than 7,000 leadership
positions across our restaurants, we Charles M. Sonsteby Alan N. Stillman
Chairman of the Board Founder and former Chief Executive
provide a pathway for thousands of Darden Restaurants, Inc. Officer of The Smith & Wollensky
individuals throughout the country Vice Chairman, Chief Financial Officer Restaurant Group, Inc., which develops
and Chief Administrative Officer of and operates high-end, high-volume
to advance from entry-level jobs into The Michaels Companies, Inc., restaurants in major cities across the
the largest arts and crafts specialty United States.
management roles. It’s one of the retailer in North America.
reasons Darden enjoys the lowest
annual turnover rates for hourly team
members in the industry – 30 points
below the industry average.
137248_DardenAR_CVR.r2.indd 2 8/4/16 12:39 PM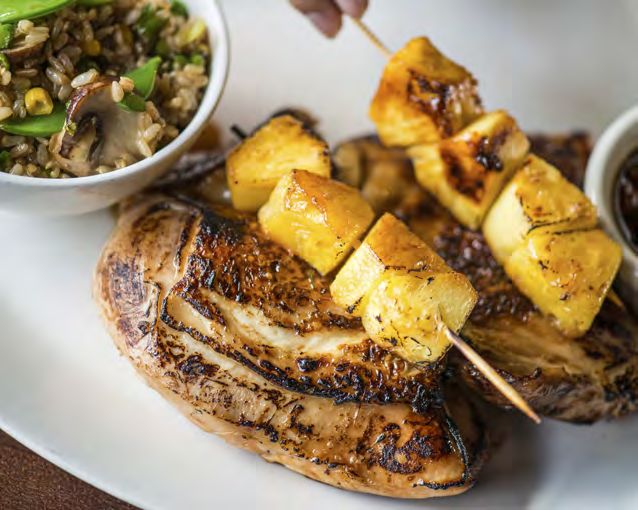
DEAR FELLOW SHAREHOLDERS

Darden has been on an incredible journey, and this year we were
able to accomplish great things by delivering outstanding experiences
every day, in every restaurant.

We know that when we focus on creating memorable moments for
our guests, we can grow our business. That’s why everything we do
is rooted in our mission – to be financially successful through great
people consistently delivering outstanding food, drinks and service in
an inviting atmosphere, making every guest loyal.

                              Eugene I. Lee, Jr.                         Charles M. Sonsteby
                              President and Chief Executive Officer      Chairman of the Board

                                                              DARDEN RESTAURANTS, INC.   •   2016 ANNUAL REPORT   1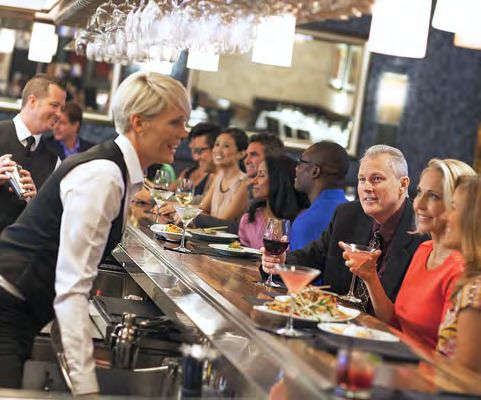
We bring our mission to life every day through our 150,000                                   Delivering Value
team members in more than 1,500 restaurants across
the country who carry out the four pillars of our Back-to-
                                                                                             to Shareholders
Basics operating philosophy – culinary innovation and                                        In fiscal 2016, we grew total sales by 4.4 percent2
execution, attentive service, engaging atmospheres and                                       driven by same-restaurant sales growth of 3.3 percent –
integrated marketing. To many, this may all sound simple,                                    exceeding the industry by more than 400 basis points1
but consistently doing the little things well to create                                      while further simplifying our operations to reduce non-
memorable moments for our guests is extremely difficult.                                     guest-facing costs by approximately $95 million. Our
                                                                                             sales growth and cost management efforts resulted in
We continued to leverage our four competitive                                                a 37.9 percent increase in adjusted diluted net earnings
advantages that are key to helping our businesses                                            per share to $3.53.3 On a reported basis, diluted
drive sales growth and expand margins. They are:                                             net earnings per share from continuing operations
                                                                                             increased 84.1 percent to $2.78 in fiscal 2016.
• The significant scale of our Company
• The breadth and depth of our data and consumer insights                                    During the year, we completed a thorough review of our
                                                                                             strategic options to improve shareholder return resulting
• Our commitment to rigorous strategic planning
                                                                                             in a transaction that was highly successful on many
• Our results-oriented, people culture
                                                                                             fronts. We meaningfully improved our capital structure
                                                                                             by completing our comprehensive real estate strategy –
At a time when our industry faced considerable                                               which included a tax-free spinoff of certain real estate and
headwinds – including increased and more diverse                                             restaurant assets into a new public company, Four Corners
competition – we are proud of the progress we have                                           Property Trust (FCPT). This strategy enabled us to reduce
made. Our businesses outperformed the industry1,                                             our debt by approximately $1 billion while preserving the
creating significant value for our shareholders, our guests,                                 Company’s investment-grade credit profile. Given the
our team members and the communities we serve.
                                                                                             1
                                                                                                 Industry same-restaurant sales as reported by Knapp-Track (excluding Darden).
                                                                                             2
                                                                                                  iscal 2015 included an extra week of operations, resulting in a 53-week
                                                                                                 F
                                                                                                 fiscal year. Fiscal 2016 growth excludes the impact of the extra operating
                                                                                                 week in fiscal 2015 to allow for a 52-week to 52-week comparison.
                                                                                             3
                                                                                                  djusted for special items and the 53rd week. A reconciliation of reported
                                                                                                 A
                                                                                                 to adjusted numbers can be found on page 57.

                   Total Sales¹                                          Adjusted Earnings                                                 Same-Restaurant
                     (in billions)
                                                                             Per Share²                                                      Sales Growth
                                     $6.93                                                           $3.53
                       $6.64
          $6.29

                                                                                     $2.56
                                                                                                                                                                    3.3%

                                                                          $1.71                                                                        2.4%

                                                                                                                                            2014

            2014        2015         2016                                 2014        2015            2016                                              2015        2016

                                                                                                                                           -1.3%

    1
        Total Sales in fiscal 2015 adjusted to exclude $125 million in sales due to the 53rd week.
    2
        Adjusted for special items and the 53rd week. A reconciliation of reported to adjusted numbers can be found on page 57.

2
current trading multiples of both companies, we believe          on our guests’ needs and preferences to increase
we have created significant value for shareholders.              guest traffic, drive in-restaurant behavior, enhance the
                                                                 guest experience and improve financial returns.
Continuing our commitment to enhancing shareholder
value, we returned more than $450 million through dividends      In December, we introduced our value-creation framework.
($265 million) and share repurchases ($185 million). As of the   Our goal over time is to deliver long-term earnings
end of the fiscal year, we had $315 million remaining of the     after tax growth of 7 to 10 percent, derived from:
$500 million of share repurchases the Board authorized in
December. This June, we increased our quarterly dividend         • Same-restaurant sales growth of 1 to 3 percent
to $0.56 per share. With this increase, the Darden dividend      • New restaurant growth of 2 to 3 percent
after the real estate spinoff will be greater than the Darden
                                                                 • EBIT margin expansion of 10 to 40 basis points
dividend before the real estate transaction was completed.

                                                                 We expect to pay out approximately 50 to 60 percent of
We continued to leverage our scale through aggressive
                                                                 our earnings after tax as dividends and repurchase $100
cost management programs and supply chain optimization.
                                                                 million to $200 million of our shares annually, leading to
This, combined with operational simplification and better
                                                                 a long-term Total Shareholder Return of 10 to 15 percent
overall cost management at the restaurants, enabled
                                                                 — composed of EPS growth and dividend yield.
us to deliver $130 million in annual savings since fiscal
2015. We also simplified our organizational structure to
                                                                 In summary, we have a value-creating business model
become more decentralized and operations-focused,
                                                                 that generates significant and durable cash flow to fund
with clearer leadership accountability. And across our
                                                                 future growth and return capital to shareholders.
portfolio, we increased the sharing of data and insights

                                                                 COMMITTED TO

                                                                 Our Back-to-Basics
                                                                 Operating Philosophy
                                                                 Our success depends on operating the very best
                                                                 restaurants possible. That’s why we are relentlessly
                                                                 focused on:

                                                                  • Driving culinary innovation and execution
                                                                  • Delivering attentive service to every guest
                                                                  • Providing an inviting and engaging
                                                                    atmosphere inside each of our restaurants

                                                                 We support these operating fundamentals through
                                                                 smart and relevant integrated marketing programs that
                                                                 resonate with our guests. The result is the opportunity
                                                                 to grow market share through same-restaurant sales
                                                                 growth and to deliver best-in-class profitability.

                                                                              DARDEN RESTAURANTS, INC.   •   2016 ANNUAL REPORT   3
Delivering Value to Our Guests                               our restaurants, we’ve evolved our marketing to be more
                                                             integrated, targeted and personally relevant. This focus on
Our strategy and positioning for each business               enhancing every touchpoint has improved the perceived
enabled us to build momentum and identify new ways           value of Olive Garden and has resonated with guests
to exceed the expectations of our guests. In fiscal          as we outperformed the industry by 390 basis points.1
2016, we successfully delivered against our mission
as we grew total sales to $6.9 billion with same-            The momentum at LongHorn Steakhouse continued with
restaurant sales growth at each of our businesses.           its third straight year of same-restaurant sales growth — at
                                                             3.5 percent in fiscal 2016. This success comes from an
For the second consecutive year, Olive Garden                emphasis on building loyalty through culinary innovation
delivered positive same-restaurant sales growth — at         and our relentless pursuit of delivering flawless guest
3.1 percent in fiscal 2016. The continued success of         experiences. Through culinary platforms like Peak Season
Olive Garden is rooted in our laser focus on enhancing       and Chef Showcase, LongHorn continually introduced new
the guest experience at every touchpoint. We boosted         menu offerings that were seasonally relevant and made
culinary innovation by leveraging brand equities and         with fresh, quality ingredients. In addition, we reduced
flavor profiles that loyal guests enjoy the most, and        the number of menu items, simplifying procedures to
we complemented this innovation with an expanded             allow our restaurant teams to execute at a higher level.
menu that offers guests a variety of choices that            We also invested in team member training, which helped
span a wide range of prices. To further improve the          us defend our industry-leading retention. Finally, we
guest experience, we simplified our operations and           continued to reach guests with impactful advertising,
ensured our restaurants were properly staffed.               which was recognized by Ace Metrix when it named
                                                             LongHorn the “Brand of the Year” for casual dining for
Additionally, we continued to meet our guests’ growing
                                                             the second year in a row. All of this resulted in LongHorn
demand for convenience through our successful OG To-Go
                                                             outperforming the industry by more than 400 basis points.1
platform and the national launch of large-party catering
delivery. Finally, to tell our guests about what’s new in
                                                              Industry same-restaurant sales as reported by Knapp-Track (excluding Darden).
                                                             1

    COMMITTED TO

    Leveraging Our
    Competitive Advantages
    We support our best-in-class restaurant businesses
    by helping them reach their full potential. We do this
    by leveraging four competitive advantages that are
    keys to unlocking sales growth and expanding margins.

      • Significant Scale
      • Extensive Data & Insights
      • Rigorous Strategic Planning
      • Our Results-Oriented People Culture

4
COMMITTED TO

 Long-Term Value Creation
                                   ANNUAL TARGET, OVER TIME

  Business Performance (Adj. EAT Growth)
  Same-restaurant sales           1-3%
  New restaurant growth           2-3%                7-10%
  EBIT margin expansion           10-40bps
  Return of Cash
  Dividend payout ratio           50-60%
                                                      3-5%
  Share repurchase ($ millions)   $100-$200

  Total Shareholder Return                        10-15%
  (EPS GROWTH + DIVIDEND YIELD)

Seasons 52 had a strong year, growing same-restaurant         For the sixth consecutive year, The Capital Grille grew
sales 4.7 percent. As an on-trend concept — giving            same-restaurant sales — growing 3.9 percent in fiscal
guests the opportunity to enjoy hand-crafted cuisine          2016. The Capital Grille is the ultimate relationship
that is healthful without sacrificing taste or style —        brand, offering a welcoming and club-like dining
Seasons 52 is uniquely positioned to capitalize in a          experience. Delivering high-touch experiences is
dining segment that is poised for continued growth.           nothing new for us, and we continued to leverage
Our focus on enhancing operational execution and              technology to enable us to personally connect with
evolving the menu received an incredibly positive             more guests to create exclusively tailored visits.
reaction from our guests, giving us momentum as we
build the pipeline for value-creating new restaurants.        Eddie V’s achieved same-restaurant sales growth of
                                                              1.8 percent. With its positioning as the destination for
Bahama Breeze continued to significantly outperform           a glamorous night out, this fine-dining restaurant was
the casual dining industry1 with same-restaurant sales        able to capitalize on its ability to deliver unforgettable
growth of 4.8 percent. Positioned as an island oasis          experiences — setting new sales records during
from the everyday, Bahama Breeze paired culinary              key holidays throughout the year. Additionally, we
innovation with high-energy, in-restaurant events.            were able to implement operational initiatives that
These events created signature experiences that               simplified execution while preserving the high levels
reinforced the business’ unique positioning while             of food quality and service for which we’re known.
attracting more guests — particularly Millennials.
                                                              We have a strong and differentiated portfolio of businesses,
At Yard House, same-restaurant sales grew 2.3 percent, the    each with anticipated growth ahead of them. Reflecting this
third consecutive year of growth, as we continue to build     growth opportunity, we are ramping up the development
a loyal guest base. It’s from this base that we know that     pipeline for future sites and anticipate opening 24 to
our extensive beer selection, scratch kitchen and specially   28 new restaurants in the coming fiscal year.
curated rock music continued to strike a chord across
multiple demographics that joined us for lunch, happy hour,    Industry same-restaurant sales as reported by Knapp-Track (excluding Darden).
                                                              1

dinner and late-night happy hour. We are extremely excited
about the growth we have planned for this business.

                                                                              DARDEN RESTAURANTS, INC.      •   2016 ANNUAL REPORT         5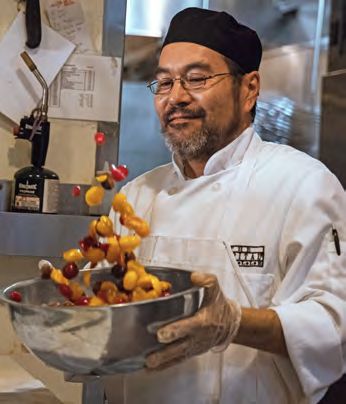
Delivering Value to Our Team                                        career elsewhere. Whatever the case, we know that
                                                                    the skills and experience we provide will help our team
Members and Communities                                             members grow and succeed within the Company – or
Everything we do starts with people: our 150,000                    wherever their career paths ultimately take them.
team members, the nearly one million guests we
serve each day and the individuals who live in the                  Inclusion and diversity are woven into the fabric of our
communities that are home to our restaurants. That’s                culture. Every day we leverage our differences to support
why we strive to provide meaningful and rewarding                   the business strategy as we create an environment
employment, deliver outstanding food and service to                 where all of our team members can reach their greatest
our guests and give back to our local communities.                  potential. In fact, 52 percent of our team members are
                                                                    women, and 49 percent are minorities. Additionally, our
For many of our team members, Darden is their first                 team members span five generations – Matures, Baby
employer. This is a role we take great pride in – and a             Boomers, Generation X, Millennials and Centennials.
responsibility we take seriously. For some, a job in our            We also maintain strong relationships with more than
restaurants is the start of a career path to management             25 organizations that have a mission to advance diverse
positions within the Company. In fact, half of our                  communities. And we’re proud to have been recognized
restaurant managers began their careers with us as                  by the Human Rights Campaign Foundation for scoring
hourly team members. For others, it enables them                    100 percent on the Corporate Equality Index.
to further their education and eventually pursue a

2016 Financial Highlights
FISCAL YEAR ENDED
(in millions, except per share amounts)                    May 29, 2016      May 31, 2015      May 25, 2014
Sales from Continuing Operations                              $ 6,933.5         $ 6,764.0         $ 6,285.6
Earnings from Continuing Operations                           $ 359.7           $ 196.4           $ 183.2
Earnings from Discontinued Operations, net of tax             $     15.3        $    513.1        $ 103.0
Net Earnings                                                  $ 375.0           $ 709.5           $ 286.2
Basic Net Earnings Per Share:                                 $    2.94         $ 5.56            $     2.18
   Earnings from Continuing Operations                        $    2.82         $     1.54        $     1.40
   Earnings from Discontinued Operations                      $     0.12        $    4.02         $    0.78
Diluted Net Earnings Per Share:                               $ 2.90            $    5.47         $     2.15
   Earnings from Continuing Operations                        $    2.78         $      1.51       $     1.38
   Earnings from Discontinued Operations                      $     0.12        $    3.96         $     0.77
Dividends Paid Per Share                                      $    2.10         $ 2.20            $    2.20
Average Shares Outstanding:
   Basic                                                           127.4		127.7		131.0
   Diluted                                                        129.3		129.7		133.2

6
COMMITTED TO
Our Mission
To be financially successful through
great people consistently delivering
outstanding food, drinks and service
in an inviting atmosphere, making
every guest loyal.
We have a social responsibility to our guests and communities, We are doing what matters most for our guests –
which is why our approach to citizenship is a key component delivering memorable experiences that will bring them
of how we fulfill our mission. We bring this to life through: back time and time again. Fiscal 2016 was a great
year for Darden, but there’s more work ahead.
• A commitment to our Food Principles – that great food
starts with quality ingredients that are sustainably sourced With that in mind, we want to thank our dedicated team
members for their commitment to excellence. They are the
• Our protection of the natural environment and resource
foundation of our success. We also want to express our
conservation efforts in our restaurants
appreciation to the Board of Directors for providing strategic
• Connection and support for the vibrant communities guidance and their commitment to effective, transparent
where we live, work and serve corporate governance. Finally, we want to thank you, our
fellow shareholders, for your continued support of Darden
We invite you to read more about our commitment and our vision. We look forward to rewarding that support
to citizenship at www.darden.com/citizenship. through our ongoing commitment to value creation.
Charles M. Sonsteby Eugene I. Lee, Jr.
Chairman of the Board President and Chief Executive Officer
DARDEN RESTAURANTS, INC. • 2016 ANNUAL REPORT 7Executive Leadership
DARDEN
Eugene I. Lee, Jr. Matt Broad Todd Burrowes Rick Cardenas Chris Chang
President Senior Vice President President Senior Vice President Senior Vice President
Chief Executive Officer General Counsel & LongHorn Steakhouse Chief Financial Officer Chief Information
Corporate Secretary Officer
Susan Connelly Brian Foye Dave George Danielle Kirgan Mike Kneidinger
Senior Vice President President President Senior Vice President President
Communications & Seasons 52 Olive Garden Chief Human Yard House
Corporate Affairs Executive Vice President Resources Officer
Darden Restaurants
John Madonna John Martin Doug Milanes Rich Renninger Bill White
Senior Vice President President Senior Vice President Senior Vice President Senior Vice President
Corporate Controller The Capital Grille Chief Supply Chain Chief Development Treasurer
Eddie V’s Officer Officer
8Darden Restaurants, Inc.
2016 Financial Review
10 Management’s Discussion and Analysis of Financial Condition
and Results of Operations
22 Report of Management’s Responsibilities
22 Management’s Report on Internal Control Over
Financial Reporting
23 Report of Independent Registered Public Accounting Firm
on Internal Control Over Financial Reporting
24 Report of Independent Registered Public Accounting Firm
25 Consolidated Statements of Earnings
25 Consolidated Statements of Comprehensive Income
26 Consolidated Balance Sheets
27 Consolidated Statements of Changes in Stockholders’ Equity
28 Consolidated Statements of Cash Flows
29 Notes to Consolidated Financial Statements
56 Five-Year Financial Summary
DARDEN RESTAURANTS, INC. • 2016 ANNUAL REPORT 9
137248_DardenAR_FINCL.r2.indd 9 8/4/16 12:40 PMMANAGEMENT’S DISCUSSION AND ANALYSIS
OF FINANCIAL CONDITION AND RESULTS OF OPERATIONS
DARDEN
This discussion and analysis below for Darden Restaurants, Inc. (Darden, the We believe that capable operators of strong, multi-unit brands have the
Company, we, us or our) should be read in conjunction with our consolidated opportunity to increase their share of the restaurant industry’s full-service
financial statements and related financial statement notes found elsewhere segment. Generally, the restaurant industry is considered to be comprised
in this report. We operate on a 52/53-week fiscal year, which ends on the of three segments: quick service, fast casual, and full service. All of our
last Sunday in May. Fiscal 2016, which ended May 29, 2016, consisted of restaurants fall within the full-service segment, which is highly fragmented
52 weeks. Fiscal 2015, which ended May 31, 2015, consisted of 53 weeks and includes many independent operators and small chains. We believe we
and fiscal 2014, which ended May 25, 2014, consisted of 52 weeks. have strong brands and that the breadth and depth of our experience and
expertise sets us apart in the full-service segment of the restaurant industry.
OVERVIEW OF OPERATIONS This collective capability is the product of investments over many years in
Our business operates in the full-service dining segment of the restaurant areas that are critical to success in our business, including restaurant
industry. At May 29, 2016, we operated 1,536 restaurants through operations excellence, brand management excellence, supply chain, talent
subsidiaries in the United States and Canada under the Olive Garden®, management and information technology, among other things.
LongHorn Steakhouse®, The Capital Grille®, Yard House®, Bahama Breeze®, With a focus on growing same-restaurant sales, we’ve implemented a
Seasons 52®, and Eddie V’s Prime Seafood® and Wildfish Seafood Grille® “Back-to-Basics” approach rooted in strong operating fundamentals. We’re
(collectively, Eddie V’s) trademarks. We own and operate all of our restau- focused on improving culinary innovation and execution inside each of our
rants in the United States and Canada, except for 6 joint venture restaurants brands, delivering attentive service to each and every one of our guests,
managed by us and 18 franchised restaurants. We also have 32 franchised and creating an inviting and engaging atmosphere inside our restaurants.
restaurants in operation located in Latin America, the Middle East and We support these priorities with smart and relevant integrated marketing
Malaysia. All intercompany balances and transactions have been eliminated programs that resonate with our guests. By delivering on these operational
in consolidation. and brand-building imperatives, we expect to increase our market share
On November 9, 2015, we completed the spin-off of Four Corners through new restaurant and same-restaurant sales growth and deliver
Property Trust, Inc. (Four Corners) with the pro rata distribution of one share best-in-class profitability.
of common stock for every three shares of Darden common stock to The Darden support structure enables our brands to achieve their
Darden shareholders. The separation included (i) the transfer of 6 LongHorn ultimate potential by: (1) driving advantages in supply chain and general and
Steakhouse restaurants located in the San Antonio, Texas area as well as administrative support; (2) applying insights collected from our significant
418 restaurant properties to Four Corners, which were subsequently leased guest and transactional databases to enhance guest relationships and
back to Darden; (ii) the issuance to us of all of the outstanding common identify new opportunities to drive sales growth; and (3) relentlessly driving
stock of Four Corners and corresponding pro rata distribution to our operating efficiencies and continuous improvement, operating with a sense
shareholders of the outstanding shares of Four Corners common stock of urgency and inspiring a performance-driven culture.
as a tax-free stock dividend; and (iii) a cash dividend of approximately We seek to increase profits by leveraging our fixed and semi-fixed costs
$315.0 million received by us from Four Corners from the proceeds with sales from new restaurants and increased guest traffic and sales at
of Four Corners’ term loan borrowings. See Note 2 to our consolidated existing restaurants. To evaluate our operations and assess our financial
financial statements for further details. performance, we monitor a number of operating measures, with a special
focus on two key factors:
• Same-restaurant sales – which is a year-over-year 52-week
comparison of each period’s sales volumes for restaurants open at
least 16 months, including recently acquired restaurants, regardless
of when the restaurants were acquired; and
• Segment profit – which is restaurant sales, less food and beverage
costs, restaurant labor costs, restaurant expenses and marketing
expenses (sometimes referred to as restaurant-level earnings).
10
137248_DardenAR_FINCL.r2.indd 10 8/4/16 12:40 PMMANAGEMENT’S DISCUSSION AND ANALYSIS
OF FINANCIAL CONDITION AND RESULTS OF OPERATIONS
DARDEN
Increasing same-restaurant sales can improve segment profit because Outlook
these incremental sales provide better leverage of our fixed and semi-fixed We expect combined Darden same-restaurant sales to increase in fiscal
restaurant-level costs. A restaurant brand can generate same-restaurant 2017 between 1.0 percent and 2.0 percent, and we expect fiscal 2017
sales increases through increases in guest traffic, increases in the average sales from continuing operations to increase between 1.7 percent and
guest check, or a combination of the two. The average guest check can be 2.7 percent. In fiscal 2017, we expect to open approximately 24 to 28
impacted by menu price changes and by the mix of menu items sold. For new restaurants, and we expect capital expenditures incurred to build
each restaurant brand, we gather daily sales data and regularly analyze the new restaurants, remodel and maintain existing restaurants and technology
guest traffic counts and the mix of menu items sold to aid in developing initiatives to be between $310.0 million and $350.0 million.
menu pricing, product offerings and promotional strategies. We focus on In June 2016, we announced a quarterly dividend of $0.56 per share,
balancing our pricing and product offerings with other initiatives to produce payable on August 1, 2016. Based on the $0.56 quarterly dividend decla
sustainable same-restaurant sales growth. ration, our expected annual dividend is $2.24 per share, which reflects
We compute same-restaurant sales using restaurants open at least an increase of 6.7 percent compared to our fiscal 2016 annual dividend.
16 months because this period is generally required for new restaurant Dividends are subject to the approval of our Board of Directors and,
sales levels to normalize. Sales at newly opened restaurants generally do accordingly, the timing and amount of our dividends are subject to change.
not make a significant contribution to profitability in their initial months of There are significant risks and challenges that could impact our
operation due to operating inefficiencies. Our sales and expenses can be operations and ability to increase sales and earnings. The restaurant industry
impacted significantly by the number and timing of new restaurant openings is intensely competitive and sensitive to economic cycles and other business
and closings, and relocations and remodeling of existing restaurants. factors, including changes in consumer tastes and dietary habits. Other
Pre-opening expenses each period reflect the costs associated with opening risks and uncertainties are discussed and referenced in the subsection below
new restaurants in current and future periods. entitled “Forward-Looking Statements.”
Fiscal 2016 Financial Highlights
Our sales from continuing operations were $6.93 billion in fiscal 2016
compared to $6.76 billion in fiscal 2015. The 2.5 percent increase in
sales from continuing operations was driven by a combined Darden same-
restaurant sales increase of 3.3 percent on a 52-week basis and the
addition of two net new company-owned restaurants, partially offset by the
impact of the 53rd week of operation in fiscal 2015.
Net earnings from continuing operations for fiscal 2016 were
$359.7 million ($2.78 per diluted share) compared with net earnings from
continuing operations for fiscal 2015 of $196.4 million ($1.51 per diluted
share). Net earnings from continuing operations for fiscal 2016 increased
83.1 percent and diluted net earnings per share from continuing operations
increased 84.1 percent compared with fiscal 2015.
Our net earnings from discontinued operations were $15.3 million
($0.12 per diluted share) for fiscal 2016, compared with net earnings from
discontinued operations of $513.1 million ($3.96 per diluted share) for
fiscal 2015. When combined with results from continuing operations, our
diluted net earnings per share were $2.90 and $5.47 for fiscal 2016 and
2015, respectively.
DARDEN RESTAURANTS, INC. • 2016 ANNUAL REPORT 11
137248_DardenAR_FINCL.r2.indd 11 8/4/16 12:40 PMMANAGEMENT’S DISCUSSION AND ANALYSIS
OF FINANCIAL CONDITION AND RESULTS OF OPERATIONS
DARDEN
RESULTS OF OPERATIONS FOR FISCAL 2016, 2015 AND 2014
To facilitate review of our results of operations, the following table sets forth our financial results for the periods indicated. All information is derived from the
consolidated statements of earnings for the fiscal years ended May 29, 2016, May 31, 2015 and May 25, 2014. This information and the following analysis
have been presented with the results of operations, costs incurred in connection with the sale and related gain on the sale of Red Lobster and results for the
two closed company-owned synergy restaurants classified as discontinued operations for all periods presented.
Percent Change
(in millions) May 29, 2016 May 31, 2015 May 25, 2014 2016 vs 2015 2015 vs 2014
Sales $6,933.5 $6,764.0 $6,285.6 2.5% 7.6%
Costs and expenses:
Food and beverage 2,039.7 2,085.1 1,892.2 (2.2)% 10.2%
Restaurant labor 2,189.2 2,135.6 2,017.6 2.5% 5.8%
Restaurant expenses 1,163.5 1,120.8 1,080.7 3.8% 3.7%
Marketing expenses 238.0 243.3 252.3 (2.2)% (3.6)%
General and administrative expenses 384.9 430.2 413.1 (10.5)% 4.1%
Depreciation and amortization 290.2 319.3 304.4 (9.1)% 4.9%
Impairments and disposal of assets, net 5.8 62.1 16.4 (90.7)% 278.7%
Total operating costs and expenses $6,311.3 $6,396.4 $5,976.7 (1.3)% 7.0%
Operating income 622.2 367.6 308.9 69.3% 19.0%
Interest, net 172.5 192.3 134.3 (10.3)% 43.2%
Earnings before income taxes 449.7 175.3 174.6 156.5% 0.4%
Income tax expense (benefit) (1) 90.0 (21.1) (8.6) (526.5)% 145.3%
Earnings from continuing operations $ 359.7 $ 196.4 $ 183.2 83.1% 7.2%
Earnings from discontinued operations, net of tax 15.3 513.1 103.0 (97.0)% 398.2%
Net earnings $ 375.0 $ 709.5 $ 286.2 (47.1)% 147.9%
(1) Effective tax rate 20.0% (12.0)% (4.9)%
The following table details the number of company-owned restaurants currently reported in continuing operations, compared with the number open at the
end of fiscal 2015 and the end of fiscal 2014.
May 29, 2016 May 31, 2015 May 25, 2014
Olive Garden (1) 843 846 837
LongHorn Steakhouse 481 480 464
Yard House 65 59 52
The Capital Grille 54 54 54
Bahama Breeze 37 36 37
Seasons 52 40 43 38
Eddie V’s 16 16 15
Other (2) — — 4
Total 1,536 1,534 1,501
(1) Includes six locations in Canada for all periods presented.
(2) Represents company-owned synergy restaurants in operation. We completed the conversion of all remaining synergy restaurants into stand-alone Olive Garden restaurants during the
first quarter of fiscal 2015.
12
137248_DardenAR_FINCL.r2.indd 12 8/4/16 12:40 PMMANAGEMENT’S DISCUSSION AND ANALYSIS
OF FINANCIAL CONDITION AND RESULTS OF OPERATIONS
DARDEN
SALES
The following table presents our sales and U.S. same-restaurant sales (SRS) by brand for the periods indicated.
Fiscal Years Percent Change SRS (1)
(in millions) 2016 2015 2014 2016 vs 2015 2015 vs 2014 2016 vs 2015 2015 vs 2014
Olive Garden $3,838.6 $3,789.6 $3,643.1 1.3% 4.0% 3.1% 1.3%
LongHorn Steakhouse $1,587.7 $1,544.7 $1,383.9 2.8% 11.6% 3.5% 4.4%
Yard House $ 507.0 $ 469.9 $ 395.4 7.9% 18.8% 2.3% 3.8%
The Capital Grille $ 408.3 $ 403.3 $ 363.2 1.2% 11.0% 3.9% 4.8%
Bahama Breeze $ 217.9 $ 209.2 $ 201.5 4.2% 3.8% 4.8% 1.8%
Seasons 52 $ 253.8 $ 238.6 $ 196.3 6.4% 21.5% 4.7% 2.3%
Eddie V’s $ 105.8 $ 96.9 $ 78.4 9.2% 23.6% 1.8% 5.4%
(1) Same-restaurant sales is a year-over-year comparison of each period’s sales volumes for a 52-week year and is limited to restaurants open at least 16 months.
The following table presents our average annual sales per restaurant In total, The Capital Grille, Bahama Breeze, Seasons 52, Eddie V’s and
for the periods indicated. Average annual sales are calculated as net sales Yard House generated sales in fiscal 2016 and 2015, which were 5.3 percent
divided by total restaurant operating weeks multiplied by 52 weeks. and 14.8 percent above fiscal 2015 and fiscal 2014, respectively. The sales
increases for fiscal 2016 were primarily driven by the incremental sales from
May 29, May 31, May 25, six net new Yard House restaurants since the end of fiscal 2015 and same-
(in millions) 2016 2015 2014 restaurant sales increases at all five brands partially offset by the impact
Olive Garden $4.5 $4.4 $4.4 of the 53rd week in fiscal 2015. The sales increases for fiscal 2015 were
LongHorn Steakhouse $3.3 $3.2 $3.1 primarily driven by incremental sales from 12 net new restaurants since the
Yard House $8.2 $8.3 $8.2 end of fiscal 2014 and the impact of the 53rd week. Sales growth for fiscal
The Capital Grille $7.6 $7.2 $7.1 2015 also reflected same-restaurant sales increases at all five brands.
Bahama Breeze $5.9 $5.7 $5.6
Seasons 52 $6.0 $5.7 $5.7 COSTS AND EXPENSES
Eddie V’s $6.6 $6.3 $6.0 The following table sets forth selected operating data as a percent of sales
from continuing operations for the periods indicated. This information is
derived from the consolidated statements of earnings for the fiscal years
Olive Garden’s sales increase for fiscal 2016 was driven by a U.S.
ended May 29, 2016, May 31, 2015 and May 25, 2014. Additionally, this
same-restaurant sales increase partially offset by the impact of the 53rd
information and the following analysis have been presented with the results
week in fiscal 2015. The increase in U.S. same-restaurant sales in fiscal
of operations, costs incurred in connection with the sale and related gain on
2016 resulted from a 2.0 percent increase in average check combined with
the sale of Red Lobster and results for the two closed synergy restaurants
a 1.1 percent increase in same-restaurant guest counts. Olive Garden’s
classified as discontinued operations for all periods presented.
sales increase for fiscal 2015 was driven by revenue from nine net new
restaurants combined with a U.S. same-restaurant sales increase and the Fiscal Years
impact of the 53rd week. The increase in U.S. same-restaurant sales in fiscal 2016 2015 2014
2015 resulted from a 2.9 percent increase in average check partially offset Sales 100.0% 100.0% 100.0%
by a 1.6 percent decrease in same-restaurant guest counts. Costs and expenses:
LongHorn Steakhouse’s sales increase for fiscal 2016 was driven by Food and beverage 29.4 30.8 30.1
revenue from one net new restaurant combined with a same-restaurant Restaurant labor 31.6 31.6 32.1
sales increase, partially offset by the impact of the 53rd week in fiscal Restaurant expenses 16.8 16.6 17.2
2015. The increase in same-restaurant sales in fiscal 2016 resulted from Marketing expenses 3.4 3.6 4.0
a 3.0 percent increase in average check combined with a 0.5 percent General and administrative expenses 5.5 6.4 6.6
increase in same-restaurant guest counts. LongHorn Steakhouse’s sales Depreciation and amortization 4.2 4.7 4.8
increase for fiscal 2015 was driven by revenue from 16 net new restaurants Impairments and disposal of assets, net 0.1 0.9 0.3
combined with a same-restaurant sales increase and the impact of the
Total operating costs and expenses 91.0% 94.6% 95.1%
53rd week. The increase in same-restaurant sales in fiscal 2015 resulted
from a 3.6 percent increase in average check combined with a 0.8 percent Operating income 9.0 5.4 4.9
increase in same-restaurant guest counts. Interest, net 2.5 2.8 2.1
Earnings before income taxes 6.5 2.6 2.8
Income tax expense (benefit) 1.3 (0.3) (0.1)
Earnings from continuing operations 5.2 2.9 2.9
Earnings from discontinued operations,
net of taxes 0.2 7.6 1.7
Net earnings 5.4% 10.5% 4.6%
DARDEN RESTAURANTS, INC. • 2016 ANNUAL REPORT 13
137248_DardenAR_FINCL.r2.indd 13 8/4/16 12:40 PMMANAGEMENT’S DISCUSSION AND ANALYSIS
OF FINANCIAL CONDITION AND RESULTS OF OPERATIONS
DARDEN
Total operating costs and expenses from continuing operations were INTEREST EXPENSE
$6.31 billion in fiscal 2016, $6.40 billion in fiscal 2015 and $5.98 billion in Net interest expense decreased as a percent of sales in fiscal 2016 primarily
fiscal 2014. As a percent of sales, total costs and expenses from continuing due to lower average debt balances in fiscal 2016 as compared to fiscal
operations were 91.0 percent in fiscal 2016, 94.6 percent in fiscal 2015 2015 related to the retirement of $1.03 billion in principal of long-term debt
and 95.1 percent in fiscal 2014. in fiscal 2016. The decrease was partially offset by higher debt retirement
costs of $106.8 million in fiscal 2016 compared to debt retirement costs of
Fiscal 2016 Compared to Fiscal 2015: $91.3 million in fiscal 2015. Net interest expense increased as a percent of
• Food and beverage costs decreased as a percent of sales as a result sales in fiscal 2015 as compared to fiscal 2014 primarily due to $91.3 million
of favorable menu mix and pricing, cost savings initiatives and food of debt retirement costs related to the retirement of $1.01 billion in principal
cost deflation, primarily seafood and dairy. of long-term debt in fiscal 2015.
• Restaurant labor costs were flat as a percent of sales as wage-rate
inflation, higher manager bonus and salary costs were offset by INCOME TAXES
sales leverage. The effective income tax rates for fiscal 2016, 2015 and 2014 for continuing
• Restaurant expenses (which include utilities, repairs and operations were 20.0 percent, (12.0) percent and (4.9) percent, respectively.
maintenance, credit card, lease, property tax, workers’ compen Our effective tax rate from continuing operations was negative in both fiscal
sation, new restaurant pre-opening and other restaurant-level 2015 and fiscal 2014 primarily due to the impact of certain tax credits on
operating expenses) increased as a percent of sales, primarily as a lower earnings before income taxes driven primarily by costs incurred related
result of increased rent expense partially offset by sales leverage to our strategic action plan. The increase in our effective tax rate for fiscal
and cost savings initiatives. 2016 compared to fiscal 2015 is primarily due to higher earnings before
• Marketing expenses decreased as a percent of sales, primarily as a income taxes. The decrease in our effective rate for fiscal 2015 compared to
result of sales leverage. fiscal 2014 is primarily attributable to the impact of the favorable resolution
• General and administrative expenses decreased as a percent of of prior-year tax matters.
sales, primarily due to lower general and administrative expenses
incurred in fiscal 2016 related to the real estate plan implementation NET EARNINGS AND NET EARNINGS PER SHARE
as compared to the strategic action plan costs incurred in fiscal FROM CONTINUING OPERATIONS
2015. General and administrative expenses as a percent of sales also Net earnings from continuing operations for fiscal 2016 were $359.7 million
decreased as a result of sales leverage, support cost savings and the ($2.78 per diluted share) compared with net earnings from continuing
favorable settlement of legal matters. operations for fiscal 2015 of $196.4 million ($1.51 per diluted share) and
• Depreciation and amortization expense decreased as a percent net earnings from continuing operations for fiscal 2014 of $183.2 million
of sales primarily from the impact of the spin-off of Four Corners, ($1.38 per diluted share).
completed sale-leaseback transactions and sales leverage. Net earnings from continuing operations for fiscal 2016 increased
• Impairments and disposal of assets, net, decreased as a percent 83.1 percent and diluted net earnings per share from continuing operations
of sales primarily due to higher restaurant-related impairments in increased 84.1 percent compared with fiscal 2015, primarily due to
fiscal 2015. increased sales, lower food and beverage costs, marketing expenses, gen-
eral and administrative expenses, depreciation and amortization expenses
Fiscal 2015 Compared to Fiscal 2014: and impairments and disposal of assets, net as a percent of sales, partially
• Food and beverage costs increased as percent of sales as a result offset by higher restaurant expenses as a percent of sales and a higher
of food cost inflation, primarily dairy and beef, and increased costs for effective income tax rate. Our diluted net earnings per share from continuing
promotional items, partially offset by pricing and favorable menu mix. operations for fiscal 2016 were adversely impacted by approximately
• Restaurant labor costs decreased as a percent of sales primarily as a $0.51 due to debt retirement costs and approximately $0.26 related to the
result of sales leverage. real estate plan implementation and positively impacted by approximately
• Restaurant expenses (which include utilities, repairs and maintenance, $0.02 due to a tax benefit associated with the prior year lobster
credit card, lease, property tax, workers’ compensation, new restau- aquaculture divestiture.
rant pre-opening, rent expense and other restaurant-level operating Net earnings from continuing operations for fiscal 2015 increased
expenses) decreased as a percent of sales, primarily as a result of 7.2 percent and diluted net earnings per share from continuing operations
sales leverage and lower new restaurant pre-opening expenses. increased 9.4 percent compared with fiscal 2014, primarily due to increased
• Marketing expenses decreased as a percent of sales, primarily as a sales and a lower effective income tax rate and lower restaurant labor
result of sales leverage and reduced media costs. expenses, restaurant expenses and marketing expenses as a percent of
• General and administrative expenses decreased as a percent of sales, partially offset by higher food and beverage costs, general and
sales, primarily as a result of sales leverage and support cost savings administrative expenses and impairments and disposal of assets, net as
net of costs related to implementation of the strategic action plan. a percent of sales. Our diluted net earnings per share from continuing
• Depreciation and amortization expense as a percent of sales operations for fiscal 2015 were adversely impacted by approximately
decreased primarily due to lower net new restaurants and remodel $0.42 related to debt retirement costs and approximately $0.68 due to
activities as compared to the prior year. the combined impact of a tax benefit related to exiting from our lobster
aquaculture project and legal, financial advisory and other costs related to
implementation of the strategic action plan and asset impairments.
14
137248_DardenAR_FINCL.r2.indd 14 8/4/16 12:40 PMMANAGEMENT’S DISCUSSION AND ANALYSIS
OF FINANCIAL CONDITION AND RESULTS OF OPERATIONS
DARDEN
EARNINGS FROM DISCONTINUED OPERATIONS IMPACT OF INFLATION
On an after-tax basis, earnings from discontinued operations for fiscal 2016 We attempt to minimize the annual effects of inflation through appropriate
were $15.3 million ($0.12 per diluted share) compared with earnings from planning, operating practices and menu price increases. We do not believe
discontinued operations for fiscal 2015 of $513.1 million ($3.96 per diluted inflation had a significant overall effect on our annual results of operations
share) and fiscal 2014 of $103.0 million ($0.77 per diluted share). Earnings during fiscal 2016. We experienced higher than normal inflationary costs
from discontinued operations reflects pre-tax gains of $17.9 million recorded during fiscal 2015 and fiscal 2014 and were able to partially reduce the
in fiscal 2016 and $837.0 million in fiscal 2015, related to the sale of annual impact utilizing these strategies.
Red Lobster.
CRITICAL ACCOUNTING ESTIMATES
SEGMENT RESULTS We prepare our consolidated financial statements in conformity with U.S.
We manage our restaurant brands, Olive Garden, LongHorn Steakhouse, generally accepted accounting principles. The preparation of these financial
The Capital Grille, Yard House, Bahama Breeze, Seasons 52 and Eddie V’s statements requires us to make estimates and assumptions that affect the
in North America as operating segments. We aggregate our operating reported amounts of assets and liabilities and disclosure of contingent
segments into reportable segments based on a combination of the size, assets and liabilities at the date of the financial statements and the reported
economic characteristics and sub-segment of full-service dining within amounts of sales and expenses during the reporting period. Actual results
which each brand operates. Our four reportable segments are: (1) Olive could differ from those estimates.
Garden, (2) LongHorn Steakhouse, (3) Fine Dining and (4) Other Business Our significant accounting policies are more fully described in Note 1
(see Note 6 to our consolidated financial statements). to the consolidated financial statements. Judgments and uncertainties
Our management uses segment profit as the measure for assessing affecting the application of those policies may result in materially different
performance of our segments. Olive Garden’s segment profit margins were amounts being reported under different conditions or using different
19.8 percent for fiscal 2016, 18.5 percent for fiscal 2015 and 17.8 percent assumptions. We consider the following estimates to be most critical in
for fiscal 2014. The growth for fiscal 2016 was driven primarily by leverag- understanding the judgments that are involved in preparing our consolidated
ing positive same-restaurant sales, food and beverage cost favorability and financial statements.
cost reduction initiatives, partially offset by additional rent expense resulting
from real estate transactions. The growth for fiscal 2015 was driven Leases
primarily by leveraging positive same-restaurant sales and cost reduction We evaluate our leases at their inception to estimate their expected term,
initiatives, partially offset by food and beverage cost inflation. LongHorn’s which commences on the date when we have the right to control the use
segment profit margins were 17.3 percent for fiscal 2016, 15.5 percent for of the leased property and includes the non-cancelable base term plus all
fiscal 2015 and 14.8 percent for fiscal 2014. The growth for fiscal 2016 option periods we are reasonably assured to exercise. Our judgment in
was driven primarily by leveraging positive same-restaurant sales as well determining the appropriate expected term for each lease affects our
as improved cost of sales and lower marketing expense, partially offset by evaluation of:
additional rent expense resulting from real estate transactions. The growth • The classification and accounting for leases as capital
for fiscal 2015 was driven primarily by leveraging positive same-restaurant versus operating;
sales and cost reduction initiatives, partially offset by food and beverage • The rent holidays and escalation in payments that are included in the
cost inflation. Fine Dining’s segment profit margins were 19.5 percent for calculation of straight-line rent; and
fiscal 2016, 19.0 percent for fiscal 2015 and 18.4 percent for fiscal 2014. • The term over which leasehold improvements for each restaurant
The growth for fiscal 2016 was driven primarily by improved food and facility are amortized.
beverage costs. The growth for fiscal 2015 was driven primarily by leveraging
positive same-restaurant sales and lower restaurant expenses. The Other These judgments may produce materially different amounts of
Business segment profit margins were 16.9 percent for fiscal 2016, d epreciation, amortization and rent expense than would be reported if
15.5 percent for fiscal 2015 and 13.4 percent for fiscal 2014. The growth different expected lease terms were used.
for fiscal 2016 was driven by positive same-restaurant sales leverage and
lower food and beverage costs. The growth for fiscal 2015 was driven by Valuation of Long-Lived Assets
positive same-restaurant sales leverage and lower restaurant expenses. Land, buildings and equipment and certain other assets, including
definite-lived intangible assets, are reviewed for impairment whenever
SEASONALITY events or changes in circumstances indicate that the carrying amount
Our sales volumes fluctuate seasonally. Typically, our average sales per of an asset may not be recoverable. The judgments we make related to the
restaurant are highest in the winter and spring, followed by the summer, and expected useful lives of long-lived assets, definitions of lease terms and our
lowest in the fall. Holidays, changes in the economy, severe weather and ability to realize undiscounted cash flows in excess of the carrying amounts
similar conditions may impact sales volumes seasonally in some operating of these assets are affected by factors such as the ongoing maintenance and
regions. Because of the seasonality of our business, results for any quarter improvements of the assets, changes in economic conditions, changes in
are not necessarily indicative of the results that may be achieved for the full usage or operating performance, desirability of the restaurant sites and other
fiscal year. factors, such as our ability to sell our assets held for sale. As we assess the
ongoing expected cash flows and carrying amounts of our long-lived assets,
significant adverse changes in these factors could cause us to realize an
DARDEN RESTAURANTS, INC. • 2016 ANNUAL REPORT 15
137248_DardenAR_FINCL.r2.indd 15 8/4/16 12:40 PMYou can also read