OVERBERG District Municipality 01/52
←
→
Page content transcription
If your browser does not render page correctly, please read the page content below
01/52   OVERBERG
        District Municipality

          .
CONTENT

1. Executive Summary .......................................................................................... 4
2. Introduction: Brief Overview ............................................................................ 4
     2.1 Location.................................................................................................................... 4
     2.2 Historical Perspective ............................................................................................... 5
     2.3 Spatial Integration .................................................................................................... 5
     2.4 Land Ownership…………………………………………………………………………….
3. Social Development Profile .............................................................................. 5
     3.1 Key Social Demographics ........................................................................................ 5
     3.1.1 Population………………………………………………………………………………….
     3.1.2 Gender, Age and Race…………………………………………………………………...
     3.1.3 Households…………………………………………………………………………………
     3.2 Health Profile ............................................................................................................ 7
     3.3 COVID-19................................................................................................................. 7
     3.4 Poverty Dimensions.................................................................................................. 8
     3.4.1 Distribution ............................................................................................................ 8
     3.4.2 Inequality ............................................................................................................... 9
     3.4.3 Employment/Unemployment .................................................................................. 9
     3.4.4 Crime..................................................................................................................... 9
     3.5 Education and Skills Profile .................................................................................... 10
4. Drivers of the Economy .................................................................................. 11
     4.1.    Structure of the Economy .................................................................................... 11
     4.2.    Primary sector ..................................................................................................... 11
     4.3.    Secondary sector ................................................................................................ 11
     4.4.    Tertiary sector ..................................................................................................... 12
     4.5.    Informal Economy ............................................................................................... 12
     4.6.    Economic Growth Forecast ................................................................................. 13
5. Service Delivery............................................................................................... 13
     5.1.    Water and Sanitation........................................................................................... 13
     5.2.    Human Settlements............................................................................................. 14
     5.3.    Electricity ............................................................................................................ 14
     5.4.    Waste Management ............................................................................................ 15
     5.5.    Transport ............................................................................................................ 15
6. Governance and Management ....................................................................... 16
     6.1 Municipal Performance ........................................................................................... 16
     6.2 Municipal Capacity ................................................................................................. 16
     6.3 Traditional Leadership…………………………………………………………………….
7. PROJECTS TO DIVERSIFY AND GROW PEOPLE AND THE ECONOMY .... 17
     7.1 Spatial Development .............................................................................................. 17
     7.2 Ecological Potential and Biodiversity ...................................................................... 17
     7.3 Social Development Projects .................................................................................. 17
     7.4 Economic and Infrastructure Projects ..................................................................... 18
8. KEY RECOMMENDATIONS............................................................................. 18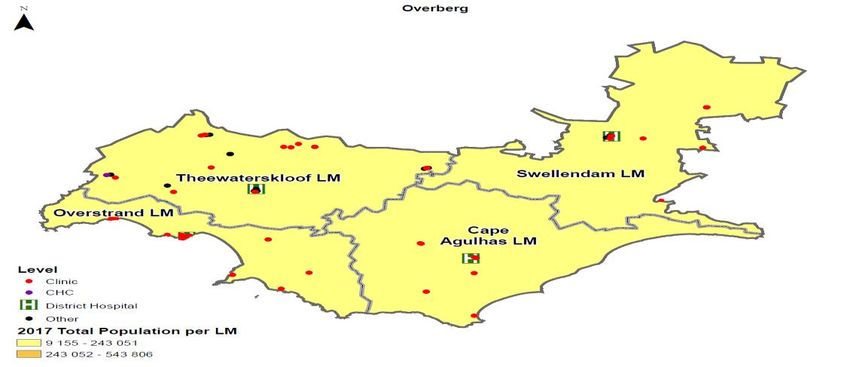
Executive Summary
The Overberg District Municipality is a District Municipality that governs the Overberg
region in the Western Cape province of South Africa. It is divided into four local
municipalities, namely Theewaterskloof, Overstrand, Swellendam, and Cape Agulhas and
includes the major towns of Grabouw, Caledon, Hermanus, Bredasdorp and Swellendam.
The municipal headquarters are located at Bredasdorp in the southern part of the district.

With 300 000 people, the Overberg District Municipality housed 0.5% of South Africa's total
population in 2019. Between 2009 and 2019 the population growth averaged 2.06% per
annum which is slightly higher than the growth rate of South Africa as a whole (1.61%).
Compared to Western Cape's average annual growth rate (2.25%), the growth rate in
Overberg's population at 2.06% was very similar than that of the province.

The health profile shows that TB and HIV and Aids are amongst the leading causes of
death in the age groups of 25-64 and 5-24 years. Although the Overberg District has the
second lowest Covid-19 infection rate of the districts in the Western Cape, the number of
people with HIV in the District, as one of the comorbidities of the virus, may exacerbate
the negative impact of the disease.

In 2019, there were 150 000 people living in poverty, using the upper poverty line definition,
across Overberg District Municipality - this is 34.12% higher than the 112 000 in 2009. The
percentage of people living in poverty has increased from 45.57% in 2009 to 49.84% in
2019, which indicates a increase of -4.27 percentage points.
The unemployment rate in the District was 21,1% in 2019, which is higher than that of the
Western Cape of 20,5% (but better than the rate in the country of 28,2% in 2019). With
regard to crime statistics, drug-related crime, in particular, shows an increase in the District
area, which is above the Province’s rate.

The literacy rate in the District is lower than that of the Province. The longer-term average
economic growth rate in the District from 2009 to 2019, was 1,17%, which is slightly lower
than that of South Africa (1,68%). In 2019, the Community Services sector, which includes
the government services, is the largest contributor to the District economy followed by the
Trade and Manufacturing sectors respectively. Challenges facing the economy include
unemployment that is largely dependent on agriculture, limited available natural resources,
relative high skills shortages and limited access for marginalized communities to enter the
mainstream economic opportunities. The Overberg District Municipality’s IDP indicates
that it identified poverty alleviation as one of the major challenges facing the municipality
and with this the need for economic development.

In terms of service delivery, there is still sanitation backlogs (Pit toilet, Bucket system and
No toilet), particularly in Theewaterskloof local municipality. With regard to housing,
Theewaterskloof and Overstrand local municipalities have a high proportion of informal
dwellings. In Theewaterskloof there is also a proportion of households with no access to
electricity.

Although the District Municipality received clean audits for the last four years, the NT
highlights certain areas where the financial management performance has been below the
norm. For example, with regard spending of the capital budget in the 2017/18 FY, and
areas such as the “Current Ratio”, “Liquidity ratio” and “Current Debtors Collection rate” in
the 2018/19 FY.
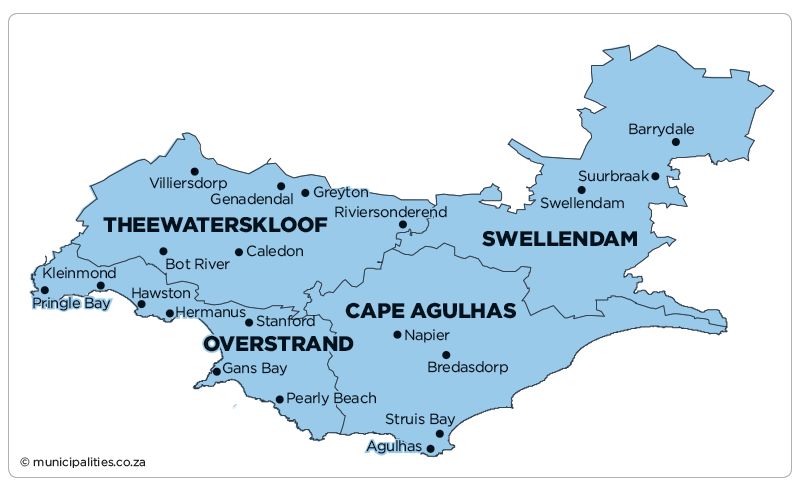
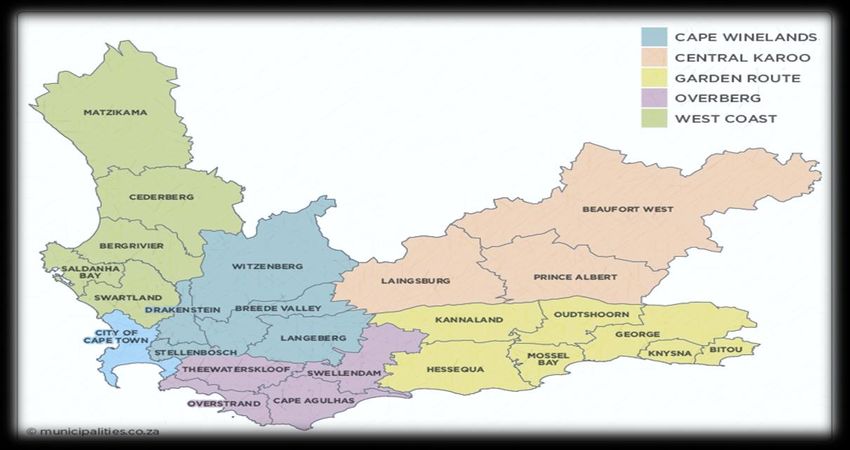
2. Introduction: Brief Overview
2.1 Location
The Overberg municipal area covers 12,241 square kilometres lying to the south-east of
Cape Town. It stretches from the Hottentots-Holland mountains in the west to the Breede
River mouth in the east, and as far as the Riviersonderend mountains in the north. It
includes Cape Agulhas, the southernmost point in Africa, and has coastline on both the
Atlantic Ocean and the Indian Ocean.

The largest town is Grabouw in the Elgin valley adjacent to the Hottentots-Holland on the
north-western edge of the district. It borders on the City of Cape Town to the west, the
Cape Winelands District to the north, and the Garden Route District to the east.

2.2 Historical perspective
The name, derived from Over 't Berg, means "over the (Hottentots-Holland) mountain" and
is a reference to the region's location relative to Cape Town.

The Overberg has always been considered as the breadbasket of the Cape and is largely
given to grain farming, mainly wheat. The wheat fields are a major breeding ground for
South Africa's national bird, the blue crane. Another important food farmed in the Overberg
is fruit, with Grabouw being the second largest supplier of fruit in South Africa. Nestled in
the Overberg, one can find the Kogelberg Biosphere Reserve (recognised and registered
with UNESCO) populated with a large diversity of flowering plants not found anywhere else
in the fynbos biome. The landscape is dominated by gently to moderately undulating hills
enclosed by mountains and the ocean.
2.3 Spatial Status
The municipality is the smallest district in the Western Cape province, making up only 9%
of its geographical area and covering 12 301.1 km2. The Overberg has rugged mountain
ranges, fynbos, rolling wheat and canola fields, and splendid coastal vistas. The Overberg
is a region that stretches along coasts with beautiful beaches, and over mountain ranges
with interesting geological formations, abundant birdlife and fynbos.

2.4 Land Ownership
Land reform in the district should be implemented in conjunction with the National Land
Reform Programme. In general, land reform’s key objective is to increase black people’s
participation in all forms of the rural economy, not just agriculture. This includes
conservation and tourism. The Area Based Plan (ABP) for Land Reform in the Overberg
District was prepared in 2008 and made recommendations/proposals for land reform in the
area (Profile of Overberg District, Dept of Local Government, Western Cape).

3. SOCIAL DEVELOPMENT PROFILE
3.1 Key Social Demographics
3.1.1 Population
With 300 000 people, the Overberg District Municipality housed 0.5% of South Africa's total
population in 2019. Between 2009 and 2019 the population growth averaged 2.06% per
annum which is slightly higher than the growth rate of South Africa as a whole (1.61%).
Compared to Western Cape's average annual growth rate (2.25%), the growth rate in
Overberg's population at 2.06% was very similar than that of the province.

                                   Population structure
                                Overberg vs. South Africa, 2019
          Male                                                                Female
                 Overberg                 75+
                 South Africa            70-74
                                         65-69
                                         60-64
                                         55-59
                                         50-54
                                         45-49
                                         40-44
                                         35-39
                                         30-34
                                         25-29
                                         20-24
                                         15-19
                                         10-14
                                         05-09
                                         00-04

      6,0%          4,0%          2,0%       0,0%        2,0%          4,0%          6,0%
                                                 Source: IHS Markit Regional eXplorer version 1946
3.1.2 Gender, Age and Race In 2019, the Overberg District Municipality's population consisted of 31.54% African (94 600), 16.45% White (49 400), 51.60% Coloured (155 000) and 0.41% Asian (1 240) people. Overberg District Municipality's male/female split in population was 100.7 males per 100 females in 2019. The Overberg District Municipality has significantly more males (50.17%) relative to South Africa (48.96%), and what is typically seen in a stable population. The largest share of population is within the young working age (25-44 years) age category with a total number of 101 000 or 33.6% of the total population. The age category with the second largest number of people is the babies and kids (0-14 years) age category with a total share of 23.2%, followed by the older working age (45-64 years) age category with 57 600 people. The age category with the least number of people is the retired / old age (65 years and older) age category with only 31 100 people, as reflected in the population pyramids below. 3.1.3 Household In 2019, the Overberg District Municipality comprised of 93 100 households. This equates to an average annual growth rate of 2.39% in the number of households from 2009 to 2019. With an average annual growth rate of 2.06% in the total population, the average household size in the Overberg District Municipality is by implication decreasing. This is confirmed by the data where the average household size in 2009 decreased from approximately 3.3 individuals per household to 3.2 persons per household in 2019. 3.2 Health profile The leading causes of death amongst the working age group (25-64) are TB (around 12%) and HIV & Aids (around 11%). For those from 15-24, it was road injuries (around 20%) and interpersonal violence (around 28%), followed by TB (13%) and HIV&Aids (around 13%). For those above 65 it is Ischaemic heart disease (16%) and Cerebrovascular disease (14%). For those below 14 years the leading causes are Lower respiratory infections (19%) and injuries (drownings, 55%, road injuries, 36%) (Overberg District Health Plan, 2019/20-2021/22). . In terms of healthcare facilities, in 2017/18, the Overberg District area had 17 fixed clinics and 23 mobile primary healthcare clinics. In addition, there was also 2 community day centres, 4 district hospitals as well as 23 ART and 43 TB treatment clinics/sites (Overberg District Municipal Profile, Western Cape Dept of LG).
Source: Overberg District Health Plan 2019/20-2021/22

3.3 Covid-19
In respect of COVID-19, as at 3 July 2020, there was a total of 1340 active cases in the
Overberg District with 589 recoveries. According to IHS Markit (Global Insight) 12 100
people in the Overberg District Municipality were infected with HIV in 2019, which is one
of the comorbidities that may exacerbate the negative impact of COVID-19.

According to information from the Disaster Management Centre (June 2020), Overberg
has the second lowest infection rate of the districts in the Western Cape. A generally low
vulnerability to COVID-19 according to the CSIR dashboard is observed. This can be
attributed to Low Transmission Potential (72%) paired with Least (50%) and Slightly
Susceptible (35%) Health status scores. As part of Covid-19 provisions for drought
hotspots there were 46 Department of Water and Sanitation water tanks in use in the
Overberg District, and 1 Water Tanker.

3.4 Poverty Dimensions
3.4.1 Distribution
In 2019, there were 150 000 people living in poverty, using the upper poverty line definition,
across Overberg District Municipality - this is 34.12% higher than the 112 000 in 2009. The
percentage of people living in poverty has increased from 45.57% in 2009 to 49.84% in
2019, which indicates a increase of -4.27 percentage points.

The poverty head count in Overberg decreased from 3.7% to 2.6% and the intensity
also decreased from 42.2% to 40.3% between 2011 and 2016. The former measures
the number of people living below the poverty line, whereas the latter measures the
extent to which the standard of living of the poor is under the poverty line. The poverty
head count is lower than the provincial headcount of 2,7%. It also decreased in the
local municipalities from 2011 to 2016.
Poverty Headcount
  5,0%

  4,0%

  3,0%

  2,0%

  1,0%

  0,0%
              Overberg          Swellendam        Theewaterskloof         Overstrand   Cape Agulhas

                         Poverty Headcount 2011              Poverty Headcount 2016

Poverty Headcount. Source Stats SA: Census 2011 & Community Survey 2016

The quality of life of the poor in the District, improved from 2011 to 2016, with the
intensity having d e c r e a s e d by close to 2%. Those in Cape Agulhas have felt it
more with the intensity having decreased by close to 3%, and the decreases were by 1%
in Swellendam, 1.2% in Theewaterskloof and more than 2% in Overstrand.

                          Intensity of poverty
  44,0%
  43,0%
  42,0%
  41,0%
  40,0%
  39,0%
  38,0%
  37,0%
  36,0%

             Intensity of poverty 2011           Intensity of poverty 2016

Poverty Headcount. Source Stats SA: Census 2011 & Community Survey 2016

According to IHS Markit (Global Insight), in 2019, there were 150 000 people living below
the upper poverty line (i.e., receive a monthly income of R1 183 or less) across Overberg
District Municipality – which is higher than the 112 000 in 2009. The percentage of people
living in poverty has increased from 45.6% in 2009 to 49.9% in 2019, which indicates an
increase of 4.3 percentage points. The 49,9% is better than the South African rate of
58.6%, but worse than the Western Cape rate of 47.3%.

3.4.2 Inequality
In 2019, the Gini coefficient in Overberg District Municipality was at 0.617. The Western
Cape Province and South Africa, both had a more unequal spread of income amongst their
residents (at 0.618 and 0.63 respectively) when compared to Overberg District
Municipality.
In 2019 Overberg District Municipality had an Human Development Index of 0.71
compared to the Western Cape with a HDI of 0.73 and 0.66 as the national total. South
Africa recorded a lower HDI in 2019 when compared to Overberg District Municipality,
which translates, to better human development for Overberg District Municipality
compared to South Africa (IHS Markit, Global Insight).
3.4.3 Unemployment/employment
In 2019, the unemployment rate in Overberg District Municipality (based on the official
definition of unemployment) was 21.1%, which is an increase of 3.2 percentage points
from 2009. The unemployment rate in Overberg District Municipality is higher than that of
Western Cape of 20.5%. The unemployment rate for South Africa was 28.2% in 2019 (HIS
Markit, Global Insight).
In Overberg District Municipality the economic sectors that recorded the largest number of
employment in 2019 were the trade sector with a total of 28 000 employed people or 25.9%
of total employment in the district municipality. The finance sector with a total of 20 300
(18.7%) employs the second highest number of people relative to the rest of the sectors.
The mining sector with 90.2 (0.1%) is the sector that employs the least number of people
in Overberg District Municipality, followed by the electricity sector with 420 (0.4%) people
employed.
Total Employment Composition
Overberg, 2019
6 Trade
5 Construction
4 Electricity
8 Finance
3 Manufacturing
2 Mining
1 Agriculture
9 Community
Households
7 Transport services
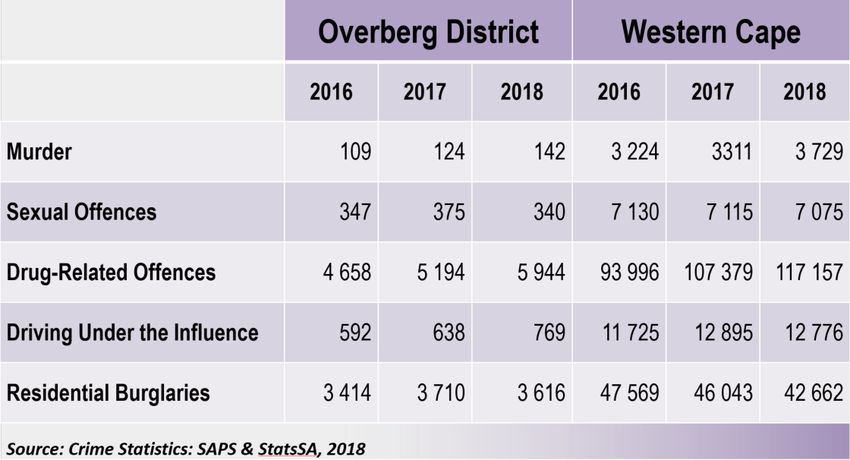
Source: IHS Markit Regional eXplorer version 19463.4.4 Crime Within the Overberg District area, the number of murders increased slightly from 124 in 2017 to 142 in 2018; based on estimated population growth, the murder rate (per 100 000 population) increased from 41 in 2017 to 46 in 2018. This was well below the Province’s rates of 51 in 2017 and 56 in 2018. With respect to the crime statistic released by SAPS, sexual offences decreased by 0.6 per cent (7 115 to 7 075) in the Western Cape between 2017 and 2018. In 2018, there were 340 sexual offences in the Overberg District area; the District’s per 100 000 population rate of 110 was slightly above that of the Province’s 107. Drug-related crime within the Overberg District area shows an increase in 2018, from 5 194 cases in 2017 to 5 944 cases in 2018. When considering the rate per 100 000 population, with 1 930 crimes per 100 000 population in 2018, the Overberg District’s rate is well above that of the Province’s rate of 1 769. Safety and Security in Grabouw and Hermanus were recently under pressure regarding civil unrest. The Overberg district also faces challenges with respect of the poaching of alcohol and drug abuse. 3.5 Education and Skills Profile Learners aged 20 and above in the District and have completed secondary education stood at 28,5% in 2016 which was lower than other districts in the Province and the provincial average of 33,8%. The learners that completed higher education was 10.1%, which was higher than other districts but lower than the provincial average of 12.7%.
The literacy rate in Overberg DM in 2019 was 86,1%, of those 15 years and older who
completed grade 7 or higher (compared with 90,8% in the Province).

In 2018, the matric pass rate was an average of 84,6% in the District.

Educational Development in 2018
 Municipality       Learner-                    Matric pass
                    teacher    ratio            rate 2018 (%)
                    2018(%)
 Cape Agulhas       28.1                        97,7
 Overstrand         29.9                        82,5
 Theewaterskloof    29.6                        79,2
 Swellendam         25.9                        84.0
(ODM Draft 2020/21 IDP Review, 25 March 2020)

The district had a total number of 83 schools, catering for 43 103 learners in Grade 1-12
in 2018/19. There are 42 public ordinary schools, and 12 independent schools of which 4
are Early Childhood Development (ECD) Centres.

4. DRIVERS OF THE ECONOMY
4.1 Structure of the Economy
The longer-term average growth rate for Overberg for 2009 to 2019 was 1.17%, which is
slightly lower than that of South Africa (1.68%). The economic growth in Overberg peaked
in 2010 at 2.82%. Regarding the local municipalities in the district, Cape Agulhas had the
highest average annual economic growth, averaging 1.36% between 2009 and 2019,
when compared to the rest of the regions within the Overberg District Municipality. The
Overstrand Local Municipality had the second highest average annual growth rate of
1.21%. Theewaterskloof Local Municipality had the lowest average annual growth rate of
1.08% between 2009 and 2019.

The following chart shows that the tertiary sector contributes the most to the Gross Value
Added within the Overberg District Municipality at 56.8% in 2019. This is significant lower
than the national economy (68.7%). The secondary sector contributed a total of 28.5%
(ranking second), while the primary sector contributed the least at 14.7%.
Gross Value Added (GVA) by aggregate sector
Overberg District Municipality, 2019
Tertiary sector
Primary
Secondary sector
sector
Source: IHS Markit Regional eXplorer version 1946
4.2 Primary Sector
Both the agriculture and mining sectors are generally characterised by volatility in growth
over the period from 2009 to 2019. In 2018 the Agricultural sector contributed 16% to the
economy of the District as shown in the chart above.
The mining sector contributes the least to the economy of Overberg District Municipality
is the mining sector with a contribution of R 26.9 million or 0.12% of the total GVA in 2019.
4.3 Secondary Sector
The secondary sector consists of three broad economic sectors namely the manufacturing,
electricity and the construction sector. The manufacturing sector’s contribution in 2019
was 15.8% which was the third most to the GVA of the Overberg District (after Community
Services and the Trade Sector). The construction sector’s contribution was 9% while that
of the electricity sector was 4% in 2018.
4.4 Tertiary Sector
The tertiary sector consists of four broad economic sectors namely the trade, transport,
finance and the community services sector.
In 2019, the community services sector is the largest within Overberg District Municipality
accounting for R 4.19 billion or 18.2% of the total GVA in the district municipality's
economy. The community sector, which includes the government services, is generally a
large contributor towards GVA in smaller and more rural local municipalities.The sector that contributes the second most to the GVA of the Overberg District Municipality is the trade sector at 16.6%. The finance and transport sectors contributed 13% and 8% respectively in 2018. When looking at the local municipalities within the district municipality, the Theewaterskloof Local Municipality made the largest contribution to the community services sector at 42.03% of the district municipality. As a whole, the Theewaterskloof Local Municipality contributed R 9.51 billion or 41.41% to the GVA of the Overberg District Municipality, making it the largest contributor to the overall GVA of the Overberg District Municipality. 4.5 Informal Economy The informal sector makes up 17.2 per cent of the District’s workforce in the agriculture, fishing, and forestry sector and has experienced a moderate long term employment growth rate of 1.1 per cent per annum since 2015. The informal sector employed 18.9 per cent of the manufacturing workforce and employment within this category has grown by 4.1 per cent per annum. More than a third (39.0 per cent) of the commercial sector’s workforce operates within the informal sector, which has been the fastest growing among the four skill categories and created the majority of the jobs since 2016. Informal employment within the general government & community, social and personal services industry has seen significant growth since 2015 (averaging 16.7 per cent per annum). 4.6 Economic Growth Forecast The trade sector is expected to grow fastest at an average of 0.97% annually from R 2.28 billion in Overberg District Municipality to R 2.39 billion in 2024. The finance sector is estimated to be the largest sector within the Overberg District Municipality in 2024, with a total share of 18.0% of the total GVA (as measured in current prices), growing at an average annual rate of 0.1%. The sector that is estimated to grow the slowest is the construction sector with an average annual growth rate of -3.03%. The Primary sector is expected to grow at an average annual rate of -0.18% between 2019 and 2024, with the Secondary sector growing at -1.10% on average annually. The Tertiary sector is expected to grow at an average annual rate of -0.56% for the same period. 5. SERVICE DELIVERY 5.1 Water and Sanitation The Community Survey 2016 shows that 260 102 households (90,7%) are getting water from a regional or local service provider. 82% of households have piped water inside the
house, 10% have piped water inside the yard, 5% receive piped water on a community
stand and 1% in a community tap.

Households with access to safe drinking water in the Overberg district was at 92.6% in
2016, and improved to 98.8% in 2018 according to IHS Markit (Global Insight).

The Community Survey of 2016 reported that 96.5% of households in Overberg DM had
access to flush or chemical toilets, compared to the Western Cape (95.6%). 1.3% of
households have no access to any toilets (0,7% in Western Cape and 2.4% in South
Africa).

When looking at the sanitation backlog (number of households without hygienic toilets)
over time, in 2008 the number of Households without any hygienic toilets in Overberg
District Municipality was 6 580, this decreased annually at a rate of -5.77% to 3 630 in
2018. The largest number of the backlog (Pit Toilet, Bucket system and No toilet) is in the
Theewaterskloof local municipality (as can be seen in the following table).

Households by type of sanitation - Theewaterskloof, Overstrand, Cape Agulhas and
Swellendam local municipalities, 2018

                                   Ventilation
                                                                       Bucket
                   Flush toilet   Improved Pit      Pit toilet                        No toilet        Total
                                                                       system
                                     (VIP)
 Theewaterskloof         29,985               330          113               548           1,483          32,458
 Overstrand              33,514                57          101               291             138          34,101
 Cape Agulhas            11,387                38           41               184             210          11,860
 Swellendam              10,916               160           89               286             150          11,601
 Total
                         85,803              585           343              1,309          1,980          90,019
 Overberg
                                                                 Source: IHS Markit Regional eXplorer version 1946

5.2 Human Settlements
The Community Survey 2016 found that 82% of households in the Overberg district had
access to formal housing (82,4% in Western Cape province). Theewaterskloof (20,3%)
and Overstrand (20%) municipalities recorded a high proportion of informal dwellings.
According to IHS Markit (Global Insight), when looking at the formal dwelling unit backlog (number of households not living in a formal dwelling) over time, it can be seen that in 2008 the number of households not living in a formal dwelling were 12 200 within Overberg District Municipality. From 2008 this number increased annually at 3.49% to 17 100 in 2018. The context to this is that the total number of households within Overberg District Municipality increased at an average annual rate of 2.23% from 2008 to 2018, which is higher than the annual increase of 2.13% in the number of households in South Africa. With high in-migration into a region, the number of households increased, putting additional strain on household infrastructure. In the short to medium term this can result in an increase in the number of households not living in a formal dwelling, as the provision of household infrastructure usually takes time to deliver. 5.3 Electricity Overberg reported 93% of households connected to the grid and paying and 2% connected to a source for which they were not paying. 69% of households in Overberg DM had an in- house prepaid meter, 24% an in-house conventional meter and 3% had no access to electricity (2% in Western Cape and 7% in South Africa had no access to electricity). In Theewaterskloof local municipality, 8.3% of the households had no access to electricity in 2016. 5.4 Waste Management Access to basic refuse removal services was at 88.9% in Overberg as reported by the 2016 Community Survey (89.8% in the Western Cape). In 2016, 1.1% of households in the Overberg District reported not having refuse disposal (compared with 4% of households in the country and 0,9% in the Western Cape).
5.5 Transport
The Roads Division in the District Municipality receives grant funding from the Provincial
Department Transport & Public Works (DTPW) and acts as a Provincial Agent for the
maintenance of the network of main, divisional and minor roads. This includes all activities
relating to the maintenance of 3,685km of proclaimed roads in the Overberg District. The
major access route to the Overberg District is the N2.

The challenges include environmental factors, ageing/depreciation of mechanical plant
and equipment and backlogs due to insufficient capacity and funds. In response to the
challenges the environmental factors needs to be managed (weather conditions, irregular
rainfall patterns, flood damage, etc.) and more intensive maintenance of the fleet is needed
(Overberg DM, IDP 2017/18 – 2021/22).

6. GOVERNANCE AND MANAGEMENT
6.1 Municipal Performance
The Overberg District Municipality obtained an “unqualified with no findings” audit outcome
for the past four years for 2015, 2016, 2017 and 2018 (Municipal Money, National
Treasury).

In terms of financial management in the District Municipality, National Treasury highlights
difficulties in the following areas:
   •   Spending of the capital budget – 38,9% underspent in the 2017/18 FY, which is
       above the norm of 15%. Although Operations and Maintenance expenditure was
       good with 170% in 2018 (which is well above the norm of 8%).
   •   The “Current Ratio”, “Liquidity ratio” and “Current Debtors Collection rate” where
       the performance was below the norm in the 2018/19 FY.
       (Municipal Money, National Treasury).
6.2 Municipal Capacity The Overberg DM reported that the position of Municipal Manager was filled during the 2018/19 FY, that the CFO position was vacant for 58% of the reporting months (5 times filled and 7 times vacant) in 2018/19, and that one of the two Section 56 manager positions was vacant during 2018/19. The Municipality reported that it had an average of 320 permanent employees during the 2018/19 FY (Monthly B2B reporting to the DCoG). 6.3 Traditional Leadership There are currently no statutory recognised traditional communities or leaders (kings, queens, principal traditional leaders, senior traditional leaders, headmen or headwomen) in the Western Cape province. For this reason, there are also no traditional leadership structures such as a provincial house of traditional leaders, local houses of traditional leaders or traditional councils in the province. Since there are no recognised traditional leaders in the province, there are also no defined or mapped areas of jurisdiction. There are also no statutory recognised Khoi-San communities or leaders in the province. The Traditional and Khoi-San Leadership Act, 2019 (Act No. 3 of 2019) was published in the Government Gazette on 28 November 2019, however, it has not yet commenced. Once the Act commences, a Commission on Khoi-San Matters will be established to receive, investigate, consider and make recommendations to the Minister in respect of applications for recognition by Khoi-San communities and leaders. Only once a Khoi-San community has been recognised in terms of the Act, a Khoi-San council will be established for such community, similar to the traditional councils that exist in other provinces for recognised traditional communities. 7. Projects to Diversify and Grow the Economy 7.1 Spatial Development Overberg District is the permit holder for the Landfill facility at Karwyderskraal 1. The District is currently accommodating Overstrand and Theewaterskloof municipalities and was approached by Cape Agulhas for accommodation due to their landfills running out of capacity. A need was also identified to acquire additional land next to the current Karwyderskraal site to service the City of Cape Town. 7.2 Ecological Potential and Biodiversity The District Municipality has an important role to play in mitigating the rate of climate change in the area. The district municipality will need to effectively cope with the change in climate conditions. Extreme climatic conditions will result in more intense and frequent
storms and sea level rise in the district. Longer drought periods may have a negative
impact on the agriculture in the district. Sustainable water resources will need to be
protected.

The district’s ability to cope will be improved if it embraces the moves to renewable energy
generation, green building technologies, and improved water management. In particular,
the quality of water in the river systems needs to be protected and this needs to be
impressed upon upstream users through the appropriate forums.

Landscapes that provide resilience to climate change need to be protected. It is critical to
protect urban development from climate change high risk areas through determining a
coastal setback line and increased setbacks from river corridors. Sea level rise and
increased flooding, as a result of climate change, could have a more significant impact on
urban development in these areas.

Promotion of solar and wind generation projects as an alternative source of energy can
possibly relief the pressures. Due regard should be given to the impacts of these projects
on their environment.

7.3 Social Development Projects
A need was identified for a Rehabilitation Centre in the Overberg. This need was identified
at the District Social Development Summit, as well as the District Community Safety
Summit, which was supported, by all Mayors and MMs.

Based on agricultural activities being the primary economic driver in the Overberg, the
establishment of an agriculture school with secondary, supporting educational streams has
been identified as a priory project for the Overberg Area. Swellendam is central to the
agricultural region and would therefore make geographical sense for the development of
such an educational facility.

7.4 Economical and Infrastructure Projects
The train project involves the optimisation of existing rail infrastructure and the exploration
of possibilities to develop additional railway infrastructure in the Region that will enhance
economic development opportunities.

In order to protect the water resources and expand the dam water storage capacity within
the District, funding is requested for the development of a new dam and expansion of
existing dams in the Overberg Region.
8. KEY RECOMMENDATIONS
Key recommendations to be made include the following:
   •   That aspects with regard to service delivery in the district municipality area, such as
       the following, be further attended to and supported: sanitation backlogs (Pit toilet,
       Bucket system and No toilet), particularly in Theewaterskloof local municipality; the
       high proportion of informal dwellings in Theewaterskloof and Overstrand local
       municipalities; and the proportion of households in Theewaterskloof with no access
       to electricity.

   •   That areas with regard to financial management performance in the District
       Municipality, highlighted by National Treasury be looked into or addressed, and that
       the District Municipality be assisted in this regard if necessary.

   •   That the proposed catalytic projets as part of the Joint District Approach in the
       Overberg be supported across government with the necessary financial and human
       resources where necessary, as they relate to social development, economic and
       environmental challenges and needs in the area and society.

   •   That where the District Municipality has an important role to play in mitigating the
       rate of climate change in the area, and its ability to cope with climate change will be
       improved if it embraces the moves to renewable energy generation, green building
       technologies, and improved water management, key projects in this regard be
       further explored and considered.

   •   With the Overberg’s beauty and diversity of the natural environment there surely
       must be potential in opportunities to increase tourism to the area with its resultant
       economic development and job creation opportunities. Possibilities need to
       explored further as to what needs to be done to maximize opportunities in this
       regard.
You can also read