Overview of the Solar Energy Industry and Supply Chain - Prepared for the BlueGreen Alliance By Stone & Associates January, 2011
←
→
Page content transcription
If your browser does not render page correctly, please read the page content below
Overview of the Solar Energy Industry and
                             Supply Chain

                                          Prepared for the BlueGreen Alliance
                                                By Stone & Associates
http://www.bluegreenalliance.org/cemc                January, 2011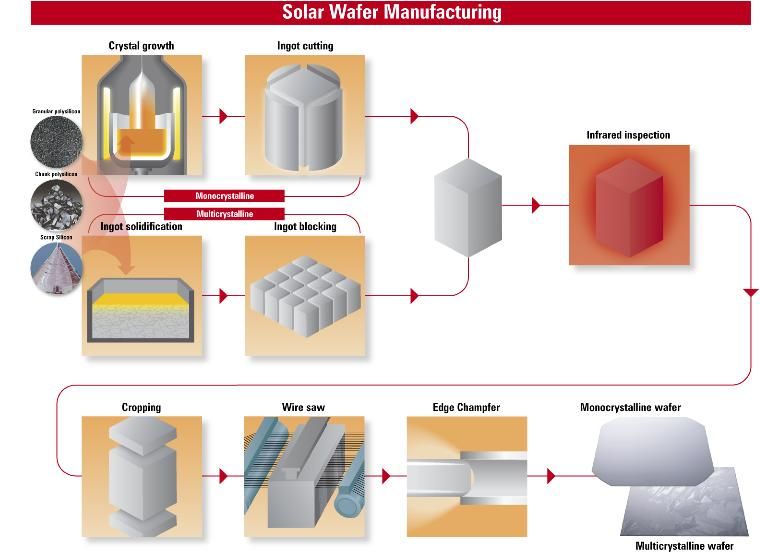
Introduction

        This Overview of the Solar Energy Industry and Supply Chain was prepared for the
   BlueGreen Alliance Foundation’s Clean Energy Manufacturing Center (CEMC) as the
   first step in identifying opportunities to increase the base of domestic suppliers in the
   U.S. solar energy industry. The overview includes general information about the solar
   energy market as well as current installed capacity and expected growth, but its
   primary focus is the solar energy supply chain. Building the domestic supply chain for
   the solar energy industry has the potential to create jobs while accelerating the
   transition to a clean energy economy.

       The BlueGreen Alliance Foundation (BGAF) is a non-profit, 501 (c) (3) organization.
   BGAF conducts research and educates the public and media about solutions to
   environmental challenges that create economic opportunities for the American people.
   The CEMC seeks to identify job creation opportunities in the U.S. wind and solar energy
   sectors and works with manufacturers, public officials, and others to grow the
   domestic base of suppliers in the clean energy manufacturing economy.

       This document is based solely on secondary research to develop a set of industry
   information that can be used to help U.S. manufacturers participate in solar industry
   growth. The document is a starting point to assist in determining where and how to
   focus resources to maximize employment growth in the solar industry. The
   assessment of job creation opportunities in section one is preliminary, and requires
   additional primary research to validate and elaborate.                                      2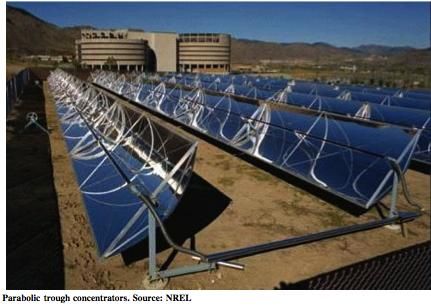
Section Topics

   1.   Summary Assessment of Job Creation Opportunities in Solar
         Includes PV manufacturing opportunities by supply chain component

   2.   Solar Technologies – Installed Capacity and Growth
         Overview of PV, CSP, and SHC

   3.   Photovoltaic (PV) Global Supply Chain and Production

   4.   Trends in PV Production, Supply and Demand
         National incentives for U.S. production facilities and competitive advantage in a
            global market

   5.   Concentrated Solar Power (CSP)
         Includes list of manufacturers by supply chain component

   6.   Solar Heating and Cooling (SHC)
         Includes list of U.S. Manufacturers

   7.   Solar Industry Employment
                                                                                             3
1. Summary Assessment of Job Creation Opportunities in Solar
Topics Covered In This Section
Summary of Job Creation Opportunities by Solar Segment
Assessment of Job Creation Opportunities within PV
by Supply Chain Component
This section shares a set of preliminary hypotheses,
to be confirmed with additional primary research.
4
Summary of Job Creation Opportunities by Solar Segment

                             Photovoltaic                                Solar Thermal

                                                          Solar Heating and Cooling
                                                          Current US Employment (2010): few thousand
                                                          Projected US Employment (2016): 13K
  Distributed
                 Photovoltaic                             Limited employment potential (unless demand
                 Current US Employment (2010): ~55 K      increases)
                 Projected US Employment (2016): 197 K

                 Largest employment potential             Concentrated Solar Power
                                                          Current US Employment (2010): few thousand
  Central /                                               Projected US Employment (2016): 20K
  Utility
                                                          Strong competitive position, but limited
                                                          employment potential

        Employment Projections depend Heavily on Demand Assumptions/Projections
      Note: Employment estimates are based on sources cited in employment section. Numbers above
  include only direct and indirect employment. Projections are probably overstated (Navigant Consulting)
        because they do not take into account foreign competition for manufacturing value added.
                                                                                                           5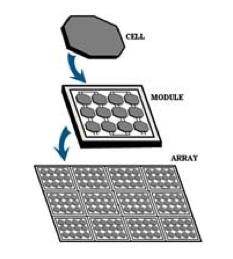
Summary of Job Creation Opportunities by Solar Segment (continued)
Photovoltaic Solar Thermal
PV – Distributed Solar Heating and Cooling
• Low penetration – significant opportunity (only 29K • Low penetration – significant opportunity
residential installations in 2009) • 90% of current installed base is pool
• Incentives now beginning to spark growth heating
• High jobs per MW, driven by substitution of labor and • Market recently revived by local and
equipment for fuel, and installation work on site federal incentives
Distributed • Opportunities for job growth: • Employment numbers, current and
Installation/construction as US demand grows projected, are very low
Some in manufacturing, particularly in modules, though • Opportunities for job growth:
low cost countries are increasing share of manufacturing Installation as US demand is spurred by
US producers may need to focus on niche technologies, government incentives
such as thin film where they have been strong
PV – Utility CSP
• Rapid growth • 95% of global capacity is in the US
• High jobs per MW, driven by substitution of labor and • Growth slowed after installations in 1980s
equipment for fuel (but lower than distributed) • Major resurgence underway:
• Opportunities for job growth: Projects under development represent
Central / Installation/construction as US demand grows (but over 20X current capacity
Utility considerably less than distributed) • US has unique strength in this technology
Some in manufacturing, particularly in modules, though due to sunlight in Southwest
low cost countries are increasing share of manufacturing • Job potential per MW is considerably
US producers may need to focus on niche technologies, lower than PV
6
such as thin film where they have been strongAssessment of Job Creation Opportunities Within PV By Supply
Chain Component
Jobs Per
Supply Chain MW Trends Opportunities
(Residential)
Operations &
0.3 (FTEs) Small employment Limited opportunity
Maintenance
System Integration, Tied to end-market – will grow as
Policies to stimulate demand should
Installation, 16.8 demand increases, driven by
create jobs in this segment
Construction policy
Uphill battle. US producers may need to
Growing in response to global focus on niche technologies, such as thin
Modules & Cells demand, but increasingly growth film or ribbon. Module plants are more
captured by low cost countries likely than cell plants to be located near
11.0 the customer in North America
Has been area of US strength, but
now shifting to vertically
Wafers Difficult to compete against China
integrated players in low cost
countries
Other Components
3.0 Insufficient information Insufficient Information
(BoS)
72. Solar Technologies – Installed Capacity & Growth
Topics Covered In This Section
Overview of Solar Technologies
Installed Capacity by Technology and Application
Annual Installations and Growth
Cost Comparisons with Other Energy Sources
8Overview – The Solar Industry Can Be Segmented By
Technology & Application
Photovoltaic (PV) Solar Thermal (ST)
Application •Generates electricity from the sun
•Uses the sun to heat a working fluid
through semi-conductors
Solar Heating & Cooling
Distributed PV – on the roof
• Photons in sunlight are absorbed
(SHC)
• Located at the user • These low and medium
by semiconductors, causing
• Residential, commercial/ temperature collectors do not
electrons to move. This current is
industrial generate electricity
electricity.
• Can be tied to the grid or • Heats liquid which is used to heat
• Electricity is converted from DC to
not connected to the grid or cool a home or building (e.g.;
AC and is either used
immediately, stored in a battery solar water heaters, solar pool
or sent back to the utility grid heaters, and solar cooling*)
• Note: often the term “solar thermal” only
includes these non-electricity generating
technologies (i.e. does NOT include CSP)
*Solar cooling uses heat to create air-
conditioning
Concentrating Solar Power
(CSP)
Central/Utility PV- Utility • Concentrated sunlight heats a fluid
which drives a turbine to generate
electricity
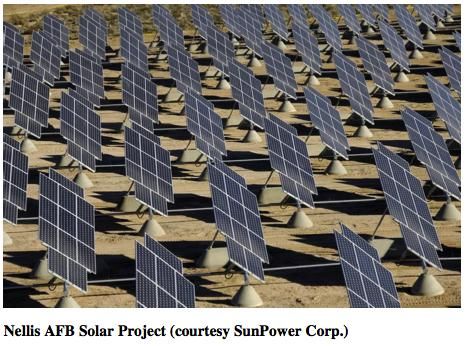
Generates Electricity 9Photovoltaic – Utility Scale
Source: The Sun Rises on Nevada Report
10Distributed Solar Capacity is Predominantly Photovoltaic &
Some Solar Heating/Cooling, while Utility Capacity is CSP & PV
US Installed Solar Capacity – 2009
Distributed
Central/ Distributed Comment
Technology Non- Total
Utility Residential /Source
Residential
SEIA ’09;
PV (MW-dc) 109 932 571 1,612 Off -grid est.
=NREL
CSP (MW-ac)* 431 -- -- 431 SEIA ‘09
~25,000
SHC (MW-th)** -- *** *** SEIA ‘09
* Roughly 15% loss in converting DC to AC
**MW-thermal is a measure of thermal power NOT electrical power; it is roughly 3x MW-e
*** The SHC split between Non-Residential and Residential is not given
11While the Growth of PV Installations Is Accelerating…
Annual US PV Installations (Grid-Tied)
250
211 207
200
Distributed: Non-
156 residential
150
MW-dc
101
Distributed:
100 Residential
67 78 66
51
59 Utility
50 27 32
38 22
9 24 27 9
120 3 2
11
3
15 2 1 0
5
0 1
2000 2001 2002 2003 2004 2005 2006 2007 2008 2009p
Source: SEIA 2009 Supplemental Charts
12…Only 29K Homes Installed PV Systems In 2009
Annual US PV Installations (Grid-Tied)
35,000
29,418
30,000
Number of Installations
25,000
20,000 17,008
Distributed:
Non-residential
15,000 13,132
Distributed:
10,000 8,445 Residential
5,980 6,652
4,085
5,000 3,183
2,275
1,748 1,463 1,943
507 498 870 1,062 1,128
162 93 269
0
2000 2001 2002 2003 2004 2005 2006 2007 2008 2009p
Source: SEIA 2009 Supplemental Charts
13The US Increased Its CSP Capacity From 1985-1991, But Since
Then Little New CSP Has Come Online
CSP - US Annual Installed &Cumulative Capacity
500
450 419 419
431
400 364 364 364 364 364
354 354 354 354 354 354 354 354 354 354 355
350
300 274
Cumulative
MW-ac
250
194 Annual Installed
200
134
150
104
100 60 60
80 80
64
44
50 24 20
10 10 10 14
30
10 12
0 0 0 0 0 0 0 0 0 0 0 0 0 0 0 1 0
-10
0
1981 1983 1985 1987 1989 1991 1993 1995 1997 1999 2001 2003 2005 2007 2009
-50
Source: SEIA 2009 Supplemental Charts
14However a Large Amount of Solar Capacity Is Under Development
For Utility Scale Projects – Employing Both PV & CSP Technologies
Central/Utility Growth - US by Technology
Utility Scale Solar Projects in the US as of June 25, 2010
CSP PV-SI PV-Thin Film
# Plants MW # Plants MW # Plants MW
IN OPERATION pre-2004 9 354 1 3 0 0
IN OPERATION post-2005 6 79 12 84 5 51
Total Current Capacity 15 433 13 87 5 51
UNDER CONSTRUCTION 1 75 9 89 1 40
UNDER DEVELOPMENT 35 9,929 77 11,414 8 1,207
TOTAL current & pipeline 51 10,437 99 11,590 14 1,298
Source: SEIA “UTILITY SCALE SOLAR PROJECTS IN THE US”, 6/25/2010
15The Growth of Distributed PV Solar Capacity Has Accelerated,
However SHC (mainly pool heating) Has Leveled Off
Distributed Solar Installations
400
350
300
250
MW-dc
200
150
100
50
0
2000 2001 2002 2003 2004 2005 2006 2007 2008 2009p
In MW – Annual installed capacity for distributed (located at user site) solar energy
(Note: SHC adjusted from MW-thermal to MW-electrical)
SHC – Pool heating is 80-95% of this total; hot water makes up most of the
remainder
Source: SEIA 2009
16Annual US Shipments of Solar Heating & Cooling are Dominated
By Pool Heating Applications
1200
Solar Heating & Cooling Shipments
1098
1036
1000 918 931
896 ~872
800 758 743
728
MW-th
542
Pool Heating
600 999
978 776 699 Hot Water
785
887
400 702 720 702 Space Heating & Other
511
200
129 147
74 91
24 18 28 33 29 42
0 7 8 10 8 2 16 25 20 26 26
2000 2001 2002 2003 2004 2005 2006 2007 2008 2009p
Cumulative Solar Water Heating and Pool Heating growth from 2000 to 2009:
SWH increased from 1500 to roughly 2200 MW-th (CAGR=4%)
Pool Heating increased from roughly 14,500 to 22,500 MW-th (CAGR=5%)
Source: Based on a chart in the SEIA 2009 Supplemental Charts
17Cost Comparison of Energy Sources: Solar is Becoming
Increasingly Competitive With Other Sources
Solar is increasingly competitive with traditional generation technologies
Almost always less expensive than new peaking plants
Increasingly less expensive than new baseload
Solar Range
Photovoltaic $87 $196 Lazard (2009)
Concentrated Solar Power $129 $206 Severance (2009)
Gas Peaking $197 $352
IGCC $97 $149
Nuclear $105 $140 $250 $300
Coal $71 $153
Gas Combined Cycle $57 $109
$0 $50 $100 $150 $200 $250 $300 $350 $400
Levelized Cost of Energy ($/MWh)
Source: SEIA 2009 Supplemental Charts 18Achieving Cost Parity With Grid Supplied Electricity
Module prices will resume their rapid decline in 2011, following steady to slightly
upward price movements in the first half of 2010. In 2011, difficult demand
conditions will force module prices down by a further 19 percent, reaching below
$1.40/W on average.
However, ASPs declines will begin to moderate in 2012 and 2013 as stronger
demand growth returns to the global market, supported by a class of secondary
markets.
Italy and Japan will be the first major PV markets to reach unsubsidized grid parity,
thanks to high retail electricity prices and established PV demand centers.
Projects in both countries will begin to achieve this milestone within the next
three years, with global grid parity following thereafter.
193. Photovoltaic (PV) Global Supply Chain & Production
Topics Covered In This Section
Photovoltaic Supply Chain Overview
Manufacturing of Supply Chain Components
Polysilicon ingot and wafer
Cell
Module
System integration, assembly and installation
20Photovoltaic Supply Chain (most common)
• Crystalline/multicrystalline (80-90% of market) (silicon is purified but lower grade than
for computers)
Raw Material • Thin-film (uses less than 1% of light absorbing material compared to traditional
method; cheaper, but less efficient; 0-20% of market and growing)
Ingot • Ingot casting
• Silicon wafers make up 40-50% of crystalline module cost
Wafer mfg • Doping: Create n-type and p-type wafers
• Screen printing
Solar Cell • Encapsulant
(semiconductor cells) • Top surface (usually glass) and bottom surface (weatherproof sheet)
• Aluminum frame and junction frame
Solar Module • String cells together into module
• Add Balance of System to modules (BoS manages power) – 20% of total cost
• Inverter (converts power from DC to AC) – 10% of total cost
Solar Panel • Blocking diode, charge controller, circuit breaker, switch gear, wiring
• Battery (optional)
Installation • Construction and/or installation (20%)
21Photovoltaic Supply Chain Illustration
Source: Hemlock Semiconductor
22The Supply of Polysilicon Wafers is a Critical Driver of Cost &
Quality in the Photovoltaic Industry
Polysilicon wafers are a major PV cost component
40-50% of the finished module, (module is 50-60% of installed cost)
Producing solar-grade polysilicon is complex and capital intensive
- Minimum purity: 6N or 99.999999%
Maintaining polysilicon quality is critical
- Even small decreases in PV efficiency resulting from using lower quality polysilicon can offset
the cost savings gained from using the lower quality polysilicon
The 2005 polysilicon shortage was due to lack of capacity for purifying silicon to 6N
Initially, the PV industry relied on leftover polysilicon from the electronics industry
However, PV demand surpassed electronics in 2007 and is now the primary driver of growth in
polysilicon production
Shortage in 2005 (created by PV demand) drove up prices and resulted in significant investment in
polysilicon production facilities
Cell and module manufacturers who could not secure long term contracts paid substantially higher
prices
But now, because of over-investment, polysilicon prices have been driven down
2010: 72 million metric tons (MT) of demand vs. 122 million MT of supply
From roughly $2/watt in 2008 to less than 50 cents/watt in 2010
Sources: Solarbuzz.com, NREL 2008 report (published 2010) and Motech/AE Polysilicon
23Polysilicon Ingot & Wafer Production is Generally Located Near
Cell Plants To Ensure Uninterrupted Supply
Crystal growing and casting plants are best sited where there is an abundant
source of reliable, cheap energy to power the high temperature operations 1
They do not need to be sited close to solar cell plants because wafer transportation
is cheap, but most are because the investment has been by PV manufacturers to
secure wafer supply to their cell plants 2
In 2008, the US was the largest producer of polysilicon (43%) 3
But the market is changing quickly now: 4
Established producers expanded capacities
Newcomers , especially from China, have moved into this market (primarily to
vertically integrate their PV cell mfg)
1 Solarbuzz.com
2 Solarbuzz.com
3 NREL 2008 Solar Technologies Market Report (released 1/2010)
4 NREL 2008 Solar Technologies Market Report (released 1/2010)
24Polysilicon Wafer Manufacturers – Market Leaders1
Company Capacity Data Points Location
Hemlock Semiconductor 36kt (2010) US (all?)
25kt (2010)
Wacker Chemie "2nd largest hyperpure polycrystalline German company (+ US location)
silicon manufacturer”
18kt (2010) Hong Kong Company
GCL-Poly
New leader (manufacturers in China)
17kt as of 6/2010; expected to be 27k as of
OCI 12/2010 and 32k as of 10/2011 . South Korea
New leader
Renewable Energy Corp
17kt (2010) Norway
ASA (REC)
US Company (mfg in Korea, Taiwan,
MEMC Electronic Materials 8kt (2010) Malaysia, Italy, Japan, Texas [2],
Missouri)
Tokuyama 8kt (2010) Japan
1 NREL 2008 Solar Technologies Market Report (released 1/2010)
Sources: SEIA, NREL, solar.calfinder.com, wikipedia 25Solar PV Casting & Wafering Process
Source: MEME.com 26Solar Cell Manufacturing Process
Process Steps:
Wafers are doped (create n-type and p-type
wafers)
Sandwich each type together
Apply contacts on both sides (screen printed,
or other methods)
Add an external pathway connecting both
sides so the electrons can flow
Apply an anti-reflective coating
Source: www.azsolarcenter.org
27Solar Cell Manufacturing Plants are Capital Intensive, thus
Companies Generally Supply Global Markets From One Location
Solar cell plants are complex and large
Typically 10-50MW capacity and over 50,000 sq ft of plant area
A rule of thumb guide to the capital investment in building a solar cell plant is
US$1M/MW for crystalline silicon and US$2M/MW or more for thin films.
Because this is a highly capital intensive part of the manufacturing chain, most
manufacturers seek to centralize this activity at few locations.
Thus solar cell production will typically service international markets from a single
facility.
Crystalline-Si cell plants, based on well-proven technology, can be operational within
1 1/2 to 2 years of project approval and could be running at full capacity after another
year.
At a fully operational 50 MW Plant, around 300 jobs might be created, including
operational, warehousing, fabrication and overhead administration.
- The actual number will be dependent on the chosen technology and degree of automation.
Source: Solarbuzz.com
28Global Solar Cell Production by Region
Global Cell Production by Region, 2009 (MW-dc)
Region 2007 2008 2009
North America 269 401 595
Europe 1,067 1,985 1,930
China/Taiwan 1,251 2,785 5,191
Japan 938 1,268 1,503
ROW 223 610 1,436
Total 3,746 7,049 10,655
Source: GreenTechMedia Research 2009 Global PV Cell and Module Production Analysis, May 2010
29Top 10 Global Solar Cell Producers
Table 10: Top 15 Cell Producers, 2009 (MW-dc)
Rank Company 2009 Cell Production (MW-dc)
1 First Solar 1011
2 Suntech Power 704
3 Sharp 595
4 Q-Cells 537
5 Yingli Green Energy 525
6 JA Solar 509
7 Kyocera 400
8 Trina Solar 399
9 Sunpower 398
10 Gintech 368
11 Motech 360
12 Canadian Solar 326
13 Ningbo Solar Electric 260
14 Sanyo 260
15 E-Ton Solar 225
Source: GreenTechMedia Research 2009 Global PV Cell and Module Production Analysis, May 2010
30Solar Cell Producers by Region
Table 5: North American Cell Production, 2009 (MW-dc)
Company 2007 2008 2009 08 to 09 Growth Capacity YE09 Capacity YE10
First Solar 120.0 147.0 147.0 0.0% 160.0 214.0
United Solar 47.0 112.0 120.0 7.1% 150.0 150.0
Solarworld USA 35.0 33.0 71.8 117.4% 250.0 375.0
Evergreen Solar 16.4 26.5 104.6 294.7% 160.0 160.0
Solyndra 0.0 1.6 30.0 1775.0% 70.0 110.0
Other 50.7 81.0 121.6 50.2% 542.5 879.0
Total 269.1 401.1 595.0 48.3% 1,332.5 1,888.0
w/o First Solar 149.1 254.1 448.0 76.3% 1,172.5 1,674.0
Table 6: Japanese Cell Production, 2009 (MW-dc)*
Company 2007 2008 2009 08 to 09 Growth Capacity YE09 Capacity YE10
Sharp 363.0 473.0 595.0 25.8% 710.0 870.0
Kyocera 207.0 290.0 400.0 37.9% 400.0 700.0
Sanyo 165.0 215.0 260.0 20.9% 345.0 570.0
Mitsubishi Electric 121.0 148.0 120.0 -18.9% 220.0 400.0
Kaneka 42.5 52.0 40.0 -23.1% 70.0 150.0
Mitsubishi HEL 16.0 40.0 30.0 -25.0% 68.0 120.0
Other 23.0 50.0 58.0 16.0% 147.5 187.5
Total 937.5 1,268.0 1,503.0 18.5% 1,960.5 2,997.5
* Most data for Japanese producers was generously provided courtesy of RTS Corporation in Japan.
Table 7: European Cell Production, 2009 (MW-dc)
Company 2007 2008 2009 08 to 09 Growth Capacity YE09 Capacity YE10
Q-Cells (DE) 389.2 570.4 462.0 -19.0% 500.0 500.0
First Solar (DE) 87.0 196.0 196.0 0.0% 214.0 214.0
Solarworld (DE) 95.0 160.0 122.2 -23.6% 200.0 250.0
Bosch Solar/Ersol (DE) 53.0 143.0 200.0 39.9% 380.0 470.0
Schott Solar (DE) 67.0 119.0 102.0 -14.3% 170.0 170.0
REC Scancell (NW) 46.0 132.0 134.0 1.5% 180.0 180.0
Isofoton (ES) 85.0 130.0 70.0 -46.2% 140.0 140.0
Sovello (DE) 49.8 94.1 66.6 -29.2% 180.0 180.0
Solland (NE) 37.0 52.0 80.0 53.8% 170.0 170.0
Sunways (DE) 36.0 33.0 64.8 96.4% 116.0 116.0
Photovoltech (BE) 29.1 48.4 54.0 11.6% 80.0 155.0
Other 92.4 306.9 378.3 23.3% 1,214.0 1,468.0
Total 1,066.5 1,984.8 1,930.0 -2.8% 3,544.0 4,013.0
Source: GreenTechMedia Research 2009 Global PV Cell and Module Production Analysis, May 2010 31Solar Cell Producers by Region (continued)
Table 8: China/Taiwan Cell Production, 2009 (MW-dc)
08 to 09
Company 2007 2008 2009 Capacity YE09 Capacity YE10
Growth
Suntech (CH) 327.0 497.5 704.0 41.5% 1,000.0 1,400.0
Motech (TW) 176.0 275.0 360.0 30.9% 600.0 800.0
Yingli Green Energy (CH) 142.5 281.5 525.0 86.5% 600.0 1,000.0
JA Solar (CH) 113.2 277.0 509.0 83.8% 875.0 1,100.0
Trina Solar (CH) 37.0 210.0 399.0 90.0% 600.0 900.0
Gintech (TW) 55.0 180.0 368.0 104.4% 640.0 750.0
Solarfun (CH) 88.0 172.8 220.0 27.3% 360.0 480.0
Canadian Solar (CH) 7.5 71.6 326.0 355.3% 420.0 700.0
China Sunergy (CH) 80.3 111.0 160.1 44.2% 320.0 352.0
Neo Solar (TW) 36.0 102.0 200.0 96.1% 240.0 600.0
E-TON (TW) 60.0 95.0 225.0 136.8% 320.0 500.0
DelSolar (TW) 45.0 83.0 88.8 7.0% 180.0 360.0
Ningbo (CH) 7.5 80.0 260.0 225.0% 350.0 500.0
Other 75.5 348.9 846.1 142.5% 2,262.0 3,597.5
Total 1,250.5 2,785.3 5,191.0 86.4% 8,767.0 13,039.5
Table 9: Rest of World Cell Production (MW-dc)
08 to 09
Company 2007 2008 2009 Capacity YE09 Capacity YE10
Growth
First Solar (ML) 0.0 161.0 668.0 314.9% 854.0 854.0
SunPower (PH) 100.1 236.9 398.0 68.0% 574.0 654.0
Q-Cells (ML) 0.0 0.0 75.0 NA 300.0 600.0
Other 122.6 212.4 294.7 38.8% 944.0 1,515.5
Total 222.7 610.3 1,435.7 135.3% 2,672.0 3,623.5
Source: GreenTechMedia Research 2009 Global PV Cell and Module Production Analysis, May 2010
32Solar PV Module Manufacturing Process
Solar cells are interconnected in a
matrix to form a module
Solar module assembly involves:
Soldering cells together to produce a
36 cell string (or longer)
Laminating it between toughened
glass on the top and a polymeric
backing sheet on the rear.
Frames are usually applied to allow
for mounting in the field, or the
laminates may be separately
integrated into a mounting system
for a specific application such as
building integration.
Sources: Solarbuzz.com, Dowcorning.com
33Solar PV Module Manufacturing
The assembly of crystalline Si solar modules is most commonly carried out in the
cell plant, but can be done in smaller plants closer to the end market.
This can be preferable because while solar cells are relatively inexpensive to transport,
modules with a glass front sheet and an aluminum frame are heavy and bulky.
The capital cost of translating the solar cell into a laminated solar module is low, so
the economics of smaller capacity plants can be justified.
Economies of scale can be captured with an annual capacity of 5 MW or greater
Capital cost for equipment will be around US$0.5M for this scale of plant, but the all up
cost will be up to $5M.
Number of jobs created is dependent on the level of automation utilized, but
typically would be in the 30-100 range.
From the point that the site location has been acquired, module assembly plants can be
operational in 6-9 months.
If a new building is required: 12-18 months.
Module production is labor intensive, benefitting low-cost labor countries.
Source: Solarbuzz.com
34Solar PV Module Production by Region
Global Module Production by Region, 2009 (MW-dc)
Region 2007 2008 2009
North America 327 540 777
Europe 1,022 1,808 1,892
China/Taiwan 1,019 2,165 3,580
Japan 674 929 934
ROW 291 901 1,758
Total 3,334 6,344 8,941
Source: GreenTechMedia Research 2009 Global PV Cell and Module Production Analysis, May 2010
35Solar PV Modules – Top 15 Producers
Table 11: Top 15 Module Producers, 2009 (MW-dc)
Rank Company 2009 Module Production (MW-dc)
1 First Solar 1011
2 Suntech Power 704
3 Sharp 595
4 Yingli Green Energy 525
5 Kyocera 400
6 Trina Solar 399
7 Sunpower 398
8 Canadian Solar 326
9 Solarfun 313
10 SolarWorld 288
11 Sanyo 260
12 Ningbo Solar Electric 201
13 Schott Solar 167
14 Changzhou Eging 150
15 Aleo Solar 139
Source: GreenTechMedia Research 2009 Global PV Cell and Module Production Analysis, May 2010
36PV System Integration, Assembly & Installation
The final part of the overall manufacturing process is the solar system
assembly and installation – this has two aspects:
Mechanical integration of the solar module into its chosen array structure
- Array structure will depend on the final location
Electrical integration of the solar module with rest of system
- Includes inverters, batteries, wiring, disconnects, and regulators (charge
controllers).
- Requires matching equipment to the electrical load required by the customer
This part of the manufacturing process is the least capital intensive and can
be located on small premises, or even be undertaken at the customers site:
Sales companies ("Integrators", "Dealers" or "Installers") perform this task
Relatively labor intensive and is an important component of job creation
within the industry
Source: Solarbuzz.com
374. Trends in PV Production, Supply & Demand
Topics Covered in This Section
Historical Background
Global Supply and Demand
US Production Facilities
US Incentives and Market Potential
The Emergence of China
US Strength in Thin Film
Trade Patterns
38Trends in Global PV Production – Historical Overview: The US
Lost Market Leadership in PV after 1999
US led in PV shipments before 1999, but lost market leadership over the
subsequent decade – first to Japan and then to Europe (primarily Germany), and
finally to China/Taiwan which shipped 46% of total product in 2009:
Japan – market surge resulted largely from the Japanese residential subsidy
program
Europe – demand resulted largely from the German feed-in tariff and similar
policies adopted by other European countries
China and Taiwan – in 2009 they surged to dominance primarily due to price
leadership
All the above had strong production growth rates in the past decade, but market
share for Japan, Europe and US dropped due to the emergence of China and
Taiwan
Source: Solar Vision Study Draft (May 2010)
39Global PV Supply & Demand (Cell & Module Shipments): 86% of
Demand is in Europe, Much of it Supplied From Asia
Global PV Supply and Demand (% of Annual Shipments MW)
2%
6%
38% China and Taiwan*
61%
53% Germany*
86%
Rest of World
16%
Japan
Europe
US
18%
6%
Source: Solar Vision Study Draft (May 2010)
5%
*SEIA 2009
SUPPLY DEMAND 40Demand Globally is Driven By Subsidies & Feed-In-Tariff
“Germany has the same solar insolation as the US state of Alaska. Yet Germany is the global
leader in solar installations. Why is that? Three words – policy, policy, policy.”1
“Over the first half of 2010, most module shipments will be sent to Germany, which will run at
full capacity.” In the second half, German demand will fall due to feed-in tariff cuts in the
second half of the year.
“Italian demand will spike to 1,487 MW in 2010, maintaining its position as the second- largest
national market. Italian demand will be spurred by forthcoming feed-in-tariff reductions in
2011.”
“2010 will mark the beginning of a global diffusion of demand: Whereas the past few years
have been characterized by a single “savior” country essentially keeping the global market
afloat, 2010 will mark the beginning of a global diffusion of demand across a class of growing
markets.”
“Although Germany will retain its position atop national markets, its fall from grace beginning
in the second half of 2010 will leave suppliers seeking the next “gold rush.” But no other
market has all the necessary characteristics to ramp up in volume and with sufficient pace to
serve as a singular replacement for German demand. Instead, demand will become increasingly
spread out amongst markets and the boom/bust cycle will begin to dissipate.”
1 GreenTechMedia, 7/26/2010: Update! 14 PowerPoint Slides That Shook the Earth
Source: GreenTechMedia Research, Global PV Demand Analysis and Forecast: Executive Summary, May 2010
41US PV Supply Chain: In 2009 There Were 49 PV Facilities in 22
States in Operation or Under Construction in the US
Federal and state incentives have been encouraging manufacturers to expand PV production
in the US
US facilities produce crystalline silicon, CPV*, and thin film** technologies as well as
polysilicon material (for use in crystalline silicon PV)
In 2008:
Cell production was about 400 MW (6% of global production)
Module production was about 500 MW (9% of global production)
Polysilicon production was about 26,000 MT (41% of global production)
The US was a leader in polysilicon production in 2008, but this is probably no longer the case:
Chinese PV cell and module manufacturers have invested in polysilicon facilities to lock up supply
In 2009 and 2010 module production has begun to move offshore to low labor cost countries
* Concentrator PV uses reflectors to focus light on small, high-efficient PV cells; high production cost and higher efficiency
rates. New and growing technology, ed by Spain. Utility scale CPV would compete with CSP. (source: 2009 Tapsolar-
Technology Action Plan- Solar Energy)
** a-Si (amorphous silicon), CdTe (cadmium telluride), CIGS (copper indium gallium diselenide), and OPV (organic PV)
Sources: Solar Vision Study Draft (05/28/2010)- DOE/SEIA/SEPA, citing Mehta 2009, Bartlett et al. 2009
42Incentives Exist To Stimulate PV Demand
There are Federal incentives for PV on the roof (without which PV is not
economical)
In some places there are local incentives as well:
The President of SEIA stated that he received $17K from the state of Maryland,
plus a $2K tax credit
The price of the PV system was $35K, with a net addition to his mortgage of $60-
70/month
But electricity savings were $100 per month, therefore PV is a net savings to him
from day one
At least one utility company is putting PV on customer roofs, where they own the
equipment and the electricity goes back to the grid:
The customer pays their normal electric bill, the company pays you a fee for
“leasing” roof space (Duke Electric)
43PV – US Market Potential
Despite a long history of public and private investments in PV technology, the US
continues to be a relatively immature PV market
In 2008, the US accounted for:
8% or about 440 megawatts (MW) of PV global market demand
7% or about 385 MW of global market supply
The technical potential of the US PV market is substantial:
The land area required to supply all end-use electricity in the US using PV is only
about 0.6% of the country's total land area or about 22% of the “urban area”
footprint
Source: Solar Vision Study Draft (May 2010)
44China’s PV Industry Has Predominantly Supplied Export Markets,
but the Government is Now Stimulating Domestic Demand
“One constant in what many have called “the miracle” of China’s enormous economic growth
over the past 30 years has been a reliance on export economies. The development of the PV
industry has been no exception.”
“Since the industry’s modest beginnings in 2002, domestic cell and module manufacturers have
exported more than 95 percent of their products to overseas markets – relying on the favorable
energy policies of European governments to drive demand for Chinese production. As China
has rapidly vaulted to the top of global solar cell manufacturing capacity, it has done so largely
due to unprecedented demand from countries like Germany, Spain, Italy, and the United
States, among others.”
“As 2008 drew to a close and the realities of one of worst global economic crises since the Great
Depression began to crystallize, domestic Chinese manufacturers in many industries scaled
back production, laid off workers, and some even stopped operations completely. It was in this
context that the Chinese government, recognizing the need to support this critical growth
industry with domestic demand, began to seriously consider national solar incentives. With
many other markets stalling due to a lack of financing and uncertain policy regimes, China will
likely be one of the key growth markets for the solar sector in both the near- and long-term.”
Source: CHINA PV MARKET DEVELOPMENT, Executive Report, Green Tech Media, Sept 2009
45China is Rapidly Expanding its Module Production Capacity
2010 Module Capacity Expansions, Chinese Producers
1,600
1,400 YE 2009
1,400
YE 2010
1,200
1,000 1,000 1,000 1,000
1,000 900 900
820
MW
800
600 600 600
600 550
500
375
400 300
250
200 150 135
100
0
0
Source: GreenTech Media: 2011 Shakeout (July 28, 2010) 46China is Gaining Market Share in PV Modules, as Illustrated By
Data from the California Solar Initiative
CA Solar Initiative Commercial Applications Using Chinese Modules, Q209 – Q210
60
60%
60.0
56% 55.3
60%
52%
5050%
50.0
46%
50%
Application Capacity (MW)
40
40%
40.0
36.0
40%
Market Share (%)
3030%
30.0 28.0 30%
20%
2020%
20.0 20%
14%
1010%
10.0 10%
3.8 4.2
00%
0.0 0%
Q2 2009
Q2 2009 Q3Q3 2009
2009 Q4 2009
Q4 2009 Q1 2010
Q1 2010 Q1 2010
Q2 2010
Source: GreenTech Media: 2011 Shakeout (July 28, 2010)
47The US Has Dominated Global Thin Film Production, While
Other Producers Focus on Crystalline…
The US was responsible for 19% of global thin film shipments in 2009 1
Top Global PV OEMs – 2008
Name Country Production (GW) % Production Location Technology
Q-Cells German .57 8% Germany (plans to expand) Crystalline + thin film
US (0.15), Germany (0.20),
First Solar US .50 7% Thin film
Malaysia (0.16)
Suntech Power China .50 7% China Crystalline silicon
Sharp Japan .47 6% Most- Crystalline silicon
Taiwan (plans to expand to
Motech Taiwan .38 5% Crystalline silicon
China & US)
Kyocera Japan .29 4%
2010- now has 1/3 of
Yingli China .28 4% Crystalline silicon
California PV market
JA Solar China .28 4% Crystalline silicon
SunPower China .24 3%
Sanyo Japan .21 3%
1 Solar Vision Study Draft (May2010) 48
Source for table: 2008 NREL (2010) p 17-183…Many of the Top US Producers Make Thin Film…
Largest US OEMs (based on US Production) in 2008
Name US Production (MW) % HQ Comments
First Solar 147 36% US Thin film (CdTe)
Aka United Solar Ovonics
Uni-Solar 113 27% US
a-SI thin-film
Solarworld Largest production site for solar modules
61 15% Germany
(Shell Solar) in US (source: solarworld-usa.com)
closed US production 3/2010 to move to
BP Solar 28 7% US
Asia
Evergreen
27 6% US String-ribbon technology
Solar
Schott Solar 11 3% Germany 70MW produced in Germany
Global Solar 7 2% US flexible, thin-film, CIGS-based cells
Other 16 4%
•Production source: 2008 NREL (2010) p. 19
49…Unfortunately, the US’s Dominance in the Thin Film Segment
May Not Be Sustainable
Some believe the Major US thin film player – First Solar – is rumored to be in
trouble
While thin film pioneers like Applied Materials and Signet have already “expired on
the battlefield”
Japanese solar giant Sharp, Enel, the largest power company in Italy, and
STMicroelectronics, the leading European semiconductor supplier have declared
their entry into the market
Source: GreenTechMedia
50US PV Trade Patterns: The US Had a Positive Trade Balance in PV Up
Until 2005, When the Spike in US Demand Forced Greater Imports
In 2005, imports caught up to imports, and since 2006 imports exceed exports
Exports of thin-film doubled each year from 2005-07 (dominating 2007 PV exports)
Exports of Crystalline PV stayed flat
But the spike in US PV demand forced greater imports:
Demand was in to response to federal investment tax credit for PV systems,
including the Energy Policy Act of 2005.
US production and exports nearly doubled – but imports more than doubled
Peak kW(000) Calculation 2007 2008 % Increase
US Shipments a 518 987 191%
-Exports b 237 462 195%
-Domestic Shipments c= a-b 280 524 187%
Imports d 238 587 246%
US Consumption c+d 518 1111 214%
Source (bullets) 2008 NREL (2010), p27
Source (table) US Energy Information Administration 51US Import & Export Data Detail Confirms the US Traditional
Strength in Thin Film & Trade Deficit in Crystalline Silicon
The US is a net exporter of thin film modules…
…and is a net importer of crystalline silicon modules and cells
Importing predominantly modules, rather than cells
US Export-Import Data 2008
(Shipments of Peak kW (000)
204
Thin film silicon 31
173 Exports
Imports
Trade Balance
241
Crystalline silicon 555
-314
-400 -200 0 200 400 600
Source: US Energy Information Administration
52US Import & Export Supporting Detail
IMPORT EXPORT
Shipments Peak kW (000) 2007 2008 % incr Shipments Peak kW (000) 2007 2008 % incr
Cells Cells
Crystalline Silicon 64.76 136.74 111% Crystalline Silicon 16.59 36.42 119%
Thin film Silicon - 0.01 Thin film Silicon 1.50 0.61
Concentrator Silicon 0.10 - Concentrator Silicon 3.75 15.97
Other - - Other - -
Total 64.85 136.75 111% Total 21.85 52.99 143%
Modules Modules
Crystalline Silicon 149.70 418.25 179% Crystalline Silicon 66.79 204.47 206%
Thin film Silicon 23.47 30.66 31% Thin film Silicon 148.48 203.39 37%
Concentrator Silicon - 0.90 Concentrator Silicon 0.10 1.40
Other - - Other - -
Total 173.17 449.81 160% Total 215.36 409.26 90%
Total Total
Crystalline Silicon 214.46 554.99 159% Crystalline Silicon 83.38 240.89 189%
Thin film Silicon 23.47 30.67 31% Thin film Silicon 149.98 204.00 36%
Concentrator Silicon 0.10 0.90 847% Concentrator Silicon 3.85 17.37 351%
Other - - Other - -
Total 238.02 586.56 146% Total 237.21 462.25 95%
Source: US Energy Information Administration
53US PV Imports Have Dramatically Increased From Low Cost
Countries: Philippines, China & Taiwan
US PV Imports (peak kW 000)
Surprisingly, in 2008, Philippines
Country 2007 2008 % Increase topped the list:
Philippines 0 150 41134% Almost equal to Japan
Japan 103 146 42%
China believed to have taken lead
China 59 133 124% in 2009
Germany 41 59 42%
Taiwan 1 45 7600%
Mexico 24 43 81%
Hong Kong 3 6 81%
Spain - 4
India 5 1 -78%
Canada 1 -
UK 0 -
TOTAL 238 587 146%
Source: US Energy Information Administration
54US PV Exports Primarily Supply Demand in Europe
US PV Exports 2007-2008
Shipments peak kW 2007 2008 % increase 2008 % total
Germany 152,654 198,230 30% 42.88
Spain 31,384 105,555 236% 22.84
Italy 10,364 49,830 381% 10.78
France 10,228 31,196 205% 6.75
These 4 countries account for more than 80% of export shipments
Source: US Energy Information Administration
555. Concentrated Solar Power (CSP)
Topics Covered in This Section
Overview
Supply Chain and Manufacturers
Market Potential
56CSP Example
57CSP US Overview: CSP Capacity is Considerably Smaller Than
PV, but 95% of CSP Global Capacity is in the US
CSP plants have been in continuous operation in the US since 1982
As shown on page 14, the US increased its CSP Capacity from 1985-1991, but since
little new CSP has come online
However, a large amount of capacity is now under development (page 15)
As of 2009, 433 MW CSP capacity (cumulative):
- Vs. 1248 MW of PV (grid-tied)
95% of global CSP capacity was in the US in 2008:
US share declined to roughly 72% in 2009
But the US has over 10,600 MW of capacity in the pipeline
Several types of CSP technology:
Parabolic trough currently makes up 96% of US capacity
- But represents 56% of capacity in the pipeline
» Tower is 21%
» Dish-Engine is 21%
Source: SEIA 2009 Supplemental Charts
58CSP US Manufacturing
Manufacturing Companies – CSP Components
Altogether, there were 18 CSP Company State Component CSP Technology*
manufacturing facilities in 14 Stirling Energy Systems AZ Dishes Dish
states in operation or under Infinia Corp WA Dishes Dish
construction during 2009. Austra NV Reflectors and Receivers Linear Fresnel
Sopogy HI Reflectors and Receivers Micro CSP
CSP components—many of Rocketdyne CA Heliostats and Salt Systems Tower
which cut across technologies— Dow Chemical MI Heat Transfer Fluid Trough
Solutia MO Heat Transfer Fluid Trough
include mirrors, reflectors,
Schott Solar NM Receiver Tubes Trough
collector structures, heat- Reflectors and Tracking
transfer fluids and salts, SkyFuel/ReflecTec CO Trough
Controls
turbines, and controls. Schuff Steel AZ Collector Structures
Gossamer Space
However, the expectation of CA Collector Structures
Frames
strong CSP installation growth Helec WA Drives
has resulted in CSP component SQM N.Am GA Heat Transfer Salt
production facilities being Coastal Chemial TX Heat Transfer Salt
established by specialized Flabeg Solar CT Reflectors
manufacturers and large 3M MN Reflectors
industrial conglomerates Flabeg Solar PA Reflectors
PPG Industries PA Reflectors
*If blank- component cuts across technologies
Source: Solar Vision Study Draft (5/28/2010)-DOE/SEIA/SEPA
59CSP Manufacturers By Component
REFLECTORS RECEIVERS TURBINES
Market Leader: Market Leader: Market Leaders:
•FLABEG •SOLEL •ABB
•GE-THERMODYN
Increased Durability: Others: •SIEMENS
•PPG •SCHOTT SOLAR
•RIOGLASS SYSTEMS Others:
•ALSTOM
Low Cost: •MAN TURBO
•3M •ORMAT
•ALANOD
•REFLECTECH
Source: 2008 NREL (2010)
60CSP Has Considerable Technical Potential For the US, Since the
Southwest Has Some of the Best Locations For CSP Capacity
According to the Solar Vision Study Draft, the technical potential of the US CSP
market is about 7,500 GW of potential generating capacity:
Which exceeds the total US electric grid capacity (about 1,100 GW) by a factor of
more than six
And exceeds US electricity demand (about 224 million GWh) by a factor of more
than four (EIA 2009; EIA 2010c)
This potential resides in 7 Southwestern states because CSP can exploit only direct
normal insolation, i.e.; light that can be focused effectively by mirrors or lenses:
Globally, the most suitable sites for CSP plants are arid lands within 35° north and
south of the equator
The US has some of the best solar resources in the world in the following states
- Arizona, California, Colorado, Nevada, New Mexico, Texas, and Utah
Source: Solar Vision Study Draft (May 2010)
616. Solar Heating & Cooling (SHC)
Topics Covered in This Section
Overview
Global Capacity
Market Potential
Demand Incentives
Manufacturing
62US Solar Heating & Cooling (SHC) Overview: 90% of US
Installed Capacity is Pool Heating
Of the 147 GW-thermal of installed global SHC capacity (in 2007), US accounted for
8 GW-th or 5%
Solar pool heating accounts for more than 90% of capacity
Solar Water Heating (SWH) market is less than 10%
Other SHC technologies – such as solar space heating and cooling and industrial
process heat – are still relatively uncommon in the US
SHC systems are concentrated in certain a few states:
Hawaii is the leading SWH market
Florida and California are the leading solar pool heating markets.
Source: Solar Vision Study Draft (5/2010)-DOE/SEIA/SEPA
63Solar Heating & Cooling – Global Capacity: Globally, Installed
Capacity is Primarily For Water Heating
By the end of 2007, global cumulative installed SHC capacity was about 147 GW-
thermal in 49 surveyed countries:
Representing an estimated 60% of the world population and 85%–90% of the
world SHC market
The 147 GW-th is comprised of:
46 GW – glazed flat-plate collectors (primarily for water heating)
74 GW – evacuated tube collectors (primarily for water heating)
25 GW – unglazed collectors (unglazed plastic collectors typically for pool
heating)
1.2 7GW – glazed and unglazed air collectors
China is the leader in total installed SHC capacity:
The US is a distant second because of the large domestic capacity in solar pool
heaters
The EU leads in space heating and process heating applications
Source: Solar Vision Study Draft (May 2010)
64Solar Heating & Cooling Has Considerable Potential For Growth
The International Energy Agency (IEA) recently referred to renewable energy
heating and cooling (including solar thermal, biomass, and geothermal) for use in
domestic hot water, space heating and cooling, and process heating and cooling as
the 'sleeping giant' of renewable energy potential
On-site energy use for industrial purposes represents 31% of US energy use1, and
86% of this energy is thermal
One study found that SHC could:
Reduce US electricity use by 1.2% (with higher potential in specific regions, such
as up to 4% in Florida)
Reduce natural gas use by 2.1% (with higher potential in specific regions, such as
up to 4.7%, in California)
SHC systems use both direct and indirect (diffuse) solar resources, therefore, can
be sited almost anywhere in the US
1Source- EIA, cited by the Solar Vision Study Draft
Source: Solar Vision Study Draft (May 2010)
65Solar Heating & Cooling Has Considerable Potential For Growth
(continued)
Solar Water Heating:
Roughly 110 million residential housing units have water heaters (EIA 2005)
15% of energy consumed by residential and commercial buildings is for water
heating
Solar Pool Heating:
Nearly 300,000 non-residential pools at hotels, schools, gyms, and physical
therapy centers need year-round heating
Current law prohibits these facilities from taking advantage of the federal ITC
Space Heating and Cooling:
“While solar cooling technologies have yet to take off in the US, the potential is
enormous.” 45% of energy consumed by residential and commercial buildings is
for space heating and cooling, a huge opportunity for solar energy over the next
few years.” -SEIA 2009
Sources: Solar Vision Study Draft (5/2010)- DOE/SEIA/SEPA, SEIA 2009
66Solar Heating & Cooling – Demand Incentives
A significant US market for residential Solar Water Heating (SWH) existed in the
’70-’80s in response to the energy crises and a 40% federal tax credit:
This market disappeared with the end of federal incentives in the mid ’80s
The market was revived with federal solar incentives (tax credits) enacted in 2006–
2009:
This revival has created interest for other thermal applications as well
And the federal tax credits have also increased interest in SHC at the state level:
Some states have created SHC incentives, primarily for SWH but also for space
heating, process heating, and (in a very small number of states) space cooling
Solar pool heating has declined in the past few years because of declining real
estate markets:
Few government incentives apply to solar pool heating
However, because it is relatively cost effective compared with fossil fuels, pool
heating does not appear to be affected significantly by the absence of incentives
Source: Solar Vision Study Draft (May 2010)
67US SHC Manufacturing
In 2009, there were 9 glazed flat plate collector and absorber facilities in 7 states in
operation
Production in 2008 exceeded 150,000 m2 and accounted for 75% of the total
quantity of flat plate and evacuated tube collectors installed in the US
Manufacturers of SHC Products
Company State Products m2 (2008)
Sunearth CA flat plate collectors, OEM products & absorbers 66,000
AET FL flat plate collectors, OEM products & absorbers 53,450
Solar Skies MN flat plate collectors, OEM products & absorbers 6,800
Solarroofs CA flat plate collectors, OEM products 2,400
Dawn Solar NH own brand flat plate collectors & absorbers N/A
Sunsiaray MI own brand flat plate collectors & absorbers N/A
Heliodyne CA own brand flat plate collectors & absorbers 20,000
Power Partners GA own-brand flat plate collectors N/A
Bubbling Springs WI own-brand flat plate collectors 959
Source: Solar Vision Study Draft (May 2010)
687. Solar Industry Employment
Topics Covered in This Section
Employment Job Categories and Definitions
Current US Employment
Forecast US Employment
Current Global Employment
Jobs Per MW by Energy Source, Solar Technology and Application
Photovoltaic Labor Intensity
69Employment Estimates Include Three Job Categories: Direct,
Indirect & Induced
Definitions differ among reporting organizations
DIRECT and INDIRECT are jobs in the solar supply chain, including raw material
suppliers, cell and module manufacturing, installation and operations and
maintenance:
The line between DIRECT (solar companies) and INDIRECT (solar suppliers) is not
universally agreed upon
But, both represent the jobs that make up the solar supply chain
INDUCED is the economic activity that is not part of the solar supply chain, but is
driven by the money spent by solar industry employees:
Induced as percent of direct and indirect
- 72%: SEIA
- 33-100%: Center or American Progress; Political Economy Research Institute
- 87%: Navigant Consulting
70Employment Estimates Include Three Job Categories: Direct,
Indirect & Induced (continued)
Induced Induced
EQT Manufacturers, Logistics, Accountants Finance People: Estimators, Engineers, Project Managers
Raw Materials Cell Module Construction/Install O&M
Other Material & Supplies BoS Parts
Direct & Indirect
Induced Induced
71US Solar Employment Summary: Direct & Indirect Employment
is Approximately 60K
70
60.0
60
50
Employment (000)
46.0
40
36.0
total
33.0
ST
29.6
30 60
PV
2.6
23.1
46
3.1
20 17.9
16.6
1.9 36
1.6 33
12.5 27
2.5
10 20
16 15
10
0
ASES EIA ASES EIA PEW EIA SEIA SEIA SEIA
2006 2007 2008 2009 2010
ST = Solar Thermal (CSP + SHC) 72Navigant Consulting Forecasts 240K Direct & Indirect US Solar
Jobs in 2016 & 440K When Induced is Included
Type Solar Employment
Direct 110K
Indirect 130K
Induced 200K
Total 440K
Solar Direct+ Indirect Total
Technology
Employment Employment
PV 197K 377K
CSP 20K 38K
Solar Water Heating 13K 24K
Total 230K 440K
However, Navigant’s thorough methodology calculates the TOTAL labor required for
a given production level; it does not appear to adjust for FOREIGN-made content.
Source: Navigant Consulting (Economic Impacts of the Tax Credit Expiration; Prepared for the AWEA and SEREF;
2/13/2008, cited by NREL)
Assumed: nearly 6.5 GW of installed in 2008 and 28 GW of cumulative solar installations through 2016 in the
extended ITC scenario
73Forecast US Solar Employment – Additional Data Points are
Provided By Different Sources
Solar Thermal
Year Total Photovoltaic CSP SHC
(CSP+SHC)
2015 62K (CIM1 ; REPP)
2016 440K (NCI2) 377K (NCI) 62K (NCI) 38K (NCI) 24K (NCI)
(direct + indirect + induced)
2030 ~150K ~120K ~30K
(Greenpeace3) (Direct) (Greenpeace) (Greenpeace)
1REPP (Construction, Installation, Manufacturing only; based on 9600 MW total capacity)
2Navigant Consulting (Based on 28 GW installed capacity; includes CIM and O&M)
3Rutovitz, J., Atherton, A. 2009,Energy sector jobs to 2030: a global analysis. Prepared for Greenpeace
International by the Institute for Sustainable Futures, University of Technology, Sydney (Direct only; in this most
aggressive scenario, 51% of energy comes from RE). Assumes that all manufacturing occurs within North America,
and that the region exports just under 10% of globally traded [solar] components (p45). 5% of jobs are export jobs. 74Current Global Solar Employment: A Variety of Sources
Estimate Global PV as Approaching 200K
Direct & Indirect Employment
Solar Thermal
Year Total Photovoltaic CSP SHC
(CSP+SHC)
1
2007 170K (UNEP)
2
2008 169K (NEF) 4k (NEF)
2009 200K
3
(CleanEdge)
2010 190K
4
(Greenpeace , direct only)
1United Nations Environment Programme, 2008-PV jobs in 5 leading countries
2New Energy Finance, 2009, electricity-generating solar (PV and CSP)
3Clean Edge Research (Clean Tech Job Trends 2009)
4Rutovitz, J., Atherton, A. 2009,Energy sector jobs to 2030: a global analysis. Prepared for Greenpeace
International by the Institute for Sustainable Futures, University of Technology, Sydney. 75Most of Global PV Employment is in Construction/Installation &
Cell/Module Manufacturing
GLOBAL PV 2008
Direct & Indirect Employment
2,320
2,320 39% is local employment (site
7,540 construction & roof installation
plus development & services)
34,800
Manufacturing of wafers, cells,
devt&svces
and modules represents nearly
research 50% %
29,000
inverters
module mfr Operations is only 5% of the total,
20,300 cell mfr but this will increase as installed
silicon&wafers capacity increases
constr/install
operation
63,800
8,820 Source: New Energy Finance study (McCrone et al 2009), cited in NREL study
Total Jobs = 168,900 76Jobs Per Megawatt is Often Used as a Basis for Employment
Estimates in the Energy Sector
But jobs/MW rates generally calculate all labor required for an installation:
Therefore, labor is erroneously assumed to be entirely domestic
Varying definitions and assumptions result in a wide range of Jobs/MW rates:
Are “jobs” defined as FTE–years (i.e. normalized for duration) or are all jobs lumped together
regardless of duration?
Was the MW capacity used in the calculation “peak” or “average” (adjusted for efficiency or
utilization)?
Construction and Operations are typically included, but what about Manufacturing (particularly for
CSP)?
Be wary of combined construction/installation/manufacturing (CIM) and operations
and maintenance (O&M) job rates per MW:
Often are (incorrectly) added together, but a clearer picture emerges if the rates are separate
CIM jobs are one-time jobs, i.e. jobs associated with installation of capacity (before the plant is on-
line), often given as total FTEs for the duration of construction
- CIM Jobs are estimated by multiplying FTEs/MW by new installations for a given year (even though CIM takes
place over multiple years)
O&M jobs are on-going jobs that exist every year of operation from the date that the plant goes on
line , described often as “permanent” jobs
- O&M Jobs are estimated by multiplying FTEs/MW by new total existing capacity
CIM and O&M can only be added if they are on the same basis 77Jobs Per MW: Solar PV is Universally Recognized as Creating More
Jobs Per Unit of Energy Produced Than Any Other Energy Source
Average Direct Job Years Per GWH
1.6
1.4
1.2
1
0.8 0.87
0.6
0.4
0.2 0.25 0.23 0.17 0.14 0.11 0.11
0
Solar PV Geothermal CSP Wind Nuclear Coal Natural Gas
There are many comparisons of jobs per unit of energy – this one was chosen because it
appeared to be the most robust:
Only PV and CSP shows a range of average jobs years/GWh: For PV, this reflects a different mix of distributed versus
utility scale applications (according to the authors)
It includes direct CIM and O&M jobs averaged over the life of the equipment (plant)
And for Coal and Natural Gas, it includes Fuel Extraction and Processing per GWh
The unit of energy produced is measured in GW-hour, adjusted for capacity utilization (i.e. does not use peak output)
The authors aggregated a number of studies for each energy type
Source: Putting Renewables and Energy Efficiency to Work: How Many Jobs Can the Clean Energy
78
Industry Generate in the US?” 2010 (Berkeley)You can also read