Oxygen and sulfur mass-independent isotopic signatures in black crusts: the complementary negative 33S reservoir of sulfate aerosols?
←
→
Page content transcription
If your browser does not render page correctly, please read the page content below
Atmos. Chem. Phys., 20, 4255–4273, 2020
https://doi.org/10.5194/acp-20-4255-2020
© Author(s) 2020. This work is distributed under
the Creative Commons Attribution 4.0 License.

Oxygen and sulfur mass-independent isotopic signatures in black
crusts: the complementary negative 133S reservoir of
sulfate aerosols?
Isabelle Genot1,2 , David Au Yang1,3,4 , Erwan Martin2 , Pierre Cartigny1 , Erwann Legendre2,5 , and Marc De Rafelis6
1 Institut
         de physique du globe de Paris, Université de Paris, CNRS, 75005 Paris, France
2 Sorbonne Université, CNRS-INSU, Institut des Sciences de la Terre de Paris, IsteP UMR7193 Paris, France
3 GEOTOP/Université du Québec à Montréal, Montréal H3C 3P8, Canada
4 Department of Earth and Planetary Sciences, McGill University, Montréal, Canada
5 LATMOS, UVSQ, Université Paris Saclay, Sorbonne Université, CNRS, INSU, IPSL,

11 Boulevard d’Alembert, 78280, Guyancourt, France
6 Géosciences Environnement Toulouse (GET), Université Toulouse III – Paul Sabatier, CNRS UMR 5563,

IRD, 14 avenue Edouard Belin, 31400 Toulouse, France

Correspondence: Isabelle Genot (genot@ipgp.fr)

Received: 22 October 2019 – Discussion started: 28 October 2019
Revised: 21 February 2020 – Accepted: 4 March 2020 – Published: 9 April 2020

Abstract. To better understand the formation and the oxida-         tive 133 S reservoir of the sulfate aerosols, thus solving the
tion pathways leading to gypsum-forming “black crusts” and          atmospheric SO2 budget.
investigate their bearing on the whole atmospheric SO2 cy-
cle, we measured the oxygen (δ 17 O, δ 18 O, and 117 O) and
sulfur (δ 33 S, δ 34 S, δ 36 S, 133 S, and 136 S) isotopic compo-
                                                                    1   Introduction
sitions of black crust sulfates sampled on carbonate build-
ing stones along a NW–SE cross section in the Parisian              The oxidation of sulfur dioxide emitted into the atmosphere
basin. The δ 18 O and δ 34 S values, ranging between 7.5 ‰ and      (between 100 and 110 Tg(SO2 ) yr−1 ; Klimont et al., 2013)
16.7±0.5 ‰ (n = 27, 2σ ) and between −2.66 ‰ and 13.99±             can result in the formation of H2 SO4 that forms sulfate
0.20 ‰, respectively, show anthropogenic SO2 as the main            aerosols; having light-scattering properties that alter the ra-
sulfur source (from ∼ 2 % to 81 %, average ∼ 30 %) with             diative balance of the planet. Furthermore, they also modify
host-rock sulfates making the complement. This is supported         the microphysical properties of clouds through the number
by 117 O values (up to 2.6 ‰, on average ∼ 0.86 ‰), requir-         and size of cloud condensation nuclei (CCN; e.g., Weber et
ing > 60 % of atmospheric sulfates in black crusts. Negative        al., 2001). Although quantified with large uncertainties, the
133 S and 136 S values between −0.34 ‰ and 0.00 ± 0.01 ‰            formation of sulfate aerosols results in an Earth surface cool-
and between −0.76 ‰ and −0.22 ± 0.20 ‰, respectively,               ing (Forster et al., 2007), with a negative radiative forcing
were measured in black crust sulfates, which is typical of          from −0.62 to −0.21 W m−2 (on average ∼ −0.41 W m−2 ).
a magnetic isotope effect that would occur during the SO2           Overall, sulfate aerosols are the most efficient particles that
oxidation on the building stone, leading to 33 S depletion in       counterbalance the greenhouse effect (Stocker, 2014). Uncer-
black crust sulfates and subsequent 33 S enrichment in resid-       tainties regarding the formation of sulfate aerosols relate to
ual SO2 . Except for a few samples, sulfate aerosols mostly         the large variety of oxidants and conditions (e.g., pH), but, in
have 133 S values > 0 ‰, and no processes can yet explain           view of their major impact on climate, a more accurate un-
this enrichment, resulting in an inconsistent S budget: black       derstanding of the formation of these particles is necessary.
crust sulfates could well represent the complementary nega-

Published by Copernicus Publications on behalf of the European Geosciences Union.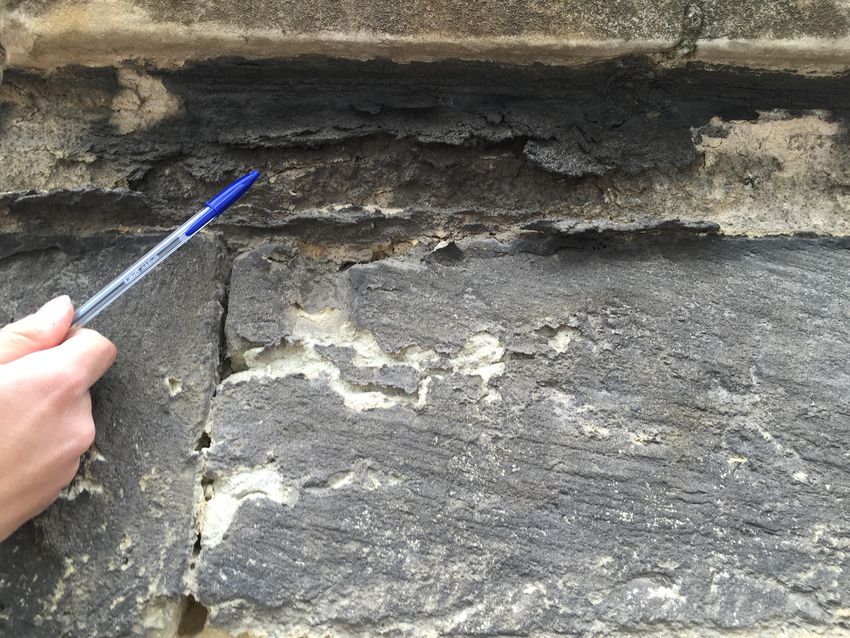
4256                                                   I. Genot et al.: Oxygen and sulfur mass-independent isotopic signatures

   Primary sulfate aerosols consist of sulfates formed dur-           (carbonyl sulfide) photolysis (Lin et al., 2011). Still, the mass
ing their emission into the atmosphere (e.g., sea-salt sulfates,      balance among positive and negative 133 S values is not con-
combustion products, volcanic sulfates), which involve there-         sistent. As none of the most significant tropospheric SO2 ox-
fore a local origin (Holt and Kumar, 1991). Secondary sulfate         idation reactions can account for 133 S anomalies in sulfate
aerosols are formed later in the atmosphere following various         aerosols (Au Yang et al., 2018; Guo et al., 2010; Han et al.,
oxidation pathways (e.g., oxidation via OH, O2 transition-            2017; Harris et al., 2013b; Lee et al., 2002; Lin et al., 2018a,
metal ion (TMI), O3 , H2 O2 , and NO2 ) and relate to a local         b; Romero and Thiemens, 2003; Shaheen et al., 2014), this
or more distant sulfur source (Seinfeld and Pandis, 2016).            leads to the suggestion that either some reactions or SO2
SO2 oxidation can occur in the gas phase (homogeneous re-             sources have been overlooked. Finally, a recent study high-
action, for example, with OH), in the aqueous phase (e.g.,            lights the possibility of SO2 oxidation on mineral dust sur-
with H2 O2 , O3 , O2 TMI), or on a surface (heterogeneous             faces resulting in 33 S-depleted sulfate deposition in rural en-
reaction), resulting in different sizes and number of aerosol         vironments and subsequent 33 S enrichment of residual SO2
particles with distinct effects on radiative balance.                 transported to cities (Au Yang et al., 2019), but the negative
   Stable isotope geochemistry is a central tool for both char-       133 S values are still missing.
acterizing sulfur sources and quantifying the different oxi-             In this respect, black crusts potentially represent new ways
dants. The δ notation used here is defined as                         to sample the atmosphere in urban regions at a relatively
                                                                    global scale. They are generally formed by the sulfation of
       Rsample
δ=               − 1 × 1000,                                          the underlying carbonate substrate resulting in a gypsum
       Rstandard                                                      layer (Camuffo, 1995) (Fig. 1). Due to their degradation ef-
 with R = 18,17 O/16 O for δ 18 O and δ 17 O,                         fects on monuments and buildings, in particular because the
                                                                      molar volume of CaSO4 is larger than that of CaCO3 , sev-
 or R = 34,33,36 S/32 S for δ 34 S,
                                                                      eral studies investigated sources of sulfur in black crusts, us-
 δ 33 S , and δ 36 S.                                                 ing primarily the isotopic composition of sulfur (δ 34 S) and
                                                                      oxygen (δ 18 O) and microscopic and mineralogical aspects.
And isotope fractionation factors are expressed as follows:           Anthropogenic sulfur was found to be the major source con-
                                                                 tributing to monument degradation in several localities com-
18/16
      αA−B = 18 O/16 O        18
                                 O/16 O ,                             pared to marine or volcanic sulfate sources (Longinelli and
                            A               B
                                                                      Bartelloni, 1978; Montana et al., 2008, 2012; Torfs et al.,
with A and B being two different phases.                              1997). Sulfates from the host rock, i.e., plaster, mortar, or
    Given that the oxidants have distinct δ 18 O and 117 O sig-       oxidized pyrite (defined as intrinsic in the literature; Klemm
natures, the SO2 oxidation pathways are commonly con-                 and Siedel, 2002; Kloppmann et al., 2011; Kramar et al.,
strained using oxygen multi-isotope ratios (δ 18 O, δ 17 O, and       2011; Vallet et al., 2006), and sulfates from aquifer rising
117 O, defined in the following section) (Alexander et al.,           by capillarity (Kloppmann et al., 2014) were also identified
2012; Bindeman et al., 2007; Jenkins and Bao, 2006; Lee and           as sulfur sources in black crusts. Black crusts being some-
Thiemens, 2001; Savarino et al., 2000; Martin, 2018). Sulfur          times the host of microbial activity (Gaylarde et al., 2007;
isotope fractionation during SO2 oxidation by OH, O2 TMI,             Sáiz-Jiménez, 1995; Scheerer et al., 2009; Schiavon, 2002;
H2 O2 , O3 (Harris et al., 2012a, b, 2013a, b), and NO2 (Au           Tiano, 2002), other studies investigated the role of bacteria
Yang et al., 2018) have been determined, so additional con-           in gypsum formation through sulfate reduction and/or SO2
straints can also be brought by S multi-isotope compositions          oxidation (Tiano, 2002; Tiano et al., 1975). Except the work
(δ 34 S, δ 33 S, δ 36 S, 133 S, and 136 S). At present, however, it   of Šrámek (1980) measuring black crust sulfates δ 34 S that
is difficult to reach a consistent budget for tropospheric SO2        rule out the implication of micro-organisms in their forma-
oxidation (chemically and isotopically). Indeed, most of ru-          tion, no further constraint has been brought so far. In this
ral and urban sulfate aerosols have positive 133 S values (Au         paper, we present new oxygen and sulfur isotopic compo-
Yang et al., 2019; Guo et al., 2010; Han et al., 2017; Lin            sition measurements of sulfate extracted from black crusts
et al., 2018b; Romero and Thiemens, 2003; Shaheen et al.,             and report significant 117 O, 133 S, and 136 S anomalies that
2014), implying either a source of SO2 with 133 S > 0 ‰               help to discuss oxygen and sulfur isotopic variations both in
(which has not been identified yet as all known sources have          term of source effects to elucidate their origin and in terms
133 S ∼ 0 ‰; Lin et al., 2018b) or more likely processes such         of fractionation processes leading to black crust formation in
as SO2 photolysis in the stratosphere (e.g., Farquhar et al.,         the Paris area.
2001), contributing to the 33 S-enriched tropospheric sulfate
reservoir from initial SO2 with 133 S = 0 ‰, which should
be balanced by a 33 S-depleted reservoir but which remains            2   Mass-dependent and independent fractionations
scarce (see Shaheen et al., 2014; Han et al., 2017; Lin et
al., 2018a). Negative 133 S values were suggested to result           As with many chemical reactions, O and S isotopic composi-
specifically from combustion (Lee et al., 2002) and/or OCS            tions of SO2 vary during their oxidation. Most reactions are

Atmos. Chem. Phys., 20, 4255–4273, 2020                                                www.atmos-chem-phys.net/20/4255/2020/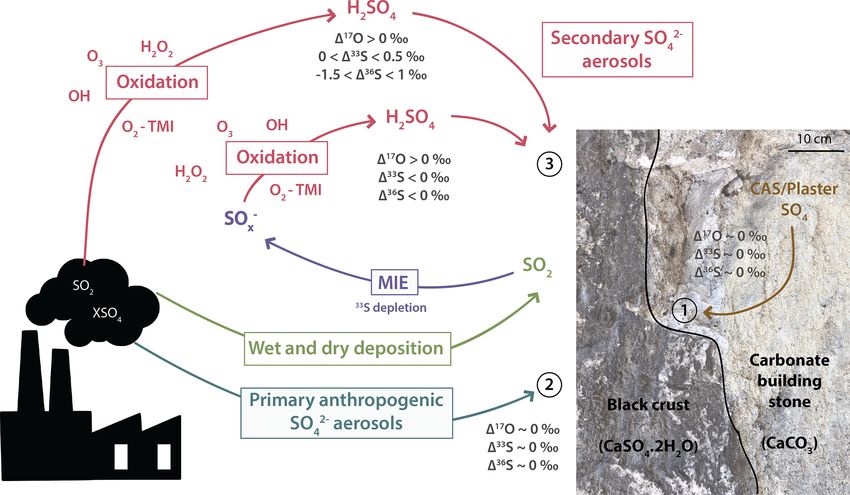
I. Genot et al.: Oxygen and sulfur mass-independent isotopic signatures 4257
" 1.889 #
36 36 δ 34 S
1 S = δ S − 1000 × +1 −1 . (3)
1000
Small nonzero 117 O–133 S–136 S values (typically be-
tween −0.1 ‰ and +0.1 ‰) can result from mixing, mass-
dependent processes such as Rayleigh distillation, or mass
conservation effects and nonequilibrium processes (Farquhar
et al., 2007a; Ono et al., 2006a), whereas large nonzero
117 O−133 S–136 S values (higher than +0.2 ‰ or lower
than −0.2 ‰) imply mass-independent fractionation (Cabral
et al., 2013; Delavault et al., 2016; Farquhar et al., 2000,
2007b, 2002; Ono et al., 2003). Oxidation reactions would
then change δ 17 O and δ 18 O but not the 117 O, which would
Figure 1. Thin layer of black crusts formed on a carbonate building primarily vary through mixing of O reservoirs with vari-
stone on a church wall in Fécamp city. able 117 O. Possible mechanisms producing nonzero 117 O–
133 S–136 S values recorded in sulfate aerosols are discussed
in the following sections. In this paper, we investigate the dif-
“mass-dependent”, meaning the isotopic fractionation relies ferent processes responsible for the 117 O, 133 S, and 136 S
on the mass differences between the isotopes; this remains values recorded by black crust sulfates and what can be in-
valid for most unidirectional (kinetic) and/or exchange (equi- ferred in terms of black crust formation.
librium) reactions. In a system with at least three isotopes,
mass fractionation laws at equilibrium and high tempera-
ture can be derived from their partition function (Bigeleisen 3 Sampling and methods
and Mayer, 1947; Dauphas and Schauble, 2016; Urey, 1947;
3.1 Sampling sites
Young et al., 2002) as follows, for instance, with oxygen iso-
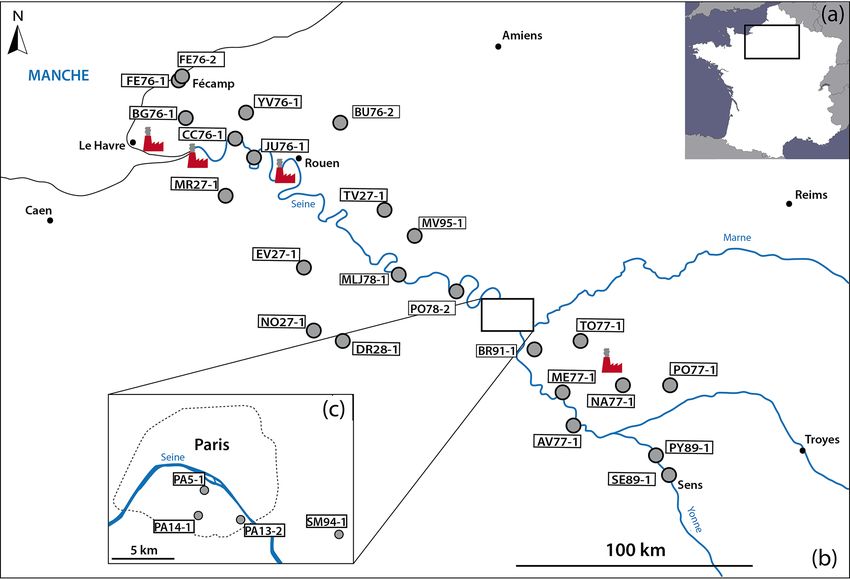
topes and SO2 oxidation in sulfates: To access sulfate aerosols from the Parisian region, black
1 1 crusts were sampled following the prevailing winds accord-
ln 17/16 αSO4 −SO2
17 m − m17
βSO4 −SO2 = ≈ 116 1
∼ 0.5305, ing to a NW–SE cross section from Fécamp to Sens (Fig. 2b,
ln 18/16 αSO4 −SO2 m16 − m18 c). Therefore, the studied area covers rural, urban, and indus-
trial zones including four power plants, major highways, and
with 17 βSO4 −SO2 being the mass exponent describing the rel- the large Paris metropolis.
ative fractionation between 17 O/16 O and 18 O/16 O, m being A total of 27 samples were collected on the external faces
the mass of each isotope, and 17/16 αSO4 −SO2 being the iso- of churches and monuments and on walls in the streets. The
tope fractionation factor between two phases (defined in the substrates were generally Lutetian and Cretaceous limestone,
introduction). The same equations can be written for 33 S and i.e., the typical building rocks in the Parisian basin. To ensure
36 S.
a representative sample of sulfate aerosols, the sampling was
Here, we will use 17 β, 33 β, and 36 β values (∼ 0.5305, carried out preferentially oriented to NW or, if possible, not
0.515 and 1.889, respectively) for the high-temperature limit, directly exposed to traffic emissions. Moreover, to avoid sul-
which has been shown to be applicable for a wide range of fate contamination from soils (i.e., salts by capillary action,
temperature phases (Dauphas and Schauble, 2016) and iso- water from runoff), black crusts were sampled at least at a
tope systems (S, Fe, Mg, O, Si, etc.). Thus, the β expo- height of 1.50 m above ground level. More details about the
nent represents the slope in a δ-δ space, called the “mass- samples are summarized in Table 1.
dependent fractionation line”, which is actually approxi-
mated from a curve (this simplification is not used in this pa- 3.2 Methods
per). Deviations from the reference “mass-dependent” curve
do not imply necessarily isotopic variations that are indepen- An X-ray diffractometer (XRD D2 phaser BRUKER, ISTeP
dent from the isotope masses. These deviations are quantified Sorbonne Université) was used to specify the mineralogical
with the 1 parameter expressed by Eqs. (1), (2), and (3) (Far- nature of each sample and therefore to demonstrate the nature
quhar and Wing, 2003; Thiemens, 1999): of sulfur. Structural and chemical aspects were subsequently
" 0.5305 # investigated using scanning electron microscopy (SEM, IS-
δ 18 O
TeP Sorbonne Université).
117 O = δ 17 O − 1000 × +1 −1 , (1)
1000 Sulfates were leached from 20 to 100 mg of black crusts
" 0.515 # and the conversion of gypsum into pure barite was performed
33 33 δ 34 S according to the protocol developed at the Institut des Sci-
1 S = δ S − 1000 × +1 −1 , (2)
1000 ences de la Terre de Paris (ISTeP) as described by Le Gendre
www.atmos-chem-phys.net/20/4255/2020/ Atmos. Chem. Phys., 20, 4255–4273, 2020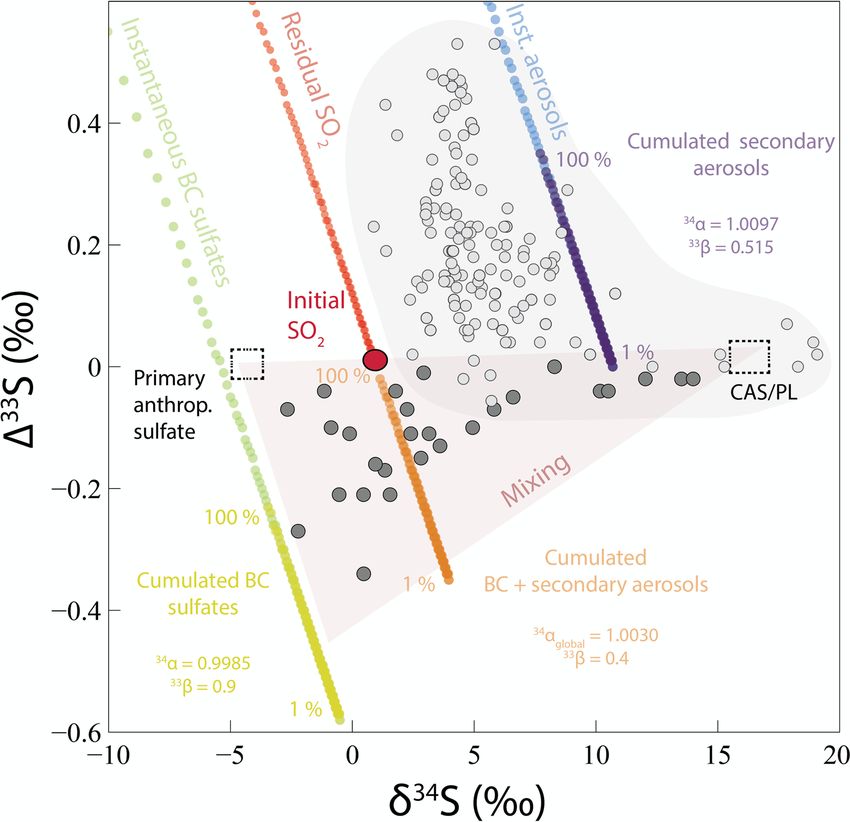
4258                                                      I. Genot et al.: Oxygen and sulfur mass-independent isotopic signatures

Table 1. Characteristics of black crust samples. Their name was given according to the city and the department where they are located and
following the number of samples gathered at the same place (NA77-1: NA = Nangis; 77 = department; -1 = first sample collected).

                 Samples      Location             Orientation      Distance       Height above    Exposure to traffic
                                                   of sampled       from the sea   the ground      road
                                                   faces            (km)           (m)
                 PA14-1       48◦ 490 37.9700 N,   65◦ N            170            1.5–2.0         Directly exposed
                              2◦ 200 5.2100 E
                 PA13-2       48◦ 490 26.4200 N,   150◦ N           170            2.0             Directly exposed
                              2◦ 220 33.4800 E
                 PA5-1        48◦ 500 37.0900 N,   14◦ N            170            1.5             Directly exposed
                              2◦ 200 25.7700 E
                 BR91-1       48◦ 420 11.1500 N,   107◦ N           190            1.5             Directly exposed
                              2◦ 300 28.8200 E
                 PO78-2       48◦ 550 42.4100 N,   100◦ N           150            1.5–2.0         Directly exposed
                              2◦ 20 16.9400 E
                 MLJ78-1      48◦ 590 32.4000 N,   295◦ N           135            1.2–1.5         Directly exposed
                              1◦ 420 31.7800 E
                 SM94-1       48◦ 480 47.0000 N,   0◦ N             175            2.0–3.5         Directly exposed
                              2◦ 280 28.8400 E
                 TO77-1       48◦ 440 18.7400 N,   21◦ N            202            1.5–2.0         Directly exposed
                              2◦ 460 7.7800 E
                 MV95-1       49◦ 90 3.5700 N,     343◦ N           110            1.5             Not directly ex-
                              1◦ 470 13.5300 E                                                     posed
                 TV27-1       49◦ 140 8.1700 N,    340◦ N           95             1.5–2.0         Directly exposed
                              1◦ 360 27.3000 E
                 BU76-2       49◦ 350 2.9400 N,    313◦ N           45             1.5–2.0         Directly exposed
                              1◦ 210 23.7900 E
                 YV76-1       49◦ 370 1.1200 N,    275◦ N           28             1.5–2.0         Not directly ex-
                              0◦ 450 16.3600 E                                                     posed
                 FE76-1       49◦ 450 31.4700 N,   190◦ N           0,5            1.5–2.0         Directly exposed
                              0◦ 220 2.7400 E
                 FE76-2       49◦ 450 29.2600 N,   0◦ N             1,1            1.5–2.0         Not directly ex-
                              0◦ 220 35.9700 E                                                     posed
                 BG76-1       49◦ 350 30.1100 N,   151◦ N           21             1.5             Not directly ex-
                              0◦ 250 39.2200 E                                                     posed
                 CC76-1       49◦ 310 32.5500 N,   191◦ N           37             < 2.0           Directly exposed
                              0◦ 430 50.1200 E
                 JU76-1       49◦ 250 56.6900 N,   317◦ N           50             1.5–2.0         Directly exposed
                              0◦ 490 8.4200 E
                 MR27-1       49◦ 170 40.5100 N,   120◦ N           28             < 2.0           Directly exposed
                              0◦ 390 52.7700 E
                 EV27-1       49◦ 10 25.8200 N,    158◦ N           84             2.0             Not directly ex-
                              1◦ 80 29.4500 E                                                      posed
                 NO27-1       48◦ 460 15.7800 N,   13◦ N            103            1.5             Not directly ex-
                              1◦ 110 53.8100 E                                                     posed
                 DR28-1       48◦ 440 9.3900 N,    233◦ N           115            1.5–2.0         Not directly ex-
                              1◦ 220 5.0600 E                                                      posed

Atmos. Chem. Phys., 20, 4255–4273, 2020                                                    www.atmos-chem-phys.net/20/4255/2020/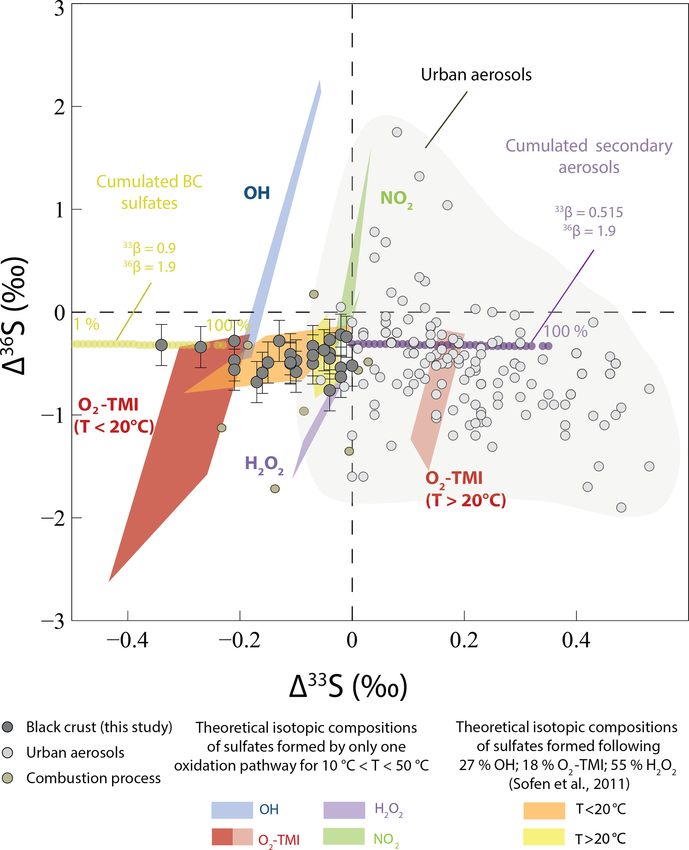
I. Genot et al.: Oxygen and sulfur mass-independent isotopic signatures                                                         4259

Figure 2. Maps with the sampling locations. (a) Location of the studied area in the northern Paris Basin on the map of France. (b) The
NW–SE cross section from Fécamp to Sens with the 27 samples and the four power plants (in red). (c) Zoomed-in view of the samples
located in the Paris area.

Table 1. Continued.

                 Samples     Location          Orientation       Distance        Height above    Exposure to traffic
                                               of sampled        from the sea    the ground      road
                                               faces             (km)            (m)
                 ME77-2      48◦ 320 2000 N,   22◦ N             210             1.3             Not directly ex-
                             2◦ 390 3300 E                                                       posed
                 AV77-1      48◦ 240 1500 N,   73◦ N             230             1.3–2.3         Directly exposed
                             2◦ 430 200 E
                 SE89-1      48◦ 120 800 N,    263◦ N            270             1.7             Not directly ex-
                             3◦ 160 2400 E                                                       posed
                 PY89-1      48◦ 170 1600 N,   343◦ N            263             1.5–2.1         Not directly ex-
                             3◦ 120 1600 E                                                       posed
                 PO77-1      48◦ 330 3800 N,   23◦ N             230             1.5–2.0         Not directly ex-
                             3◦ 170 2900 E                                                       posed
                 NA77-1      48◦ 330 2600 N,   351◦ N            230             2.5             Not directly ex-
                             3◦ 00 2500 E                                                        posed

et al. (2017). The use of an ion-exchange resin in this proto-         formation during BaSO4 fluorination, which leads to incom-
col enables the concentration and separation of sulfates from          plete O2 extraction, measured δ 18 O and δ 17 O are fraction-
other compounds such as nitrates that can affect the O iso-            ated but were corrected as deduced from the analysis of the
topic measurements. From about 3 mg of the pure barite sam-            international barite standard NBS127 (δ 18 O = 8.6 ‰, 117 O
ples, the sulfate O isotopic ratios were measured using the            ∼ 0 ‰); no correction was applied to 117 O, as it remained
laser fluorination line coupled to a Delta V IR-MS (isotope            unchanged (Bao and Thiemens, 2000). For two NBS127
ratio mass spectrometer) at the Institut de Physique du Globe          measurements measured each day during 5 d (n = 10), we
de Paris (IPGP) (Bao and Thiemens, 2000). Due to SO2 F2                obtained a mean δ 18 O = −0.43 ± 0.54 (2σ ) and a mean

www.atmos-chem-phys.net/20/4255/2020/                                                  Atmos. Chem. Phys., 20, 4255–4273, 2020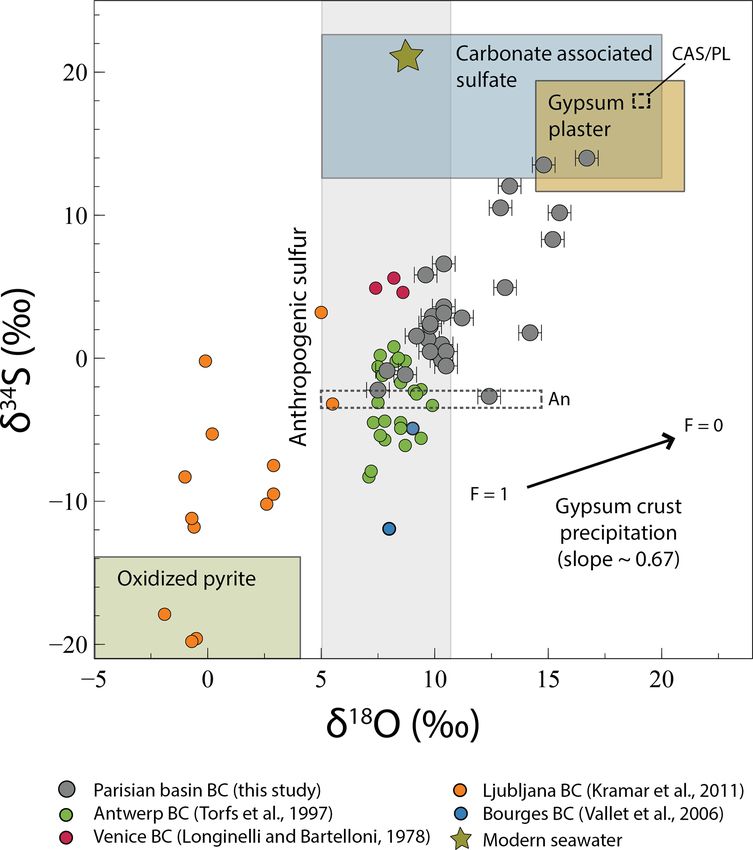
4260 I. Genot et al.: Oxygen and sulfur mass-independent isotopic signatures
117 O = 0.044 ± 0.020 (2σ ) within error of the recent value consistent with the catalyzer effect of combustion particles
reported by Cowie and Johnston (2016). Bao (2006) reported released by diesel and gasoline vehicles, which increases the
up to 2 ‰ variation in the correction factor that would re- rate of SO2 fixation as sulfate (Rodriguez-Navarro and Se-
sult from sample impurity, but, as our samples were purified bastian, 1996). Scarce fly ashes were also observed in sam-
with an ion-exchange resin and the mean variation of the du- ples from the city of Mantes-la-Jolie (northwest of Paris).
plicates is lower than for NBS127, we applied a correction The sample MR27-1 shows isolated halite crystals (< 10 µm,
factor of 9.03 to δ 18 O for all analyzed samples based on the Fig. 3e), which can result from marine aerosols, in agree-
certified value of NBS127. ment with its location near the sea, and numerous fly ashes
The remaining BaSO4 was reduced to hydrogen sulfide (Fig. 3d), most likely from power plants and traffic roads.
(H2 S) by reaction for 2 h with a heated mixture of hydrochlo- The dissolution of rhombohedral calcite and subsequent pre-
ric (HCl), hydroiodic (HI), and hypophosphorous (H3 PO2 ) cipitation of gypsum crystals is also illustrated in Fig. 3f.
acids following the protocol described in Thode et al. (1961). In summary, the presence of particulate matter and salts
H2 S was purged and precipitated as silver sulfide (Ag2 S) highlights several local or distant sources of S-bearing com-
by passing through a silver nitrate (AgNO3 ) solution. Ag2 S pounds and a prevailing anthropogenic source in the whole
was then converted to SF6 , purified (Ono et al., 2006b), Parisian basin atmosphere, which may be distinguished and
and quantified before being analyzed by isotope ratio mass quantified with the isotopic composition of sulfate.
spectrometry (Thermo Fisher MAT-253) at McGill Univer-
sity. The δ 34 S values are expressed versus V-CDT (Vienna- 4.2 Isotopic composition of black crust sulfates
Canyon Diablo Troilite) assuming a δ 34 SS1 = −0.30 ‰ vs.
CDT isotope composition. Our data were then expressed The sulfur and oxygen isotopic compositions of black crust
against CDT following the method described by Defouil- sulfates are reported in Table 2. The δ 18 O and δ 34 S values
loy et al. (2016). Analysis of the IAEA-S1 in the laboratory cover a wide range from 7.5 ‰ to 16.7 ‰ ±0.5 ‰ (2σ ) and
yielded the following: δ 34 S = −0.30 ‰, 133 S = 0.09 ‰, from −2.66 ‰ to 13.99 ‰ ±0.20 ‰ (2σ ), respectively, with
and 136 S = −0.70 ‰ vs. V-CDT. Analysis of the IAEA- means of 11.3 ± 2.4 ‰ and 3.78 ± 4.79 ‰, respectively. All
S3 (n = 8) gave the following: δ 34 S = −32.44 ± 0.30 ‰, samples have positive 117 O values, ranging from 0.08 to
133 S = 0.069±0.023 ‰, and 136 S = −0.970±0.277 ‰ vs. 2.56 ‰ ± 0.05 ‰ (2σ ) with an average value of 0.86 ‰. Fur-
V-CDT. All values are within the ranges of δ 34 S, 133 S, and thermore, it is noteworthy that 67 % of black crust samples
136 S accepted or measured by other laboratories for these have 117 O > 0.65 ‰. The 133 S and 136 S values are both
international standards (Au Yang et al., 2016; Farquhar et negative and vary between −0.34 ‰ and 0.00 ± 0.01 ‰ and
al., 2007b; Labidi et al., 2014; Ono et al., 2006b; Geng et al., between −0.76 ‰ and −0.22±0.20 ‰ (2σ ), respectively. No
2019). obvious correlation exists between δ 18 O, 117 O, δ 34 S, and
133 S and the distance from coastline (Fig. S1 in the Supple-
ment).
4 Results
5 Discussion
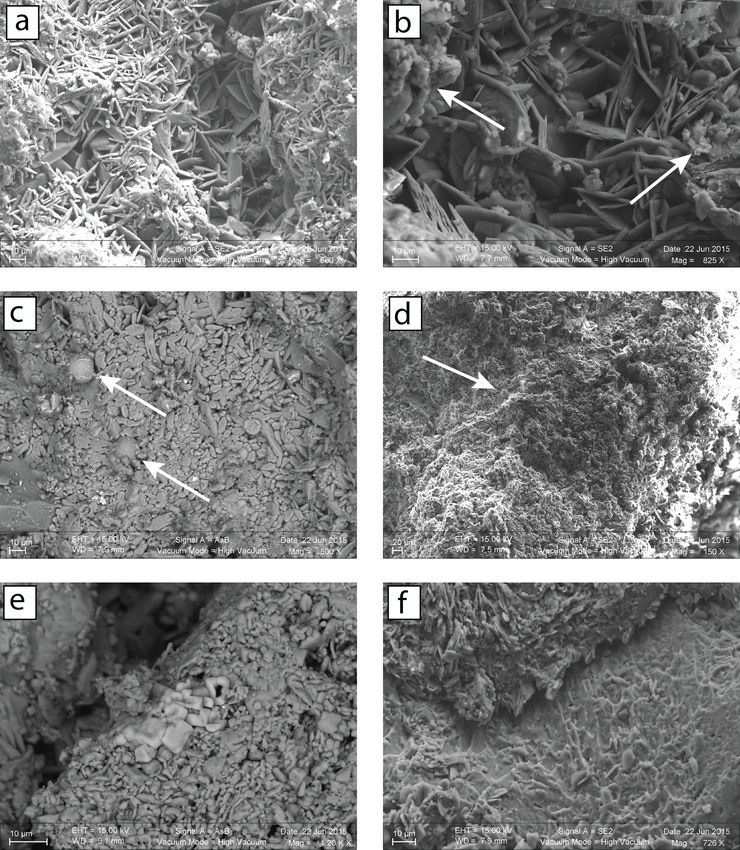
4.1 Morphological and chemical aspects
5.1 The δ 34 S–δ 18 O–117 O systematics
After having confirmed the gypsum nature of the sample
by X-ray diffraction, the structural and chemical aspects of Sulfate in black crusts may have multiple origins that could
black crusts from four different environments were investi- be either primary or secondary. We refer to primary sulfates
gated on the basis of SEM observations. In agreement with here as sulfates that are not formed in the atmosphere from
previous studies (Fronteau et al., 2010; Siegesmund et al., SO2 oxidation. They can originate from the host rock it-
2007), all samples display two distinct layers. An opaque self where sulfur occurs both as sulfide, such as pyrite that
layer (a few tens of micrometers thick) comprising massive would be subsequently dissolved and oxidized as sulfate,
and sparse gypsum crystals as well as aggregates of clay min- and as carbonate-associated sulfates (CASs), which substi-
erals and particulate matter was overlying a layer (∼ 100 µm) tute for carbonate in the lattice. Sulfates in black crusts can
composed of more crystallized acicular and rosette-like crys- also have been directly emitted into the atmosphere for in-
tal gypsum (tens of micrometers, Fig. 3a). As shown in stance by sea spay, resulting in sea-salt sulfate aerosols, or
Fig. 3b, soot is present in both urban and rural encrusta- as products of combustion by refineries, vehicle exhaust, or
tions being consistent with previous observations (Guo et al., biomass burning; these commonly correspond to “primary
2010). Moreover, fly ash particles resulting from coal or oil sulfates” in the literature. On the contrary, secondary sulfates
combustion are present in all environments. Parisian samples result from the oxidation of tropospheric S-bearing gases
(PA13-2 and PA14-1) show many fly ashes of a diameter size (mainly SO2 ) and other compounds including dimethyl sul-
< 10 µm (primarily composed of Fe) with small gypsum crys- fide (DMS, (CH3 )2 S) by various oxidants (O3 , H2 O2 , OH,
tals (few micrometers) on their surfaces (Fig. 3c). This is O2 TMI, and NO2 ). As black crusts are mainly consisted of
Atmos. Chem. Phys., 20, 4255–4273, 2020 www.atmos-chem-phys.net/20/4255/2020/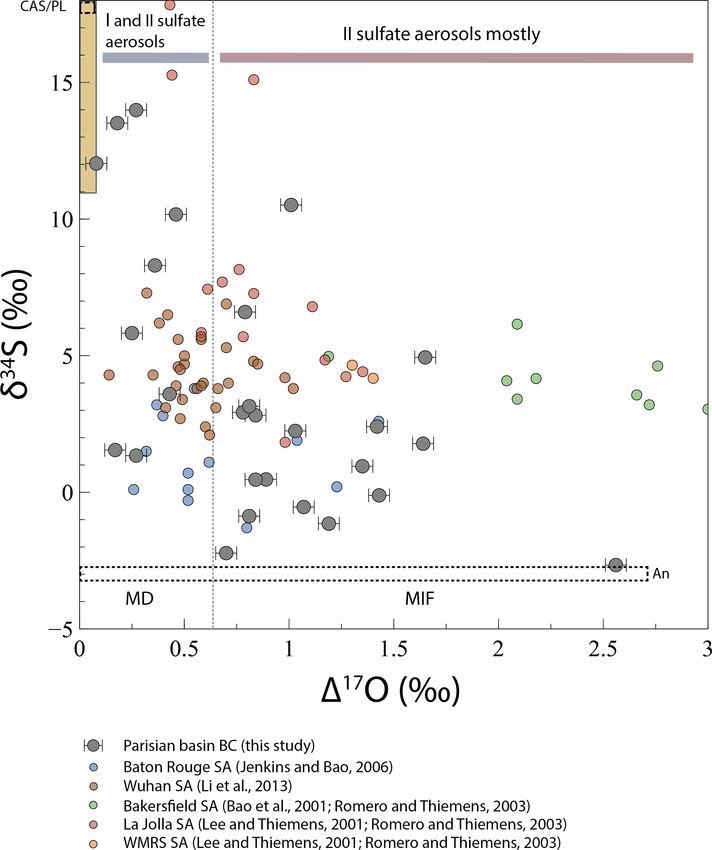
I. Genot et al.: Oxygen and sulfur mass-independent isotopic signatures                                                                   4261

Figure 3. SEM images of black crust samples from Paris (PA14-1, PA13-2) and Montfort-sur-Risles (MR27-1). (a) Two distinct layers in the
crust: an upper opaque one with aggregates of particulate matter and clay minerals (left and right sides of the picture) and a more crystallized
one with acicular gypsum crystals perpendicular to the host substrate. (b) There is a presence of soot (arrow) on the two layers (PA14-1).
(c) Fly ashes (arrow) with the formation of small gypsum crystals are on their surfaces (PA13-2). (d) Large amount of fly ashes (arrow
and smaller not indicated) and soot is in the MR27-1 sample, originating from a rural place. (e) Isolated cubic crystals of halite (NaCl) in
MR27-1 sample, originating form 28 km from the coastline. (f) Dissolution of the underlying limestone (on the bottom) and subsequently
the precipitation of gypsum (on the top).

gypsum (CaSO4 2H2 O), coupled δ 34 S–δ 18 O variations can be             26 ‰ (Vicars and Savarino, 2014). Every molecule inheriting
used to trace natural vs. anthropogenic sources of sulfates               oxygen atoms from O3 will also have positive 117 O values,
in black crusts. Constrains on the primary/secondary ori-                 including H2 O2 with an average 117 O of ∼ 1.3 ‰ (Savarino
gins of sulfate aerosols can also be brought by 117 O values.             and Thiemens, 1999). OH, which isotopically exchanges
Indeed, large positive 117 O anomalies in sulfate aerosols                with water vapor, and O2 TMIs have mass-dependent com-
are inherited from their atmospheric oxidants that were pro-              positions with 117 O values of ∼ 0 (Dubey et al., 1997; Holt
duced during O3 photochemically induced genesis. In theory,               et al., 1981; Lyons, 2001) and ∼ −0.34 ‰ (Barkan and Luz,
other mechanisms exist such as the magnetic isotope effect                2005), respectively. Savarino et al. (2000) measured the O
(see Sect. 5.2.2) but have not been recognized yet. Resulting             isotopic compositions of sulfates derived from these oxida-
from photochemical reactions, O3 molecules possess O-MIF                  tion pathways and showed that OH and O2 TMI oxidation
(oxygen mass independent fractionation) compositions with                 channels do not result in mass-independent fractionation sig-
117 O of ∼ 35 ‰ (Janssen et al., 1999; Lyons, 2001; Mauers-               natures (117 O = 0 ‰ and −0.09 ‰, respectively), whereas
berger et al., 1999) with lower values in the troposphere of ∼            O3 and H2 O2 radicals transfer one-quarter and one-half, re-

www.atmos-chem-phys.net/20/4255/2020/                                                        Atmos. Chem. Phys., 20, 4255–4273, 2020
4262                                                   I. Genot et al.: Oxygen and sulfur mass-independent isotopic signatures

Table 2. δ 18 O, δ 34 S, 117 O, 133 S, and 136 S measurements of each sample with the distance from coastline.

                         (2σ )          δ 18 O     117 O         δ 34 S       133 S       136 S     Distance from
                                      ±0.5 ‰     ±0.05 ‰      ±0.20 ‰      ±0.01 ‰     ±0.20 ‰      coastline (km)
                         PO78-2            9.7        0.27        1.34        −0.17       −0.68                  150
                         AV77-1            9.8        1.03        2.25        −0.07       −0.33                  230
                         PY89-1            9.8        0.84        0.46        −0.21       −0.47                  263
                         PO77-1           12.4        2.56       −2.66        −0.07       −0.50                  231
                         BG76-1           13.1        1.65        4.94        −0.10       −0.47                   21
                         MV95-1           15.5        0.46       10.17        −0.04       −0.40                  110
                         BR91-1           14.8        0.18       13.51        −0.02       −0.22                  190
                         JU76-1            9.9        0.78        2.93        −0.01       −0.24                   50
                         TV27-1           16.7        0.27       13.99        −0.02       −0.54                   95
                         YV76-1           12.9        1.01       10.51        −0.04       −0.27                   28
                         DR28-1            7.5        0.70       −2.22        −0.30       −0.34                  115
                         FE76-1           10.3        1.35        0.95        −0.16       −0.59                   0.5
                         NO27-1           14.2        1.64        1.78        −0.04       −0.45                  103
                         ME77-2           10.5        1.07       −0.54        −0.21       −0.29                  210
                         PA13-2            7.9        0.81       −0.87        −0.10       −0.58                  170
                         MLJ78-1          15.2        0.36        8.30         0.00       −0.52                  135
                         EV27-1           10.4        0.79        6.60        −0.05       −0.37                    84
                         FE76-2            8.7        1.19       −1.15        −0.04       −0.76                   1.1
                         SE89-1           10.4        0.81        3.15        −0.11       −0.41                  270
                         BU76-2           10.3        1.43       −0.11        −0.11       −0.50                    45
                         MR27-1           11.2        0.84        2.82        −0.15       −0.49                    28
                         PA14-1            9.2        0.17        1.55        −0.21       −0.56                  171
                         TO77-1           13.3        0.08       12.03        −0.02       −0.64                  202
                         NA77-1            9.8        1.42        2.40        −0.11       −0.49                  232
                         PA5-1            10.5        0.89        0.47        −0.34       −0.32                  172
                         SM94-1           10.4        0.43        3.60        −0.13       −0.28                  175
                         CC76-1            9.6        0.25        5.82        −0.07       −0.43                    37

spectively, of their isotopic anomalies to the sulfate, thus re-          member. In the following paragraphs, we discuss in detail the
sulting in mass-independent fractionation signatures (117 O               respective roles of several processes (e.g., partial SO2 oxida-
= 8.75 ‰ and 0.65 ‰, respectively) (e.g., Bao et al., 2000,               tion, mixing) that could lead to this correlation and overprint
2001a, b, 2010; Jenkins and Bao, 2006; Lee et al., 2002; Lee              (or not) of the source signatures. As with previous studies, we
and Thiemens, 2001; Li et al., 2013; Martin et al., 2014).                will conclude that δ 34 S–δ 18 O–117 O values do record a mix-
Mass-dependent isotopic fractionation during SO2 oxidation                ing between different (natural and anthropogenic) sources,
may change δ 17 O and δ 18 O but not the 117 O that only de-              but addressing the role of processes is important (a prerequi-
pends on the mixing of O reservoirs with variable 117 O. The              site) to assess the consistency of the 133 S anomaly origin.
fact that most black crusts have 117 O > 0.6 ‰ demonstrates
that a significant amount of sulfates is of atmospheric origin.           5.1.1   Processes affecting O and S isotopic compositions
   Black crust sulfates analyzed in this study have O and S
isotopic compositions that overlap other black crusts from                Firstly, gypsum precipitation would fractionate both O and
Europe (Fig. 4; Longinelli and Bartelloni, 1978; Torfs et                 S isotopes following a slope of 0.67 ± 0.02 (Fig. 4) when
al., 1997, Kramar et al., 2011, Vallet et al., 2006) and sul-             considering fractionation factors for 18 O/16 O between the
fate aerosols from the USA and China (Fig. 5; Bao et al.,                 dissolved sulfate and the gypsum of ∼ 1.002 or 1.0036 (ex-
2001a; Jenkins and Bao, 2006; Lee and Thiemens, 2001;                     perimental and natural values, respectively) (Lloyd, 1968).
Li et al., 2013; Romero and Thiemens, 2003). In particular,               For 34 S/32 S, the ranges would be between 1.000 and 1.0024
there is a positive correlation between δ 34 S and δ 18 O cover-          (Ault and Kulp, 1959; Nielsen, 1974; Raab and Spiro, 1991;
ing a large range of variation of ∼ 17 ‰ and ∼ 9 ‰, respec-               Thode et al., 1961), and a Rayleigh-type process in which
tively (Fig. 4), which can be interpreted in two ways: either             black crusts represents the cumulated (precipitated) prod-
a process leads to a variable enrichment or depletion of 18 O             uct at different residual fraction F of dissolved sulfates that
and 34 S in the crusts or it reflects a mixing between at least           are leached. However, the slope defined by the samples is
one depleted (in both 18 O and 34 S) and one enriched end-                steeper, ∼ 1.52 (R 2 = 0.58), implying that the gypsum pre-

Atmos. Chem. Phys., 20, 4255–4273, 2020                                                    www.atmos-chem-phys.net/20/4255/2020/
I. Genot et al.: Oxygen and sulfur mass-independent isotopic signatures 4263
ing the black crusts would increase up to ∼ 9 ‰ at maxi-
mum when < 10 % SO2 is oxidized, which cannot explain
the ∼ 17 ‰ δ 34 S variation, especially since 40 % oxidized
SO2 is reported (Chin et al., 2000). To generate δ 34 S values
as high as 17 ‰, O3 and H2 O2 oxidation pathways should
increase drastically (i.e., requiring the absence of an O2 TMI
pathway), predicting an increase of 117 O up to ∼ 6.5 ‰,
which is not consistent with 117 O ∼ 0 ‰ associated with
high δ 34 S (Fig. 5). Therefore, SO2 partial oxidation can ex-
plain a part of the data but not the whole isotope variations.
The large δ 34 S range could also reflect temporal variation,
since in Greenland ice cores δ 34 S was > 10 ‰ before the
industrial period (Patris et al., 2002), which is dominated
by SO2 from DMS (Sofen et al., 2011) and then decreased
< 4 ‰ in the 1960s, which is dominated by anthropogenic
SO2 . Following this variation, black crusts on recently ren-
ovated churches should display low δ 34 S and those reno-
vated before the industrial period should display higher δ 34 S.
However, samples ME77-2 (δ 34 S = −0.54 ‰) and EV27-
1 (δ 34 S = 6.60 ‰) compared to PY89-1 (δ 34 S = 0.46 ‰)
gathered on churches restored after World War II and in
1772, respectively, present no significant temporal variation,
Figure 4. Evolution of δ 34 S with δ 18 O in black crust (BC) sulfates.
which might be due to higher proportions of anthropogenic
Modern seawater δ 18 O and δ 34 S are from Markovic et al. (2016) SO2 emitted recently (0.5 Tg S yr−1 before the industrial pe-
and Rees et al. (1978), respectively. The extreme anthropogenic sul- riod and up to 69 Tg S yr−1 for the present day; Sofen et
fate δ 18 O and δ 34 S are from Lee et al. (2002) and Faure (1986) re- al., 2011, and references therein). Thus, black crusts do not
spectively. The carbonate-associated sulfate compositions are from seem to record temporal isotopic variation, even if samples
Rennie and Turchyn (2014) and Turchyn et al. (2009), and those with δ 34 S = −2.66 ‰ and δ 34 S = 13.99 ‰ should be dated
of gypsum plaster come from Kloppmann et al. (2011). Isotopic to confirm this assumption. Alternatively, with well-exposed
compositions determining the oxidized pyrite field are from Can- surfaces to precipitation emphasizing wash-out and subse-
field (2004) for sulfur and are calculated following a Rayleigh dis- quent reprecipitation, black crusts could rather probe “re-
tillation model with an initial H2 Oδ 18 O = 6 ‰ and a mean fraction- cent” SO2 oxidation. So far, no known processes seem to af-
ation factor of 1.010 (Gomes and Johnston, 2017) for oxygen. The
fect the isotopic compositions, which rather probe the source
black arrow represents the fractionation induced by gypsum precip-
itation where F = 1 means that all sulfates are dissolved and F = 0
signatures.
means that all sulfates are precipitated. The dashed fields represent
the sulfur isotopic composition of the two anthropogenic (An) and 5.1.2 Source effects
CAS/plaster (CAS/PL) end-members.
If δ 34 S–δ 18 O variation reflects mixing of sources, at least
two end-members are required. Determined graphically in
cipitation is not the main mechanism driving δ 34 S and δ 18 O Figs. 4 and 5, a first one would be 18 O–34 S enriched both
variations in black crusts. Another process that could affect around 18 ‰ with a near-zero 117 O, which in view of the
δ 34 S–δ 18 O values is the partial oxidation of SO2 by different sampling cross section from NW to SE and west-dominating
oxidants (e.g., O2 TMI, H2 O2 , O3 , OH). Using the fraction- winds could correspond to the sea-spray isotopic signature,
ation factors 34 αSO4 −SO2 obtained experimentally at 19 ◦ C but available data usually display δ 18 O of ∼ 9 ‰ (Markovic
by Harris et al. (2012a) for each oxidant (34 αSO4 −SO2 (OH) et al., 2016) and δ 34 S ∼ 21 ‰ (Rees et al., 1978), rul-
= 1.0113 ± 0.0024; 34 αSO4 −SO2 (H2 O2 ) = 1.0151 ± 0.0013; ing out the occurrence of sea-sprays. With the DMS pro-
34 α 34
SO4 −SO2 (O2 TMI) = 0.9894 ± 0.0043; αSO4 −SO2 (O3 ) duced by phytoplankton and oxidized in the atmosphere
= 1.0174 ± 0.0028) and their respective proportions from (1125 Tg S yr−1 ) being higher than sea-salt emissions (6–
Sofen et al. (2011), usually cited in the literature for present- 12 Tg S yr−1 (Alexander et al., 2005, and references therein),
day atmosphere (27 % OH; 18 % O2 TMI; 50 % H2 O2 ; 5 % with δ 34 S of 15 ‰–20 ‰ (Calhoun et al., 1991), sulfate
O3 ), we calculated a global fractionation factor of 1.0097. It aerosols deriving from DMS oxidation could rather repre-
is worth noting that these values produce a 117 O of 0.66 ‰ sent this 18 O–34 S-enriched end-member. However, the ab-
in agreement with our mean 117 O in black crusts. Conse- sence of a correlation between δ 34 S, δ 18 O, 117 O and the
quently, following a Rayleigh distillation model and an ini- distance from coastline (Fig. S1) and near-zero 117 O for
tial SO2 with δ 34 S = 0 ‰, the cumulated sulfates represent- high δ 34 S values (Fig. 5) is not consistent with a signifi-
www.atmos-chem-phys.net/20/4255/2020/ Atmos. Chem. Phys., 20, 4255–4273, 20204264 I. Genot et al.: Oxygen and sulfur mass-independent isotopic signatures
from Atlantic and Pacific oceans over the last 25 Myr and in
the middle Cretaceous Tethys ocean show δ 34 S from 11 ‰
to 24 ‰, with δ 18 O from 5 ‰ to 21 ‰ similar to barite iso-
topic composition (Rennie and Turchyn, 2014; Turchyn et
al., 2009). Furthermore, marine sulfates typically have 117 O
of ∼ 0 and > −0.2 ‰ in the geological record (Bao et al.,
2008). CAS would thus perfectly match this end-member.
Plaster used to seal blocks of carbonate stones is made
through Lutetian gypsum dehydration and could also well
represent the 18 O–34 S-rich end-member. Indeed, Kloppmann
et al. (2011) measured δ 34 S between 12.6 ‰ and 18.3 ‰ and
δ 18 O from 14.6 ‰ to 21.5 ‰ for mortars and plasters from
French churches and castles. Thus, the surrounding plaster
also matches this end-member, which is named CAS/Pl in
Figs. 4 and 5.
The depleted end-member is graphically characterized by
δ 34 S < −3 ‰ with little constrained δ 18 O from 5 ‰ to 15 ‰
(Fig. 4, dashed box “An”) and 117 O from ∼ 0 ‰ to 2.6 ‰
(Fig. 5, dashed box An). Sulfates from dissolved and oxi-
dized sedimentary pyrites contained in the building carbon-
ate stone are known to have δ 34 S < −12 ‰ (since at least the
last 500 Myr; Canfield, 2004). Despite a sulfide content that
can vary between a few tens to thousands of parts per mil-
lion (Thomazo et al., 2018), our sampled carbonate stones
Figure 5. Evolution of δ 34 S with 117 O in black crust (BC) sulfates
are very whitish, suggesting a low sulfide content. Even if it
and sulfate aerosols (SA). The limit between mass-dependent and
would certainly not affect the mass balance, we took into ac-
mass-independent fractionation (dashed line) is defined for 117 O
∼ 0.65 ‰, where H2 O2 will be the major oxidant, giving its O count pyrite oxidation, as other studies did on black crusts
anomaly to sulfates (Savarino et al., 2000). When 117 O < 0.65 ‰, (Kramar et al., 2011; Vallet et al., 2006). With the S iso-
black crust sulfates result from a mixing between primary sulfates tope fractionation factor during pyrite oxidation being negli-
(gypsum plaster and CAS and/or anthropogenic sulfur) and sec- gible (between 0.996 and 1; Thurston et al., 2010, and refer-
ondary sulfate aerosols, where SO2 is oxidized by H2 O2 (117 O = ences therein) compared to O isotopes, we modeled the δ 18 O
0.65 ‰), OH (117 O = 0 ‰), or O2 TMI (117 O = −0.09 ‰) variation according to a Rayleigh distillation to represent the
mainly (gray bar). When 117 O > 0.65 ‰, black crust sulfates rep- sulfide oxidation, commonly occurring via O2 + H2 O at the
resent secondary sulfate aerosols mainly, resulting from a mixing atmosphere–carbonate building stone interface. With an ini-
between SO2 oxidized by O3 (117 O = 8.75 ‰) and H2 O2 (red tial δ 18 O of ∼ −6 ‰ of rainwater in the Paris Basin and a
bar). The yellow array represents gypsum plaster and CAS isotopic
mean 18 αwater-sulfate of 1.010 (Gomes and Johnston, 2017),
compositions. The dashed fields represent the sulfur isotopic com-
sulfates from pyrite oxidation would have δ 18 O of ∼ 4 ‰
position of the two anthropogenic (An) and CAS/plaster (CAS/PL)
end-members. and as low as −6 ‰ if water would be in limited amounts
(i.e., residual fraction of water F ∼ 0). Very recently, pyrite
oxidation was hypothesized to occur via O3 (Hemingway et
al., 2019), which would lead to positive 117 O of sulfates
cant DMS contribution, mostly oxidized by O3 (see above; with low δ 34 S, explaining the depleted end-member. How-
Alexander et al., 2012). Despite some isolated halite crystals ever, our data are strikingly higher than for black crusts from
observed in one sample (Fig. 3e), we conclude that, overall, Ljubljana (Slovenia; Kramar et al., 2011), which show δ 34 S
marine aerosols (DMS, sea-salt sulfates) do not relate to the as low as −20 ‰ and δ 18 O between −2 ‰ and 5 ‰ (Fig. 4)
high δ 34 S–δ 18 O end-member. Major-element contents (e.g., that would be typical for pyrite oxidation. Besides, there is so
Na, Cl) have not been measured here even if they could fur- far no evidence for a higher oxidation flux of pyrite via O3
ther constrain and quantify the presence of marine aerosols. than major constituents as H2 O and O2 . This means that an-
The structural analyses of black crusts emphasize dissolution other source should have negative δ 34 S. Anthropogenic sul-
of the underlying carbonate. Carbonate-associated sulfates fur represents ∼ 60 % of the total sulfur released worldwide
(with S abundances varying between a few tens to thousands and includes primary sulfates as oil, coal, and biomass com-
of parts per million (ppm; Kampschulte and Strauss, 2004, bustion products as well as SO2 emission that can be oxi-
and references therein) would also be dissolved and repre- dized into secondary sulfates. When considering coal and oil
cipitated in black crusts and may well represent the enriched combustion, δ 34 S can vary largely between −30 ‰ and 32 ‰
δ 34 S–δ 18 O end-member with near-zero 117 O. CAS analyses (e.g., Faure, 1986). More locally, a recent study reported a
Atmos. Chem. Phys., 20, 4255–4273, 2020 www.atmos-chem-phys.net/20/4255/2020/I. Genot et al.: Oxygen and sulfur mass-independent isotopic signatures 4265
narrow range from −0.57 ‰ to 11.33 ‰ for sulfur emitted are quite unusual compared with anthropogenic and natu-
by transport and industries in Paris (Au Yang et al., 2020). ral aerosols. As illustrated by Fig. 6, black crust sulfate
Lee et al. (2002) carried out vegetation and diesel combus- 133 S values are all negative, and it is worth noting that
tion experiments, resulting in δ 34 S and δ 18 O values between this depletion occurs with near-constant 136 S values. This
9.55 ‰ and 16.42 ‰ and between 5.5 and 10.5 ‰, respec- is somewhat distinct from most aerosols, which display al-
tively, with 117 O of ∼ 0 ‰, forming primary sulfates with- most exclusively positive 133 S values up to ∼ 0.5 ‰ and
out mass-independent signatures. Because sulfate aerosols both positive and negative 136 S values (Au Yang et al.,
can be either primary or secondary with various SO2 oxi- 2019; Guo et al., 2010; Lin et al., 2018b; Romero and
dation pathways having distinct δ 18 O–117 O values and O- Thiemens, 2003; Shaheen et al., 2014). So far, the only neg-
fractionation factors, atmospheric aerosols would result in ative 133 S values down to −0.6 ‰ were measured in sul-
variable δ 18 O–117 O values. Therefore, the depleted end- fate aerosols from Beijing (China) during winter months
member with δ 34 S < −3 ‰ and 0 < 117 O < 0.65 ‰ could be (Han et al., 2017) (no 136 S values provided), and these
typified by primary anthropogenic sulfate aerosols, or SO2 values were assumed to result from incomplete combus-
oxidized by OH or O2 TMI, and/or a subtle mixing of ox- tion of coal. This assumption ultimately relies on the work
idation pathways to yield near-zero 117 O, whereas sam- of Lee et al. (2002), which showed that primary anthro-
ples with 117 O > 0.65 ‰ rather point to a significant anthro- pogenic aerosols formed by high-temperature combustion
pogenic SO2 fraction oxidized by O3 and H2 O2 or by O3 (e.g., diesel) result in near-zero 133 S–136 S values, whereas
and to a lesser extent by O2 TMI and OH, depending on the those formed by low-temperature combustion (e.g., biomass
water pH (Lee and Thiemens, 2001), corresponding to sec- burning) result in 133 S down to −0.2 ‰ and 136 S val-
ondary sulfate aerosols (named An in Figs. 4 and 5). As the ues varying between −1.9 ‰ and 0.2 ‰ (data recalculated
distinction between primary and secondary sulfate aerosols with 36 β = 1.9). Negative 136 S values well correlated with
having near-zero 117 O is not possible, we assume a mixing biomass burning proxies are also reported in East China (Lin
with only two end-members, CAS/Plaster and anthropogenic et al., 2018b), although 133 S was ∼ 0 ‰. As in many other
sulfur (primary and secondary). Furthermore, in view of the cities, Paris has long been affected by coal and wood burn-
O isotope variability caused by the oxidation, mixing propor- ing, we can hypothesize that 133 S–136 S variations result
tions were calculated based only on δ 34 S values. We chose from high- and/or low-temperature combustion processes.
the end-members graphically and in agreement with the lit- Some black crust sulfates with near-zero 133 S-136 S val-
erature, i.e., a CAS/PL δ 34 S value of 18 ‰, in the range from ues could result from high-temperature combustion, but this
11 ‰ to 24 ‰ (Kloppmann et al., 2011; Rennie and Turchyn, would not explain negative 133 S–136 S values. Furthermore,
2014; Turchyn et al., 2009) (Fig. 4) and an An δ 34 S value according to Lin et al. (2018b), low-temperature combustion
of −3 ‰, similar to Montana et al. (2008) as well the clos- would preferentially fractionate 36 S over 33 S, which should
est to sulfates measured in Paris. CAS/PL proportions range result in a steep slope in 133 S–136 S space. The trend de-
from 2 % to 81 % with an average of ∼ 32 %. With an ex- fined by our black crust samples shows higher 33 S frac-
treme δ 34 S of −10 ‰ for the An end-member, encompass- tionation than 36 S with 133 S values lower than those ob-
ing black crusts from Antwerp, the CAS/PL proportion av- tained by available low-temperature combustion experiments
eraged 49 %. This highlights that host-rock sulfate is on av- (< −0.2 ‰; Lee et al., 2002) and with 136 S values in the
erage not the main S provider, and that black crusts record range of aerosols. Furthermore, no 133 S evolution is ob-
atmospheric sulfate aerosols. Excluding the most “contam- served in black crusts sampled on churches with different
inated” samples by CAS/PL and assuming that those hav- ages of renovation (see Sect. 5.1; ME77-2 133 S = −0.21 ‰;
ing 117 O > 0.65 ‰ obviously represent SO2 oxidized by O3 EV27-1 133 S = −0.05 ‰; and PY89-1 133 S = −0.21 ‰),
and H2 O2 , the minimum proportion of MIF-bearing sulfates, whereas we would expect a 133 S increase in black crusts
and hence secondary sulfates, can be estimated at ∼ 63 %, from −0.2 ‰ to 0 ‰ due to the reduction of sulfur emission
which is close to estimations by Lee and Thiemens (2001) from low-temperature replaced by high-temperature combus-
and Sofen et al. (2011). In summary, black crusts sample sig- tion processes. Therefore, available data highlight that nei-
nificant amounts of atmospheric SO2 and complement exist- ther high- nor low-temperature combustion processes are re-
ing sampling such as aerosols, which allow us to address the sponsible for low 133 S measured in black crusts.
origin of the 133 S anomaly. With a part of black crust sulfates being atmospheric in
origin, isotopic effects during SO2 oxidation could be re-
5.2 Black crusts S-MIF signature sponsible for 133 S–136 S variations. To better address this
issue, we calculated the 133 S–136 S values of sulfates pre-
5.2.1 Processes implicated in black crust formation dicted by each of the main SO2 oxidation pathways and
by a mixing of them in the proportions given by Sofen et
133 S–136 S values recorded by black crust sulfates range al. (2011). We used 33 β and 36 β values determined by exper-
from −0.34 ‰ to 0.00±0.01 ‰ for 133 S and from −0.76 ‰ iments of SO2 oxidation by O2 TMI, H2 O2 , O3 , OH (Har-
to −0.22 ± 0.20 ‰ (2σ ) for 136 S (Table 2). These values ris et al., 2013b), and values cited in Au Yang et al. (2018)
www.atmos-chem-phys.net/20/4255/2020/ Atmos. Chem. Phys., 20, 4255–4273, 20204266 I. Genot et al.: Oxygen and sulfur mass-independent isotopic signatures
in either aerosols or in black crusts (Fig. 6). Although ox-
idation with O2 TMI at T = 50 ◦ C could produce negative
133 S down to −0.37 ‰, which would account for the lowest
133 S observed in black crusts, this oxidation pathway would
also produce larger 136 S down to −1.50 ‰ at odds with the
136 S reported in the black crust. Their potential combina-
tion cannot account for sulfate aerosol data from the litera-
ture (Au Yang et al., 2019; Guo et al., 2010; Lin et al., 2018b;
Romero and Thiemens, 2003; Shaheen et al., 2014) or for the
black crust as it would result in slightly negative 133 S–136 S
values that could not explain the 133 S as low as −0.34 ‰
(yellow frames in Fig. 6). Available literature data are there-
fore not consistent with the anomalous 133 S–136 S values
recorded in black crust sulfates.
Mass-dependent processes can also result in small 133 S–
1 S variations, depending on the magnitude of the 34 S frac-
36
tionation (Ono et al., 2006a). As mentioned in Sect. 5.1.2,
a mixing between a 33,34 S-depleted end-member (An) con-
sisting of anthropogenic sulfur (δ 34 S = −3 ‰, 133 S = 0 ‰)
and a 33,34 S-enriched sulfates end-member (CAS/PL) from
plaster or CAS (δ 34 S = 18 ‰, 133 S = 0 ‰) would result in
small 133 S values of −0.01 ‰ for 50 % mixing, which is far
from the maximum measured 133 S of ∼ −0.34. Moreover,
the slope between 133 S–136 S would be about −7, which is
Figure 6. 133 S and 136 S of the black crust, compared to sul- at odds with our observations. Therefore, we conclude that
fates formed by different oxidation pathways and by a mixing mixing cannot account for the black crust 133 S–136 S varia-
of them in the proportions estimated by Sofen et al. (2011). tions.
We took 33 βH2 O2 /O3 = 0.511, 33 βOH = 0.503, 33 βO2 TMI = 0.498
(for T < 20 ◦ C), 33 βO2 TMI = 0.547 (for T > 20 ◦ C), 33 βNO2 = 5.2.2 A new oxidation pathway implying magnetic
0.514 and 36 βH2 O2 /O3 = 1.82, 36 βOH = 1.97, 36 βO+2 TMI = 1.98 isotope effect
(for T < 20 and T > 20 ◦ C), and 36 βNO2 = 1.90 (Au Yang et al.,
2018; Harris et al., 2013b). As 33 βO3 and 36 βO3 are unknown, we Several studies proposed that positive 133 S measured in sul-
modified the proportions by Sofen et al. (2011) as follows: 27 % fate aerosols, with 133 S up to 0.5 ‰, from, for example, East
OH, 18 % O2 TMI, 55 % H2 O2 , and 0 % O3 . The urban aerosol iso- China and California could result from stratospheric fallout
topic compositions are a compilation from Au Yang et al. (2019); of SO2 (with 133 S potentially up to 10 ‰ higher; Ono et al.,
Guo et al. (2010); Lin et al. (2018b); Romero and Thiemens (2003); 2013), which underwent UV photolysis by short-wavelength
and Shaheen et al. (2014), while the combustion process reflects radiation (Romero and Thiemens, 2003; Lin et al., 2018a,
samples from Lee et al. (2002). Modeled 133 S–136 S values of cu- b). This suggestion primarily relies on the similarities be-
mulated black crusts (BC) sulfates – formed by SO2 wet and dry tween 133 S–136 S values of sulfate aerosols and laboratory
deposition with a magnetic isotope effect (MIE; 33 S depletion com- experiments of SO2 photolysis conducted at different wave-
pared to initial SO2 with constant negative 136 S) and of cumulated
lengths (Romero and Thiemens, 2003) and on the correla-
secondary aerosols formed by SO2 oxidation by O3 , O2 TMI, OH,
tion between 35 S-specific activity and 133 S values (Lin et
and H2 O2 (33 S enrichment compared to initial SO2 ) from an initial
SO2 with 133 S–136 S = 0 ‰ – are reported with corresponding β al., 2018b). However, these studies never addressed the ab-
exponents (see Sect. 5.2.2 for model explanation). Residual SO2 sence of the complementary negative 133 S reservoir, which
and global cumulated BC plus secondary aerosol isotopic composi- is required to balance the positive 133 S reservoir (see Au
tions were not reported for better readability. Percentages indicate Yang et al., 2019). In this respect, it is worth mentioning that
the fraction of produced cumulated BC and secondary aerosols. volcanic and stratospheric aerosols trapped in Antarctic ice
cores (see Gautier et al., 2018, and references therein) show
both positive 133 S (up to ∼ 2 ‰) and complementary nega-
(see caption text). We also used NO2 values (Au Yang et al., tive 133 S values (down to −1 ‰) and weighed average 133 S
2018) and T -dependent equations determined by Harris et 6 = 0 ‰ explained by prior partial deposition. Stratospheric
al. (2013b) to calculate each 34 α with initial sulfur dioxide fluxes are actually too low to account for 133 S > 0.1 ‰ (Lin
133 S and 136 S of 0 ‰ (Lin et al., 2018b). As mentioned et al., 2016; Au Yang et al., 2019). Accordingly, some other
earlier (Au Yang et al., 2018; Harris et al., 2013b), none of authors rather tried to explain the positive anomalies of most
these models can account for anomalous 133 S–136 S values aerosols with “tropospheric” chemical reactions, which are
Atmos. Chem. Phys., 20, 4255–4273, 2020 www.atmos-chem-phys.net/20/4255/2020/I. Genot et al.: Oxygen and sulfur mass-independent isotopic signatures 4267 SO2 oxidation by the main oxidant including NO2 , H2 O2 , The magnetic effect could occur on a surface such as on OH, O3 , and O2 TMI, but experimental data result in a max- mineral dust suspended in the atmosphere during aerosol for- imum 133 S values of ∼ 0.2 ‰ for all studied reactions (Au mation, leading to residual 33 S-depleted atmospheric SO2 Yang et al., 2018; Harris et al., 2013b). Isotope effects asso- from which black crusts would subsequently form. This ciated with SO2 oxidation by minor species, such as Criegee model would, however, predict that some sulfate aerosols radicals, remains to be investigated (Au Yang et al., 2018). In subsequently formed to display negative 133 S values: such summary, whatever the stratospheric vs. tropospheric origin values are extremely uncommon, being primarily restricted of positive 133 S values recorded by most aerosols, there is to the Beijing winter months (Han et al., 2017). Instead, a 33 S isotope imbalance and a missing reservoir with nega- the magnetic effect could occur during black crust forma- tive 133 S that must exist. Han et al. (2017) reported 133 S tion, on the carbonate building stone, leading to residual 33 S- values down to −0.6 ‰ in sulfate aerosols from Beijing. enriched atmospheric SO2 from which tropospheric aerosols As discussed above, the authors’ suggestion calling for low- would subsequently be formed, which is consistent with temperature combustion is little supported by available data, available observations. This model would, however, predict and clearly the very restricted location and time interval, over some black crust subsequently formed to display positive a month, where these anomalies occurred cannot counter- 133 S: such values have not been found yet and this may balance, both spatially and temporally, the common positive well reflect sample bias, with our data being the first reported 133 S values of most aerosols; the missing reaction or reser- for such samples. Both scenarios imply nonzero 133 S val- voir requires, instead, to be ubiquitous worldwide. ues of residual atmospheric SO2 , which contrast with the In this study, black crust sulfates display negative 133 S data by Lin et al. (2018b) showing 133 S of ∼ 0 ‰ (n = 5, values (from ∼ 0 ‰ down to −0.34 ‰). These values are 133 S varying from −0.04 ‰ to 0.01 ± 0.01 ‰). Given that, certainly produced by tropospheric chemical reactions. Oth- in the study of Lin et al. (2018b), SO2 was sampled close to erwise, they would have, according to the stratospheric ori- the third largest Chinese megacity, such nonzero 133 S val- gin model, the same sign as those measured among aerosols. ues may thus be rather symptomatic of emitted (i.e., anthro- Furthermore, the chemical reactions (or reaction) involved in pogenic) SO2 rather than residual or background (i.e., after the formation of black crusts must be distinct compared to significant black crust and aerosols formation). SO2 in the those leading to the formation of tropospheric aerosols. As Paris Basin still has to be measured to confirm this assump- developed thoroughly, black crusts could well represent the tion, but, so far, this could be consistent with the interpre- missing sulfur reservoir. tation that nonzero 133 S values of residual or background An additional observation is that negative 133 S values atmospheric SO2 are erased by anthropogenic SO2 having occur with near-constant 136 S (from −0.76 ‰ to −0.22 ± zero 133 S values (Au Yang et al., 2019) moving towards the 0.20 ‰; Fig. 6). This signature is typical of the magnetic local source(s) of anthropogenic SO2 . isotope effect (MIE), which involve a radical pair, where In the absence of additional observations, proposing a coupling between the nuclear magnetic moment of the nu- chemical reaction, and hence a radical pair that breaks and cleus of odd isotopes and the electron occurs, allowing for recombines, would be very speculative, but our data clearly electron spin transition from singlet to triplet (or vice versa) point towards the occurrence of a magnetic effect during (Buchachenko et al., 1976). This leads to distinct half-lives the formation of black crusts, involving ubiquitous hetero- between odd and even isotopes, resulting in specific odd geneous chemical reactions. This is supported by previous over even isotope enrichment (or depletion). MIE has been recognition of sulfur radicals such as SO−x (Herrmann, 2003) so far reported for various reactions occurring on a surface or S–S (see Babikov, 2017. But note that their 136 S/133 S (Buchachenko, 2001, 2000; Turro, 1983) such as sulfate ther- slope is distinct from ours). Clearly, the reaction does not mochemical reduction (Oduro et al., 2011) or Fe reduction occur after sulfate formation such as during dissolution– in magneto-tactic bacteria (Amor et al., 2016), which are the precipitation mechanisms, which do not involve any radical most geologically relevant. It is worth pointing out that MIE species. As mentioned above, magneto-tactic bacteria can could also be responsible for positive 117 O values measured produce MIE when reducing Fe (Amor et al., 2016). With in black crusts, i.e., as opposed to the 117 O anomaly be- microbial activity being sometimes present on black crusts ing inherited from SO2 oxidants. However, Lee et al. (2002) (Gaylarde et al., 2007; Sáiz-Jiménez, 1995; Scheerer et al., also measured the O multi-isotope compositions of sulfate 2009; Schiavon, 2002; Tiano, 2002), the involvement of mi- aerosols (i.e., from the atmosphere as opposed to reaction on croorganisms, affecting only the sulfur isotopes as the most a solid substrate) from Paris and obtained 117 O = 0.2 and negative 133 S, does not correspond to the most negative 0.8 ‰ for the Paris highway and in the 13th zone, respec- 117 O, which represents another possibility to investigate. tively, which is in good agreement with our three samples Another implication that can be tested in future work is that collected in Paris (from 0.17 ‰ to 0.89 ‰). Thus, this is con- the kinetics of heterogeneous reactions leading to sulfate and sistent with black crust formation recording mostly an atmo- black crust formation should be comparable or faster than spheric signal and no significant magnetic isotope effect on those leading to aerosol formation. So far, Li et al. (2006) 117 O. showed comparable loss of atmospheric SO2 by heteroge- www.atmos-chem-phys.net/20/4255/2020/ Atmos. Chem. Phys., 20, 4255–4273, 2020
You can also read