Pacific Region E-commerce Assessment - December 2020
←
→
Page content transcription
If your browser does not render page correctly, please read the page content below

E-commerce
Assessment
December 2020

Pacific Region
© Copyright Pacific Islands Forum Secretariat, 2020

       ISBN 978-982-202-071-7

     Supported by

     Disclaimer

     This publication was commissioned as an independent
     consultancy report at the initiative of the Pacific Islands
     Forum Secretariat (PIFS). The publication is supported by
     the TradeCom II Programme Management Unit (TCII PMU) an
     OACPS managed and European Union (EU) funded Programme.
     While this assessment draws on the United Nations Conference
     on Trade and Development (UNCTAD) eTrade Readiness
     Assessment methodology, UNCTAD has not been involved in
     conducting this report.

     The views and opinions presented in this report are those of
     the author(s) and should not be attributed to the institutions
     supporting the study. The institutions bear no responsibility for
     the accuracy of the facts represented in this report.

ii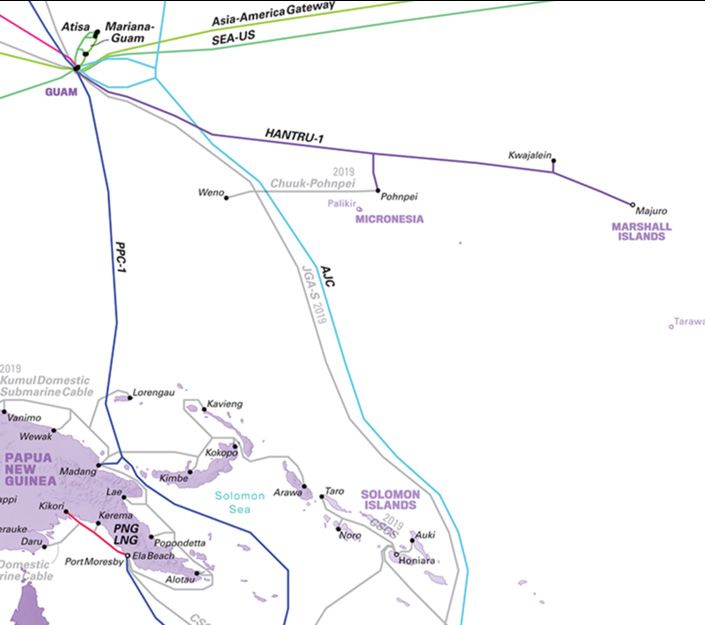
Preface by Zarak Khan,
Director Programs and Initiatives,
Pacific Islands Forum Secretariat

This regional report represents an important milestone of Secretariat’s
work on E-commerce, also known as Pacific E-commerce Initiative.

In line with 2018 determinations by Forum Trade Officials, the Secretariat has worked relentlessly to support
analytical and policy work aimed at improving E-commerce readiness in the Pacific region. It has done so
by facilitating approval of Enhanced Integrated Framework (EIF) funding for E-Trade Readiness Assessments
undertaken by the United Nation Conference for Trade and Development (UNCTAD) in our Least Developed
Country Members, and by securing additional funds and overseeing the development of E-commerce
Assessments in additional five Members.

As of November 2020, ten Forum Island Countries (FIC) have finalised reports assessing challenges and
proposing solutions to promote digital trade in their respective territories. Besides providing guidance
for country-level action, these national assessments have served as a robust evidence-base for the
development of the Regional E-commerce Assessment which is included in this publication.

All the assessments undertaken so far draw on the test UNCTAD methodology, which focuses on seven key
areas of critical importance for cross-border and domestic E-Commerce development:

•   E-Commerce policies and strategies;
•   Legal and regulatory frameworks;
•   ICT infrastructure and E-Commerce support services ecosystem;
•   Trade facilitation and logistics ecosystem;
•   Payment solutions for E-Commerce;
•   Access to financing initiatives in E-Commerce; and
•   E-Commerce skills development.

Consultations shall soon commence for the drafting of our Regional E-commerce Strategy and Roadmap,
with the view of identifying and agreeing priority actions where regional collaboration, harmonization, and
integration can lead to marked improvements in our collective readiness to trade digitally.

I wish to extend my sincere gratitude to the hundreds of stakeholders that over the past few year have
pro-actively contributed to our Pacific E-commerce Initiative, and I am looking forward to their further
engagements in the months to come.

Zarak Kahn
Director Program and Initiatives,
Pacific Islands Forum Secretariat

                                                                                                                2
Foreword by Dame Meg Taylor,
    Secretary General,
    Pacific Islands Forum Secretariat

    E-Commerce features as a key regional priority in the Pacific Aid-for-Trade
    strategy 2020-2025. To achieve this priority, the Pacific Islands Forum
    Secretariat has taken the lead in supporting Forum Islands Countries (FICs) in
    their efforts to take part in the global digital revolution.

    Indeed, E-Commerce presents an unprecedented opportunity to increase trade of the FICs, narrow
    distances and reduce trade costs among Forum Members, and between the Blue Pacific and the rest of the
    world. With conducive policy environment, E-Commerce presents opportunities for Members to explore
    new ways of doing business, trading and to increase the diversification of their economies towards new
    sectors such as services and creative industries. Importantly, strengthening E-commerce readiness has
    become essential particularly as the world continues to grapple with what a post-COVID economy work
    look like and operate as.

    The major investment in submarine cables across the region has made the internet faster and more
    accessible to a growing number of Pacific people, however, its full potential has yet to be realised. The
    key to supporting a vibrant e-commerce sector in the Pacific is providing more reliable and affordable
    access to the internet including for small and micro-enterprises as well as the emerging women and youth
    entrepreneurs.

    From its beginning in 2017, the Pacific E-commerce Initiative promoted by the Secretariat has progressively
    strengthened, thanks to the steadfast commitment of our Members and the support of like-minded
    technical agencies and donor partners. The direction provided by our Members, for all Forum Island
    Countries to benefit from national e-commerce assessments as the first step towards developing a Regional
    E-Commerce Strategy, continues to progress.

    This Regional Assessment Report consolidates the findings from the national assessments conducted so
    far by the PIFS and the UNCTAD, including anecdotal evidence from other reputable sources. By doing so,
    this knowledge product provides a sound springboard for the development of a regional consensus on
    E-commerce through the development of a Regional E-Commerce Strategy and Roadmap, which will be
    the key focus for 2021.

    We will continue working in close cooperation with all partners of the Pacific E-commerce Initiative, including
    national governments, private sector, regional and international organisations, and development partners.

    We will aim for a Strategy and Roadmap focussing on areas where regionalism can most effectively
    complement national efforts to improve E-commerce readiness, thus ensuring full alignment between the
    work on E-commerce and our Leaders’ directions as enshrined in the Framework for Pacific Regionalism.

    Finally, may I acknowledge the TradeCom II – an OACPS Secretariat managed and European Union funded
    programme for its support in the development of this Regional E-Commerce Assessment.

    Meg Taylor, DBE
    Secretary General of the Pacific Islands Forum

3
Acknowledgements

The Regional E-Commerce Assessment was prepared by Paul Baker and Pablo Quiles from International
Economics Consulting Ltd, under the overall guidance and supervision of Her Excellency Ambassador
Mere Falemaka and Dr Andrea Giacomelli from the Pacific Islands Forum Secretariat (PIFS).

The EU provided funding for this assessment, through the OACPS Secretariat and the TradeCom II Facility.
The Assessment team would like to show its appreciation of the TradeCom II PMU Staff for the continued
support during the project implementation.

The Assessment benefitted from inputs by numerous institutions from both the public and private sectors.
The Assessment team wishes to thank all institutions that reviewed and provided feed-back on the
Assessment, including but not limited to the Commonwealth Secretariat, the United Nations Economic
and Social Commission for Asia and the Pacific, the Oceania Customs Organization, the Pacific Financial
Inclusion Program, the United Nations Conference for Trade and Development, the Universal Postal Union,
the World Trade Organization, Trade Ministries of Forum Members.

The Assessment team wishes to also thank all participants who attended and provided feedback during the
regional E-commerce workshop organised by the PIFS on 3 November 2020.

                                                                                                           4
Contents

    Preface by Zarak Khan, Director Programs and Initiatives, Pacific Islands Forum Secretariat   2

    Foreword by Dame Meg Taylor, Secretary General, Pacific Islands Forum Secretariat            3

    Acknowledgements                                                                              4

    Contents                                                                                      5

    Abbreviations                                                                                 9

    Executive Summary                                                                            13

    1     E-COMMERCE LANDSCAPE                                                                    15
    1.1   Introduction to the Pacific Island context                                              15
    1.2   Regional E-commerce landscape                                                           16

    2     E-COMMERCE POLICIES AND STRATEGIES                                                      19
    2.1   Regional policies related to ICT, E-government, and E-commerce                          19
    2.2   Trade policies related to E-commerce                                                    21
    2.3   Availability of relevant statistics                                                     23
    2.4   Summary of recommendations from country assessments                                     23

    3     ICT INFRASTRUCTURE AND E-COMMERCE SUPPORT SERVICES ECOSYSTEM                            24
    3.1   Broadband, mobile, and smartphone penetration                                           24
    3.2   Reliability, affordability, latency, speed and coverage                                 26
    3.3   Major infrastructure projects                                                           28
    3.4   ICT Services                                                                            31
    3.5   Summary of recommendations from country assessments                                     32

    4     TRADE LOGISTICS AND TRADE FACILITATION ECOSYSTEM                                        34
    4.1   Mode of delivery, last-mile delivery, traffic and regulations                           34
    4.2   Trade Facilitation                                                                      39
    4.3   Summary of recommendations from country assessments                                     46

    5     PAYMENT SOLUTIONS FOR E-COMMERCE                                                        48
    5.1   Banking Penetration                                                                     48
    5.2   Main mobile, cashless payment solutions available                                       53
    5.3   Summary of recommendations from country assessments                                     57

    6     LEGAL AND REGULATORY FRAMEWORK                                                          58
    6.1   Adoption of E-commerce legislation                                                      58
    6.2   Summary of recommendations from country assessments                                     63

    7     E-COMMERCE SKILLS DEVELOPMENT                                                           64
    7.1   Skills gap identification                                                               64
    7.2   Overview of the basic education landscape                                               65
    7.3   Availability of tertiary education, professional training                               68
    7.4   Business incubators and business accelerators                                           70
    7.5   Summary of recommendations from country assessments                                     73

5
8 ACCESS TO FINANCING INITIATIVES FOR E-COMMERCE 75
8.1 Financing by banks and microfinance Institutions 75
8.2 Financing through other initiatives 79
8.3 Financing by development partners 79
8.4 Summary of recommendations from country assessments 80
References 82
Annex 1: Key financial regulatory aspects in the Forum Islands Countries 90
6List of Boxes
Box 1: The Value of PACER Plus for E-commerce 21
Box 2: Southern Cross Cable Network (expected in 2022) 30
Box 3: E-government in Fiji: digitalFIJI 33
Box 4: Definitions of KYC, AML, and CFT 51
Box 5: Definitions of Regulatory Sandbox and National Switch 52
Box 6: State of Digital Financial Services in the Pacific Islands 54
Box 7: Core E-commerce Legislation 58
Box 8: ITU’s ICT Regulatory Tracker 59
Box 9: United Nations Conventions and Model Laws on Electronic Commerce 63
Box 10: Defining ICT competences 64
Box 11: Key Concepts: Incubators and Accelerators 70
Box 12: Incubators and Accelerators in the Pacific 71
List of Figures
Figure 1: Individuals using the internet in 2010-2017 and Secure Internet Servers in 2019 24
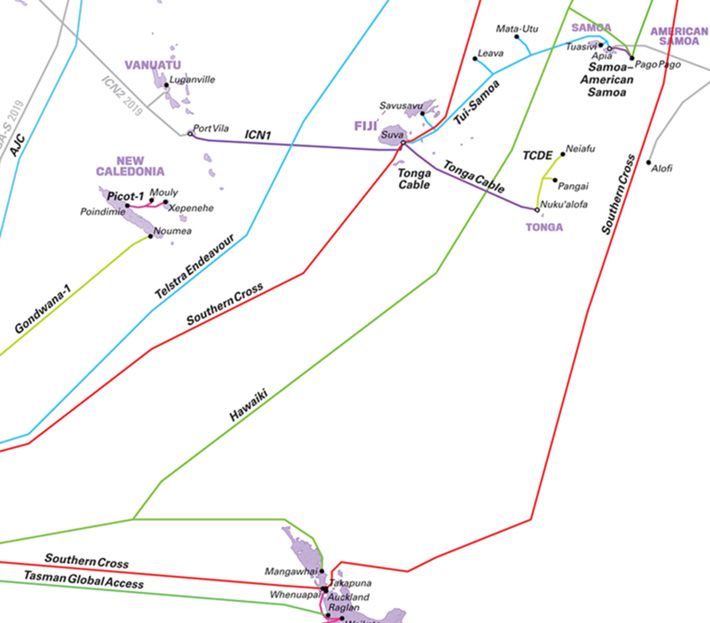
Figure 2: Submarine Cables in the Pacific 29
Figure 3: Number of mobile operators across the Pacific 31
Figure 4: Trading Across Borders Score in FICs 39
Figure 5: Time to export in FICs (hours) 40
Figure 6: Cost to export in FICs (USD) 41
Figure 7: Time to import in FICs (hours) 41
Figure 8: Cost to import in FICs (USD) 42
Figure 9: OECD Trade Facilitation indicators of selected FICs and the Pacific region 42
Figure 10: Digital and Sustainable Trade Facilitation in Pacific Islands Developing Economies (2019) 44
Figure 11: Trade facilitation implementation by FICs between 2017 and 2019 44
Figure 12: Banking penetration in Forum Islands Countries 49
Figure 13: Number of commercial bank branches and ATMs per 100,000 adults, by country 50
Figure 14: Percentage of the population owning credit/debit cards by country 56
Figure 15: Merchant payments by electronic mean in Fiji 57
Figure 16: Adoption of E-commerce Legislation Worldwide 60
Figure 17: Adoption of E-commerce Legislation in the Pacific Islands 62
Figure 18: PILNA Results: percentage of students meeting or exceeding minimum expected proficiency levels 66
Figure 19: Domestic credit to private sector (% of GDP) 75
Figure 20: Lending rates Vs Domestic credit to the private sector in select FICs (2018) 76
Figure 21: Number of accounts per 1,000 adults with commercial banks in select FICs in 2018 77
List of Tables
Table 1: Forum Islands Countries-Demographics 15
Table 2: FICs- Economic Indicators 16
Table 3: ICT Rankings for FICs 17
Table 4 Criteria for Selecting National Recommendations 18
Table 5: ICT Policies in the Pacific region 19
Table 6: E-commerce Assessments in the Pacific 20
Table 7: FICs membership in regional trade agreements 22
Table 8: Recommendations on E-Commerce Policies and Strategies 23
Table 9: Mobile cellular subscriptions (percentage of population) 25
Table 10: Fixed broadband subscriptions (per 100 people) 25
Table 11: Cost of 1GB of mobile data, Oceania, 2020 26
Table 12: Cost of a fixed-line broadband package, Oceania, 2020 27
7Table 13: GSMA Mobile Connectivity Index, 2018 27
Table 14: Overview of internet coverage in the Pacific 28
Table 15: Submarine Cables in the Pacific 30
Table 16: UN E-government Survey Rankings, 2020 32
Table 17: E-government landscape in the Pacific 32
Table 18: Recommendations on ICT Infrastructure and E-Commerce Support Services Ecosystem 33
Table 19: Key logistics in the FICs 34
Table 20: Number of ship arrivals in the Pacific in 2018 35
Table 21: Liner Shipping Connectivity Index, 2015-19 35
Table 22: Charges of shipping to and from Pacific Countries: DHL Express 36
Table 23: Charges of shipping to and from Pacific Countries: Postal Express Mail Services, December 2020 37
Table 24: Integrated Index for Postal Development (2IPD) in Pacific countries 37
Table 25: Postal Services in select FICs 38
Table 26: Physical Postal Systems in FICs 38
Table 27: OECD Trade facilitation indicators in FICs 43
Table 28: FICs International Memberships 46
Table 29: Recommendations on Trade Logistics and Trade Facilitation Ecosystem 46
Table 30: List of banks in the Pacific Islands 48
Table 31: Digital Financial Services in the Pacific Islands 53
Table 32: Use of mobile money in the Pacific Islands 55
Table 33: Recommendations on Payment Solutions for E-commerce 57
Table 34: ICT Regulatory Tracker 2018 59
Table 35: E-Commerce Regulations in Forum Island Countries 60
Table 36: Recommendations on Legal and Regulatory Framework 63
Table 37: Total net enrolment rate, primary, both sexes (%) 65
Table 38: Adult literacy rate, population 15+ years, both sexes (%) 66
Table 39: Percentage of teachers in primary education who are qualified, both sexes (%) 67
Table 40: Percentage of teachers in secondary education who are qualified, both sexes (%) 67
Table 41: Universities in FICs 68
Table 42: Business incubators and accelerators in the Pacific 72
Table 43: Recommendations on E-Commerce Skills Development 73
Table 44: Getting Credit ranking in FICs 78
Table 45: Access to credit facilities by businesses in the Pacific 78
Table 46: Aid for Trade in E-commerce areas 80
Table 47: Recommendations on Access to Financing Initiatives for E-Commerce 80
8Abbreviations
2G Second-generation cellular network
2IPD Integrated Index for Postal Development
3G Third-generation cellular network
4G Fourth-generation cellular network
ADB Asian Development Bank
AFI Alliance for Financial Inclusion
AML Anti-Money Laundering
APG Asia Pacific Group on Money Laundering
ASYCUDA Automated System for Customs Data
ATM Automated Teller Machines
ATS Automated Transfer System
AUF Agence Universitaire de la Francophonie (Vanuatu)
B2C Business to Consumer
BSP Bank South Pacific
CBRs Correspondent Banking Relationships
CDD Customer Due Diligence
CFT Combating the Financing of Terrorism
COM-FSM College of Micronesia
CPSC Central Pacific Shipping Commission
CROP Council of Regional Organisations in the Pacific
DFS Digital Financial Services
DTT Department of Transport and Telecommunications, FSM
EDI Electronic Data Interchange
EGDI E-Government Development Index
EMIS Education Management Information System
EPA Economic Partnership Agreement
EU European Union
EU-TRA2 European Union Trade-Related Assistance Programme (PNG)
FAIDP Framework for Action on ICT for Development in the Pacific
9FATF Financial Action Task Force
FFA Forum Fisheries Agency
FIC Forum Island Countries
FICs Forum Islands Countries
FIT Fiji Institute of Technology
FNU Fiji National University
FSM Federated States of Micronesia
G2B Government-to-Business
G2C Government-to-Citizen
G2E Government-to-Employee
G2G Government-to-Government
GATT General Agreement on Tariffs and Trade
GB gigabyte
GDP Gross Domestic Product
GOS Global Outsourcing Services
HCI Human Capital Index
ICT Information and Communications Technology
IFC International Finance Corporation
ILO International Labour Organisation
IMF International Monetary Fund
ISCED International Standard Classification of Education
ISI ICT Skills Indicator
IT Information Technology
ITU International Telecommunications Union
JICA Japan International Cooperation Agency
KCCI Kiribati Chamber of Commerce & Industry
KIT Kiribati Institute of Technology
KM Kilometre
KYC Know Your Customer
LDC Least Developed Country
LSCI Linear Shipping Connectivity Index
MCIC Ministry of Commerce, Industry and Cooperatives (Kiribati)
10MCTT Ministry of Communications, Transport and Tourism (Tuvalu)
MELAD Ministry of Environment, Lands and Agricultural Development (Kiribati)
MFMRD Ministry of Fisheries & Marine Resource Development (Kiribati)
MFTA Melanesian Free Trade Agreement
Ministry of Meteorology, Energy, Information, Disaster Management, Climate Change and
MMEIDCC
Communication (Tonga)
MNO Mobile Network Operators
MSG Melanesian Spearhead Group
MSME Micro Small and Medium Enterprise
MTC Ministry of Transportation and Communication (Kiribati)
NiDC Niue Island Information, Technology & Communication and Development Council
NSO National Statistics Office
OCGIO Office of the Governments Chief Information Officer
ODA Official Development Assistance
OECD Organisation for Economic Co-operation and Development
OECD Organisation for Economic Co-operation and Development
OSI Online Services Index
PACER Pacific Closer Economic Relations
PACER Plus Pacific Closer Economic Relations Plus Agreement
Pacific TAFE Pacific Technical and Further Education
PacLII Pacific Islands Legal Information Institute
PAFTS Pacific Aid for Trade Strategy
PFTAC Pacific Financial Technical Assistance Centre
PIAAC Programme for the International Assessment of Adult Competencies
PICTA Forum Islands Countries Trade Agreement
PIDP Pacific Islands Development Programme
PIFS Pacific Islands Forum Secretariat
PILNA Pacific Island Literacy and Numeracy Assessment
PIRI Pacific Islands Regional Initiative
PIRRC Pacific ICT Regulatory Resource Centre
PITA Pacific Islands Telecommunications Association
PNG Papua New Guinea
POS Point of Sale
11PPA Pacific Power Association
PPP Purchasing Power Parity
PREL Pacific Resources for Education and Learning
PRIF Pacific Region Infrastructure Facility
PRIP Pacific Regional Integration Programme
PRISAP Pacific Regional ICT Strategic Action Plan
PSR Product Specific Rules
PTC Pacific Telecommunications Council
RMI Republic of the Marshall Islands
ROO Rules of Origin
SCCN Southern Cross Cable Network
SIDS Small Island Developing States
SOPAC South Pacific Applied Geoscience Commission
SPARTECA South Pacific Regional Trade and Economic Cooperation Agreement
SPC Pacific Community
SPREP Secretariat of the Pacific Regional Environment Programme
SPS Sanitary and Phytosanitary
SPTO South Pacific Tourism Organisation
TFA Trade Facilitation Agreement
TII Telecommunication Infrastructure Index
TMPI Tonga Maritime Polytechnic Institute
TPL Third-Party Logistics
TVET Technical Vocational Education and Training
UN United Nations
UNCITRAL United Nations Commission on International Trade Law
UNCTAD United Nations Conference on Trade and Development
UNESCO United Nations Educational, Scientific and Cultural Organisation
UPU Universal Postal Union
USD United States Dollar
USP University of the South Pacific
WCO World Customs Organisation
WTO World Trade Organisation
12Executive Summary
Overall, the Information, Communication and Technology (ICT) revolution has brought rapid growth of the ICT
sector in Pacific economies. A number of factors are driving this revolution especially the de-regulation and
liberalisation of the telecommunications sector throughout the Pacific in the 2000s. ICT penetration has also
been increasing and has been greater in countries with a larger urban population as compared to countries
with a majority rural population. The global mobile phone uptake has found its way into the Pacific with
mobile penetration increasing rapidly. While fixed-line communications growth has been stagnant, mobile
internet has led to a rapidly growing ICT sector in most Forum Island Countries (FICs). The ICT revolution
is particularly transformative due to its potential to address the region’s demographic, geographic and
economic challenges. The sparsely populated region of 14 culturally diverse, small developing countries and
territories has a combined population of around eleven million. Most of this population is dispersed through
hundreds of islands within an area of almost one third of the globe’s surface, thus distancing the region from
global economic centres. Challenges such as these can be addressed through ICT advancements and in
turn through E-commerce adoption.
In this context, E-commerce holds immense potential for the Pacific region, in particular, to help overcome
the main challenges of remoteness from the main international markets, poor connectivity between and
within the FICs, and lack of economic opportunities for disadvantaged rural communities.
A number of regional initiatives have been put in place to leverage E-commerce potential. For example,
the Pacific Islands Information and Communication Technologies Policy and Strategic Plan (2002) and the
Pacific Plan Digital Strategy (2005) were the first ICT-centred plans, followed by the 2010 Framework for
Action on ICT for Development in the Pacific (FAIDP). In 2016, the Council of Regional Organisations of the
Pacific’s (CROP) ICT Working Group developed the Pacific Regional ICT Strategic Action Plan (PRISAP)
2015-2020 for better utilisation of ICT in the region. At country level, all FICs except Nauru and Niue have
already adopted dedicated policies for ICT development. However, many significant gaps remain in terms
of policy implementation and progress tracking.
In terms of regional infrastructure, submarine cables have been the primary drivers of internet connectivity,
whereas, satellite connectivity remains prominent for calling and voice services, and for the provision of
internet to the most remote areas. The adoption of ICT has grown rapidly from around 12 percent of the
population using the internet in 2010 to over 35 percent in 2017. This was fuelled by high mobile services
adoption in the region thanks to the lower prices and higher speed mobile data. Overall, the ICT ecosystem
is at different stages of development throughout the Pacific, despite ICT infrastructure projects being
carried out in the whole region. ICT-enabled services such as E-commerce and E-government are growing
slowly, and in most countries and are still at a nascent stage. COVID-19 has spurred a sudden peak in
E-commerce uptake globally, which has also been witnessed across the region.
Despite the good progress made, significant challenges remain. While essential trade connectivity throughout
the region is enabled by shipping routes with major international trading partners for all categories of cargo,
freight rates in the Pacific region remain high by international standards. Home deliveries, quintessential for
E-commerce, are not always an option, with more than 60 percent of the FICs’ population still having to
collect mail from a postal establishment. Generally, the FICs have high border and documentary compliance
times for both importing and exporting. Along with this, trade costs are among the highest in the world when
measured as a proportion of total trade values.
The region’s environment for payment solution is still embryonic. Most FICs are still heavily cash-based
economies, with cash being the main payment method used by individuals and businesses. Access to
formal financial services is relatively low compared to the world average. This is mainly due to small markets,
difficult terrain and poor infrastructure, high cost of serving remote areas, low-income customers,
13and high cost of service. Additionally, lack of interoperability among financial service provider platforms,
lack of standardised agent management practices, undeveloped consumer protection, low financial
literacy, and lack of trust from consumers in financial products also pose challenges to the adoption of
mobile money and other cashless payment solutions necessary for E-commerce to grow.
The regulatory frameworks for financial services are at different stages across the Pacific. Most countries lack
basic E-commerce-related regulations. Data protection and privacy laws, though sometimes prescribed
under domestic telecommunication acts, have not been officially made into law in all FICs, and laws on
electronic transactions, consumer protection, and cybercrime, are either absent or generally outdated, with
some of them having been enacted more than two decades ago.
In terms of digital skills and the related digital literacy, the FICs as a whole are facing significant challenges.
The development of ICT skills is hindered by factors such as outdated curricula in schools and universities,
lack of mainstreaming ICT in non-ICT educational subjects, and in some countries, by the lack of awareness
about digital skills requirements. Many FICs suffer from the poor basic education. While FICs have achieved
substantial progress in access to primary education, significant challenges remain, such as low access to
quality early childhood education, and equity gaps that prevent children in outer islands from accessing
schools.
Finally, overall financial inclusion in the Pacific region is low, especially due to geographic remoteness, low
financial and technological literacy and limited digital infrastructure. These challenges make it harder for
businesses in the region to access credit facilities, with domestic credit extended towards the private
sector varying greatly. Along with formal financial institutions there are a number of business incubators
and accelerators at country level that provide some financing opportunities for the private sector. Various
schemes with extending finance at low or zero interest rates, and providing business grants also exist that
are aimed at encouraging entrepreneurship and youth development in the region.
Overall, E-commerce in the Pacific is at a nascent stage. While some sectors and countries are observing
growth in activity, for E-commerce to flourish, the crucial constraints highlighted in this report should be
addressed through a comprehensive regional initiative.
A total of ten out of fourteen Forum Island Countries have undergone rapid diagnostic assessments between
2017 and 2020. The common recommendations from those studies are summarised in this document, at the
end of each chapter.
141
E-COMMERCE
LANDSCAPE
1.1 Introduction to the Pacific Island context
The Forum Island Countries (FICs) are scattered over a vast expanse of the Pacific Ocean and are mainly small, low-
lying coral atoll nations mostly reliant on agriculture, fisheries, and tourism. The region is home to more than 11 million
people, with a rural population of 81 percent. The largest of all FICs is Papua New Guinea (PNG) with the biggest
population and land area. PNG has a total land area of 452,000 square kilometres inhabiting over 8.5 million people.
The country also has the highest share of rural population of all FICs, at 86.9 percent. Following PNG, Fiji has around
900,000 inhabitants, with over 18,000 square kilometres of land. All other FICs are smaller and highly dispersed.
Nauru and Tuvalu are the smallest countries with a land area of only 20 and 30 square kilometres, respectively. Niue
has the smallest population in the region with only 1,624 people residing in the country. These archipelagic FICs are
highly affected by geographic isolation, ecological fragility, limited resources, a narrow economic base, migration, and
financial dependence on a handful of markets, all of which affects their development options.
Table 1: Forum Islands Countries-Demographics
Rural Urban
Land area Rural Urban Population Population
Country Population
(sq. km) Population Population (% of total (% of
population) population)
Cook Is. 240 17,459* 4,347 13,112 24.9 75.1
Fiji 18,270 883,483 386,524 496,959 43.75 56.25
Kiribati 810 115,847 53,220 62,627 45.94 54.06
Marshall Is. 180 58,413 13,417 44,996 22.97 77.03
FSM 700 112,640 87,071 25,569 77.3 22.7
Nauru 20 12,704 0 12,704 0 100
Niue 251 1,624 - - -
Palau 460 17,907 3,594 14,313 20.07 79.93
PNG 452,860 8,606,316 7,472,864 1,133,452 86.83 13.17
Samoa 2,830 196,130 160,356 35,774 81.76 18.24
Solomon Is. 27,990 652,858 497,804 155,054 76.25 23.75
Tonga 720 103,197 79,328 23,869 76.87 23.13
Tuvalu 30 11,508 4,328 7,180 37.61 62.39
Vanuatu 12,190 292,680 218,720 73,960 74.73 25.27
Total 11,082,766 8,981,573 2,099,569
81% 19%
Note: *Population for the Cook Islands is 2016 data. All other data belongs to the year 2018
Source: World Bank World Development Indicators
15Overall, the FICs vary in levels of economic development. Palau has the highest Gross Domestic Product (GDP) per
capita (at Purchasing Power Parity – PPP rate) of over USD 18,000, followed by the Cook Islands at over USD 13,000.
On the other hand, countries like Kiribati and Solomon Islands fare poorly, with GDP per capita as low as USD 2,258.
Table 2: FICs- Economic Indicators
GPD per Gross fixed Ease of School
GDP Trade in Merchandise
capita, capital doing enrolment,
Country (current USD) services trade
PPP formation business Primary
(Mn) (% of GDP) (% of GDP)
(USD) (% GDP) score (% net)
Cook Is 355 16,700 - - - - -
Fiji 5,543 13,808 18 (2017) 43.17 67.93 61.5 96.76
Kiribati 176 2,259 32 (2018) 41.02 66.08 46.9 94.69
Marshall Is 220 3,894 22 (2018) 44.59 52.87 50.9 73.15
FSM 382 3,469 - - 55.73 48.1 85.45*
Nauru 125 11,487 - 43.11 108.05 - 93.69
Niue 25* - - - - - -
Palau 289 18,070 26 (2018) - 57.40 53.7 94.91**
PNG 24,009 4,236 20 (2005) 8.62 59.98 59.8 73.65
Samoa 846 6,329 - 43.78 49.85 62.1 94.86
Solomon Is 1,297 2,365 20 (2016) 26.04 82.33 55.3 72.40
Tonga 530 6,267 27 (2018) 43.51 53.96 61.4 85.94*
Tuvalu 45 3,953 - - 58.70 - 76.24
Vanuatu 904 3,130 27 (2017) 67.54 45.58 61.1 79.84*
Note: GDP data is 2019. PPP, Trade in services, Merchandise trade are 2018 numbers; Ease of doing business score is 2020 data (0 = lowest performance to 100 = best performance); School enrol-
ment from 2016; * Values for 2015 ** Values for 2014
Source: World Bank World Development Indicators and Asian Development Bank. Note: data for Niue is from Niue Statistics Officei and data for Cook Island is from the ministry of Financeii
Pacific economies are highly dependent on trade, and merchandise trade is dominated by imports. Merchandise
trade to GDP ratios range from 45 percent for Vanuatu to over 100 percent for Nauru. Merchandise exports from the
region are dominated by natural resource-based products in both processed and unprocessed forms. FICs are highly
import reliant due to their small size and resource-base. The region’s import basket mainly consists of machinery and
transport equipment, fuel, food products, and manufactured goods.
Services trade averages 40 percent of Pacific economies’ GDP and is dominated by exports, notably export of
tourism-related services (travel and transport).iii
FICs fare relatively well in terms of their business environment compared to other developing countries. The World
Bank’s Doing business indicators of 2020 score ten FICs in terms of ease of doing business. Samoa scores the highest
with 62.1 points out of 100, followed by Fiji at 61.5 points.
FICs have also made progress in education, with net primary enrolment now approaching the target of universal
primary education. However, with persisting difficulties in improving transition to higher levels – net secondary school
enrolment remains between 55 percent and 85 percent.
1.2 Regional E-commerce landscape
The adoption and diffusion of Information, Communication and Technologies (ICT) has brought rapid growth of
digitisation in Pacific economies. Several measures have been taken in strategic areas of digital development, such
as ICT infrastructure and connectivity, policy reforms and sector regulations, at both national and regional level. ICT
connectivity has been increasing throughout the region with the deployment of a number of underwater fibre optic
cables that enable digital services and reduce ICT costs in the Pacific.
16Liberalisation and regulatory reform of the telecommunications sector boosted digital transformation in the region.
Tonga was among the first of the FICs to deregulate its telecoms sector in 2003, followed by most FICs over the
following 15 years. Liberalisation led to a drastic reduction of mobile phone rates, thereby rapidly increasing the number
of subscribers. ICT markets in the region are mostly private sector-led and relatively competitive.
Internet penetration has been greater in countries with a larger urban population. For instance, Nauru has a 100 percent
urban population and one of the highest rates of internet users in the region. On the other hand, PNG, which has an
urban population of only 13 percent, has the lowest internet penetration of around 11 percent of the total population.
While fixed-line communications growth, in particular broadband, has been stagnant, mobile communications
(including internet) have grown rapidly. Mobile penetration in the region is high with over 50 percent of the population
having subscriptions. On the other hand, fixed-line penetration has been extremely low throughout the Pacific. The main
reasons include lower liberalisation of this segment compared to mobile communications, deficiencies in infrastructure
for fixed-line services, and high installation and maintenance costs, which make the mobile technologies more attractive
to the operators.
Table 3: ICT Rankings for FICs
ITU ICT E-Government UPU Postal
Country Development Index Development Index EGDI Level Development Index
Rank 2017 Rank 2020 Rank (2020)
Fiji 107 90 High 123
Kiribati 154 145 Middle 146
Marshall Islands - 156 Middle -
FSM - 161 Middle -
Nauru - 154 Middle -
Palau - 125 High -
Papua New Guinea - 175 Middle 164
Samoa 127 149 Middle 162
Solomon Islands 157 166 Middle 165
Tonga 110 108 High 104
Tuvalu - 151 Middle 150
Vanuatu 141 142 Middle 158
Note: data for Niue and Cook Island is not available
Source: ITU (2017) Global ICT Development Index (https://www.itu.int/net4/ITU-D/idi/2017/index.html), UN (2020) E-Government Development Survey (https://www.un.org/development/desa/publi-
cations/publication/2020-united-nations-e-government-survey), UPU (2019) Postal Development Indicators (https://www.upu.int/UPU/media/upu/publications/postalDevelopmentReport2019En.pdf)
Several development indexes help analyse the E-commerce readiness of FICs. In the ICT Development Index of 2017
compiled by the ITU, Fiji ranks 107th out of 176 countries which is the highest in the region, indicating moderate ICT
development. The E-Government Development Index (EGDI) of the United Nations (UN) classifies three FICs (Fiji, Palau,
and Tonga) as high EGDI-level countries, whereas the rest of the FICs are classified as middle EGDI countries. The
analysis of the Universal Postal Union (UPU) Postal Development Index, which provides information on another important
aspect of E-commerce, shows that six out of eight FICs for which data are available are classified as Least Developing
Operators, the lowest category, while Tonga and Fiji are classified as Potential Performers, the lower-middle category.1
Ten out of fourteen Forum Island Countries have undergone rapid diagnostic assessments between 2017 and 2020.
The recommendations from those studies are summarised at the end of each chapter. While all recommendations were
considered. Table 1 lists the criteria used in selecting those recommendations which are presented in this document.
These criteria mirror those of the Framework for Pacific Regionalism, which was adopted by Pacific Leaders in 2014.
1 The four categories of the Postal Development Index are: Postal Champions, Good Performers, Potential Performers, and Least Developed Operators.
17Table 4: Criteria for Selecting National Recommendations
Tests Criteria
Regionalism The initiative should meet one of the following criteria at a sub-regional or regional level, in support
of national priorities and objectives:
a) Establish a shared norm or standard
b) Establish a common position on an issue
c) Deliver a public or quasi-public good which is regional (or sub-regional) in its scope
d) Realise economies of scale or scope
e) Overcome national capacity constraints
f) Complement national governments where they lack capacity to provide national public goods
like security or the rule of law
g) Facilitate economic or political integration
Benefit The initiative should bring substantial net benefits, as demonstrated by a cost-benefit analysis. The
distribution of benefits across countries and across stakeholders within the region should also be
considered—particularly with respect to:
a) The relative costs and benefits for smaller island states (a “SIS test”).
b) How inclusive the proposal is of all stakeholders who might benefit from regionalism.
Note: Words in Italic have been added by authors and are not part of the source document
Source: Pacific Island Forum Secretariat (2014). The Framework for Pacific Regionalism. PIFS: Fiji
182
E-COMMERCE
POLICIES AND
STRATEGIES
2.1 Regional policies related to ICT, E-government, and E-commerce
E-commerce has been rapidly gaining importance globally as one of the major sources of development from
encouraging Small and Medium Enterprises’ participation in the economy to uplifting rural communities. E-commerce
holds immense potential for the Pacific region, in particular, to help overcome the main challenge of remoteness.
Since the early 2000s, a number of regional policy initiatives have shaped the perspectives of ICT. The Pacific Islands
Information and Communication Technologies Policy and Strategic Plan,iv 2002, and the Pacific Plan Digital Strategy,
2005, were the first ICT-centred plans. The Pacific Digital Strategy was later revised in 2010 as the Framework for Action
on ICT for Development in the Pacific (FAIDP).v The FAIDP eventually informed the work of the CROP ICT Working Group,
which in 2015 developed the Pacific Regional ICT Strategic Action Plan (PRISAP) for the period 2015 to 2020.vi PRISAP
provides guiding principles, identifies regional responsibilities and action themes that are critical to ICT development
in the region. The latter are similar to those typically included in E-commerce assessments and include:
1. Leadership, governance, coordination and partnership;
2. ICT Policy and Legislation;
3. ICT Infrastructure and Universal Access;
4. Cybersecurity and Human Capacity Building;
5. Financing, Monitoring and Evaluation;
6. Social Inclusion and Gender Equality.
Table 4 provides an overview of FICS’ ICT policies, which reveals that most FICs adopted ICT strategies and policies.
While FICs have made substantial progress in developing ICT sector policies, many significant gaps remain in terms of
policy implementation and progress tracking which hamper the utility of these documents. Another challenging issue
is the outdated nature of ICT policies in several countries across the region.
Table 5: ICT Policies in the Pacific region
National ICT Policy Responsible Governance
Country
policies Name Ministry Mechanism
Cook Islands Yes National ICT Policy, 2015-2020 - National ICT Committee
Fiji Yes National ICT Policy, 2004 - ICT Development Unit
Kiribati Yes National ICT Policy, 2011 MTC -
Marshall Islands Yes National ICT Policy, 2018 - -
Federated States of National ICT and
Yes DTT, FSM -
Micronesia Telecommunications Policy, 2012
Nauru No (in progress) - -
19Niue No (in progress) - NiDC
Palau Yes National ICT Policy, 2013-2016 - National ICT Policy Task Force
Papua New Guinea Yes ICT Policy, 2008 - Interagency ICT Task Force
Samoa Yes National ICT Policy, 2012 – 2017 - National ICT Steering Committee
Solomon Islands Yes National ICT Policy, 2017 - ICT Working Group
Tonga Yes National ICT Policy, 2008 MMEIDCC -
Tuvalu Yes National ICT Policy, 2017 MCTT -
Vanuatu Yes National ICT Policy, 2013 OCGIO -
Note: ‘-‘ indicates information is not available
Source: The Commonwealth Secretariat, PIFS, WB, Country Government Websites, ESCAP (2019). Regulatory Policies and ICT Trends, Insights from Timor-Leste
As part of the Pacific E-commerce Initiative, ten FICs have already undertaken E-commerce assessments. UNCTAD
has conducted five FIC eTrade Readiness Assessments, including for Vanuatu, Tuvalu, Samoa, Kiribati and the Solomon
Islands. PIFS has carried out an additional five assessments, including for the Federated States of Micronesia (FSM),
Fiji, Niue, Papua New Guinea (PNG) and Tonga – for Fiji and PNG, these have been conducted in cooperation with the
MSG Secretariat.
Table 6: E-commerce Assessments in the Pacific
Country Report Name Year Sponsor
Cook Islands N/A N/A N/A
Fiji Fiji: National E-Commerce Assessment 2020 PIFS-MSG
Federated States of
FSM: National E-Commerce Assessment 2020 PIFS
Micronesia
Kiribati Kiribati: Rapid eTrade Readiness Assessment 2019 UNCTAD
Marshall Is N/A N/A N/A
Nauru N/A N/A N/A
Niue Niue: National E-Commerce Assessment 2020 PIFS
Palau N/A N/A N/A
PNG PNG: National E-Commerce Assessment 2020 PIFS-MSG
Samoa Samoa: Rapid eTrade Readiness Assessment 2017 UNCTAD
Solomon Is Solomon Islands: Rapid eTrade Readiness Assessment 2018 UNCTAD
Tonga Tonga: National E-Commerce Assessment 2019 PIFS
Tuvalu Tuvalu: Rapid eTrade Readiness Assessment 2019 UNCTAD
Vanuatu Vanuatu: Rapid eTrade Readiness Assessment 2018 UNCTAD
Source: UNCTAD, PIFS
202.2 Trade policies related to E-commerce
Cross-border E-commerce is an avenue for foreign trade expansion and trade diversification. Trade policies and
agreements can be used as a way to accelerate regional and international trade and further leverage E-commerce for
development.
FICs have negotiated a number of regional trade agreements, but it appears that they didn’t create rules on
E-commerce, with the exception of the Melanesian Free Trade Agreement (MFTA). The first regional trade liberalisation
endeavour began in 1981, with the South Pacific Regional Trade and Economic Cooperation Agreement (SPARTECA),
which involved 12 FICs, as well as Australia and New Zealand. This non-reciprocal preferential agreement granted FICs
duty-free access to Australia and New Zealand.vii The Pacific Islands Countries Trade Agreement (PICTA),viii signed in
2001 and progressively implemented from 2007, aimed at liberalising trade in goods between FICs. To date, eight FICs2
have announced their readiness to trade under PICTA.
A number of Pacific Island Countries have also negotiated an Economic Partnership Agreement (EPA) with the European
Union (EU). The agreement was ratified by the EU in January 2011, and by PNG in May 2011. The government of Fiji started
applying the agreement in July 2014. Samoa acceded to the EPA on 21 December 2018 and Solomon Islands on 17 May
2020 and are applying it since then. The EPA is a development-oriented free trade agreement that provides duty-free,
quota-free access for the four EPA Pacific countries’ merchandise exports to the EU. The EPA with the Pacific states
does not cover trade in services, E-commerce nor include any provisions on investment. However, the EPA establishes
the framework for a comprehensive EPA to be developed in the future. For their part, the EPA Pacific countries are
progressively reducing their tariffs on EU imports to zero.ix
The most recent regional trade and development agreement, the Pacific Closer Economic Relations Plus Agreement
Plus (PACER Plus), has been signed in 2017 by Australia, New Zealand and nine FICs,3 and will enter into force on
13 December 2020 – as of October 2020 eight countries have ratified.4 PACER Plus, which replaces the one-way
SPARTECA by reciprocal access rights, covers goods, services, investment, labour, sanitary and phytosanitary (SPS)
measures, aid and some other issues.x Under the PACER Plus, a dedicated development assistance package has the
potential to provide E-commerce related assistance.
Box 1: The Value of PACER Plus for E-commerce
Regional Trade Agreements (RTAs), such as the PACER Plus, contain various provisions on matters relating to,
and enabling, E-commerce matters. This includes, importantly, rules and commitments on trade in services that
encompass critical digitally-enabling services, such as telecommunications, computer, or payment services, as
well as a vast array of digitally-enabled services, including professional and other business services or distribution
services.
Rules and commitments in this area can provide the necessary transparency, predictability and competitive
environment to help attract investment in these digital services and allow these sectors to grow, facilitate access
to efficient and quality digital services by consumers and companies, and provide export opportunities for such
services throughout the region.
Also of note, are specific obligations on the regulation of the telecommunication sector (the so-called Reference
Paper), which most FICs have contracted through their services schedule in the context of the PACER Plus
Agreement. These rules, based on international best practices, help ensure adequate regulation of the telecom
sector, helping to lower costs of telecom services, to facilitate competition and access to such services, thereby
facilitating the supply of services over digital networks. The above-mentioned provisions covering digital services
are not contained in E-commerce chapters of RTAs; but without such provisions, the contribution of a typical
E-commerce chapters would be limited.
2 Cook Islands, Fiji, Niue, Samoa, Solomon Islands, Tuvalu, Vanuatu, and Kiribati.
3 Cook Islands, Kiribati, Nauru, Niue, Samoa, Solomon Islands, Tonga, Tuvalu and Vanuatu.
4 New Zealand, Australia, Samoa, Kiribati, Tonga, Solomon Islands, Niue and Cook Islands.
21In 2020, the Pacific Islands Forum Secretariat (PIFS) introduced the Pacific Aid for Trade Strategy (PAFTS) 2020-2025,
which includes E-commerce as a regional priority. The PAFTS features E-commerce along with other priority areas
of services and connectivity as elements to narrow the distances and trade costs in the Pacific. Through the PAFTS,
the PIFS is mobilising funding for E-commerce readiness assessments in the region. The Secretariat is also extending
assistance for the development and implementation of a regional strategy to improve readiness to trade electronically
and to benefit from E-commerce.xi
At a sub-regional level, the MFTA is the third iteration of the FTA between Fiji, PNG, Vanuatu and the Solomon Islands.
Electronic commerce is embedded in Part 7 of “Chapter 6 Trade in Services” of the Melanesian Free Trade Agreement
(MFTA), a comprehensive free trade agreement focussing on trade in goods, trade in services, cross border investment
and labour mobility that aims to achieve regional integration of MSG economies. As state parties undertake measures to
liberalise services sectors, the parties also undertake measures to promote the development and use of E-commerce
through cooperation between the parties and other countries. E-commerce is expected to address the challenges
and unlock the benefits for small and medium enterprises to export goods and services covered in the Agreement. Fiji
and Solomon Islands signed the MFTA, which is is awaiting ratification by Members.
Table 7: FICs membership in regional trade agreements
Country PICTA SPARTECA PACER Plus EU-Pacific iEPA MFTA
Cook Islands ★ ★ ★
Fiji ★ ★ ★ ★
FSM ★
Kiribati ★ ★ ★
Marshall Islands ★
Nauru ★ ★ ★
Niue ★ ★ ★
Palau
Papua New Guinea ★ ★ ★
Samoa ★ ★ ★ ★
Solomon Islands ★ ★ ★ ★ ★
Tonga ★ ★ ★
Tuvalu ★ ★ ★
Vanuatu ★ ★ ★
Note: a grey star indicates a country which has signed an agreement but which has yet to ratify and apply it. A blue star refers to country which has ratified and is applying the agreement
Source: ITC MacMap, PIFS: https://www.forumsec.org/regional-trade-agreements/ , and Australian Border Force: https://www.abf.gov.au/importing-exporting-and-manufacturing/free-trade-agreements/
forum-islands-(including-fiji)
Most FICs have adopted national Trade Policies that provide for policy measures intended to develop ICT, E-Business,
or E-commerce. For example, Fiji’s National Export Strategy recognises ICT as one of the priority areas for export
diversification.xii Vanuatu dedicates ample space to the ICT industry in its Trade Policy Framework Update,xiii and presents
recommendations to increase export of ICT and ICT-related services, including through E-commerce. Kiribati’s Trade
Policy Frameworkxiv reiterates the need to increase access to and use of ICT, and advocates for E-commerce adoption
by the private sector. It also focuses on the need to develop an E-commerce policy and regulatory framework. Both
Tuvalu and Solomon Islands’ Trade Policiesxv highlight the potential role of ICT for economic development. In PNG,
E-commerce is partly covered by the National Trade Policy of 2017-2032.xvi Niue mentions telecommunications as
an economic backbone service in its Trade Policy Framework, recommends to draft a National ICT Policy, introduce
competition in the telecoms sector and establish an enhanced regulatory framework for the telecoms sector.xvii
22However, some FICs like FSM and the Marshall Islands, did not mention ICT or E-commerce development in their trade
policies. Both countries were among the first to develop trade policies in the region, in the early 2010s. Back then, the
full potential of ICT and E-commerce had yet to be fully understood, and this can explain why ICT aspects were not
considered.
2.3 Availability of relevant statistics
The availability of data in the Pacific is poor, with insufficient statistics relating to E-commerce and the digital
economy. ICT related data used in this report, such as internet penetration rates, number of internet servers, connectivity
information, postal development indices, etc.; was found mainly through international databases, such as the UN-ITU,
World Bank, UNESCAP, Pacific Region Infrastructure Facility (PRIF) and UNCTAD. Apart from these, a digital statistics
overview of 12 FICs was conducted by Hootsuite in February 2020, therefore giving general information on ICT usage.xviii
A number of remote and small FICs such as Niue, Nauru, Cook Islands, Kiribati, have not yet been ranked on many ICT-
related development indexes. Most FICs have not been included in the ITU ICT Development Index (6/176 economies),
the United Nations Conference on Trade and Development (UNCTAD) B2C E-commerce Index (0/152 economies),
the Universal Postal Union (UPU) Integrated Index for Postal Development (8/172 economies), or the World Bank (WB)
Doing Business Index (10/190 economies). In some cases, data on the region’s ICT-related development has not been
updated as far back as 2014.
Reliable and updated data is critical to inform the process of policymaking in general and E-commerce specifically.
Robust data will support the planning, monitoring, and evaluation of various ICT and E-commerce initiatives. Reliable
data on the number of mobile and fixed-broadband internet subscribers, and the number of overall internet users is
particularly important for benchmarking and the measurement of progress of the sector. To achieve this, a regional
collection mechanism and capacity building activities for National Statistics Offices (NSO) may be required.xix
2.4 Summary of recommendations from country assessments
Table 8: Recommendations on E-Commerce Policies and Strategies
Recommendations Timeline
1. evelop a single coordination mechanism facilitating multi-stakeholder dialogue,
D
comprising of stakeholders with institutional mandates for policy areas relevant to Short
E-commerce.
2. F
ormulate a national E-commerce policy or strategy. Ensure that formulation is inclusive
Short
and paired with awareness-raising activities and education on E-commerce.
Develop an E-government strategy to improve government processes, especially with
3.
Short
regard to E-procurement and the delivery of public services.
4. Improve statistics on E-commerce, ensuring that a set of key statistics on E-commerce
Medium
are collected to support comparative purposes and national objectives.
233
ICT INFRASTRUCTURE AND
E-COMMERCE SUPPORT
SERVICES ECOSYSTEM
3.1 Broadband, mobile, and smartphone penetration
The overall internet penetration rate in the Pacific5 stood at 35.4 percent. In the region, Nauru had the highest
percentage of individuals using the internet in 2017, at 57 percent, followed by Fiji, 50 percent and Tuvalu at 49 percent.
A comparison of 2010 data on internet use shows that there has been an increase of 50 percent or above in the FICs.
The most significant increase in the region was in the Marshall Islands, where individuals using the internet grew by seven
times from 2010 to 2017. Along with this, in 2019 PNG had the highest number of secure internet servers (498),6 a variable
closely related to country size, presence of big companies, and importance of the finance industry. However, PNG had
the lowest internet penetration out of all FICs, at 11.2 percent in 2017.
Figure 1: Individuals using the internet in 2010-2017 and Secure Internet Servers in 2019
Individuals Using the Internet, % of Population Secure Internet Servers, 2019
57.00
Nauru Papua New Guinea 498
49.97
Fiji Fiji 187
20
49.32
Tuvalu Vanuatu 105
25
41.25
Tonga Samoa 93
16
38.70
Marshall Islands Solomon Islands 38
7
35.30
Micronesia, Fed. States Micronesia, Fed. States 24
20
33.61
Samoa Tonga 24
7
25.72
Vanuatu Marshall Islands 20
8
11.92
Solomon Islands Palau 13
5
11.21
Papua New Guinea Tuvalu 1
1.28
0 10 20 30 40 50 60 0 100 200 300 400 500 600
—— 2017 —— 2010
Source: ITU, World Bank WDI
5 Average of 10 FICs for which data was available. Papua New Guinea, Solomon Islands, Vanuatu, Samoa, Micronesia, Marshall Islands, Tonga, Tuvalu, Fiji, Nauru.
6 Secure internet servers are servers using encryption technology in internet transactions. These servers help maintain privacy online, particularly in trusting websites with respect to a user’s
personal information. The data comes from a survey that examines the use of encrypted transactions through extensive automated exploration, checking for a valid certificate of authenticity.
24One of the main aspects of ICT penetration is mobile connectivity. Mobile cellular subscriptions in the Pacific,
measured as a percentage of the population, have been steadily increasing from 52 percent in 2010 to 70 percent
in 2017. Almost all FICs show an increasing trend in the number of mobile subscriptions. Fiji had the highest mobile
subscription rate of 117.83 percent, followed by Tonga with 105.82 percent. The Federated State of Micronesia had the
lowest rate of mobile subscriptions (20.74 percent). Factors such as market size, ITC connectivity and affordability are
among those explaining the observed differences. Since most of the Pacific population using the internet does so
through a mobile phone, it is possible to conclude that only about 50 percent of existing mobile subscriptions include
internet connectivity – with the other 50 percent still limited to voice and SMS.
Table 9: Mobile cellular subscriptions (percentage of population)
Country Name 2010 2011 2012 2013 2014 2015 2016 2017
Fiji 81.17 84.20 99.28 107.49 101.12 111.20 119.75 117.83
Kiribati 32.2
Marshall Islands 27.11 26.99 27.56
FSM 26.74 26.68 29.87 29.64 20.67 21.24 20.74
Nauru 61.97 66.53 67.06 90.53 94.51 94.58
Palau 80.82 87.04 97.23 101.93 108.44 134.41
Papua New Guinea 26.11 32.12 35.50 38.52 42.27 43.91 45.72 47.62
Samoa 48.40 53.04 52.37 55.42 62.28 77.63 63.58
Solomon Islands 21.88 50.76 54.34 56.55 64.16 70.42 67.25 73.16
Tonga 52.22 53.11 54.51 56.50 67.31 72.92 79.10 105.82
Tuvalu 15.19 20.03 26.07 31.32 34.63 59.46 67.71 70.36
Vanuatu 71.94 56.44 58.55 49.58 59.14 64.48 78.54 79.86
Average 48.6 53.0 57.5 58.2 62.2 68.8 72.4 66.7
Note: Cook Island and Niue are not covered by the databases
Source: ITU, World Bank, ESCAP
On the other hand, in most FICs, there has been a static or declining trend in fixed broadband subscriptions. As seen
in Table 8, the average fixed-line subscriptions per 100 inhabitants show a stagnating trend. Fiji recorded the sharpest
decline, where fixed-line broadband subscriptions fell from 2.70 in 2010 to 1.38 in 2017, probably due to the increase
uptake in mobile subscriptions. Tuvalu had the highest fixed-line subscription rates of 3.96 percent, followed by FSM at
3.39 percent. However, these rates are still very low when compared to international levels.
Table 10: Fixed broadband subscriptions (per 100 people)
Country Name 2010 2011 2012 2013 2014 2015 2016 2017
Fiji 2.70 2.69 1.56 1.26 1.43 1.47 1.41 1.38
Kiribati 0.82 0.81 0.75 0.65 0.46 0.11 0.06 0.07
Marshall Islands 2.26 2.40 1.74 1.73 1.72
FSM 0.97 1.95 2.88 3.01 2.88 3.39
Palau 1.33 2.92 5.09 10.25 6.30 6.93
25You can also read