PAKISTAN CLIMATE RISK COUNTRY PROFILE - World Bank Climate Change Knowledge Portal
←
→
Page content transcription
If your browser does not render page correctly, please read the page content below
CLIMATE RISK COUNTRY PROFILE

        PAKISTAN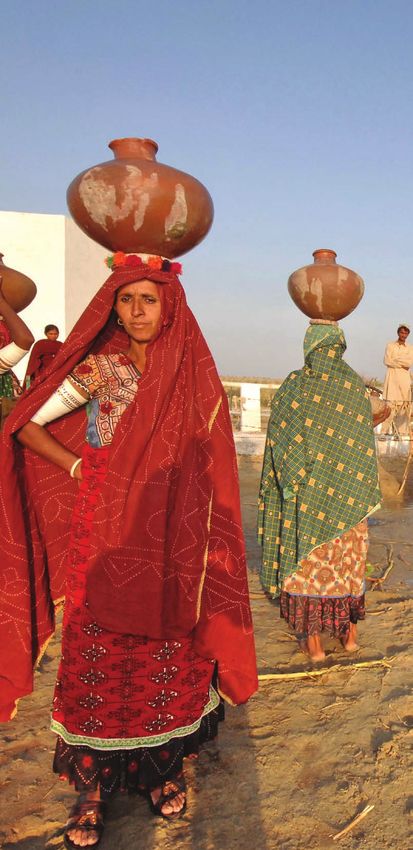
COPYRIGHT
© 2021 by the World Bank Group
1818 H Street NW, Washington, DC 20433
Telephone: 202-473-1000; Internet: www.worldbank.org

© 2021 Asian Development Bank
6 ADB Avenue, Mandaluyong City, 1550 Metro Manila, Philippines
Tel +63 2 8632 4444; Fax +63 2 8636 2444
www.adb.org

This work is a product of the staff of the World Bank Group (WBG) and the Asian Development Bank (ADB) and with external
contributions. The opinions, findings, interpretations, and conclusions expressed in this work are those of the authors’ and do not
necessarily reflect the views or the official policy or position of the WBG, its Board of Executive Directors, or the governments
it represents or of ADB, its Board of Governors, or the governments they represent.

The WBG and ADB do not guarantee the accuracy of the data included in this work and do not make any warranty, express or
implied, nor assume any liability or responsibility for any consequence of their use. This publication follows the WBG’s practice
in references to member designations, borders, and maps. ADB, however, recognizes “China” as the People’s Republic of China.
The boundaries, colors, denominations, and other information shown on any map in this work, or the use of the term “country” do
not imply any judgment on the part of the WBG or ADB, their respective Boards, or the governments they represent, concerning
the legal status of any territory or geographic area or the endorsement or acceptance of such boundaries.

The mention of any specific companies or products of manufacturers does not imply that they are endorsed or recommended
by either the WBG or ADB in preference to others of a similar nature that are not mentioned.

RIGHTS AND PERMISSIONS
The material in this work is subject to copyright. Because the WB and ADB encourage dissemination of their knowledge, this
work may be reproduced, in whole or in part, for noncommercial purposes as long as full attribution to this work is given. This
work is licensed under the Creative Commons Attribution-NonCommercial 3.0 IGO License. To view a copy of this license, visit
http://creativecommons.org/licenses/by-nc/3.0/igo/ or send a letter to Creative Commons, PO Box 1866, Mountain View,
CA 94042, USA.

This CC license does not apply to WBG or non-ADB copyright materials in this publication. If the material is attributed to another
source, please contact the copyright owner or publisher of that source for permission to reproduce it. WBG or ADB cannot be
held liable for any claims that arise as a result of your use of the material.

Please cite the work as follows: Climate Risk Country Profile: Pakistan (2021): The World Bank Group and the Asian Development
Bank.

Any queries on rights and licenses, including subsidiary rights, should be addressed to World Bank Publications, The World Bank
Group, 1818 H Street NW, Washington, DC 20433, USA; fax: 202-522-2625; e-mail: pubrights@worldbank.org.

Cover Photos: © Curt Carnemark/World Bank, “Rural road in mountains” August 13, 2007 via Flickr, Creative Commons CC
BY-NC-ND 2.0. © Caroline Suzman/World Bank, “Somo Samo village well” February 8, 2007 via Flickr, Creative Commons CC
BY-NC-ND 2.0.

Graphic Design: Circle Graphics, Reisterstown, MD.

CLIMATE RISK COUNTRY PROFILE: PAKISTAN                                                                                           ii
ACKNOWLEDGEMENTS
This profile is part of a series of Climate Risk Country Profiles that are jointly developed by the World Bank Group (WBG) and the
Asian Development Bank (ADB). These profiles synthesize the most relevant data and information on climate change, disaster
risk reduction, and adaptation actions and policies at the country level. The profile is designed as a quick reference source for
development practitioners to better integrate climate resilience in development planning and policy making. This effort is co-led
by Veronique Morin (Senior Climate Change Specialist, WBG), Ana E. Bucher (Senior Climate Change Specialist, WBG) and
Arghya Sinha Roy (Senior Climate Change Specialist, ADB).

This profile was written by Alex Chapman (Consultant, ADB), William Davies (Consultant, ADB) and Yunziyi Lang (Climate Change
Analyst, WBG). Technical review of the profiles was undertaken by Robert L. Wilby (Loughborough University). Additional
support was provided by MacKenzie Dove (Senior Climate Change Consultant, WBG), Jason Johnston (Operations Analyst,
WBG), Adele Casorla-Castillo (Consultant, ADB), and Charles Rodgers (Consultant, ADB). This profile also benefitted from
inputs of WBG and ADB regional staff and country teams.

Climate and climate-related information is largely drawn from the Climate Change Knowledge Portal (CCKP), a WBG online
platform with available global climate data and analysis based on the latest Intergovernmental Panel on Climate Change (IPCC)
reports and datasets. The team is grateful for all comments and suggestions received from the sector, regional, and country
development specialists, as well as climate research scientists and institutions for their advice and guidance on use of climate
related datasets.

CLIMATE RISK COUNTRY PROFILE: PAKISTAN                                                                                         iii
CONTENTS
FOREWORD . . . . . . . . . . . . . . . . . . . . . . . . . . . . . . . . . . . . 1
KEY MESSAGES . . . . . . . . . . . . . . . . . . . . . . . . . . . . . . . . . . 2
COUNTRY OVERVIEW . . . . . . . . . . . . . . . . . . . . . . . . . . . . . . . 2
CLIMATOLOGY . . . . . . . . . . . . . . . . . . . . . . . . . . . . . . . . . . 4
Climate Baseline . . . . . . . . . . . . . . . . . . . . . . . . . . . . . . . . . . . . . . . . 4
Overview . . . . . . . . . . . . . . . . . . . . . . . . . . . . . . . . . . . . . . . . . . 4
Key Trends . . . . . . . . . . . . . . . . . . . . . . . . . . . . . . . . . . . . . . . . . 6
Climate Future . . . . . . . . . . . . . . . . . . . . . . . . . . . . . . . . . . . . . . . . . 7
Overview . . . . . . . . . . . . . . . . . . . . . . . . . . . . . . . . . . . . . . . . . . 7
CLIMATE CHANGE AND NATURAL HAZARD RISK . . . . . . . . . . . . . . . . . . 12
Heat Waves . . . . . . . . . . . . . . . . . . . . . . . . . . . . . . . . . . . . . . . . . 13
Drought . . . . . . . . . . . . . . . . . . . . . . . . . . . . . . . . . . . . . . . . . . 14
Flood . . . . . . . . . . . . . . . . . . . . . . . . . . . . . . . . . . . . . . . . . . . . 15
CLIMATE CHANGE IMPACTS . . . . . . . . . . . . . . . . . . . . . . . . . . . . 16
Climate Change Impacts on Natural Resources . . . . . . . . . . . . . . . . . . . . . . . . . . 16
Water . . . . . . . . . . . . . . . . . . . . . . . . . . . . . . . . . . . . . . . . . . . 16
Coastal Zone . . . . . . . . . . . . . . . . . . . . . . . . . . . . . . . . . . . . . . . . 17
Land and Soil . . . . . . . . . . . . . . . . . . . . . . . . . . . . . . . . . . . . . . . . 18
Climate Change Impacts on Economic Sectors . . . . . . . . . . . . . . . . . . . . . . . . . . 18
Agriculture . . . . . . . . . . . . . . . . . . . . . . . . . . . . . . . . . . . . . . . . . 18
Urban and Energy . . . . . . . . . . . . . . . . . . . . . . . . . . . . . . . . . . . . . 20
Climate Change Impacts on Communities . . . . . . . . . . . . . . . . . . . . . . . . . . . . 21
Vulnerability to Climate-Related Disaster . . . . . . . . . . . . . . . . . . . . . . . . . . . 21
Human Health . . . . . . . . . . . . . . . . . . . . . . . . . . . . . . . . . . . . . . . 22
Poverty and Inequality . . . . . . . . . . . . . . . . . . . . . . . . . . . . . . . . . . . 23
Gender . . . . . . . . . . . . . . . . . . . . . . . . . . . . . . . . . . . . . . . . . . 24
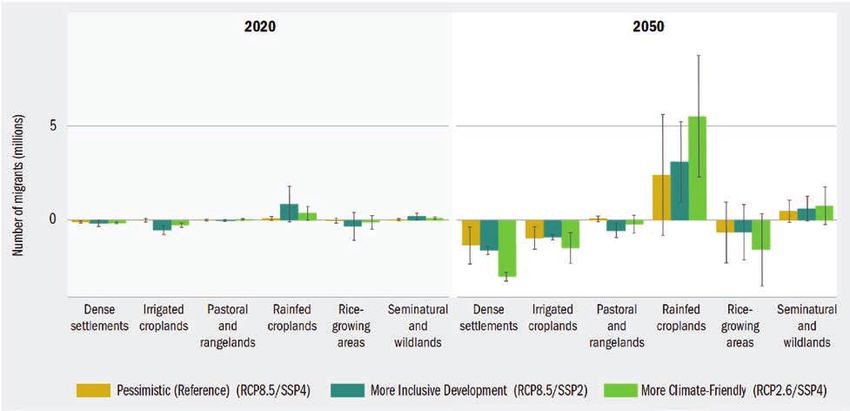
Migration . . . . . . . . . . . . . . . . . . . . . . . . . . . . . . . . . . . . . . . . . 24
POLICIES AND PROGRAMMES . . . . . . . . . . . . . . . . . . . . . . . . . . . 25
National Adaptation Policies and Plans . . . . . . . . . . . . . . . . . . . . . . . . . . . . . 25
Climate-Related Priorities of ADB and the WBG . . . . . . . . . . . . . . . . . . . . . . . . . 26
ADB – Country Partnership Strategy . . . . . . . . . . . . . . . . . . . . . . . . . . . . . 26
WBG – Country Partnership Framework . . . . . . . . . . . . . . . . . . . . . . . . . . . . 27
CLIMATE RISK COUNTRY PROFILE: PAKISTAN iv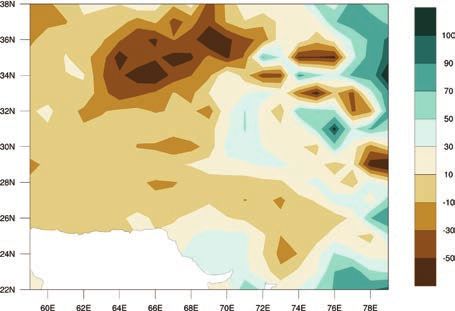
FOREWORD

Climate change is a major risk to good development outcomes, and the World Bank Group is committed to playing an important
role in helping countries integrate climate action into their core development agendas. The World Bank Group (WBG) and the
Asian Development Bank (ADB) are committed to supporting client countries to invest in and build a low-carbon, climate-
resilient future, helping them to be better prepared to adapt to current and future climate impacts.

Both institutions are investing in incorporating and systematically managing climate risks in development operations through
their individual corporate commitments.

For the World Bank Group: a key aspect of the World Bank Group’s Action Plan on Adaptation and Resilience (2019) is to help
countries shift from addressing adaptation as an incremental cost and isolated investment to systematically incorporating climate
risks and opportunities at every phase of policy planning, investment design, implementation and evaluation of development
outcomes. For all International Development Association and International Bank for Reconstruction and Development operations,
climate and disaster risk screening is one of the mandatory corporate climate commitments. This is supported by the World
Bank Group’s Climate and Disaster Risk Screening Tool which enables all Bank staff to assess short- and long-term climate
and disaster risks in operations and national or sectoral planning processes. This screening tool draws up-to-date and relevant
information from the World Bank’s Climate Change Knowledge Portal, a comprehensive online ‘one-stop shop’ for global,
regional, and country data related to climate change and development.

For the Asian Development Bank (ADB): its Strategy 2030 identified “tackling climate change, building climate and disaster
resilience, and enhancing environmental sustainability” as one of its seven operational priorities. Its Climate Change Operational
Framework 2017-2030 identified mainstreaming climate considerations into corporate strategies and policies, sector and
thematic operational plans, country programming, and project design, implementation, monitoring, and evaluation of climate
change considerations as the foremost institutional measure to deliver its commitments under Strategy 2030. ADB’s climate
risk management framework requires all projects to undergo climate risk screening at the concept stage and full climate risk
and adaptation assessments for projects with medium to high risk.

Recognizing the value of consistent, easy-to-use technical resources for our common client countries as well as to support
respective internal climate risk assessment and adaptation planning processes, the World Bank Group’s Climate Change Group
and ADB’s Sustainable Development and Climate Change Department have worked together to develop this content. Standardizing
and pooling expertise facilitates each institution in conducting initial assessments of climate risks and opportunities across sectors
within a country, within institutional portfolios across regions, and acts as a global resource for development practitioners.

For common client countries, these profiles are intended to serve as public goods to facilitate upstream country diagnostics,
policy dialogue, and strategic planning by providing comprehensive overviews of trends and projected changes in key climate
parameters, sector-specific implications, relevant policies and programs, adaptation priorities and opportunities for further actions.

We hope that this combined effort from our institutions will spur deepening of long-term risk management in our client countries
and support further cooperation at the operational level.

Bernice Van Bronkhorst                            Preety Bhandari
Global Director                                   Chief of Climate Change and Disaster Risk Management Thematic Group
Climate Change Group                              concurrently Director Climate Change and Disaster Risk Management Division
The World Bank Group                              Sustainable Development and Climate Change Department
                                                  Asian Development Bank

CLIMATE RISK COUNTRY PROFILE: PAKISTAN                                                                                              1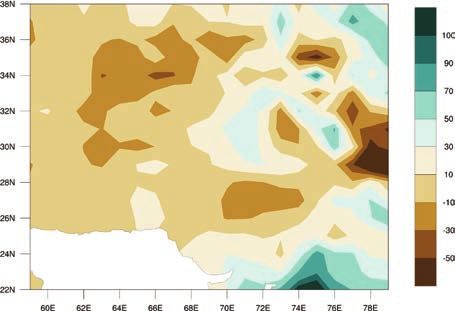
KEY MESSAGES

•   Pakistan faces rates of warming considerably above the global average with a potential rise of 1.3°C–4.9°C by
    the 2090s over the 1986–2005 baseline. The range in possible temperature rises highlights the significant
    differences between 21st century emissions pathways.
•   Rises in the annual maximum and minimum temperature are projected to be stronger than the rise in average
    temperature, likely amplifying the pressure on human health, livelihoods, and ecosystems.
•   Changes to Pakistan’s rainfall and runoff regimes, and hence its water resources, are highly uncertain, but an
    increase in the incidence of drought conditions is likely.
•   The frequency and intensity of extreme climate events is projected to increase, increasing disaster risk
    particularly for vulnerable poor and minority groups
•   An increase in the number of people affected by flooding is projected, with a likely increase of around 5 million
    people exposed to extreme river floods by 2035–2044, and a potential increase of around 1 million annually
    exposed to coastal flooding by 2070–2100.
•   Projections suggest yield declines in many key food and cash crops, including cotton, wheat, sugarcane, maize,
    and rice.
•   Temperature increases are likely to place strain on urban dwellers and outdoor laborers, with increased risk of
    heat-related sickness and death likely under all emissions pathways.
•   All of the above should be seen in the context of high and persistent levels of undernourishment and deprivation.
    There is an urgent need for further research and delivery of effective adaptation and disaster risk reduction
    measures.

COUNTRY OVERVIEW

P
       akistan is characterized by diverse topography, ecosystems, and climate zones. Rich in natural resources,
       including fertile agricultural lands, natural gas reserves, and mineral deposits, Pakistan faces challenges
       in balancing competing objectives between economic development and environmental protection.
A semi-industrialized country, Pakistan has grown from a primarily agriculture-based to a mostly service-based
economy (with services constituting 49.4% of GDP in 2019). As of 2019 agriculture was still the largest
employer, occupying 42.6% of the workforce. As of 2013 approximately 29.5% of the population still lived below
the national poverty line and 12.3% (2018) of the population remained undernourished (see key indicators in
Table 1). The majority of Pakistan’s 216.5 million people (2019) live along the Indus River, an area prone to severe
flooding in July and August. Major earthquakes are also frequent in the mountainous northern and western regions.

The Government of Pakistan established the Ministry of Climate Change and issued its Second National
Communication on Climate Change in 2019. The National Climate Change Policy recognizes that while Pakistan
is working on a strategy that seeks to conserve energy, improve energy efficiency and optimize fuel mix to support
global efforts for reduction in greenhouse gas emissions, the more immediate and pressing task is to prepare itself
for adaptation to climate change. Pakistan ratified the Paris Agreement on November 10, 2016, and submitted its
Nationally Determined Contribution to the UNFCCC in 2016.

CLIMATE RISK COUNTRY PROFILE: PAKISTAN                                                                             2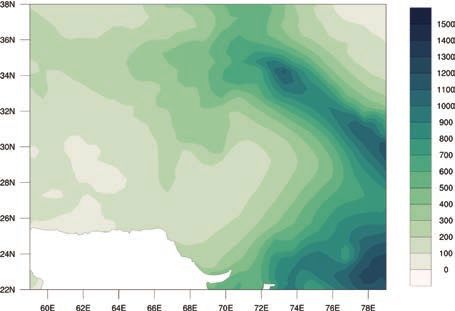
TABLE 1.  Key indicators

    Indicator                                                                Value                                        Source
    Population Undernourished        1                                       12.3% (2017–2019)                            FAO, 2020
    National Poverty Rate     2                                              24.3% (2015)                                 World Bank, 2019
    Share of Wealth Held by Bottom 20%           3                             8.9% (2015)                                World Bank, 2019
    Net Annual Migration Rate4                                               –0.11% (2015–2020)                           UNDESA, 2019
    Infant Mortality Rate (Between Age 0 and 1)               5                6.1% (2015–2020)                           UNDESA, 2019
    Average Annual Change in Urban Population                 6                2.53% (2015–2020)                          UNDESA, 2019
    Dependents per 100 Independent Adults                 7                  64.4 (2020)                                  UNDESA, 2019
    Urban Population as % of Total Population8                               37.2% (2020)                                 CIA, 2020
    External Debt Ratio to GNI9                                              27.6% (2018)                                 ADB, 2020
    Government Expenditure Ratio to GDP              10                      21.5% (2019)                                 ADB, 2020

    Notre-Dame GAIN Index Ranking (2019)
          The ND-GAIN Index ranks 181 countries using a score which calculates a country’s vulnerability to climate
          change and other global challenges as well as their readiness to improve resilience. The more vulnerable a
    152nd
          country is the lower their score, while the more ready a country is to improve its resilience the higher it will be.
          Norway has the highest score and is ranked 1st (University of Notre-Dame, 2020).

Green, Inclusive and Resilient Recovery
The coronavirus disease (COVID-19) pandemic has led to unprecedented adverse social and economic impacts.
Further, the pandemic has demonstrated the compounding impacts of adding yet another shock on top of
the multiple challenges that vulnerable populations already face in day-to-day life, with the potential to create
devastating health, social, economic and environmental crises that can leave a deep, long-lasting mark. However,
as governments take urgent action and lay the foundations for their financial, economic, and social recovery,
they have a unique opportunity to create economies that are more sustainable, inclusive and resilient. Short and
long-term recovery efforts should prioritize investments that boost jobs and economic activity; have positive impacts
on human, social and natural capital; protect biodiversity and ecosystems services; boost resilience; and advance
the decarbonization of economies.

1
     FAO, IFAD, UNICEF, WFP, WHO (2020). The state of food security and nutrition in the world. Transforming food systems for
     affordable healthy diets. FAO. Rome. URL: http://www.fao.org/documents/card/en/c/ca9692en/
2
     World Bank (2019). Poverty headcount ratio at national poverty lines (% of population). URL: https://data.worldbank.org/ [accessed 17/12/20]
3
     World Bank (2019). Income share held by lowest 20%. URL: https://data.worldbank.org/ [accessed 17/12/20]
4
     UNDESA (2019). World Population Prospects 2019: MIGR/1. URL: https://population.un.org/wpp/Download/Standard/Population/
     [accessed 17/12/20]
5
     UNDESA (2019). World Population Prospects 2019: MORT/1-1. URL: https://population.un.org/wpp/Download/Standard/Population/
     [accessed 17/12/20]
6
     UNDESA (2019). World Urbanization Prospects 2018: File 6. URL: https://population.un.org/wup/Download/ [accessed 17/12/20]
7
     UNDESA (2019). World Population Prospects 2019: POP/11-A. URL: https://population.un.org/wpp/Download/Standard/Population/
     [accessed 17/12/20]
8
     CIA (2020). The World Factbook. Central Intelligence Agency. Washington DC. URL: https://www.cia.gov/the-world-factbook/
9
     ADB (2020). Key Indicators for Asia and the Pacific 2020. Asian Development Bank. URL: https://www.adb.org/publications/key-
     indicators-asia-and-pacific-2020
10
     ADB (2020). Key Indicators for Asia and the Pacific 2020. Asian Development Bank. URL: https://www.adb.org/publications/key-
     indicators-asia-and-pacific-2020

CLIMATE RISK COUNTRY PROFILE: PAKISTAN                                                                                                         3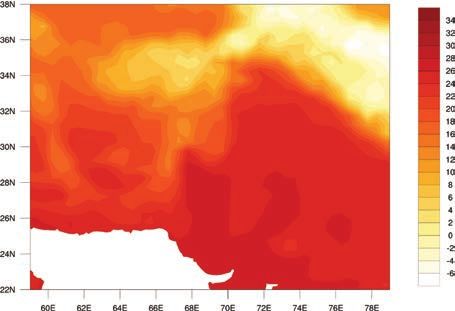
This document aims to succinctly summarize the climate risks faced by Pakistan. This includes rapid onset and
long-term changes in key climate parameters, as well as impacts of these changes on communities, livelihoods
and economies, many of which are already underway. This is a high-level synthesis of existing research and
analyses, focusing on the geographic domain of Pakistan, therefore potentially excluding some international
influences and localized impacts. The core data presented is sourced from the database sitting behind the
World Bank Group’s Climate Change Knowledge Portal (CCKP), incorporating climate projections from the
Coupled Model Inter-comparison Project Phase 5 (CMIP5). This document is primarily meant for WBG and
ADB staff to inform their climate actions and to direct readers to many useful sources of secondary data
and research.

CLIMATOLOGY

Climate Baseline
Overview
Figure 1 shows Pakistan’s annual climate cycle. However, this conceals considerable regional variation. Pakistan
lies in a temperate zone and its climate is as varied as the country’s topography—generally dry and hot near the
coast and along the lowland plains of the Indus River, and becoming progressively cooler in the northern uplands
and Himalayas (Figures 2 and 3). Four seasons are recognized: 1) a cool, dry winter from December to February;
2) a hot, dry spring from March through May; 3) the summer rainy season, also known as the southwest monsoon
period, occurring from June to September; and 4) the retreating monsoons from October to November. A majority
of the country receives very little rainfall, with the exception of the Northern regions, where monsoons can bring
upwards of 200 millimeters (mm) a month from July to September. Inter-annual rainfall varies significantly, often
leading to successive patterns of floods and drought. El Niño is a significant influence on climate variability in
Pakistan, with anomalies in both temperature11 and flood frequency and impact12 correlated with the El Niño cycle.

11
     del Río, S., Iqbal, M.A., Cano-Ortiz, A., Herrero, L., Hassan, A. and Penas, A. (2013). Recent mean temperature trends in Pakistan and
     links with teleconnection patterns. International Journal of Climatology, 33, 277–290. URL: https://rmets.onlinelibrary.wiley.com/
     doi/full/10.1002/joc.3423
12
     Ward, P.J., Jongman, B., Kummu, M., Dettinger, M.D., Weiland, F.C.S. and Winsemius, H.C. (2013). Strong influence of El Niño
     Southern Oscillation on flood risk around the world. Proceedings of the National Academy of Sciences, 111, 15659–15664. URL:
     https://www.ncbi.nlm.nih.gov/pmc/articles/PMC4226082/

CLIMATE RISK COUNTRY PROFILE: PAKISTAN                                                                                                   4
Annual Cycle

  FIGURE 1.  Average monthly temperature and precipitation in Pakistan (1991–2020)13
                    32                                                                                 60
Temperature (°C)

                    24                                                                                 40

                                                                                                            Rainfall (mm)
                    16                                                                                 20

                     8                                                                                 0
                         Jan   Feb    Mar    Apr   May    Jun   Jul   Aug    Sep    Oct   Nov    Dec

                                                   Rainfall       Temperature

   Spatial Variations

  FIGURE 2.  Annual mean temperature (°C) in                                       FIGURE 3.  Annual mean precipitation (mm) in
  Pakistan over the period 1991–202014                                             Pakistan over the period 1991–202014

   Maps present the coordinates of Pakistan: latitude 60°48′15″E – 74°36′14″E and 32°50′42″N – 24°25’26″N.

  13
                   WBG Climate Change Knowledge Portal (CCKP, 2021). Climate Data: Historical. URL: https://climateknowledgeportal.worldbank.
                   org/country/pakistan/climate-data-historical
  14
                   WBG Climate Change Knowledge Portal (CCKP, 2021). Climate Data: Historical. URL: https://climateknowledgeportal.worldbank.
                   org/country/pakistan/climate-data-historical

  CLIMATE RISK COUNTRY PROFILE: PAKISTAN                                                                                                        5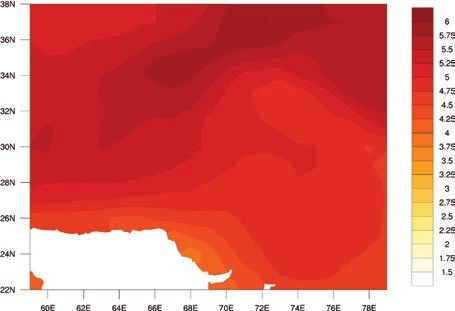
Key Trends
Temperature
Warming in Pakistan was estimated at 0.57°C over the 20th century, slightly less than the average for the South Asia
region of 0.75°C. Warming has accelerated more recently, with 0.47°C of warming measured between 1961–2007.
Warming is strongly biased towards the winter and post-monsoon months (November–February). On a sub-national
level, warming is also strongly biased towards the more southerly regions, with Punjab, Sind, and Balochistan all
experiencing winter warming in the region of 0.91°C–1.12°C over the same period, and Khyber Pakhtunkhwa in the
north experiencing only 0.52°C. The rise in average daily maximum temperatures (0.87°C between 1961–2007)
has been slightly stronger than the rise in average temperatures. A concurrent increase in the frequency of heat
wave days has been documented, particularly in Sindh Province. See ADB (2017)15 for further information.
The Berkeley Earth Data suggests historical warming has been strongest in western Pakistan. The dataset can
also be used to estimate warming between the periods 1900–1917 and 2000–2017, showing 1.3°C of warming
in the vicinity of Islamabad compared to 0.9°C of warming in the vicinity of Karachi.
Precipitation
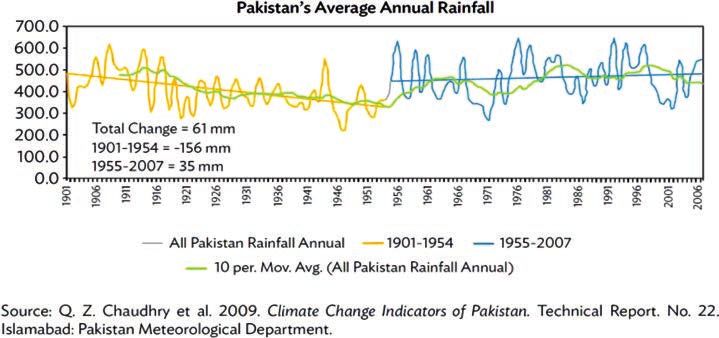
Pakistan has a complex historical precipitation profile. The early 20th century was characterised by a prolonged
decline in annual rainfall, but since 1960, a slight increasing trend has prevailed (Figure 4). This overall trend hides
considerable sub-national variation. Mean rainfall in the arid plains of Pakistan and the coastal belt has decreased by
10%–15% since 1960, contributing to the ongoing degradation of the country’s wetlands and mangrove ecosystems.
Most other regions have experienced a slight increase, seen both in the monsoon and dry seasons. The number of
heavy rainfall events has increased since 1960, and the nine heaviest rains recorded in 24 hours were recorded
in 2010. Recent evidence suggests the glaciers in the headwaters of the Indus Basin may be expanding due to
increased winter precipitation over the Himalayan region in the last 40 years. See ADB (2017)16 for further discussion.
FIGURE 4. Historical precipitation in Pakistan, adapted from ADB (2017)17
15
ADB (2017). Climate Change Profile of Pakistan. Asian Development Bank. URL: https://www.adb.org/publications/climate-change-
profile-pakistan
16
ADB (2017). Climate Change Profile of Pakistan. Asian Development Bank. URL: https://www.adb.org/publications/climate-change-
profile-pakistan
17
ADB (2017). Climate Change Profile of Pakistan. Asian Development Bank. URL: https://www.adb.org/publications/climate-change-
profile-pakistan
CLIMATE RISK COUNTRY PROFILE: PAKISTAN 6Climate Future
Overview
The Representative Concentration Pathways (RCPs)
represent four plausible futures, based on the rate of A Precautionary Approach
emissions reduction achieved at the global level. For
more background please refer to the World Bank Group’s Studies published since the last iteration of
Climate Change Knowledge Portal (CCKP). For reference, the IPCC’s report (AR5), such as Gasser
Tables 2 and 3 provide provides information on all four et al. (2018), have presented evidence which
RCPs over two time periods. In subsequent analysis RCP suggests a greater probability that earth will
2.6 and 8.5, the extremes of low and high emissions experience medium and high-end warming
pathways, are the primary focus. RCP2.6 would require scenarios than previously estimated. Climate
rapid and systemic global action, achieving emissions change projections associated with the
reduction throughout the 21st century sufficient to reach highest emissions pathway (RCP8.5) are
net zero global emissions by around 2080. RCP8.5 presented here to facilitate decision making
assumes annual global emissions will continue to increase which is robust to these risks.
throughout the 21st century. Climate changes under each
emissions pathway are presented against a reference
period of 1986–2005 for all indicators.
TABLE 2. Projected anomaly (changes °C) for maximum, minimum, and average daily temperatures in
Pakistan for 2040–2059 and 2080–2099, from the reference period of 1986–2005 for all RCPs. The
table is showing the median of the CCKP model ensemble and the 10–90th percentiles in brackets.18
Average Daily Maximum Average Daily Minimum
Temperature Average Daily Temperature Temperature
Scenario 2040–2059 2080–2099 2040–2059 2080–2099 2040–2059 2080–2099
RCP2.6 1.4 1.4 1.4 1.3 1.4 1.3
(−0.5, 3.3) (−0.5, 3.4) (−0.1, 2.9) (−0.2, 3.1) (−0.1, 3.1) (−0.3, 3.1)
RCP4.5 1.9 2.7 1.8 2.6 1.8 2.6
(−0.1, 3.7) (0.7, 4.7) (0.1, 3.4) (0.8, 4.4) (0.2, 3.6) (0.9, 4.5)
RCP6.0 1.6 3.3 1.6 3.3 1.7 3.3
(−0.3, 3.5) (1.2, 5.5) (0.1, 3.1) (1.5, 5.1) (0.1, 3.2) (1.6, 5.2)
RCP8.5 2.6 5.3 2.5 5.3 2.5 5.4
(0.9, 4.2) (2.9, 7.5) (0.8, 4.1) (3.3, 7.2) (0.9, 4.2) (3.5, 7.5)
18
WBG Climate Change Knowledge Portal (CCKP, 2021). Climate Data: Projections. URL: https://climateknowledgeportal.worldbank.
org/country/pakistan/climate-data-projections
CLIMATE RISK COUNTRY PROFILE: PAKISTAN 7TABLE 3. Projections of average temperature anomaly (°C) in Pakistan for different seasons
(3-monthly time slices) over different time horizons and emissions pathways, showing the median
estimates of the CMIP5 model ensemble and the 10th and 90th percentiles in brackets19
2040–2059 2080–2099
Scenario Jun–Aug Dec–Feb Jun–Aug Dec–Feb
RCP2.6 1.2 1.5 1.2 1.4
(−0.8, 3.1) (0.1, 3.0) (−0.8, 3.2) (−0.2, 3.0)
RCP4.5 1.7 1.9 2.3 2.7
(−0.6, 3.4) (0.3, 3.5) (0.1, 4.5) (1.2, 4.4)
RCP6.0 1.5 1.7 2.9 3.4
(−0.6, 3.2) (0.2, 3.2) (0.9, 5.0) (1.7, 5.3)
RCP8.5 2.3 2.5 4.9 5.4
(0.2, 4.1) (1.0, 4.1) (2.2, 7.1) (3.5, 7.3)
Model Ensemble
Climate projections presented in this document are derived from datasets made available on the World Bank’s Climate
Change Knowledge Portal, unless otherwise stated. These datasets are processed outputs of simulations performed
by multiple General Circulation Models (GCM) developed by climate research centers around the world and
evaluated by the IPCC for quality assurance in the CMIP5 iteration of models (for further information see Flato
et al., 2013). Collectively, these different GCM simulations are referred to as the ‘model ensemble’. Due to the
differences in the way GCMs represent the key physical processes and interactions within the climate system,
projections of future climate conditions can vary widely between different GCMs, this is particularly the case for
rainfall related variables and at national and local scales. Exploring the spread of climate model outputs can assist
in understanding uncertainties associated with climate models. The range of projections from 16 GCMs on the
indicators of average temperature anomaly and annual precipitation anomaly for Pakistan under RCP8.5 is shown
in Figure 5. Spatial representation of future projections of annual temperature and precipitation for mid and late
century under RCP8.5 are presented in Figure 6.
FIGURE 5. ‘Projected average temperature 8
Average temperature anomaly ( °C)
7
anomaly’ and ‘projected annual rainfall miroc_esm_chem
6
anomaly’ in Pakistan. Outputs of 16 models 5 bcc_csm1_1_m
within the ensemble simulating RCP8.5 over the 4 fio_esm
period 2080–2099. Models shown represent 3
the subset of models within the ensemble 2 Median,
10th and 90th
1
which provide projections across all RCPs and Percentiles
0
therefore are most robust for comparison.20 –40% –30% –20% –10% 0% 10% 20% 30% 40%
Average annual precipitation anomaly (%)
19
WBG Climate Change Knowledge Portal (CCKP, 2021). Climate Data: Projections. URL: https://climateknowledgeportal.worldbank.
org/country/pakistan/climate-data-projections
20
WBG Climate Change Knowledge Portal (CCKP, 2021). Climate Data: Projections. URL: https://climateknowledgeportal.worldbank.
org/country/pakistan/climate-data-projections
CLIMATE RISK COUNTRY PROFILE: PAKISTAN 8Spatial Variation FIGURE 6. CMIP5 ensemble projected change (32 GCMs) in annual temperature (top) and precipitation (bottom) by 2040–2059 (left) and by 2080–2090 (right) relative to 1986–2005 baseline under RCP8.5 Maps present the coordinates of Pakistan: latitude 60°48′15″E – 74°36′14″E and 32°50′42″N – 24°25′26″N. Temperature Projections of future temperature change are presented in three primary formats. Shown in Table 2 are the changes (or anomalies) in daily maximum and daily minimum temperatures over the given time period, as well as changes in the average temperature. Figures 7 and 8 display the annual and monthly average temperature projections. While similar, these three indicators can provide slightly different information. Monthly and annual average temperatures are most commonly used for general estimation of climate change, but the daily maximum and minimum can explain more about how daily life might change in a region, affecting key variables such as the viability of ecosystems, health impacts, productivity of labour, and the yield of crops, which are often disproportionately influenced by temperature extremes. Projected temperature increases in Pakistan are significantly higher than the global average. The IPCC projects a global average temperature increase by 2081–2100 of 3.7°C under the highest emissions pathway (RCP8.5) whilst CLIMATE RISK COUNTRY PROFILE: PAKISTAN 9
the model ensemble projects an average increase of 5.3°C
for Pakistan in the same scenario. The projected rise in                                            Global Projections
annual maximum temperatures is estimated at 5.3°C.
Notably, on the highest emissions pathway (RCP8.5),                                                 Unless otherwise stated projections shown
even the 10th percentile (low) estimate is higher than                                              here represent changes against the 1986–
the projected global average temperature rise, at 3.3°C,                                            2005 baseline. An additional 0.61°C of
demonstrating the level of certainty that Pakistan should                                           global warming is estimated to have taken
prepare for above-average increases. The difference                                                 place between the periods 1850–1900
between the end of century estimate under RCP2.6 and                                                and 1986–2005 21 The global average
RCP8.5 is around 3.1°C demonstrating the large potential                                            temperature changes projected between
benefits of enhanced global emissions reduction efforts                                             1986–2005 and 2081–2100 in the IPCC’s
in terms of potential reductions in warming. Uncertainty                                            Fifth Assessment Report are:
clouds projections on the seasonality of future changes,
                                                                                                    •     RCP2.6: 1.0°C
but the broad trend indicated by the model ensemble
                                                                                                    •     RCP4.5: 1.8°C
matches the historic pattern seen, showing stronger
                                                                                                    •     RCP6.0: 2.2°C
increases Oct–Dec than Jun–Aug.
                                                                                                    •     RCP8.5: 3.7°C

FIGURE 7.  Historic and projected average                                           FIGURE 8.  Projected change (anomaly) in
annual temperature in Pakistan under RCP2.6                                         monthly temperature, shown by month, for
(blue) and RCP8.5 (red). The values shown                                           Pakistan for the period 2080–2099 under
represents the median of 30+ GCM model                                              RCP8.5. The values shown represents the
ensemble with the shaded areas showing the                                          median of 30+ GCM model ensemble with the
10–90th percentiles.22                                                              shaded areas showing the 10–90th percentiles.23
        28                                                                                    8
        27
                                                                                              7
        26
                                                                                              6
        25
                                                                                   degreesC

        24                                                                                    5
degC

        23                                                                                    4
        22
                                                                                              3
        21
        20                                                                                    2

        19                                                                                    1
         1980         2000       2020     2040      2060      2080     2100                       Jan   Feb   Mar   Apr   May   Jun   Jul   Aug   Sep   Oct   Nov   Dec
                                          Year
         Historical    RCP 2.6    RCP 4.5   RCP 6.0   RCP 8.5

21
       (Kirtman, B., Power, S. B., Adedoyin, A. J., Boer, G. J., Bojariu, R., Camilloni, I., … Wang, H.-J. (2013). Near-term Climate Change: Projections and
       Predictability. In Climate Change 2013: The Physical Science Basis. Contribution of Working Group I to the Fifth Assessment Report of the
       Intergovernmental Panel on Climate Change (pp. 953–1028). Cambridge, United Kingdom and New York, NY, USA: Cambridge University Press.
       URL: https://www.ipcc.ch/site/assets/uploads/2018/02/WG1AR5_Chapter11_FINAL.pdf
22
       WBG Climate Change Knowledge Portal (CCKP, 2021). Climate by Sector. URL: https://climateknowledgeportal.worldbank.org/
       country/pakistan
23
       WBG Climate Change Knowledge Portal (CCKP, 2021). Climate by Sector. URL: https://climateknowledgeportal.worldbank.org/
       country/pakistan

CLIMATE RISK COUNTRY PROFILE: PAKISTAN                                                                                                                              10
Precipitation
As shown in Figure 9 great uncertainty surrounds
projections of future precipitation rates in Pakistan, FIGURE 9. Boxplots showing the projected
changes on an annual basis for the full model average annual precipitation for Pakistan in
ensemble are not statistically significant. However, the period 2080–209928
of the 16 models analyzed (Figure 5) 12 do show 800
700
an increase in average annual precipitation under the
600
highest emissions pathway (RCP8.5) by the end of 500
the century. A trend towards increased future annual
mm
400
precipitation is supported by published research, 300
200
including studies such as Amin et al. (2017)24 which
100
examines RCP6.0. This research also highlights 0
Historical RCP 2.6 RCP 4.5 RCP 6.0 RCP 8.5
the risk of increased frequency and intensity of
flood and drought events due to changes in the
seasonality, regularity, and extremes of precipitation. This fits with a global trend, described by Westra et al.
(2014),25 of increased intensity of sub-daily extreme rainfall events.
Changes are expected to vary across Pakistan’s subregions and changes in the Indus basin will be of particular
national significance. Rajbhandari et al. (2015)26 use downscaled modelling to suggest that precipitation may
increase in the Upper Indus basin, and decrease in the Lower Indus basin. However, significant uncertainty remains
in these results (see Water section below). Work by Amin et al. (2018)27 focused just on the Southern Punjab region
of Pakistan also highlights the seasonality of potential precipitation changes (under RCPs 4.5, 6.0 and 8.5), with
declines projected in the period January to April and increases over May-December. Increases projected for the
Southern Punjab region exceed 10% by 2050 in the month of September, October and November.
The poor and inconsistent performance of climate models in projecting precipitation trends in Pakistan (see Latif
et al., 2018)29 links in part to their weak performance simulating future changes in the South Asian monsoon
(Sperber et al., 2013).30 Uncertainty also remains regarding the future dynamics of the El Niño Southern Oscillation.
24
Amin, A., Nasim, W., Mubeen, M., Kazmi, D. H., Lin, Z., Wahid, A., … Fahad, S. (2017). Comparison of future and base precipitation
anomalies by SimCLIM statistical projection through ensemble approach in Pakistan. Atmospheric Research, 194(March), 214–225.
URL: https://ui.adsabs.harvard.edu/abs/2017AtmRe.194..214A/abstract
25
Westra, S., Fowler, H. J., Evans, J. P., Alexander, L. V., Berg, P., Johnson, F., Kendon, E. J., Lenderink, G., Roberts, N. (2014). Future
changes to the intensity and frequency of short-duration extreme rainfall. Reviews of Geophysics, 52, 522–555. URL: https://
agupubs.onlinelibrary.wiley.com/doi/10.1002/2014RG000464
26
Rajbhandari, R., Shrestha, A. B., Kulkarni, A., Patwardhan, S. K., & Bajracharya, S. R. (2015). Projected changes in climate over the
Indus river basin using a high resolution regional climate model (PRECIS). Climate Dynamics, 44(1), 339–357. URL: https://link.
springer.com/article/10.1007/s00382-014-2183-8
27
Amin, A., Nasim, W., Mubeen, M., Sarwar, S., Urich, P., Ahmad, A., . . . Ali, Q. S. (2018). Regional climate assessment of precipitation
and temperature in Southern Punjab (Pakistan) using SimCLIM climate model for different temporal scales. Theoretical and Applied
Climatology: 131: 121–131. URL: https://ui.adsabs.harvard.edu/abs/2018ThApC.131..121A/abstract
28
WBG Climate Change Knowledge Portal (CCKP, 2021). Climate by Sector. URL: https://climateknowledgeportal.worldbank.org/
country/pakistan
29
Latif, M., Hannachi, A. and Syed, F.S. (2018). Analysis of rainfall trends over Indo-Pakistan summer monsoon and related dynamics
based on CMIP5 climate model simulations. International Journal of Climatology, 38, e577-e595. URL: https://rmets.onlinelibrary.
wiley.com/doi/abs/10.1002/joc.5391
30
Sperber, K.R., Annamalai, H., Kang, I.S., Kitoh, A., Moise, A., Turner, A., Wang, B. and Zhou, T. (2013). The Asian summer monsoon:
an intercomparison of CMIP5 vs. CMIP3 simulations of the late 20th century. Climate Dynamics, 41, 2711–2744. URL: https://link.
springer.com/article/10.1007/s00382-012-1607-6
CLIMATE RISK COUNTRY PROFILE: PAKISTAN 11CLIMATE CHANGE AND NATURAL HAZARD RISK
P
akistan faces some of the highest disaster risk levels in the world, ranked 18 out of 191 countries by
the 2020 Inform Risk Index (Table 4). This risk ranking is driven particularly by the nation’s exposure
to earthquakes and the risks of internal conflict. However, Pakistan also has high exposure to flooding
(ranked jointly 8th), including, riverine, flash, and coastal, as well as some exposure to tropical cyclones and their
associated hazards (ranked jointly 40th) and drought (ranked jointly 43rd). Disaster risk in Pakistan is also driven
by its social vulnerability. Pakistan’s vulnerability ranking (37th) is driven by its high rates of multidimensional
poverty. Pakistan scores slightly better in terms of its coping capacity (ranked 59th). The section which follows
analyses climate change influences on the exposure component of risk in Pakistan.
TABLE 4. Selected indicators from the INFORM 2019 Index for Risk Management for Pakistan.
For the sub-categories of risk (e.g. “Flood”) higher scores represent greater risks. Conversely the
most at-risk country is ranked 1st.31
Lack of Overall
Tropical Coping Inform
Cyclone Drought Vulnerability Capacity Risk Level
Flood (0–10) (0–10) (0–10) (0–10) (0–10) (0–10) Rank (1–191)
8.9 3.8 5.1 5.7 5.6 6.2 18
TABLE 5. Summary of Natural Hazards in Pakistan from 1900 to 202032
Events Total Total Total Damage
Disaster Type Disaster Subtype Count Deaths Affected (‘000 US$)
Drought Drought 1 143 2,200,000 247,000
Earthquake Ground movement 35 144,116 7,435,786 5,376,755
Epidemic Bacterial disease 3 142 11,103 0
Parasitic disease 1 0 5,000 0
Viral disease 2 130 56,338 0
Others 5 131 371 0
Extreme temperature Cold wave 3 18 0 0
Heat wave 15 2,936 80,574 18,000
Flood Flash flood 24 3,590 22,114,253 10,184,118
Riverine flood 43 9,229 34,967,357 9,727,030
Others 39 5,286 23,863,294 2,670,030
Landslide Avalanche 12 567 4,435 0
Landslide 9 222 29,707 18,000
Mudslide 2 16 12 0
Storm Convective storm 15 402 1,906 0
Tropical cyclone 7 11,555 2,599,940 1,715,036
Others 7 184 2,988 0
31
Emergency Events Database (EM-DAT) of the Centre for Research on the Epidemiology of Disasters (CRED). Assessed on Nov 26,
2018 at https://www.emdat.be/.
32
INFORM (2020). Index for Risk Management. Inter-Agency Standing Committee Reference Group on Risk, Early Warning and
Preparedness. Available at: http://www.inform-index.org/
CLIMATE RISK COUNTRY PROFILE: PAKISTAN 12Heat Waves
Pakistan regularly experiences some of the highest maximum temperatures in the world, with an average monthly
maximum of around 27°C and an average June maximum of 36°C. The current median annual probability of a heat
wave occurring in any given location in Pakistan is around 3%.33 A large proportion of the population are exposed
to this risk, as demonstrated by estimates that over 65,000 people were hospitalized with heat stroke during the
2015 heatwave in Pakistan.34
Many regions of Pakistan experience temperatures of 38°C and above on an annual basis, when weather patterns
converge to deliver prolonged periods of heatwave serious human health impacts can result. Nasim et al. (2018)35
estimates that Pakistan experienced 126 heat waves between 1997–2015, around 7 per year, and detect an
increasing trend. Over 1,200 heat-related deaths resulted from a severe heatwave in 2015, primarily focused
in Sindh Province. Matthews et al. (2017)36 identify both Karachi and Lahore among the cities most vulnerable
to increases in extreme heat where, even under lower emissions pathways, temperature currently considered
heatwave and associated with high mortality risk becomes a regular occurrence.
The multi-model ensemble projects an increase in the median annual probability of a heatwave in any given region
from 3% to 4%–23% depending on the emissions pathway (Figure 10).37 Nasim et al. (2018)38 estimate the change
FIGURE 10. Projected change in the probability of observing a heat wave in Pakistan under RCP2.6
(left) and RCP8.5 (right) estimated by the full IPCC model ensemble in 10th, 50th, and 90th
percentiles. In this model a ‘Heat Wave’ is defined as a period of 3 or more days where the daily
temperature is above the long-term moving 95th percentile of daily mean temperature.39
0.125 0.4
0.1
0.3
Probability
Probability
0.075
0.2
0.05
0.1
0.025
0 0
2020–2039 2040–2059 2060–2079 2080–2099 2020–2039 2040–2059 2060–2079 2080–2099
Period Period
33
WBG Climate Change Knowledge Portal (CCKP, 2021). Climate by Sector. URL: https://climateknowledgeportal.worldbank.org/
country/pakistan
34
Saleem, M., Shafiq, A., & Syed, Z. S. (2018). Heat wave killings in Pakistan and possible strategies to prevent the future heat wave
fatalities. Research and Reviews on Healthcare, 57(March), 1–5. URL: https://lupinepublishers.com/research-and-reviews-journal/
fulltext/heat-wave-killings-in-pakistan-and-possible-strategies-to-prevent-the-future-heat-wave-fatalities.ID.000113.php
35
Nasim, W., Amin, A., Fahad, S., Awais, M., Khan, N., Mubeen, M., . . . Jamal, Y. (2018). Future risk assessment by estimating historical heat
wave trends with projected heat accumulation using SimCLIM climate model in Pakistan. Atmospheric Research: 205: 118–133. URL:
https://ui.adsabs.harvard.edu/abs/2018AtmRe.205..118N/abstract
36
Matthews, T., Wilby, R.L. and Murphy, C. 2017. Communicating the deadly consequences of global warming for human heat stress.
Proceedings of the National Academy of Sciences, 114, 3861–3866. URL: https://www.pnas.org/content/114/15/3861
37
WBG Climate Change Knowledge Portal (CCKP, 2021). Climate by Sector. URL: https://climateknowledgeportal.worldbank.org/
country/pakistan
38
Nasim, W., Amin, A., Fahad, S., Awais, M., Khan, N., Mubeen, M., . . . Jamal, Y. (2018). Future risk assessment by estimating
historical heat wave trends with projected heat accumulation using SimCLIM climate model in Pakistan. Atmospheric Research:
205: 118–133. URL: https://ui.adsabs.harvard.edu/abs/2018AtmRe.205..118N/abstract
39
WBG Climate Change Knowledge Portal (CCKP, 2021). Climate by Sector. URL: https://climateknowledgeportal.worldbank.org/
country/pakistan
CLIMATE RISK COUNTRY PROFILE: PAKISTAN 13in probability as a percentage increase over the probability in 1995, albeit with a different and smaller set of models, showing probability increases in the range of 62%–140% depending on emissions pathway, with the highest increases always seen under RCP8.5. However, these estimates are distorted by the continual rising temperatures, which make exceptional heat difficult to define. Another lens through which to view heat risk is the frequency of days with a Heat Index (a function of both temperature and humidity which better represents the threat to human health) above 35oC. The frequency of days meeting this criterion may more than double by 2080–2099 under the highest emissions pathway (RCP8.5), representing a significant threat to human health and livelihoods. Drought Two primary types of drought may affect Pakistan, meteorological (usually associated with a precipitation deficit) and hydrological (usually associated with a deficit in surface and subsurface water flow, potentially originating in the region’s larger river basins). At present Pakistan faces an annual median probability of severe meteorological drought of around 3%,40 as defined by a standardized precipitation evaporation index (SPEI) of less than −2. The probability of meteorological drought is projected to increase under all emissions pathways, and with very strong increases. While uncertainty is high, the CMIP5 ensemble projection would suggest that severe drought conditions (SPEI
is currently an extreme drought occurring 1 in 100-years under current climate may have a return period of 1 in
50-years under 1.5°C of warming or 1 in 20-years under 3°C of warming.

Droughts are in some cases associated with El Niño events and can cause significant damage to crop and
livelihoods, as in the consecutive droughts of 1999 and 2000, which caused crop failure and mass famine in
Pakistan. Climate change interactions with El Niño are currently poorly understood, and poorly simulated by
current climate models,44 and further research is required to better constrain future drought risk in Pakistan.

Flood
The World Resources Institute’s Global Flood Analyzer AQUEDUCT can be used to establish a baseline
level of flood exposure. As of 2010, assuming protection for up to a 1 in 25-year event, the population annually
affected by flooding in Pakistan is estimated at 714,000 people and expected annual impact on GDP at $1.7 billion.
Development and climate change are both likely to increase these figures. The climate change component can be
isolated and by 2030 is expected to increase the annually affected population by 1.5 million people, and the impact
on GDP by $5.8 billion under the RCP8.5 emissions pathway (AQUEDUCT Scenario B).45

The unusually large rainfall from the 2010 monsoon caused the most catastrophic flooding in Pakistan’s history,
flooding one-fifth of the country, affecting 20 million people, and claiming over 2,000 lives. The impact of this event
emphasised the nation’s vulnerability to flooding also in economic terms. UNISDR (2014)46 place Pakistan’s average
annual losses to flood at around $1 billion (slightly lower than the AQUEDUCT estimation). Given this vulnerability,
the uncertainty around issues such as glacial melt, average precipitation, and extreme precipitation change is a
major concern. Work by Willner et al. (2018)47 estimates that by 2035–2044 an additional five million people will be
affected by extreme river flooding annually (Table 6). Pakistan’s mountain regions also hold vulnerability to glacial

TABLE 6.  Estimated number of people affected by an extreme river flood (extreme river flood
is defined as being in the 90th percentile in terms of numbers of people affected) in the historic
period 1971–2004 and the future period 2035–2044. Figures represent an average of all four
RCPs and assume present day population distributions (Willner et al., 2018).48

                                       Population Exposed                         Population Exposed                          Increase
                                       to Extreme Flood                           to Extreme Flood                            in Affected
 Estimate                              (1971–2004)                                (2035–2044)                                 Population
 16.7 Percentile                       4,158,091                                    9,220,336                                 5,062,245
 Median                                5,709,314                                  11,238,400                                  5,529,086
 83.3 Percentile                       7,929,955                                  13,378,717                                  5,448,762

44
     Yun, K.S., Yeh, S.W. and Ha, K.J. (2016). Inter-El Niño variability in CMIP5 models: Model deficiencies and future changes. Journal of
     Geophysical Research: Atmospheres, 121, 3894–3906. URL: https://ui.adsabs.harvard.edu/abs/2016JGRD..121.3894Y/abstract
45
     WRI (2018). AQUEDUCT Global Flood Analyzer. Available at: https://floods.wri.org/# [Accessed: 22/11/2018].
46
     UNISDR (2014). PreventionWeb: Basic country statistics and indicators. Available at: https://www.preventionweb.net/countries
     [accessed 14/08/2018].
47
     Willner, S., Levermann, A., Zhao, F., Frieler, K. (2018). Adaptation required to preserve future high-end river flood risk at present
     levels. Science Advances: 4:1. URL: https://advances.sciencemag.org/content/4/1/eaao1914
48
     Willner, S., Levermann, A., Zhao, F., Frieler, K. (2018). Adaptation required to preserve future high-end river flood risk at present
     levels. Science Advances: 4:1. URL: https://advances.sciencemag.org/content/4/1/eaao1914

CLIMATE RISK COUNTRY PROFILE: PAKISTAN                                                                                                   15
lake outburst floods, triggered when ice melt and moraine failure releases large volumes of water trapped at high
altitudes. With an uncertain future for glaciers in and neighbouring Pakistan, including temperature rises and changes
in the precipitation regime, there is a need for further research and precautionary disaster risk reduction measures.49
CLIMATE CHANGE IMPACTS
Climate Change Impacts on Natural Resources
Water
While increases in the severity of extreme events of both flood and drought seem likely, there is some uncertainty
regarding the long-term outlook for water resources in Pakistan. Uncertainty surrounds projections of change in
annual rainfall, some shifts in seasonality seem likely. In the context of Pakistan’s heavy reliance on the Indus Basin
for its water resource, the uncertainty around future glacial change is significant. The impact of climate change on
the Karakoram glaciers has been the subject of debate, with some studies suggesting glaciers have been increasing
in size due to increased winter rainfall. However, a review conducted by UNDP (2017)50 shows shortcomings in
these studies, particularly related to the lack of a comprehensive inventory of Upper Indus Basin glaciers. In addition,
it suggests that in the shorter-term the climate change impact on water resources in Pakistan may be of lesser
significance in comparison with the issues presented by growing human demand for water and other issues including
the poor efficiency of Pakistan’s irrigation and water storage systems.51 However, UNDP (2017)52 emphasize the
strong likelihood that longer-term temperature rises will result in glacial loss, and reductions in the runoff which feeds
the Indus, as well as changes to its seasonal profile. The extent to which changes in rainfall might offset this loss is
uncertain. Archer et al. (2010)53 provide a useful overview of the potential impacts of climate change in the Indus
Basin. Issues highlighted include the declining and insufficient capacity of Pakistan’s reservoirs to serve its needs
under future development and climate change scenarios, and the likely pressure this will place on groundwater.
49
Ashraf, A., Naz, R., & Roohi, R. (2012). Glacial lake outburst flood hazards in Hindukush, Karakoram and Himalayan Ranges of
Pakistan: implications and risk analysis. Geomatics, Natural Hazards and Risk, 3(2), 113–132. URL: https://www.researchgate.net/
publication/254238697_Glacial_lake_outburst_flood_hazards_in_Hindukush_Karakoram_and_Himalayan_Ranges_of_Pakistan_
implications_and_risk_analysis
50
UNDP (2017). The vulnerability of Pakistan’s water sector to the impacts of climate change: identification of gaps and recommendations
for action. United Nations Development Programme. URL: https://www.iisd.org/publications/vulnerability-pakistans-water-sector-
impacts-climate-change-identification-gaps-and
51
ADB (2017). Climate Change Profile of Pakistan. Asian Development Bank. URL: https://www.adb.org/publications/climate-change-
profile-pakistan
52
UNDP (2017). The vulnerability of Pakistan’s water sector to the impacts of climate change: identification of gaps and recommendations
for action. United Nations Development Programme. URL: https://www.iisd.org/publications/vulnerability-pakistans-water-sector-
impacts-climate-change-identification-gaps-and
53
Archer, D. R., Forsythe, N., Fowler, H. J., and Shah, S. M. (2010). Sustainability of water resources management in the Indus Basin
under changing climatic and socio economic conditions, Hydrology and Earth System Sciences, 14, 1669–1680. URL: https://hess.
copernicus.org/articles/14/1669/2010/hess-14-1669-2010.pdf
CLIMATE RISK COUNTRY PROFILE: PAKISTAN 16Coastal Zone
Sea-level rise threatens significant physical changes to coastal zones around the world. Global mean sea-level rise
was estimated in the range of 0.44–0.74 m by the end of the 21st century by the IPCC’s Fifth Assessment Report54
but some studies published more recently have highlighted the potential for more significant rises (Table 7).
TABLE 7. Estimates of global mean sea-level rise by rate and total rise compared to 1986–2005
including likely range shown in brackets, data from Chapter 13 of the IPCC’s Fifth Assessment Report
with upper-end estimates based on higher levels of Antarctic ice-sheet loss from Le Bars et al., 2017.
Rate of Global Mean Sea-Level Global Mean Sea-Level Rise in
Scenario Rise in 2100 2100 Compared to 1986–2005
RCP2.6 4.4 mm/yr (2.0–6.8) 0.44 m (0.28–0.61)
RCP4.5 6.1 mm/yr (3.5–8.8) 0.53 m (0.36–0.71)
RCP6.0 7.4 mm/yr (4.7–10.3) 0.55 m (0.38–0.73)
RCP8.5 11.2 mm/yr (7.5–15.7) 0.74 m (0.52–0.98)
Estimate Inclusive of High-End Antarctic Ice-Sheet Loss 1.84 m (0.98–2.47)
Pakistan’s coastline holds considerable vulnerability to sea-level rise and its associated impacts. Work by the Met
Office (2014) suggest that without adaptation around one million people faces will face coastal flooding annually
by the period 2070–2100 (Table 8). The largest area of vulnerability is the Indus Delta, around 4,750 km2 of which
sits below 2 m above sea-level.55 It is estimated that around one million people live in the delta. This is substantially
fewer than historically resided in the area after many years of migration driven by the upstream diversion of fresh
water resources away from the delta. Saline intrusion continues to be a major challenge in the coastal zone,
degrading land quality and agricultural yields. These issues are likely to intensify, affecting many marginal and
deprived communities.
TABLE 8. The average number of people experiencing flooding per year in the coastal zone in the
period 2070–2100 under different emissions pathways (assumed medium ice-melt scenario)
and adaptation scenarios for Pakistan (UK Met Office, 2014)
Scenario Without Adaptation With Adaptation
RCP2.6 950,300 1,040
RCP8.5 1,207,740 2,190
54
Church, J. a., Clark, P. U., Cazenave, A., Gregory, J. M., Jevrejeva, S., Levermann, A., . . . Unnikrishnan, A. S. (2013). Sea level change. In Climate
Change 2013: The Physical Science Basis. Contribution of Working Group I to the Fifth Assessment Report of the Intergovernmental Panel
on Climate Change (pp. 1137–1216). Cambridge, United Kingdom and New York, NY, USA: Cambridge University Press. URL: https://www.
eea.europa.eu/data-and-maps/indicators/sea-level-rise-5/nicholls-et-al-2010-sea
55
Syvitski, J. P. M., Kettner, A. J., Overeem, I., Hutton, E. W. H., Hannon, M. T., Brakenridge, G. R., . . . Nicholls, R. J. (2009). Sinking
deltas due to human activities. Nature Geoscience, 2(10), 681–686. URL: https://www.nature.com/articles/ngeo629
CLIMATE RISK COUNTRY PROFILE: PAKISTAN 17You can also read