Palm Oil Scoping Paper - Green Commodities Facility - UNDP
←
→
Page content transcription
If your browser does not render page correctly, please read the page content below

UNITED NATIONS DEVELOPMENT PROGRAMME

Palm Oil Scoping Paper

     Green Commodities Facility

                   UNDP
    Internal working document: March 2010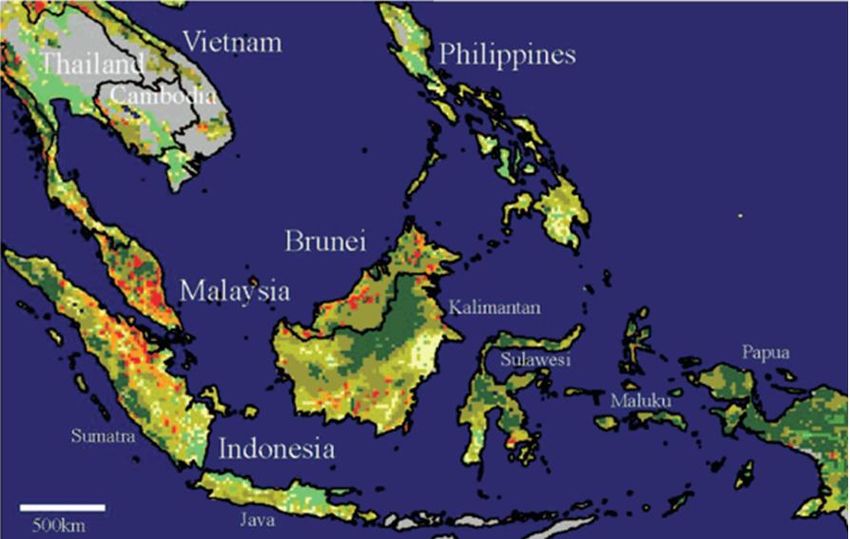
UNDP Green Commodities Facility                                                                                                 Palm oil scoping paper

TABLE OF CONTENTS

1.      Global Importance of Palm Oil ...................................................................................................... 4

     1.1 Scale and global distribution of crop production ........................................................................... 4

     1.2 Importance of palm oil in producing countries .............................................................................. 5

     1.3 Food Security Issues ...................................................................................................................... 7

2.      Global production and trade .......................................................................................................... 8

     2.1 Identification of highest ranking producing countries ................................................................... 8

3.      Supply chain dynamics .................................................................................................................. 10

     3.1 Description of Supply Chain ........................................................................................................ 10

     3.2 Description of major market flows ............................................................................................... 12

     3.3 Role of the public sector in the supply chain ................................................................................ 12

     3.4 Supply chain risks to companies from continued environmental degradation.............................. 14

4.      Commodity Production Systems .................................................................................................. 16

     4.1 Typology of production systems ................................................................................................... 16

     4.2 Spatial distribution of different production systems ..................................................................... 17

     4.3 Description of unsustainable practices of current production systems ......................................... 18

5.      Relationship between commodity and ecosystem services ........................................................... 20

     5.1 Contribution of ES to palm oil production ................................................................................... 21

     5.2 Impact of commodity production on ES ....................................................................................... 22

     5.3 Link to climate change ................................................................................................................ 25

     5.4 Summary of environmental concerns due to commodity cultivation ............................................ 26

6.      Commodity and livelihoods of low income producers ................................................................. 26

7.      Green Commodity Production practices ..................................................................................... 27

     7.1 Farm management practices ....................................................................................................... 27

                                                                                                                                        2|P a g e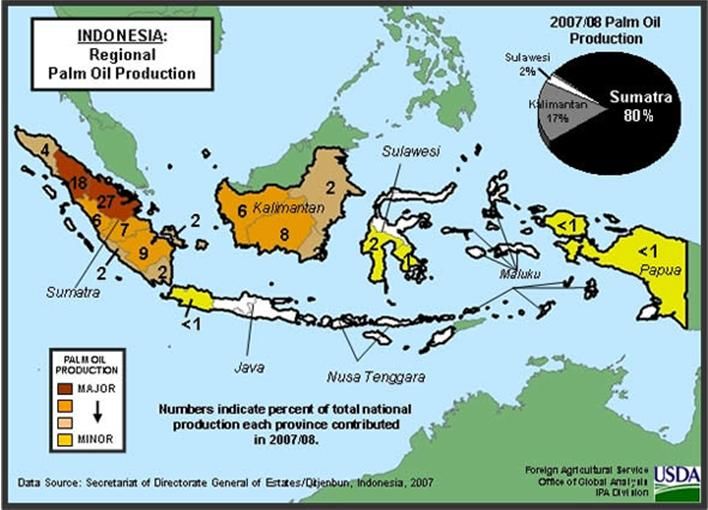
UNDP Green Commodities Facility                                                                                                     Palm oil scoping paper

8.      Economic value of good agricultural practice showing benefits and trade offs .......................... 29

     8.1 Input costs ................................................................................................................................... 29

     8.3 Livelihood benefits from green commodity production ................................................................ 30

9.      Barriers to scale up of good practices for change at a global level and national level ................ 31

10. Tools to promote sustainable palm oil production....................................................................... 32

     10.1 Certification............................................................................................................................... 32

11. GCF STRATEGY ........................................................................................................................ 37

ANNEX I (Additional charts, tables and graphs to keep for database) .................................................... 38

                                                                                                                                             3|P a g e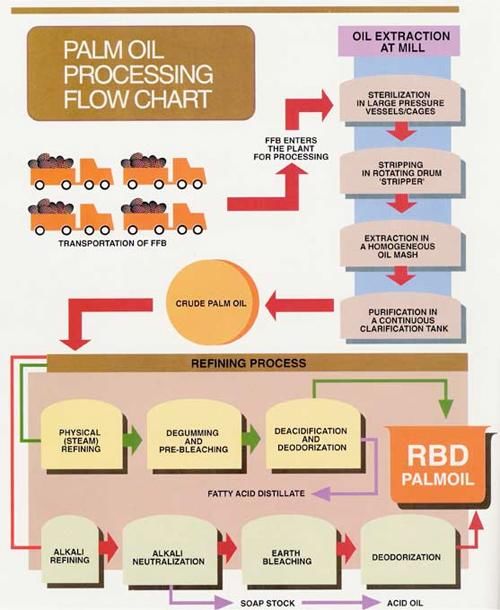
UNDP Green Commodities Facility                                                                                  Palm oil scoping paper

1. GLOBAL IMPORTANCE OF PALM OIL

Summary

Palm oil is a significant and versatile raw material for both food and non-food industries. Consumption of
vegetable oils like rapeseed, soybean and palm oil has increased more than any other food over the past 30
years.1 Cooking oils comprise the majority of palm oil use, while products like margarine, cookies,
crackers, ice cream, candy, soap, candles, cosmetics and lubricants also require it. Well-known companies
such as Unilever, Procter & Gamble, Cargill and Nestle, to name a few, use palm oil in many of their
products. For example, Unilever is one of the world's largest buyers of palm oil, and the company alone
purchases 1.5 million tonnes a year for use in their products, which accounts for about 4% of the total
world supply.2

Globally palm oil tree cultivation exists on a total of 9.7 million hectares 3 and Malaysia and Indonesia
account for about 85 percent of palm oil sold on the world market. 4 Latin America and Africa sell the
remaining 15 percent.

Global demand for the oil is increasing due to population surges, as well as palm oil‟s potential as a first
generation biofuel. Countries like Malaysia and Indonesia are expected to become the world leaders of
palm oil-based biofuel exports. This increasing demand and consumption has placed palm oil on the
agendas of many international NGOs, multi-lateral organizations and governments.

1.1 Scale and global distribution of crop production

Major palm oil producers extend across Asia, Africa and South America. Top producing Asian countries
include Malaysia, Indonesia and Thailand. Nigeria, Cote D‟Ivoire, Colombia, Ecuador and Brazil lead
production in Africa and South America. Germany leads EU production of a small amount of palm oil,
followed by France and Italy. Below is a table from Oil World‟s 2006 report on major producing palm oil
countries dating back to the 1980s into the present (Figures x1000 metric tonnes).

Table 1: Major producing countries

Country         1980              1985             1990             1995             2000             2005            2005
                                                                                                                      Market
                                                                                                                      Share
Malaysia        2576              4133             6088             8123             10,842           14,962          44%
Indonesia       691               1243             2413             4220             7050             14,070          42%
Nigeria         433               386              580              660              740              800             2%
Thailand        -                 -                232              354              525              685             2%
Colombia        -                 -                226              388              524              661             2%
Papua           -                 -                145              223              336              310             1%
New
Guinea
Cote            -                 -                270              285              278              260             1%

1
  Clay, J. WWF 2004. World Agriculture and the Environment, pg 204.
2
  http://www.unilever.com/sustainability/environment/agriculture/sustainablepalmoil/ (retrieved on 09/22/2009)
3
  Clay, J. WWF 2004. World Agriculture and the Environment, pg 203.
(These figures are from 2004, Malaysia and Indonesia have since expanded their cultivated land),
4
  Mongobay http://news.mongabay.com/2008/1108-palm_oil.html (retrieved on 09/15/2009)

                                                                                                                        4|P a g e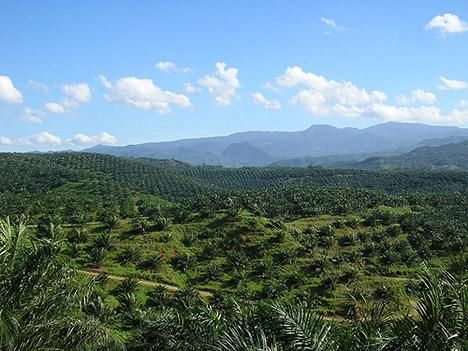
UNDP Green Commodities Facility                                                                          Palm oil scoping paper

D‟Ivoire
Brazil            12              29             66             75              108             169           0%
Others            875             1041           1000           5994            5191            1826          5%
World             4587            6832           11,020         20,322          25,594          33,733        100%
Total
Source: World´s Oil Report 2006

1.2 Importance of palm oil in producing countries

Employment and GDP

Palm oil cultivation and production employs close to seven million people worldwide, a combined labor
force of workers, smallholders and their families.

In Malaysia, palm oil provides employment and
livelihoods for 1.4 million people, directly employing                      Chart 1: Palm oil share in Malaysia
570,000. In 2003, Palm oil contributed to a little more
than 14 percent of Malaysian GDP, a number that has
been gradually shrinking. GDP in this country far
exceeds any other country as far as growth, and Chart 1
shows that increase from the 1970s through 2005.
Palm oil in Malaysia also contributes to 25 percent of
the world‟s traded oils and fats.

In other countries, such as Papua New Guinea, GDP
from agriculture accounts for 32.8%, and palm oil
production and processing have become the leading
commodity beating coffee and cocoa.

The Colombian palm oil farmers‟ and producer‟s
organization known as Fedepalma, which has presence
in 73 of its municipalities, provides 80,000 jobs
benefiting thousands of families and generates regional development.5

Brazil, another up-and-coming palm oil producer in Latin America, roughly produces about 110,000 tons of
crude oil per year. Recently Brazilian mining company VALE invested in a US$500 million palm oil deal
to produce 160,000 tons of biodiesel. In Brazil, this palm oil deal could offer a higher financial return than
could cattle ranching one of Brazil´s strong agriculture activities; in addition palm is estimated to employ
one employee for every 8-10 hectares, thus becoming highly attractive as a new source of employment.
This figure is extremely different than those from the cattle ranching industry, because a single cattle
rancher needs hundreds and thousands acres for his cattle to graze.6

5
    Fedepalma http://www.fedepalma.org/palma.htm (retrieved on 10/07/2009)
6
    Mongobay http://news.mongabay.com/2009/0624-vale_palm_oil_amazon.html (retrieved on 10/07/2009)

                                                                                                                5|P a g e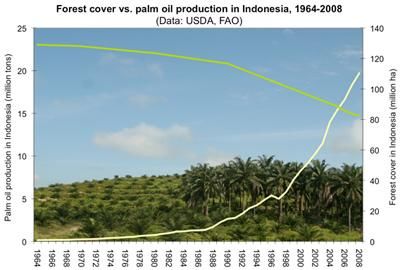
UNDP Green Commodities Facility                                                                                Palm oil scoping paper

Area of land covered

Malaysia alone produces 16-17 million tonnes of palm oil, a crop yield of about 20.6 tonnes per hectare.7
There are about 126 mills that can produce close to five million tonnes of palm oil and palm oil kernel.
Palm oil plantations have grown dramatically since the 1960s, from around 60,000 hectares to a current
four million hectares of cultivated land, representing 13 percent of Malaysia´s land. The state of Sabah is
the largest producer with 35 percent of the country´s total. Sarawak is the second largest producer with 13
percent of the country´s total production. Both states represent an approximate of 1.7 million hectares. 8

The state of Kalimantan in Indonesia has also seen dramatic plantation expansion. In the mid 1980s there
was approximately around 13,140 hectares planted, a figure that has currently expanded into one million
hectares.9 According to Forest Watch Indonesia (FWI), in 2005 palm oil plantations had reached a total of
8.5 million hectares, which on a yearly average has amounted to about 260 thousand hectares. 10 Expansion
of palm oil plantations is projected to increase another 4 million hectares by 2015, due to an increase in
world demand for biofuels.11

Map 1 below shows tropical forest loss from 2000-2005, where palm oil expansion has been the major
driver.

                                                                       Map 1: Forest cover loss in Southeast Asia

                                                                       The map illustrates three levels of forest cover
                                                                       loss by region. Region 1 (in red) covers 6
                                                                       percent of the total biome and contains 55
                                                                       percent of forest cover loss; Region 2 covers 44
                                                                       percent of the total biome and contains 40
                                                                       percent of clearing; and region 3 covers 50
                                                                       percent of the total biome and contains 5 percent
                                                                       of the clearing.12

7
  FAO 2007 State of Food and Agriculture, Page 16
8
  Mongobay http://www.mongabay.com/borneo.html#oil_palm (retrieved on 12/21/2009)
9
  Mongobay http://www.mongabay.com/borneo.html#oil_palm (retrieved on 12/21/2009)
10
   Forest Watch Indonesiahttp://fwi.or.id/english/?p=140
11
   Greenpeace http://www.greenpeace.org.uk/forests/palm-oil (retrieved on 11/02/2009)
12
   World Resource Institute http://www.wri.org/stories/2008/07/groundbreaking-study-finds-hotspots-most-responsible-deforestation
(retrieved on 11/05/2009)

                                                                                                                       6|P a g e
UNDP Green Commodities Facility                                                                                       Palm oil scoping paper

     Future expansion from State Plantation Corporation PT Perkenunan Nusantara (PTPN) in Indonesia

     Expansion of palm oil plantations is projected to double by 2025, when Indonesia will develop about 1.8 million hectares in the
     Kalimantan/Malaysia border region, where most of Borneo's remaining intact forests exists. The PTPN is partnering with China,
     which will invest$7.5 billion in energy and infrastructure projects, including palm oil plantation expansion. Chinese investors
     would directly control about 600,000 hectares of oil-palm plantations, while 1.2 million hectares would be slated for Indonesian
     companies. Based on extrapolations from an average 100,000 hectare concession, the total cost of the project is forecasted by
     Friends of the Earth to be $8.6 billion.

     The project would eventually employ nearly 400,000 people and generate an annual inflow of $45 million in tax revenue to the
     state. The PTPN proposal calls for plantations to be established in three national parks, Betung Kerihun (800,000 hectares), Kayan
     Mentarang (1,360,000 hectares), and Danau Sentarum (132,000) as well as surrounding "protection forest" and production forest
     under logging concessions.

     According to Friends of the Earth (FOE), outside the parks, most forests areas in the region are under concession to logging firms,
     but due to the remoteness and lack of roads, few companies have fully logged their concessions.

     Summary of article from FOE, 2006

In 2008, Thailand palm oil plantations reached 320,000 hectares13, a number suspecting to increase
dramatically within the next 25 years because the government has issued a mandate that all diesel fuel must
have a component of palm oil in it. The government is already planning to increase plantations by 16
percent; from a current estimated 566,000 hectares, to 890,000 hectares by 2012.14 This mandate will
reduce imports of energy but will raise the prices of palm oil products, especially cooking oil. The
settlement is still in debate, but the expansions of new hectares of palm oil are foreseen in Thailand because
they are trying to become competitors in the Asian market.

1.3 Food Security Issues

Food security has become a pressing issue for the palm oil industry due to the emergence of biofuels; staple
foods have experienced price increases, making it a struggle for those living on less that a US$1 a day.
According to the FAO, palm oil plays a crucial role in the everyday diets of humans since it is in many
edible consumer products, and in a study conducted in 2008 palm oil globally represented a daily per capita
calorie intake of 50 out of approximately 2800.15 This is an important figure to note, since cooking oil is
one of the most common products used from palm oil cultivation.

Furthermore, Indonesia and Malaysia are emerging as major players in biofuels market. In the year 2017,
Indonesia is projected to produce close to three billion liters of fuel and Malaysia approximately 1.1 billion
liters.16 This production will surpass the current major biofuel producers like Brazil, the US and the EU.
Figure 6 is the FAO´s projections of major palm oil producing countries that will increase their efforts to
produce more fuel.

13
   Inter Press Service http://www.wrm.org.uy/bulletin/137/Thailand_2.html (retrieved on 12/8/09)
14
   Energy-Daily http://www.energy-daily.com/reports/Thailandz_worries_over_food_shortages_amid_palm_oil_debate_999.html
(retrieved on 10/07/2009)
15
   FAOSTAT 2006. World Food and Agriculture Outlook. Pg 2 http://faostat.fao.org/portals/_faostat/documents/pdf/world.pdf
(retrieved 09/18/2009)
16
   FAO 2008. State of Food and Agriculture, The outlook for biodiesel. Pg. 49 (retrieved 09/09/09)

                                                                                                                             7|P a g e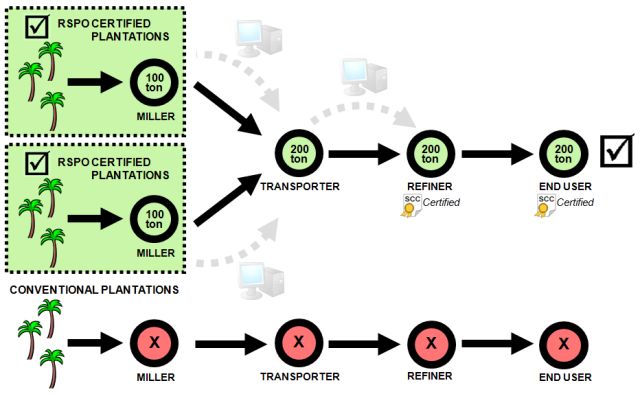
UNDP Green Commodities Facility                                                                           Palm oil scoping paper

Figure 6: Biofuel projection17

As the figure shows Indonesia and Malaysia will be the major players in the production of biofuels which
could continue to have repercussions on the increasing costs of inputs and the clearing of more tropical
forests and peatlands to fulfill a rising demand.

2. GLOBAL PRODUCTION AND TRADE

2.1 Identification of highest ranking producing countries
In the chart below, Indonesia (46 percent) and Malaysia (41 percent) own most of the market share.
Forecasts into the future will most likely continue to look like this chart as Indonesia and Malaysia continue
to expand their production.

Chart 2: Global market share for palm oil

                                                                              The palm oil industry is extremely
                Market share of production
                                                                              lucrative. In Malaysia, 2008 monthly palm
                       2%                                                     oil prices were peaking around RM 3,489
             3% 2%                                                            (US$1,014) compared to RM 1,930
                          6%                                 Indonesia
                                                                              (US$561) in 2007 for Federal Land
                                                             Malaysia         Development       Authority       (FELDA)
                                        46%                  Thailand         settlers.18 However, these figures have
                                                                              dramatically decreased because of the
                                                             Colombia         global financial and economic crisis.
                 41%                                         Nigeria          Crude palm oil in Indonesia has an export
                                                             Other
                                                                              value of US$4.43 billion and brought in
                                                                              officially $42.4 million to the treasury in
                                                                              2007. In that same year the prices per

17
     FAO 2008. State of Food and Agriculture: The outlook for biodiesel. Pg. 49 (retrieved 09/09/09)
18
     http://www.bnm.gov.my/files/publication/ar/en/2008/cp01_002_whitebox.pdf (retrieved on 09/21/2009)

                                                                                                                 8|P a g e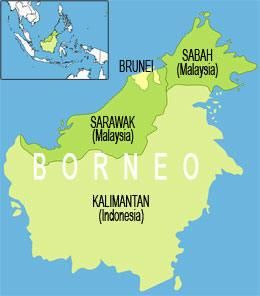
UNDP Green Commodities Facility                                                                                   Palm oil scoping paper

metric ton were $400 an estimated $54 per barrel, making palm oil quite competitive with fluctuating oil
prices.19 Exports of palm oil from Malaysia to the rest of the world account for 90 percent. 20 Table 2 is a
timeline that shows major oil crop production globally and estimated projections up to 2030.

Table 2: Oil crop timeline

Production of oil crops                                                Actual           Growth rates, % per annum
(millions of tonnes)                                                   oil
                                                                       production
         1964/66    1974/76     1984/86    1997/99       2015   2030   1997/99          1969-     1979-   1989-     1999-    2015-
                                                                                        99        99      99        2015     2030
Soy      5.8        10.8        17.2       27.7          42     58     22.5             4.1       3.2     4.5       2.5      2.2
Palm     2.1        3.7         8.7        21.6          35     49     21.6             8.2       7.7     6.5       2.8      2.3
Total oil crops (soybeans, palm oil, rapeseed, sunflower seeds, groundnuts, coconuts, cottonseed, sesame
seed, other oil crops)
         29         39          62         104           157    217    83               4.1       4.1     4.3       2.5      2.2
(Source FAO)

The first two rows represent both soy and palm oil production, and the bottom represents the total of all oil
crops production combined together. From Table 2, production of palm oil is quickly catching up to soy
and growth rates are slowly decreasing, which could have a correlation with the smaller amount of
available land available for cultivation.21

Characteristics of the international market

The international consumer market spans the globe, and as Table 3 below shows that China, EU countries
and India are the major importers of palm oil. Indonesia and Malaysia lead exports.

Table 3: Major palm oil exports, imports and consumption (figures in million of tonnes)

Country                      Exports              Imports                   Palm Oil                      % of Global
                                                                            consumption                   Consumption
China                                             5.66                      5.64                          14.6%
Colombia                     0.24                                           0.51                          1.3%
EU-27                                             4.91                      4.74                          12.3%
India                        0.01                 3.55                      3.58                          9.3%
Indonesia                    13.15                                          3.99                          10.3%
Malaysia                     14.15                0.39                      2.32                          6.0%
Nigeria                      0.01                 0.23                      1.04                          2.7%
Pakistan                                          1.67                      1.58                          4.1%
Thailand                     0.25                 0.04                      0.74                          1.9%
USA                                               0.71                      0.67                          1.7%
Other                        2.59                 13.14                     13.65                         35.4%

Total                        30.40                30.30                     38.48
Source from Lipidlibrary22

19
   http://news.mongabay.com/2006/0425-oil_palm.html (retrieved on 09/21/2009)
20
   Clay, J. WWF 2004. World Agriculture and the Environment, pg 207.
21
   FAO 2003. World Agriculture Towards 2015, Pg. 101 (retrieved on 11/02/2009)
22
   Lipidlibrary Data http://www.lipidlibrary.co.uk/market/palmoil.htm (retrieved on 11/02/2009)

                                                                                                                          9|P a g e
UNDP Green Commodities Facility                                                                        Palm oil scoping paper

3. SUPPLY CHAIN DYNAMICS

3.1 Description of Supply Chain
                                                                      Figure 2: Marketing channel flow chart from
                                                                  Food and Fertilizer Technology Center23

The palm oil supply chain is dynamic and a thorough
analysis should be captured on a country-by-country
basis. Figure 2 is an example of a flow chart of the
Malaysian supply chain.

The breakdown of the Malaysian supply chain starts
with three major types of producers: independent
smallholders, producers in land development schemes
and private estates. Once the palm oil kernels are
removed from the plantations the first step is to
process the kernel which takes place on mills outside
the farms. Most of the marketing and selling takes
place during this stage. Private owners usually have a
well established marketing system where their product
can get to local manufacturers and be exported out
into the global market.

Development schemes, which are lands lent to settlers who are willing to give up their previous occupation
to produce palm oil, are different than the estates because they are managed through Malaysia‟s Federal
Land Development Agency (FELDA). FELDA‟s develops new land for plantation areas using effective
agriculture management to yield the highest production.24 In addition, FELDA is also in charge of
marketing the palm oil and selling the refined product to local manufacturers to export. FELDA operates
close to 880,000 hectares of plantations. 25

Small landowners are faced with a more difficult task because they must rely on middlemen and FELDA to
get their product to the mills and refineries, yielding low productivity. Accessing local markets becomes
difficult because of lack of proper infrastructure such as roads, mills and refineries. Finally, the refined
palm oil is taken to locals markets, processors and manufacturers and then exported to foreign countries.

Once it is exported, companies like Unilever, Nestle and Procter & Gamble use the refined palm oil and
processes in their products. Unilever uses the palm oil because of its particular characteristics to produce
soaps like Dove, and food products like Belcel margarine (See Table 4 for a list of products). The products
are then sent out to the market (e.g. Walmart) for consumption. Many of these companies are now
working in conjunction with the Roundtable of Sustainable Palm Oil (RSPO) to solely purchase certified
produced palm oil. Efforts are being made so that companies can utilize this certification system so
consumers can trace where the palm oil is coming from (Refer to section 10 for more information).

23
   AGNET http://www.agnet.org/library/eb/392/ (retrieved on 12/21/2009)
24
   FELDA. http://www.felda.net.my/felda/english/fel_faq.asp (retrieved on 10/02/2009)
25
   FELDA http://www.feldaholdings.com/content.php?h=145&lang=EN (retrieved on 12/21/2009)

                                                                                                             10 | P a g e
UNDP Green Commodities Facility Palm oil scoping paper
However, because of public pressure some of the major palm oil producing companies have been taking
action. Chances are that these palm oil companies already knew but are only taking action because of the
public outcry about the environmental impacts that they create. One of the major organizations aiding the
palm oil companies is as just mentioned the RSPO, a conglomerate association that unites stakeholders
from seven sectors of the palm oil industry: Oil palm producers, palm oil processors or traders, consumer
goods manufacturers, retailers, banks and investors, environmental or nature conservation NGOs and social
or developmental NGOs developing and implementing global standards for sustainable palm oil. The table
below describes each sectors functions and interests (Refer to section 10 for more information).
Table 4: Main stakeholder´s interests and functions
Stakeholder Function and Interest
Oil palm producers Produce palm oil and achieve accredited sustainable status for their crop.
Therefore must comply with no-burn policy for land management, conserve
biologically diverse areas, mitigation from palm oil pollution, reduce use of
fertilizers and pesticides, fair labor practices and improve yields. 26 4 members
from this group sit on the RSPO General Assembly.
Palm oil processors/traders Process palm oil and are interested that the product they process comes from a
reliable RSPO member source. Processed palm is traded into the market as an
accredited product. 2 members from this group sit on the RSPO General
Assembly.
Consumer goods manufacturers Manufacture products such as cooking oils, soaps, margarine, etc. Then product
is sold to retailers with an accredited certification status. 2 members from this
group sit on the RSPO General Assembly.
Retailers Sell and showcase sustainable palm oil products for consumers to purchase. 2
members from this group sit on the RSPO General Assembly.
Banks and investors Responsible investment for palm oil industry, where they engage in improving
risk analysis and decision-making tools. 2 members from this group sit on the
RSPO General Assembly.
Environmental/Nature NGOs Represent civil society on the issues pertaining to environmental advocacy
towards the palm oil industry (e.g. biodiversity protection). 2 members from this
group sit on the RSPO General Assembly.
Social/development NGOs Represent civil society on the issues pertaining to social aspects of the palm oil
industry (e.g. workers rights) 2 members from this group sit on the RSPO
General Assembly.
Table 5: List of palm oil products
Major Buyers Edible Products Non-edible products
Unilever Bacel margarine Dove soap, Lux
Nestle KitKat, Good Start
Procter & Gamble Pringles
Cargill Cooking oil, butter oil replacement
Cadbury Schweppes plc Canada Dry, Dr. Pepper Halls Throat
Newman O‟s Newman O‟s champion chip cookies
Maruchan Instant Lunch noodle soups
Smart Balance Butter
HJ Heinz Heinz Ketchup, Bagel Bites
ConAgra Foods Blue Bonnet table spread
Nabisco Ritz crackers, Oreo
Arnott‟s Tim Tam chocolate
Johnson & Johnson Ben Gay, Purpose Soap
Reckitt Benckiser AirWick, Clearasil,
L‟Oreal Garnier
26
Mongobay. http://news.mongabay.com/2008/1110-palm_oil.html (retrieved on 10/05/2009)
11 | P a g eUNDP Green Commodities Facility Palm oil scoping paper
3.2 Description of major market flows
Palm oil produces more per hectare of land than any other oil-producing crop. Palm also is used in about
50 percent of all packaged foods in supermarkets today. As mentioned previously, palm can be found in
foods (i.e. margarine, ice cream) and non-edible products (i.e. shampoos, soap). Table 6 and 7 are a list of
the major buyers, manufacturers and producers of palm oil world wide.
Table 6: Major buyers of palm oil
Major Buyers and Manufacturers27 Sector
Sainsbury (UK), Marks & Spencer (UK), Migros (Switzerland), Asda (UK), Coop Switzerland Retail
(Switzerland), Carrefour (France), Tesco (UK), ICA (Sweden), Co-Op (UK/Sweden), Ahold/Albert Hejin
(Netherlands), SOK (Finland), IKEA (Sweden), Morrisons (UK), Delhaize (Belgium), Waitrose (UK),
Lidl (UK), Kesko (Finland), Rewe Group (Germany), E. Leclerc (France), Deen (Netherlands), Edeka
Zenntrale (Germany), Superunie (Netherlands), Super de Boer (Netherlands), Aldi (UK/Germany),
Auchan (France), C1000 (Netherlands), Colruyt Group (Belgium), Geant Casino (France), Les
Mousquetaires (France), Magasin U (France), Metro (Germany), Spar International (Netherlands)
Young´s/Findus (UK), Unilever (UK/Netherlands), United Biscuits (UK), Burton´s Foods (UK), Premier Food
Foods (UK), Arla (Sweden), Northern Foods (UK), Birds Eye (UK), Jordans Ryvita (UK), Mildola
(Finland), Nestle (Switzerland), Britannia Food Ingredients (UK), Warburtons (UK), Danone (France),
Axfood (Sweden), Raisio (Finland), Associated British Foods (UK), Brioche Pasquier (France)
Unilever (UK/Netherlands), The Body Shop (UK/France), L´Oreal (France), Henkel (Germany), Reckitt Personal/household care
Benckiser (UK), Boots (UK), Croda International (UK)
Table 7: Largest palm oil producers
Producing Countries Major Companies
Indonesia, Malaysia, Thailand and Papua New Guinea Astra Agro Lestari, Salim Group, Sinar Mas Group/PT SMART,
Barito Pacific, Bakrie Brothers, Duta Palma, PT Perkebunan
Nusantara, SOCFIN, PT PP London Sumatra, SIPEF, Cargill
Indonesia, IOI Corporation, Wilmar International, Pacific Rim
Palm Oil Limited, IJM, IPOC, New Britain Palm Oil
Colombia FEDEPALMA
Nigeria PRESCO PLC
According to the WWF, In Sumatra, as of 2000, 70% of forest areas converted to oil palm plantations in
Indonesia lay within the six Sumatran provinces of Riau (658,139 hectares), Jambi (259,115 hectares),
Aceh (219,382 hectares), West Sumatra (134,885 hectares), Central Kalimantan (120,413 hectares) and
South Kalimantan (103,557 hectares) (Refer to page 15 for more information).28 An example of ownership
from the above table is Astra Agro Lestari; where they manage 250,883 hectares of oil palm plantations in
Kalimantari, Sumatra, and Sulawesi, and employs around 22,000 people.29
3.3 Role of the public sector in the supply chain
Description of marketing and purchasing by state
The two main institutions in Malaysia that oversee marketing information and pricing for palm oil are the
Palm Oil Registering and Licensing Authority (PORLA) and the Kuala Lumpur Commodity Exchange
(KLCE). PORLA is in charge of ensuring efficient market monitoring, collecting data and information
dissemination. KLCE is a price hedging facility that reduces the risks to industry participants. 30
27
WWF http://assets.panda.org/downloads/wwfpalmoilbuyerscorecard2009.pdf (retrieved 12/31/2009)
28
WWF 2007. Climate Change, Deforestation and the Role of Sustainable Palm Oil pg. 3
29
Astra Agro Lestari 2008 Annual Report. http://www.astra-agro.co.id/images/stories/Article/AnnualReport08.pdf (retrieved on
09/21/2009)
30
Mohd et al. Faculty of Economics and Management, Universiti Pertanian Malaysia. Pg 6 http://www.agnet.org/library/eb/392/
(retrieved 09/09/09)
12 | P a g eUNDP Green Commodities Facility Palm oil scoping paper
Subsidies and incentives (agrochemical use, land extensification, energy)
Europe and the US have been major players behind subsidizing crops that can be used for biofuel
production. In the case of Europe, biodiesel is largely demanded as an alternative to petroleum. Malaysia
and Indonesia are setting aside parts of their production because palm oil is becoming another global
energy option. However, the urge to push biofuels on country´s agendas has caused skepticism because
now vast tracks of tropical forest and peatlands are being converted to palm oil plantations.
Europe is now beginning to rethink the large investment that they placed in subsidies for biofuels. In 2003,
the EU put forth a mandate called the EU Biofuels Directive, which demands that participating countries
have a minimum percentage (5.75%) of biofuels as an alternative to petroleum and diesel. The mandate is
under review since palm oil is one of the types of biofuels covered under this legislation (other sources are:
bioethanol, biodiesel, biogas, biomethanol and bio-oil).31
In spite of this, Malaysia and Indonesia´s efforts to feed the world´s demand for palm oil and most recently
as a biofuel, smallholder farmers are subsidized by the government to produce the crop. They are given
subsidies to purchase seedlings, fertilizers, herbicides and other supplies. In Indonesia, the government has
planned to pay 1000 rupiah (EU 0.07) per liter of palm oil produced; this remains true if the prices of
biofuels are higher than the price of crude oil.32
Producer country regulations on the commodity
In the case of the Malaysian palm oil industry, it is highly regulated. Currently, the industry is adhered to
more than 15 laws and regulations and following represent a few examples of them:
- Land Acquisition Act 1960
- Environmental Quality Act 1974
- Environmental Quality (Clean Air Regulations) 1978
- Pesticides Act 1974 (Pesticides Registration Rules)
- Occupational Safety and Health Act (1977)
- Protection of Wildlife Act 1972.
The industry also needs to comply with Hazard & Critical Control Points (HACCP) and the Environmental
Impact Assessment (EIA) requirements. Being sensitive and proactive with respect to current
environmental concerns, the industry is actively pursuing ISO 14000 standard series discussions and
formulations notably on climate change, life cycle analysis (LCA), eco-labeling & Design for the
Environment (DfE), environmental communications, and environmental management system (EMS). 33
The Malaysian government recently released a public note that it will now prohibit the clear-cutting of
forests for any new establishment of palm oil plantations. The only areas that will be allowed the
development of plantations are areas that are specifically zoned for agriculture. The Malaysian Prime
Minister stated that they will not encourage deforestation for the purpose of palm oil plantations, that there
31
EU
http://europa.eu/legislation_summaries/internal_market/single_market_for_goods/motor_vehicles/interactions_industry_policies/l210
61_en.htm (retrieved on 12/09/2009)
32
PalmOil HQ http://www.palmoilhq.com/PalmOilNews/indonesia-to-subsidise-palm-oil-biofuel/ (retrieved on 12/09/2009)
33
Malaysian Palm Oil Council (MPOC). http://www.mpoc.org.my/Palm_Oil_and_The_Environment.aspx (retrieved on 09/22/2009)
13 | P a g eUNDP Green Commodities Facility Palm oil scoping paper
is still plenty of agriculture land available. 34 The Malaysian government is trying to clean up their image
and improve their environmental standards. They have not joined the RSPO but do have an active chapter
in Malaysia, where many palm oil producers are members.
However, there exists somewhat of a flaw in this note presented by the Malaysian Federal Government.
The Federal structure relating to land (including land conversion) is under the jurisdiction of state
governments rather than the federal government, so the aforementioned policy would only hold its truth if
states agree to it. So far this is not a problem in most states, except in Sarawak. In this state the
government is still expanding into new areas where most of the remaining forests exist, including the
majority of the peat forests. 35
Import regulations into US, EU, etc.
Regulations on imports are increasing especially in the EU. The demand for biofuel is rising and the EU is
setting targets of making them 5.75 percent of fuels for transport by 2010. However, the EU is concerned
that production of biofuel can increase deforestation rates and thus increase greenhouse gases.
The EU is proposing a ban on certain types of crops that come from forests, wetlands and grasslands. The
ban is targeting biofuels that come from crops such as palm oil. This would highly affect the Southeast
Asia palm oil industry, specifically in Indonesia where deforestation rates and peatland conversion are
expanding at alarming rates. The ban is being taken into consideration by EU officials until further
advancements, however officials emphasize that the source of palm oil come from sustainable sources (i.e.
RSPO).36
Regulations in the US, China and India are also rising. The regulations being created are pressures from
consumers demanding sustainable sources of palm oil in their products. Although China and India are the
major importers of palm oil, countries like Malaysia who export over 90 percent of their product, must
comply with what the world demands.37
3.4 Supply chain risks to companies from continued environmental degradation
Advocacy pressure groups
The palm oil industry is showing signs of improving their image. Companies are at risk because of the
public‟s pressure on the high rates of deforestation, habitat conversion and threats to critically endangered
species. The industry is at risk because of the purchasing power consumers have, especially when pristine
forests and the species living in them are directly threatened. Species such as orangutans, tigers, and bird
species are disappearing and have become the identity of many campaigns to boycott unsustainable palm
oil.
Advocacy groups such as Friends of the Earth, Greenpeace and The Palm Oil Action Group have been
pushing companies to eliminate palm oil or source RSPO certified palm oil for their products. Cadbury
34
Mongobay http://news.mongabay.com/2008/0626-palm_oil.html (retrieved on 09/28/2009)
35
Joseph De Cruz. Regional Advisor for GC Facility in Asia (retrieved on 11/05/2009)
36
NY Times http://www.nytimes.com/2008/01/15/business/worldbusiness/15biofuel.html (retrieved on 10/02/2009)
37
CEO Palm oil http://www.ceopalmoil.com/de-linking-ngos-concerns-over-deforestation-and-palm-oil/ (retrieved on 12/21/2009)
14 | P a g eUNDP Green Commodities Facility Palm oil scoping paper
New Zealand recently issued a press release that they are eliminating all palm oil from their dairy milk
chocolate because of consumer pressure.
KFC Australia also recently issued a press release that it will be moving away from palm oil because of
consumer pressure to change the cooking oil used for frying. Health issues have been associated to the use
of palm oil, which is low in trans-fat but high in saturated fat contributing to cardiovascular diseases. 38
Unilever by far is the biggest consumer of palm oil, whose popular products Dove soap and Flora
margarine use the oil as the primary component. Greenpeace groups have been protesting against Unilever
and about how they are not sourcing their palm oil from sustainable sources. As a founding member of the
RSPO, Unilever has recently halted contracts from two of their palm oil sources in Indonesia, Duta Palma
and PT Smart.39 Both these companies are members of the RSPO, but have been contributing to illegal
logging and the disappearance of orangutans, which is against Indonesian law.
Availability of land and expansion
Tropical forests and peatlands in Indonesia and Brazil are the two areas in the world where the largest and
fastest amount of land is being cleared for agricultural purposes. Indonesian palm oil production in the
1990s tripled, and from 2000 thru 2007 it doubled. This expansion is due to the global demand for food,
feed, and now biofuels. Agricultural subsidies in Indonesia are also adding incentives for farmers to
increase production in palm oil.
The following table shows how much land as of 2006 are currently plantations and what projections are
there for the future. To see a detailed map of the planned expansion, please see Map A.2 of Annex I.
Table 8: Area of Palm Oil Plantation and Future Government Planned Expansion
Province Area (Ha.) Area (Ha. Of expansion)
Sumatra
Nanggroe Aceh Darussalam 222,389
Sumatera Utara 1,093,033 1,000,000
Sumatera Barat 489,000 500,000
Riau 1,486,989 3,000,000
Jambi 350,000 1,000,000
Sumatera Selatan 416,000 1,000,000
Bangka Belitung 112,762 500,000
Bengkulu 81,532
Lampung 145.619 500,000
Aceh 340,000
Java
Jawa Barat 3,747
Banten 17,375
Kalimantan
Kalimantan Barat 349,101 5,000,000
Kalimantan Tengah 583,000 1,000,000
Kalimantan Selatan 391,671 500,000
Kalimantan Timur 303,040 1,000,000
Sulawesi
Sulawesi Tengah 43,032 500,000
Sulawesi Selatan 72,133 500,000
Sulawesi Tenggara 3,602 500,000
Papua
38
The Sydney Morning Herald June 2009 http://www.smh.com.au/lifestyle/wellbeing/finally-kfc-opts-for-the-good-oil-20090616-
cdla.html (retrieved on 02/22/2010)
39
The Independent February 2010 http://www.independent.co.uk/environment/nature/unilever-drops-major-palmoil-producer-
1906474.html (retrieved on 02/23/2010)
15 | P a g eUNDP Green Commodities Facility Palm oil scoping paper
Papua 40,889 3,000,000
Total 6,059,441 19,840,000
Source: Forest People (2006)40
As seen in the table above, the expansion of palm oil in Indonesia is massive. The Indonesian Department
of Agriculture states that are approximately 27 million hectares of unproductive or degraded forest land
(i.e. logging and cultivation) that investors are interested in. 41 This data brings forward multiple risks for
an industry already under large amounts of public pressure. Organizations such as the WWF, WRI, and
IUCN state that current palm oil practices are not sustainable, and forest laws like those that exist in
Indonesia are not being enforced. Furthermore, palm oil companies who are members of RSPO only put
the system under check, since one of their underlying principles for certification is not to plant on forested
lands. However, the lands in the table above are categorized under degraded lands; further research should
be conducted to determine the status of those degraded lands.
4. COMMODITY PRODUCTION SYSTEMS
4.1 Typology of production systems
Types of production systems
It is estimated that that more than 95 percent of palm oil is grown on acidic, less fertile soils. Most palm oil
soils have a pH less than 5.0, and six out of eight have low to very low nitrogen content, available
phosphorus and exchangeable potassium.
Palm oil planted on these types of soils reacts to the applications of fertilizers, and characteristics such as
texture and depth are crucial for large-scale plantations. Palm oil can grow on a wide range of soils, such
as igneous, sedimentary rocks, peat, and volcanic ash. In a study conducted by Better Crops International
(BCI), most palm oil is found planted in soils of about 60 cm deep. Palms that reach heights of over eight
meters, ideally need an extensive root expansion (>80 cm), adequate application of water and nutrients,
which why fertilizers are commonly used.42
Proportion of production carried out by small producers vs. agro-business and average
sizes/dimensions of production sites
In producing countries, palm oil is normally grown on three types of farms: small-scale, medium-scale and
large-scale farms. Although originally palm oil trees grow in the wild, the popularity of this commodity
has led to large-scale plantations.
40
Forest People (2006) http://www.forestpeoples.org/documents/prv_sector/oil_palm/promised_land_eng.pdf (retrieved on
02/23/2010)
41
Ibid
42
Better Crops International 1999. Suitability of Soils for Oil Palm in Southeast Asia,
http://www.ipni.net/ppiweb/bcropint.nsf/$webindex/0E6C325D25A04F80852568F6005A0DC1/$file/i99-1p36.pdf (retrieved
09/14/2009)
16 | P a g eUNDP Green Commodities Facility Palm oil scoping paper
Small-scale farms are primarily used for basic subsistence. In Africa, a family cultivates in a small plot.
These plots may cover approximately 7.5 hectares and are usually scattered. The land tenure system does
not permit large-scale farming unless the government acquires the land for public use.43
Medium-scale farms can range from 10-500 hectares. The practices usually include modern agricultural
practices like fertilization, weeding, plant spacing and cover cropping. Contrary to small-scale farmers,
medium-scale farmers sometimes own their mills because of poor conditions and access to roads.44 In parts
of the Americas, farmers with palm oil plantations of 400 hectares have been constructing their own mills. 45
This is because many of these areas are extremely rural and do not access to an efficient roadway system.
Large-scale farms cover areas that extend across 500 hectares or more. In Africa they are well established
state-owned enterprises that use sophisticated farming techniques. Many large-scale farms are now being
bought by private entities so governments will not engage in businesses. 46
In Latin America and Southeast Asia palm oil production is comprised mainly of large-scale plantations. In
Southeast Asia plantations can range in size anywhere from four square kilometers (400 hectares) to 729
square kilometers (72,900 hectares).47 In addition, large-scale farms usually have nurseries that accompany
their operations. These nurseries grow palm oil seedlings that are planted within a year. Within two to
three years the palms start to flower, and can produce fruits anywhere up to 50 years.48
4.2 Spatial distribution of different production systems
Map showing geographical distribution of different systems of production
Map 2: USDA49
Map 2 is an example of where and how large
the Indonesian palm oil production has
expanded and grown throughout the country,
specifically in Sumatra where production is
the greatest. To see an example of the major
Malaysian palm oil regions refer to Map A.1
in Annex I.
43
FAO 2002. Small-scale oil processing in Africa, http://www.fao.org/DOCREP/005/y4355e/y4355e03.htm#TopOfPage (retrieved
09/14/2009)
44
FAO 2002. Small-scale oil processing in Africa, http://www.fao.org/DOCREP/005/y4355e/y4355e03.htm#TopOfPage (retrieved
09/14/2009)
45
Clay, J. WWF 2004. World Agriculture and the Environment, pg 212.
46
FAO 2002. Small-scale oil processing in Africa, http://www.fao.org/DOCREP/005/y4355e/y4355e03.htm#TopOfPage (retrieved
09/14/2009)
47
Clay, J. WWF 2004. World Agriculture and the Environment, pg 208.
48
Clay, J. WWF 2004. World Agriculture and the Environment, pg 208.
49
FAO 03/19/2009. http://www.pecad.fas.usda.gov/highlights/2009/03/Indonesia/ (retrieved on 09/15/2009)
17 | P a g eUNDP Green Commodities Facility Palm oil scoping paper
4.3 Description of unsustainable practices of current production systems
Production extension (deforestation)
Figure 3: Photo from Treehugger
Indonesia and Malaysia are the main countries in the world
where deforestation for palm oil is occurring at alarming
rates. Forests are being replaced by medium and large-
scale plantations, for which they must be clear-cut or
burned. The lands are then shaped into grids, as shown in
Figure 3.50
Current rates of deforestation in Indonesia are some of the
largest in the world. According to the FAO, between 2000
and 2005 Indonesia became the nation with the second
largest area of deforestation in the world with about 1.87
million hectares cleared annually, nearly two percent of its
forest each year.51 Brazil is currently in the lead with 4.3
52
million hectares from 2000-2005. During the mid-1990s, the Indonesian government set aside 9.13
million hectares for palm oil cultivation. By 2004, 58 percent of this area was planted, and the rest is still
being cleared because of their 2025 projections doubling palm oil production.53 Most recently and
according to Global Forest Watch, 16 million hectares of natural forest have been designated to timber
companies or agriculture plantations. 54
In the beginning of the 20th century, crops such as cocoa, rubber, palm oil, coffee, pineapple and tea were
the main crops being planted in Indonesia and Malaysia. However, through the great depression, WWI and
WWII, most of these crops gave way to palm oil as the main crop. Rubber and cocoa farms are still
present, but are struggling to remain profitable, which is why palm oil is the leading commodity for export.
Therefore, Indonesia and Malaysia have a good quantity of hectares of degraded land that can be used
instead of pristine rainforests, a fact that some palm oil companies are taking into consideration. A few
cases where this is most notable are in the regions of Sabah and Sarawak in Malaysia, where rubber farms
are being replaced by palm oil.55
The conversion of tropical forests to palm oil plantations has raised many issues across the globe. In
Southeast Asia deforestation poses a major threat to biodiversity and the ecosystems of the region.
According to the World Resource Institute (WRI), at current rates of deforestation Indonesia is losing two
million hectares of forest every year. 56 Malaysia and Indonesia are categorized by the World Resource
Institute (WRI) as biologically diverse hotspots, home to some of the most unique species in the world.
Habitat conversion of tropical and peatland forests is also affecting endangered species in Southeast Asia,
specifically orangutans in Sumatra and Borneo. Scientists estimate that there are only around 60,000
50
Treehugger photo http://www.treehugger.com/20090217-oil-palm-plantation.jpg (retrieved on 09/15/2009)
51
FAO 2006. http://www.palmoilaction.org.au/pages/deforestation.html (retrieved on 09/15/2009)
52
Mongobay. http://news.mongabay.com/2005/1115-forests.html (retrieved 10/02/2009)
53
Mongobay, http://news.mongabay.com/2006/0425-oil_palm.html (retrieved 10/02/2009)
54
Global Forest Watch http://www.globalforestwatch.org/english/indonesia/forests.htm (retrieved on 12/08/2009)
55
Clay, J. WWF 2004. World Agriculture and the Environment, pg 209.
56
World Resource Institute (WRI). http://www.globalforestwatch.org/english/indonesia/overview.htm (retrieved on 09/17/2009)
18 | P a g eUNDP Green Commodities Facility Palm oil scoping paper
orangutans in wild and on average about 5000 orangutans are killed yearly. At this rate it is possible that
orangutans go extinct in close to 12 years. According to the IUCN orangutans in Sumatra are listed as
critically endangered. As palm oil plantations continue to expand habitat fragmentation will be the
orangutan‟s number one threat. In addition, orangutans are also illegally poached and deliberate forest fires
are set to clear cut their habitat.57 The following are other species that are under severe threat from the
expansion of palm oil in Southeast Asia: Borneo Orangutan, Sumatran Orangutan, Sumatran Tiger, Borneo
Wild Cats, Asian Elephant, Jaguars, Sumatran Rhinoceros, Tapir and Sun Bear.
The island of Borneo is also another area with high deforestation rates. The map below shows forest cover
in 1950 compared to 2005. During the 1990s many forested areas caught fire clearing many thousands of
acres and international NGOs blame the logging and palm oil corporations.
Map 3: Forest cover from WWF 58
Labour requirements and mechanization
Palm oil plantations are labor-intensive. The trees must be looked after and protected so they can develop
into productive crops, requiring careful pruning and cutting of the kernel bunches to avoid damaging the
plant. Healthy plantations require protecting the palm oil tree throughout its fruit-producing life and
making sure that other crops do not take away the resources it needs, such as nutrients, water and light.
Therefore, fertilizers and herbicides are applied to keep the trees pest-free and productive.
Water use requirements and mechanization
Palm oil is a fast growing crop with high productivity, so it is water-intensive. Most palm oil is grown in
tropical regions, and rain water is utilized to the fullest. However, because palm oil plantations intend to
produce fruit at the highest yields, many plantations in Southeast Asia have been implementing drip
irrigation systems. The crop water requirement is estimated at 1.4 to 2.8 mm/day in the nursery stage and
2.4 to 5.5 mm/day in the main field.59
However according to an article written by AllBusiness, plantations do waste rain and surface water
through inefficient storage and distribution. The inefficiency is high because many palm oil plantations are
57
http://goliath.ecnext.com/coms2/gi_0199-4243373/Runaway-fires-smoke-haze-pollution.html (retrieved on 10/02/2009)
58
WWF map. http://hubpages.com/hub/The-Problem-With-Palm-Oil (retrieved 09/17/2009)
59
Netafim 2009. http://www.netafim.com/crop/oil-palm (retrieved on 09/18/2009)
19 | P a g eUNDP Green Commodities Facility Palm oil scoping paper
in areas that yearly receive rainfall of about 2000mm+. Since proper storage is unavailable, fertilizer
runoff and pollution of local waterways commonly occurs. If irrigation was to be developed on field, scale
benefits could be far greater than just higher yields-water could be harnessed in irrigation structures which
are commonly utilized for drinking water as well.60
Chemical inputs
Rats are the most common pests found in palm oil plantations, because they feed on the palm oil seeds.
When forests are cleared, rats lose their predators like snakes, and poison is used to kill them off. This is
successful; however the poison spreads and kills other animals as well. Other pests that exist on plantations
are bagworms and nettle caterpillars. These insects feed on the palm oil branches and fronds damaging
them to point of decay. Insecticides are used and are either applied by spot spraying or injection into the
trunks of the palm oil tree.
Furthermore Paraquat is an herbicide used on plantations and is commonly used worldwide, and has
negative side effects if inhaled or exposed to skin. Paraquet has been a successful herbicide used on weeds
like ferns and woody shrubs. However, the main risk associated with this herbicide is the plantation
workers‟ exposure to it, because it can cause nosebleeds, eye irritation and skin irritation.
Other chemical inputs for oil plantations are the use of fertilizers to enhance the palm oil yields, although,
palm oil requires fewer fertilizers than other oil seeds. The major fertilizers used for palm oil plantations
are nitrogen, phosphorus and potassium. Problems arise from the runoff of these chemicals because they
get into the local waterways contaminating downstream communities‟ water supply.
Review of intensification processes, green revolution, and higher yielding varieties for the crop.
Palm oil yields have grown due to implementation of newer agricultural techniques, such as the application
of fertilizers. Trees are now more productive than previous generations of palm oil; trees would reach their
prime in years 20-25, however now the palm oil tree can begin to produce extractable fruit within 2-3
years.
In Indonesia and Malaysia, the agriculture sector is experimenting with eight new hybrid clones, which are
expected to increase production from 3.5 tons of oil per hectare per year, to as much as 6.8-8.0 tons per
hectare per year.61
5. RELATIONSHIP BETWEEN COMMODITY AND ECOSYSTEM
SERVICES
According to the Millennium Ecosystem Assessment, ecosystem services are the benefits humans receive
from resources and processes that natural ecosystems provide. They are broken down into four different
types of services, provisioning (food, water, timber and fibers); regulating (affects climate, floods, disease,
wastes, and water quality); cultural (recreational, aesthetic and spiritual benefits); and supporting (soil
formation, photosynthesis and nutrient cycling).
60
http://www.allbusiness.com/manufacturing/food-manufacturing-grain-oilseed-milling/306427-1.html (retrieved on 10/02/2009)
61
Forest Peoples Programme pg. 26 http://www.forestpeoples.org/documents/prv_sector/oil_palm/promised_land_eng.pdf (retrieved
on 02/23/2010)
20 | P a g eUNDP Green Commodities Facility Palm oil scoping paper
This next section will aid in the understanding of what ecosystem services, like those just mentioned above,
contribute to the cultivation and production of palm oil.
5.1 Contribution of ES to palm oil production
Pollination
Palm oil is a cross-pollinated crop. Pollination of can be aided if a weevil (Elaedobius kamerunicus) is
introduced into the plantation to assist in fertilizing the female flowers. The weevils congregate and
multiply on male inflorescence during flower opening, and visit the female flowers and pollinate them
effectively.
Water Availability and Quality
Water availability and quality are essential for the cultivation of palm oil. The majority of palm oil is
planted in areas that receive large amounts of rain, such as in the tropics, where a healthy tree needs close
to 1800-2000mm of rainfall per year, high air humidity and at least 1900 hours of sunshine. Water quality
is also another important component since it helps cycle nutrients and maintains pH levels suitable for
proper growth of palm oil tree.
Pest control
As stated before, rats are the biggest pests to palm oil plantations, and pesticides are used to remove them.
The pesticides kill the rats but the pesticides also kill other animals. In an effort to reduce the use of
pesticides, barn owls are becoming a common technique to remove rats. According to Chumporn Palm Oil
Industry Public Company Limited (CPI) a major palm oil company in Thailand, a barn owl can eat two rats
a day or 700 per year.62 Therefore, this company has implemented their own barn owl project to alleviate
the use of pesticides on their plantations.
Soil fertility
For palm oil, measures are taken to ensure soil productivity. Many plantations have slopes; therefore silt
pits are applied to shrink the size of the slope and prevent soil erosion. These pits also help contain the
necessary nutrients for soil fertility. In addition, ground cover or leguminous crops are planted to maintain
nitrogen, decompose organic matter, reduce erosion, and to keep weeds away. 63 Organic matter plays an
important role in soil fertility of palm oil. Old palm fronds and old palm oil kernel bunches can serve as
good contributors to creating organic matter.
Agro-Biodiversity
Buffer zones can play important roles in crop cultivation. Monocultures such as palm oil can benefit from
buffer zones surrounding a plantation because they contribute to reducing runoff from soil erosion, enrich
soil quality, assist in pollination, attract wildlife and manage pests that affect palm oil.
62
http://www.cpi-th.com/en/rd.php (retrieved 09/22/2009)
63
http://www.mpoc.org.my/Palm_Oil_and_The_Environment.aspx (retrieved 09/22/2009)
21 | P a g eUNDP Green Commodities Facility Palm oil scoping paper
Crop Genetic Diversity
There are two types of palm oil species, Elaeis oleifera (H.B.K) Cortes is native of America; and the
species Elaeis guineensis Jacq., which originated in the Gulf of Guinea in West Africa better known as the
African oil palm.64 The palm oil trees are quite similar, however, they are diverse in the sense that they can
grow on various types of soil, such as igneous, sedimentary rocks, peat, and volcanic ash.
5.2 Impact of commodity production on ES
Deforestation Map 4: Forest change rates
Deforestation is the number one environmental
impact associated with this commodity. Indonesia
and Malaysia are losing forests at rates exceeding
1.5 percent per year and according to the FAO‟s
2007 report, “State of the World‟s Forests”; these
are among the highest rates of loss in the world.
Palm oil is one of the drivers of deforestation. 65
Around three-quarters of the world's palm oil is
grown in Indonesia and Malaysia where much of the
recent expansion of the industry has been onto
peatlands and into tropical rainforests.
Indonesia
In Indonesia forest fires dominated deforestation rates during the 1990s, a result from poor logging and
agricultural practices, and the expansion of palm oil plantations. Furthermore, pests and diseases also
impacted forest productivity and an approximate 10 million hectares were affected during 1998-2002.
Figure 466 below shows the different disturbances that have
contributed to deforestation rates.
According to Global Forest Watch, Indonesia was heavily
forested in the 1950s, of which 40 percent of them were
cleared in the next 50 years. The forest cover of Indonesia
fell from 162 million hectares to 98 million hectares. Their
figures estimate that about one million hectares per year were
cleared in the 1980s, an amount that rose to 1.7 million
hectares in the 1990s, and is expected to have reached 2
million hectares.
Figure 4: Forest disturbances
64
http://www.kissankerala.net/kissan/kissancontents/oilpalm.htm (retrieved on 02/17/2009)
65
FAO 2007 State of the World´s Forests pg. 15
66
FAO 2007 State of the World´s Forests pg. 18
22 | P a g eYou can also read