PALMERSTON NORTH HOUSING NEEDS ASSESSMENT
←
→
Page content transcription
If your browser does not render page correctly, please read the page content below
PALMERSTON NORTH
       HOUSING NEEDS ASSESSMENT

T h e a v a i l a b i l i t y o f a p p r o p r i at e , h e a lt h y a n d a f f o r d a b l e
housing makes an important contribution to the overall
wellbeing of Palmerston North.

                                                                               M AY 2 0 1 1
Executive Summary                                                 2

                                  A.          Statement of Purpose                                  5

                                  B.          Policy Context                                        7

A                                             1. National Policy Context
                                              2. Local Policy Context
                                                                                                    7
                                                                                                    9
                                                                                                           1
                                  C.          Where are We Now?                                   11

                                                                                                             [ Contents ]
                                              1. Palmerston North People                           11
                                              2. Palmerston North Homes                            15

B
                                              3. Housing Market                                    21
                                              4. Home Ownership                                    22

                                                                                                           H O U S I N G N E E D S A S S E S S M E N T F O R PA L M E R S TO N N O R T H
                                              5. Affordability                                     23
                                              6. Social Housing Need                               26

                                  D.          Emerging Issues                                     29
                                    1. Aging Population and Changing
                                  		 Demand for Housing                                            29

C                                             2. Quality of the Current Housing Stock
                                              3. Housing Affordability
                                              4. Social Housing Need
                                                                                                   29
                                                                                                   30
                                                                                                   31

                                  Appendix One:
                                              Excerpts from The Sustainable City Strategy          32

D
                                  Appendix Two:
                                              Housing New Zealand Corporation Criteria             33

ACKNOWLEDGEMENT

The Palmerston North Housing Needs Assessment contains information from a variety of government and non-
government sources. The Palmerston North City Council thanks all those agencies who have contributed to
this picture of housing needs and issues in the City.

For further information please contact:
Julie Macdonald | Policy Analyst | Palmerston North City Council | email: julie.macdonald@pncc.govt.nz

Published by: Palmerston North City Council
Executive
                                                                                Summary
         2                                                                      Introduction
                                                                                The availability of appropriate, healthy and affordable housing makes an
H O U S I N G N E E D S A S S E S S M E N T F O R PA L M E R S TO N N O R T H

                                                                                important contribution to the overall wellbeing of Palmerston North.
                                                                                The purpose of this Housing Needs Assessment is to inform future
                                                                                discussion about housing in Palmerston North by identifying current and
                                                                                emerging issues. These issues emerge from the consideration of both the
                                                                                national and local contexts.

                                                                                Central government has a number of initiatives which contribute to the provision and regulation
                                                                                of housing in New Zealand. These include the provision of social housing, the oversight of
                                                                                building quality, initiatives to improve the quality of existing housing stock, and (through the
                                                                                recently announced Productivity Commission) efforts to improve the affordability of housing.

                                                                                Palmerston North City Council is committed to the Sustainable City Strategy, which sets guidelines
                                                                                for future development. The Council has also undertaken a Residential Growth Review and is
                                                                                currently considering the nature of future housing developments through the Residential Zone
                                                                                Review.

                                                                                Palmerston North People
                                                                                The Palmerston North population is expected to grow to around 94,000 people by 2031. This
                                                                                population will be more ethnically diverse than the current population, and people over the
                                                                                age of 65 will make up a much larger proportion of the population than they do at present. The
[ Executive Summary ]

                                                                                composition of households is also expected to change, with a greater proportion of one-person
                                                                                households living in the City. The small number of older people living in residential care will also
                                                                                grow as the population profile changes.

                                                                                Palmerston North Houses
                                                                                At the time of the 2006 Census there were almost 28,000 private occupied dwellings in Palmerston
                                                                                North, with the majority of these homes being built since 1950. Three bedroom houses are still
                                                                                the most common type of new house.

                                                                                Most Palmerston North homes use electricity as their main source of heating and are thus subject
                                                                                to increases in fuel price. As many houses were built prior to modern insulation standards, there
                                                                                are potentially 20,000 homes with sub-standard insulation. Research indicates that New Zealand
                                                                                homes are generally significantly colder than the World Health Organisation recommendation
                                                                                of 18°C. Such conditions can lead to dampness and condensation and, in turn, to poor health
                                                                                outcomes for residents.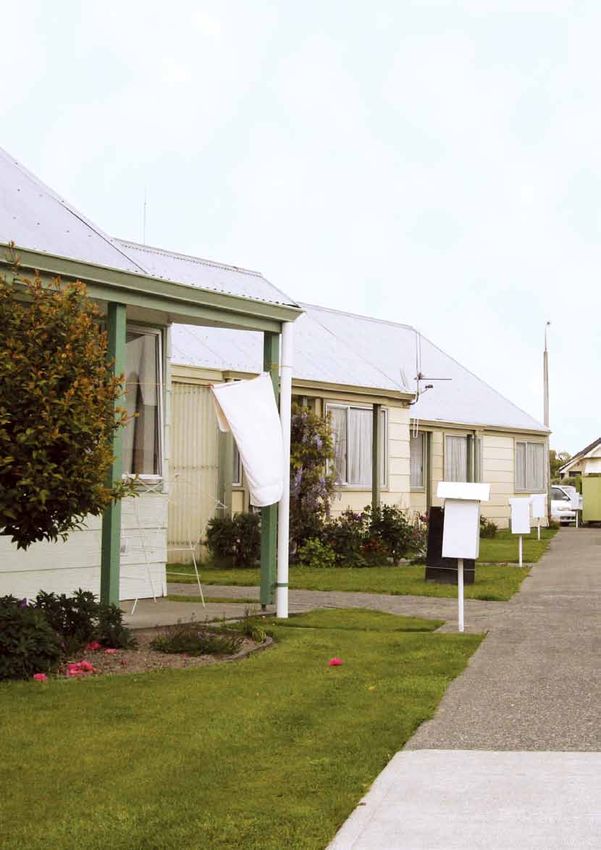
Housing Market
The slowing of the New Zealand property market has been reflected by Palmerston North housing
market activity. In April 2011 the average property value was 4% lower than in April 2010. There
has also been a downturn in property development, as measured by building consents.

Home Ownership and Affordability
Palmerston North is a reasonably affordable housing market when compared with other cities in
New Zealand (in terms of ownership and renting), but affordability is a significant issue. It now    3
takes 41.5% of (individual) median weekly take-home pay to pay the mortgage on a median
priced house in Palmerston North. The rate of home ownership in Palmerston North declined

                                                                                                       [ Executive Summary ]
from 65.2% in 1996 to 62.9% at the time of the 2006 Census.

Social Housing Need
The Housing New Zealand Corporation, the Palmerston North City Council, and a number of
community providers all meet various social housing needs in the City. There are currently some
unmet needs, including for one and two bedroom accommodation for people on low incomes,
and accommodation for single men with mental health and addiction issues.

                                                                                                     H O U S I N G N E E D S A S S E S S M E N T F O R PA L M E R S TO N N O R T H
Emerging Issues
1. As the population changes over the next 20 years there will be an increased demand for homes
   suitable for older people living on their own. This has implications for the location for new
   housing, as well as the proximity of new housing to services. There will also be an increase in
   the need for residential care for older people (to approximately double the number of places
   currently available).

2. Much of the housing that will accommodate Palmerston North’s growing population was
   built prior to the 1980s and may have the inadequate insulation associated with negative
   health outcomes for residents. Research suggests that rental housing may be more poorly
   maintained than housing which is owner-occupied. If there are not adequate choices in the
   rental housing market in future, then this could have implications for tenants who are forced
   to rent low-quality houses.

3. For many Palmerston North people housing is unaffordable and they are experiencing
   ‘housing stress’. Home ownership rates are declining nationally, and more than one median
   income is required to afford ownership of a median priced house. There is some evidence that
   there are currently some unmet needs for rental housing. Future housing investment trends
   will help determine whether there is increased pressure on the rental market, which may
   further impact on housing affordability.

4. The next 20 years could see an increase in unmet needs for social housing, particularly for
   the growing population of older people on low incomes. The Government has signalled its
   intention to support a more diverse range of providers to increase the availability of social
   housing. City-wide responses to this policy will help determine how well the need for social
   housing is met.

Statement of
                Purpose
                                                                                                                                 5
The purpose of the Housing Needs Assessment is to identify current

                                                                                                                                  [ Statement of Purpose ]
and emerging housing issues in Palmerston North to inform and enable
future discussions about housing in the City. The level of availability
of appropriate, healthy and affordable housing makes an important
contribution to the overall wellbeing of Palmerston North.
Shelter is recognised internationally as a basic human right. Our homes
influence our wellbeing, as do our ties to the communities in which we live and
work.1

The Palmerston North City Council (PNCC) has a number of important roles in current and future

                                                                                                                                 PALMERSTON NORTH HOUSING NEEDS ASSESSMENT
planning in response to housing issues. However the emerging issues affect a wide range of
organisations, and responses to them will be made by central and local government, the private
sector, community agencies, and individuals.

In order to understand the context of housing issues in Palmerston North, the changing nature
of the City’s population needs to be identified and understood. This understanding will, in turn,
enable the diverse housing needs of the City’s population to be taken into account in long
term planning. We also need to understand the various factors which contribute to the current
housing situation, including affordability, social need, the nature of the current housing stock,
and where and how new housing is developed.

For the purposes of this report ‘housing’ refers to the various forms of dwelling where Palmerston
North people usually reside. These include houses, flats, apartments, and retirement villages.
However, the discussion here is also a broader one, recognising the social dimensions of housing,
and the importance of decisions about housing for the wellbeing of the City.

                                                     1
                                                         Housing New Zealand Corporation. (2010). Statement of Intent 2010-13.

Policy
                 Context
                                                                                                        7
1. National Policy Context

                                                                                                         [ Policy Context ]
Central government involvement in housing policy and activity covers a range of areas, including
affordability of home ownership, suitability of current housing stock, and social housing. There
are several government agencies with core responsibilities for housing activities (such as the
Housing New Zealand Corporation, the Centre for Housing Research, the Department of Building
and Housing, the Energy Efficiency and Conservation Authority), and many others whose main
functions also impact on housing issues (such as the Ministry of Social Development).

                                                                                                        PALMERSTON NORTH HOUSING NEEDS ASSESSMENT
Productivity Commission

In March 2011 the Government announced the formation of a Productivity Commission, which
has been asked to investigate and report on (among other things) housing affordability.

The terms of reference (in relation to housing affordability) for the Commission are that it should:

•   Identify and analyse all components of the cost and price of housing.
•   Identify mechanisms to improve the affordability of housing, with respect to both the
    demand and supply of housing and associated infrastructure.
•   Identify any significant impediments to home ownership, and assess the feasibility and
    implications of reducing or removing such impediments.
The Productivity Commission is to report to the Government by February 2012.

The Department of Building and Housing

The Department of Building and Housing has an overview of the entire building and housing
sector. Its main goal is to improve building quality and housing availability for all New Zealanders.

EECA

The Energy Efficiency and Conservation Authority (EECA) was established under the Energy
Efficiency and Conservation Act 2000 to encourage, support and promote energy efficiency,
energy conservation, and the use of renewable sources of energy. The Warm Up New Zealand: Heat
Smart programme started on 1 July 2009, and aims to retrofit more than 188,500 New Zealand
homes over a four year period. In May 2011 100,000 homes had been fitted with insulation and/
or heating under the scheme. Home owners are eligible for a subsidy of 33% for insulation (up
to $1,300) and $500 off the cost of a clean heating device and the installation (if insulation is up
to standard).
Housing New Zealand Corporation

                                            The Housing New Zealand Corporation (HNZC) is the Crown agency with a mandate to “give
                                            effect to the Crown’s social objectives by providing housing and housing-related services in a
                                            businesslike manner to those most in need.”2 The Crown’s social objectives for the Corporation
                                            are to:

                                            •        Provide cost-effective state housing and associated services… to those most in need, for the
                                                     duration of their need.
     8                                      •        Assist low-income and/or vulnerable individuals and families to make the right housing
                                                     choices and work with other agencies to transition low-priority tenants into alternative
                                                     housing.
PALMERSTON NORTH HOUSING NEEDS ASSESSMENT

                                            •        Facilitate the development of alternative providers of affordable rental housing and home
                                                     ownership opportunities.

                                            The Housing Shareholders’ Advisory Group was established by the Ministers of Finance and
                                            Housing in February 2010. Its objectives were to provide advice on:

                                            •        The most effective and efficient delivery for state housing services to those most in need.
                                            •        More productive and innovative ways to use current social housing assets to better support
                                                     the objectives of government.
                                            •        Transparent measures of how the above are to be achieved.

                                            In April 2010 the Group released its recommendations, which were underpinned by the following:

                                            •        Empowering HNZC to focus on the high needs sector.
                                            •        Develop third-party participation.
                                            •        Instigate initiatives across the broader housing spectrum.
                                            •        Clarifying sector accountabilities and delivery expectations.
[ Policy Context ]

                                            The Government’s response to the recommendations (announced by Housing Minister Phil
                                            Heatley in December 2010) included agreement to the following:

                                            •        Working more closely with non-government suppliers of affordable housing to improve
                                                     supply.
                                            •        Setting policy expectations that match dwellings to tenant needs.
                                            •        Introducing reviewable tenancies for new tenants (from July 2011).
                                            •        Actively managing the housing portfolio to match future demand.

                                            HNZC continues to allocate Housing Innovation Fund grants to social housing providers who can
                                            match government funding with their own funds. It is also continuing a process of reconfiguring
                                            its housing stock (nationwide) to try and ensure the best possible fit between need and houses
                                            available. (See below for information about HNZC in Palmerston North).

                                            The HNZC indicates that it intends to enter into lease arrangements in future, and has a national
                                            Home Lease Programme that encourages private sector development in response to needs
                                            identified by HNZC.

                                            2
                                                Housing New Zealand Corporation. (2010). Statement of Intent 2010-13.
2. Local Policy Context
The policy and activities of national agencies provide the context within which Palmerston North
housing is built, maintained, and lived in. Some of the agencies mentioned above have a direct
role in Palmerston North, through, for example, the direct provision of housing (HNZC) or efforts
to improve housing stock (EECA). Locally, the PNCC has a variety of functions which impact on
housing. These include planning and regulatory functions and the provision of social housing.
Future decisions about housing in Palmerston North will be made within a policy framework.
The Council has adopted a Sustainable City Strategy that sets some guiding principles for the 9
future development of the City. This Strategy acknowledges that any future development will be
made within external constraints determined by factors outside of the Council’s control. These
[ Policy Context ]
factors include rising energy costs and the need to reduce greenhouse gas emissions overall. The
implications of these factors for housing include the need for greater energy efficiency in home
heating, and ensuring the City remains compact to help minimise the need for travel by petrol
and diesel powered vehicles. (See Appendix One for the relevant text from the Sustainable City
Strategy). Of particular relevance here are the following objectives:
• Sustainable transport: Encourage development which is close to and well linked to the city
and its facilities, with a variety of public and private transport alternatives.
PALMERSTON NORTH HOUSING NEEDS ASSESSMENT
• Compact city: Encourage development which is close to and well linked to the city and its
facilities.
• Accessibility: development which is close to and well linked to the city and its facilities.
• Housing choice: Encourage development in area(s) which would enable diversity in the city’s
housing stock.
The Residential Growth Review was undertaken to ensure enough land is available to meet future
land demand for housing development. The review focused on greenfield demand – rural zone
land that is currently undeveloped. The selection of the three preferred sites for future residential
growth included consideration of physical, environmental and social factors. Council adopted
the Residential Growth Strategy in September 2010. Development within the three preferred sites
would not be undertaken by the Council, but rather enabled by rezoning this land as residential
within the District Plan.
The District Plan sets out what can and cannot be done on land in the District. The Residential
Zone Review is part of the Sectional District Plan Review.3 The purpose of this project is to review
the current housing development standards and consider what housing and neighbourhoods
could look and feel like in the future. The Residential Zone Review is based around five key issues:
Sustainability – how to improve the sustainability of residential areas and houses.
Urban design – how to incorporate better design criteria (and implement the actions of the
Urban Design Strategy).
Residential density and subdivision – including consideration of medium density housing
options around the Central Business District and neighbourhood centres.
Reviewing bulk and location standards – consideration of the requirements for good design
which contributes to positive residential environments.
Non-residential activities – whether non-residential activities are able to be located in residential
areas.
3
Shaping Our City is the title of the Council's Sectional District Plan Review.Where Are
We Now?
11
This section considers what is known about the current Palmerston North
[ Where Are We Now? ]
population and how the projected changes over the next twenty years
could impact on housing needs in the City. It also discusses the nature of
the City’s housing, and issues of housing affordability and housing need.
1. Palmerston North People
This section provides information about the Palmerston North population. The issues identified
tend to be the larger scale trends which will impact on the City as a whole. However it should
be noted that there are a number of other factors which should also be taken into account. The
PALMERSTON NORTH HOUSING NEEDS ASSESSMENT
Palmerston North population is becoming increasingly diverse as it grows, and this diversity
signals a need to consider a variety of housing needs as planning is undertaken for the future.
A large number of ethnic groups and nationalities are represented in Palmerston North, and
since 2006 it has become home to former refugee communities. Palmerston North is also home
to a large student population4 and, as at the end of December 2010, there were 7,063 people
(aged 18-64) who received income assistance through a benefit.5 Around 30% of households in
Palmerston North have incomes of less than $30,000 per annum.
Within the diverse Palmerston North population there are a number of different housing needs
which can be identified. For example, Maori currently have higher representation in multi-family
households than do the population as a whole.6 However a different kind of need has been
met through the development of kaumatua housing associated with Tanenuiarangi Manawatu
Incorporated. The purpose of kaumatua housing is to strengthen community ties and the
relationship with marae.
As another example, many people in Palmerston North do not live in private dwellings, but
instead are accommodated in rest homes or villages, or live in group homes supported by health
and disability sector agencies.
4
Around 10,000 full time equivalent (FTEs), which represents a far greater number of people actually engaged in study.
5
This figure does not include people who receive income from Superannuation or Student Allowance.
6
Centre for Housing Research and Te Puni Kokiri. (2006). Maori Housing Experiences: Emerging Trends and Issues.Age
According to Statistics New Zealand the population of Palmerston North will rise to around
94,000 people by 2031. Broken down by age group, we can see that the number of people
in each age group will grow over the next twenty years, with the exception of the 0-14 years
age group. This decline in the actual youth population reflects the overall national trend.
FIGURE 1: Projected population age structure
in Palmerston North
12 100,000
90,000
PALMERSTON NORTH HOUSING NEEDS ASSESSMENT
80,000
Number of people
70,000
60,000
50,000
40,000
30,000
20,000
10,000
0
1996* 2001* 2006* 2011 2016 2021 2026 2031
Year (*is based on Census data)
0-14 15-39 40-64 65+ Total
Source: Statistics New Zealand
When we consider the overall age structure of the Palmerston North population however, we can
see that people over the age of 65 years will make up a much larger proportion of the Palmerston
North population than they do at present (a projected change from 10% to 18.5% between 1996
and 2031).
FIGURE 2: Projected population age structure
of Palmerston North (percentages)
[ Where Are We Now? ]
100%
90%
80%
70%
Percentage
60%
50%
40%
30%
20%
10%
0%
1996* 2001* 2006* 2011 2016 2021 2026 2031
Year (*is based on Census data)
0-14 15-39 40-64 65+
Source: Statistics New ZealandEthnic diversity
Population projections for the ethnic make-up of Palmerston North are currently only available
to 2021. They show that it is anticipated that there will be an increase in the actual number of
people identifying with each ethnic group.
FIGURE 3: Projected population ethnicity structure of
Palmerston North
70,000
13
60,000
Number of people
[ Where Are We Now? ]
50,000
40,000
30,000
20,000
10,000
0
1996* 2001* 2006* 2011 2016 2021
Year (*is based on Census data)
European or Other Maori Asian Pacific
PALMERSTON NORTH HOUSING NEEDS ASSESSMENT
Source: Statistics New Zealand
The level of increase for each ethnic group is detailed in the table below. We can see that the
Asian and Pacific populations, particularly, will undergo a significant increase. Note that the
ethnic categories are not mutually exclusive because people can and do nominate more than
one ethnic group that they belong to and have been included in figures for each group they
identify with.
Table 1:
Projected population ethnicity structure of Palmerston North (percentages)
European Maori Asian Pacific Total
or Other population
2006 (Census) 64,500 (82%) 12,400 (16%) 6,100 (8%) 3,000 (4%) 78,500
2021 (projected) 70,200 (79%) 15,900 (18%) 8,900 (10%) 4,900 (6%) 88,800
Source: Statistics New ZealandHouseholds
National projections for household composition over the next twenty years show that there will
be an increase in the percentage of one person households and a decrease in households made
up of families or other groups (in addition to the increase in actual household numbers as a result
of the rising population).
FIGURE 4: Projected households (percentages) by
household type (national data)
14 80%
70%
PALMERSTON NORTH HOUSING NEEDS ASSESSMENT
60%
Percentage
50%
40%
30%
20%
10%
0%
2015 2020 2025 2030
Year
Family Other multi-person One-person
Source: Statistics New Zealand
The projections for household composition in Palmerston North closely reflect the national
data, although the student population is reflected in the higher proportion of multi-person
households.
FIGURE 5: Projected households by household type for
Palmerston North (percentages)
80%
[ Where Are We Now? ]
70%
60%
50%
Percentage
40%
30%
20%
10%
0%
2006 2011 2016 2021 2026 2031
Year
Family Other multi-person One-person
Source: Statistics New Zealand
According to Statistics New Zealand projections, the number of households in Palmerston North
will increase to 39,000 by 2031 (from around 29,600 households at the 2006 Census). As Table 2
shows, the major change will be in the increase of one-person households.Table 2:
Projected households by household type (Palmerston North)
Household type
Family Other multi- One- Total
person person
2011 21,300 2,400 8,000 31,700
2016 22,300 2,500 8,800 33,600
2021 23,100 2,600 9,700 35,400
15
2026 23,900 2,600 10,600 37,200
[ Where Are We Now? ]
2031 24,600 2,700 11,600 39,000
Source: Statistics New Zealand
At the time of the 2006 Census the large majority of New Zealanders aged 65 years and over lived
in private dwellings. Some of these were in retirement village complexes. A very small proportion
of people (around 5%) were accommodated in residential care for aged people. Applying this
percentage to Palmerston North, in 2006 around 450 people (aged 65 years and over) were living
in residential care facilities.
PALMERSTON NORTH HOUSING NEEDS ASSESSMENT
In New Zealand overall, there has been a growth in the provision of aged-care facilities in recent
years, and this is also true of Palmerston North. For example, the number of building consents for
new apartments has increased to 9.5% of total consents for the period between 2006 and 2010,
and the majority of these are in retirement complexes. Nationally, most of the recent developments
have catered for people who have the financial means to pay for this accommodation.7
2. Palmerston North Homes
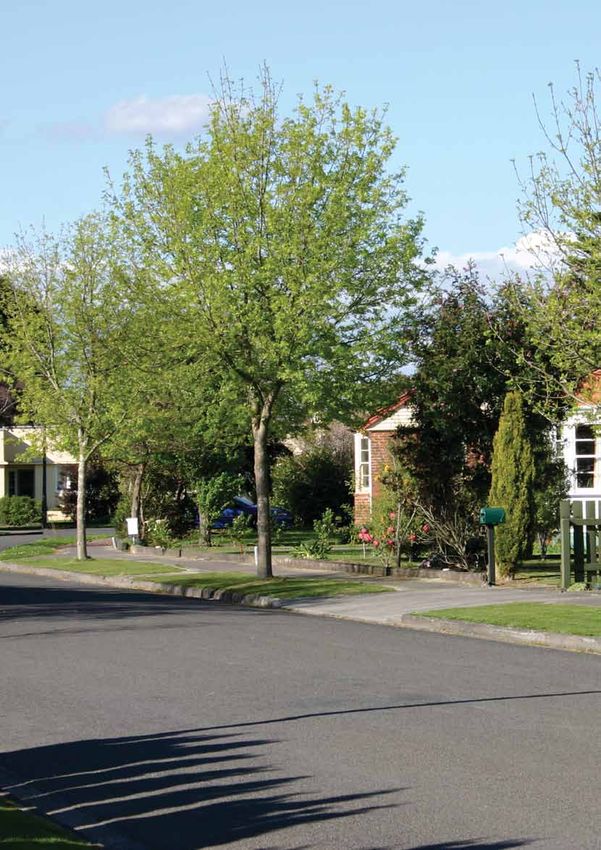
People’s homes provide more than physical shelter; they contribute to the connections we
experience with our communities and are an important contributing factor to the health and
wellbeing of individuals, households and wider communities. Palmerston North City has grown
as a result of various decisions made about the type of city we want to live in, as well as a
regulatory framework which has changed over the years to enable and allow different types of
development. All these decisions (by generations of politicians, planners, developers, business
people, families, and individuals) have influenced the density and location of suburbs, and the
nature and feel of the City’s housing overall.
This section considers the nature of the houses in Palmerston North, while also acknowledging
the contribution they make to broader community outcomes.
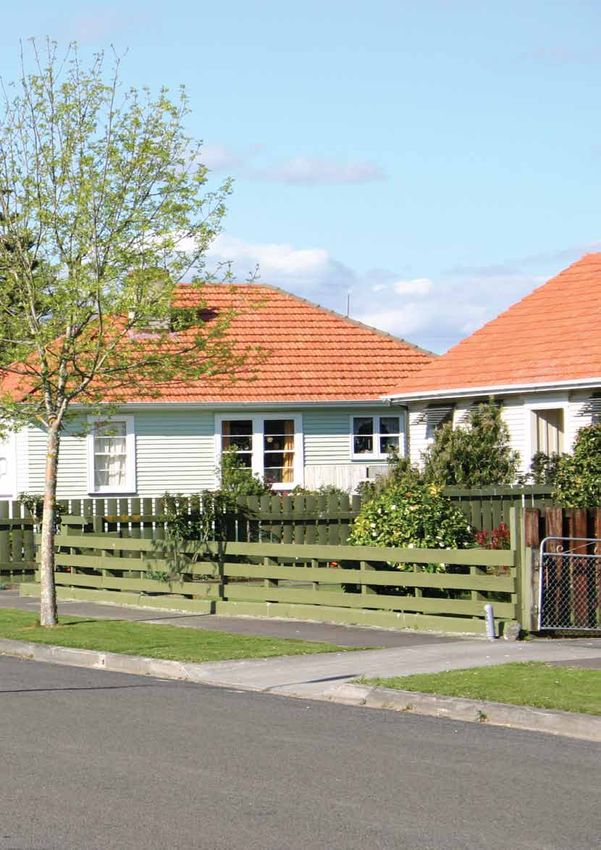
Current housing stock
Palmerston North started to grow during the late 1920s to early 1930s as the City developed
bigger buildings, shopping centres, parks and suburbs. In the period between 1950 and 1980 the
housing stock in Palmerston North boomed with the greatest number of new dwellings built in
the 1970s. After this the building of new houses declined.
7
Grant Thornton. (2010). Aged Residential Care Service Review.FIGURE 6: Additions to dwelling stock numbers for
Palmerston North by decade
6,000
5,000
4,000
Number
3,000
16 2,000
1,000
PALMERSTON NORTH HOUSING NEEDS ASSESSMENT
0
Pre 1900 1910 1920 1930 1940 1950 1960 1970 1980 1990 2000
1900 to Mar
2006
Year
Source: Howell and Birchfield (2010)
Palmerston North has seen a growth in residential development during the 2000s.8
FIGURE 7: Residential growth comparison by type
in Palmerston North 1997-2010
70%
60%
50%
Percentage
40%
30%
20%
10%
[ Where Are We Now? ]
0%
1997 1998 1999 2000 2001 2002 2003 2004 2005 2006 2007 2008 2009 2010
Year
Greenfield Infill Rural
Source: Statistics New Zealand
The strongest infill growth has occurred in the Hokowhitu and Roslyn areas. Greenfield
development is mostly concentrated in Kelvin Grove and Aokautere. In 2010 of the 160 building
consents issued, 61 were for infill housing, 69 were greenfield developments, and 30 were in rural
areas.
At the time of the 1996 Census, there were around 25,236 private occupied dwellings in the City,
of which 82% were separate/detached houses. Forty four percent of these were three bedroom
houses and 23% had four bedrooms.
8
Note that Figure 7 shows the growth in residential dwellings and does not include building consents for retirement village apartments.FIGURE 8: Number of bedrooms in Palmerston North houses (1996)
14,000
12,000 11,442
10,000
Number
8,000
6,000 5,511
4,887
4,000 17
2,000 1,257 1,077
579
225 126 132
[ Where Are We Now? ]
0
1 2 3 4 5 6 7 8+ Other
Number of bedrooms
Source: Statistics New Zealand
Ten years later at the time of the 2006 Census, there were almost 28,000 private occupied
dwellings in Palmerston North. Over that decade, four bedroom houses replaced two bedroom
houses as the second most common type of house, and this trend has continued since then.
PALMERSTON NORTH HOUSING NEEDS ASSESSMENT
FIGURE 9: Percentage of two, three, and four bedroom houses in
Palmerston North (of private dwellings overall)
50%
45%
40%
35%
Percentage
30%
25%
20%
15%
10%
5%
0%
2 3 4
Number of bedrooms
1996 2001 2006
Source: Statistics New Zealand
The average size of the 195 new houses built in 2010 in Palmerston North was 208m2 (including
the floor area of attached garages). This closely reflects the size of new homes being built in New
Zealand overall.FIGURE 10: Average floor area for new residential dwellings
(excluding apartments)
250
200
Square metres
150
18 100
50
PALMERSTON NORTH HOUSING NEEDS ASSESSMENT
0
91
92
93
94
95
96
97
98
06
07
08
09
10
11
99
00
01
02
03
04
05
19
19
19
19
19
19
19
19
20
20
20
20
20
20
20
20
20
20
20
20
19
Year
Palmerston North New Zealand Manawatu District
In contrast, the average size of all houses in New Zealand, based on floor area, is 149m2.9 The
district with the largest average house size is Selwyn, followed by Queenstown Lakes, and the
lowest is the Chatham Islands, followed by a number of other rural areas including Wairoa,
Kawerau and Waikato. The average house size in Palmerston North is 153.8m2 (ranking 60th out
of the 74 local authority areas). Quotable Value (QV) notes that newer houses tend to be larger
than old ones, and so areas where there are extensive new housing developments tend to have
the highest averages overall. It should be noted that these data only reflect the size of houses
and not apartments or flats.
Home health
National research shows that temperatures in New Zealand homes generally average 6°C
below the World Health Organisation minimum recommendation for indoor temperatures of
18°C. Indoor temperatures below 18°C lead to dampness and condensation, which in turn lead
to an increase in fungi and dust mites, as well as increased susceptibility to infectious disease.
Accordingly, studies have also found that fungal growth affects about 40% of New Zealand
[ Where Are We Now? ]
homes.10
The Building Research Association of New Zealand (BRANZ) undertakes a regular survey of New
Zealand housing to monitor conditions.11 The 2005 survey concluded the average condition of
all houses in the survey was good, with an expected difference between the older houses in the
survey and the newer ones. However BRANZ also notes that older homes have become more
popular over past decades and that many are being modernised and upgraded. This means that
the average condition stabilises at about the 1930s to 1950s age group and then improves for
newer homes. However the survey also found that the estimated cost of more urgent maintenance
was $3,700 per house, compared with the average annual expenditure on maintenance of less
than $1,300 per house. Specific data are not available for Palmerston North, but it would be a fair
assumption that this figure applies to houses in the City.
Preliminary findings from the most recent BRANZ survey12 suggest that the overall condition
of New Zealand houses has declined further, to between moderate and good. BRANZ suggests
that the reason for the significant decrease in average condition could be that rental properties
were included in the survey for the first time. If this is the case, then the implication is that the
large proportion of Palmerston North houses in the rental market are in need of significant
9
QV New Zealand (2011). http://www.qv.co.nz/propertyinformation/KnowledgeCentre/Averagehousesizebyarea12042011.htm
10
Beacon Pathways Ltd. (2007). Indoor Environment Quality.
11
BRANZ. (2005). Study Report No. 142. New Zealand 2005 House Condition Survey.
12
BRANZ. (2011). Study Report No. 240. Preliminary BRANZ New Zealand 2010 House Condition Survey Report.expenditure on maintenance. In response to the research, the Chief Executive of the Registered
Master Builders’ Federation noted that landlords are not investing in improving their properties,
but were rather “doing the bare minimum” to keep them tenable.13
Much of the information that is available about New Zealand houses tends to rely on gathering
reports of residents’ perceptions, rather than surveys of the houses themselves. For example,
the 2008 New Zealand Housing Survey14 confirms that many New Zealanders live in cold, damp
conditions, or in homes where there is insufficient insulation. According to survey respondents
from Palmerston North, 37% of homes in the City are causing health problems for the people
living in them, compared to the national figure of 26%. Nationally, health problems are reported
particularly by lower income households, with Pacific people (50%) and Maori (47%) also more
19
likely to report health problems than the population overall (including those groups) (26%).
[ Where Are We Now? ]
Reports by residents can also be backed up by what we know about the existing housing stock.
For example, prior to 1980, the Building Act did not require insulation in houses. This means
potentially 20,000 houses in Palmerston North do not have any insulation. According to New
Zealand research a pre-1970s home without an insulation retrofit is typically (in winter) only 1°C
warmer than the temperature outside.15
According to EECA, between July 2009 and December 2010, 1330 homes had insulation installed
under the Warm Up New Zealand scheme and a further 225 homes had heating installed. These
figures only reflect the homes which received the funding subsidy available under the Warm
Up New Zealand scheme. The minimum requirements for insulation have increased significantly
PALMERSTON NORTH HOUSING NEEDS ASSESSMENT
since 1980, but it is likely that many houses built since the 1980s (but prior to the adoption of
current codes) are under-insulated and may be cold and damp. Anecdotal evidence suggests
that some home owners have retrofitted heating and/ or insulation without the benefit of the
subsidy. Taking this into account, it still seems highly likely that the vast majority of Palmerston
North homes are either uninsulated or have inadequate insulation to provide warm, dry living
conditions.
Sources of heating
The large majority of Palmerston North households use electricity as a main source of fuel for
heating.
FIGURE 11: Fuel types to heat private occupied dwellings in
Palmerston North (2006)
18,000
16,000
Number of dwellings
14,000
12,000
10,000
8,000
6,000
4,000
2,000
0
Electricity Mains Bottled Wood Coal Solar None Other Not
gas gas power fuel(s) elsewhere
included
Fuel type
Source: Statistics New Zealand
13
http://stuff.co.nz/business/market-data/5003127/Kiwi-housing-in
New Zealand Business Council for Sustainable Development. (2008). 2008 New Zealand Housing Survey.
14
15
Howden-Chapman, P.M., Crane, J., Viggers, H., Cunningham, M., Blakely, T., Cunningham, C., Woodward, A., Saville-Smith, K., O’Dea, D., Kennedy, M., Baker,
M., Waipara, N., Chapman, R., Davie, G. (2007). Effect of insulating existing houses on health inequality: cluster randomised study in the community. British
Medical Journal, 224: 460-469.Compared with New Zealand overall, a much greater percentage of Palmerston North homes
use mains gas as a heating fuel, and fewer Palmerston North households use electricity, wood, or
coal, than in the country overall. Some homes still use unflued gas appliances, which are known
to have negative health consequences.16
FIGURE 12: Fuel types used to heat dwellings in
Palmerston North and New Zealand (2006)
80%
20 70%
Percentage of dwellings
60%
50%
PALMERSTON NORTH HOUSING NEEDS ASSESSMENT
40%
30%
20%
10%
0%
Electricity Mains Bottled Wood Coal Solar Other None Not
gas gas power fuel(s) elsewhere
Fuel type included
Palmerston North New Zealand
Note: Census respondents were able to nominate more than one source of fuel for heating.
Source: Statistics New Zealand
Research undertaken by the Ministry of Social Development and EECA found that many low
income households experience energy poverty, defined as “the inability to afford access to
sufficient energy services”.17 Some low income households were unable to heat their homes at
all, due to either a lack of space heating appliances and/or the ability to pay for heating costs.18
Overcrowding
The availability of adequate housing space is an important indicator of household and community
[ Where Are We Now? ]
health. The Ministry of Social Development defines household crowding as homes requiring one
or more additional bedrooms.19 It should be noted that this measurement does not provide any
information about other aspects of housing suitability, such as warmth or safety. Furthermore, it
does not reflect the perceptions people may have about their own circumstances, or necessarily
lead to negative social outcomes.
At the 2006 Census 10% of New Zealanders lived in households requiring one or more additional
bedrooms to adequately accommodate all members of the household. Children were found
to be more likely to live in overcrowded conditions than older people. Pacific people were far
more likely to live in crowded conditions than members of other ethnic groups. The numbers of
people living in crowded conditions in Palmerston North in 2006 were lower than the national
percentages, although the ethnic make-up of the figures roughly mirrors that of the country
overall.
16
Beacon Pathways Ltd. (2010). Unflued Gas Heater Fact Bank.
17
Ministry of Social Development and EECA. (2010). Household Energy Affordability : Qualitative Research Report.
18
The Council has developed a Domestic Energy Strategy to reduce the use of non-renewable energy by households.
19
Ministry of Social Development. (2010). The Social Report.FIGURE 13: Percentage of household crowding by ethnic group (2006)
50%
45%
40%
35%
Percentage
30%
25%
20%
15%
10%
21
5%
0%
[ Where Are We Now? ]
Asian European Maori Pacific Other
Ethnic group
New Zealand Palmerston North
Source: Statistics New Zealand
The percentage of Palmerston North people living in crowded conditions decreased between
1986 (9.9%) and 2006 (6%). This also meant an actual decrease of over 2000 people during those
twenty years. At the time of the 2006 Census, Palmerston North had around 4,542 people living
PALMERSTON NORTH HOUSING NEEDS ASSESSMENT
in crowded conditions. Most of these people were European New Zealanders, however Pacific
people had the highest percentage of crowding in 2006.
FIGURE 14: Housing crowding in Palmerston North
by ethnic group (1986-2006)
5,000
4,500
4,000
Number of people
3,500
3,000
2,500
2,000
1,500
1,000
500
0
European Maori Pacific Asian Other
Ethnic group
1986 1991 1996 2001 2006
Source: Statistics New Zealand
3. Housing Market
The impact of the recession is evident in the downturn in development in New Zealand overall,
with Statistics New Zealand reporting that for February 2011 the value of residential building
consents had fallen $96 million (20 percent) since February 2010. In Palmerston North a slowing
in development has been evident since 2007 (see Figure 15).FIGURE 15: Total number of building consents for residential
dwellings in Palmerston North 2000-2010
450
Number of building consents
400
350
300
250
200
22
150
100
50
PALMERSTON NORTH HOUSING NEEDS ASSESSMENT
0
2000 2001 2002 2003 2004 2005 2006 2007 2008* 2009* 2010*
Year (* is consents issued)
Number of building consents 5-year average
Correspondingly, there has been a slowing of the housing market overall, nationally and in
Palmerston North. QV20 reports that in April the overall national property value was 2% lower
than it was a year ago, and 5.9% lower than its peak value in 2007. The market has been relatively
steady overall, but there is significant regional variability. Palmerston North house sales have
reflected the slow provincial house market and in April 2011 the average property value was 4%
lower than it was at that time in 2010. QV notes that there were low property sales in 2010, and
that nationally there has only been a small rise in house buying activity so far in 2011.
4. Home Ownership
Nationally, the level of home ownership is declining. At the 2006 Census, 66.9% of households
were in owner-occupied dwellings. This figure had declined from 70.7% at the time of the 1996
Census. In 2006 only 62.9% of Palmerston North households were in owner-occupied dwellings.21
Levels of home ownership vary across the household income brackets. Figure 16 illustrates how
the 1996 levels of home ownership were higher than the 2006 levels in almost all income groups.
[ Where Are We Now? ]
FIGURE 16: Households in owner-occupied
dwellings in Palmerston North
100%
90%
80%
70%
Percentage
60%
50%
40%
30%
20%
10%
0%
s
0
00
00
00
00
00
00
00
00
0
re
l
ta
de e
os
0
,00
r
o
5,0
0,0 10,0
5,0 15,0
0,0 20,0
5,0 25,0
0,0 30,0
0,0 40,0
0,0 50,0
0,0
To
clu e
d
rL
m
In ewh
00
-$
$7
lo
No or
-$
-$
-$
-$
-$
-$
-$
$1 - $1
$1
$7 01-
Ni
ls
1
01
01
01
01
01
01
01
tE
,00
01
,0
00
$5
0,0
$1
$1
$2
$2
$3
$4
$5
Household income
1996 2001 2006
Source: Statistics New Zealand
20
http://www.qv.co.nz/aboutus/pressreleases/Propertyvaluessteady12042011.htm
21
Of the 73 local authority areas, only 13 have a level of home ownership lower than that national average. These include the cities of Auckland, Hamilton,
Palmerston North, Porirua, and Wellington. It should be noted that this figure does not reflect the level of investment in housing overall, but rather the
percentage of home owners who live in their own home.A more detailed breakdown of the ownership arrangements for Palmerston North households is
shown in Table 3.
Table 3:
Housing arrangements for households in Palmerston North (2006)
Palmerston North New Zealand
Owned or partly owned 49.9% 51.2%
by usual resident(s)
Mortgage arrangements 1.6% 1.8%
23
(no other information)
[ Where Are We Now? ]
Who make mortgage payments 28.0% 27.9%
With no mortgage payments 20.3% 21.5%
Not owned by usual resident(s) 35.4% 31.1%
Rental arrangements NFD 0.4% 0.4%
Who make rent payments 32.3% 26.7%
With no rent payments 2.7% 3.9%
Held in a family trust by 14.6% 17.8%
usual resident(s)
PALMERSTON NORTH HOUSING NEEDS ASSESSMENT
Mortgage arrangements 0.8% 0.9%
(no other information)
Who make mortgage payments 4.0% 5.0%
With no mortgage payments 5.3% 5.6%
Not elsewhere included 4.6% 6.2%
Source: Statistics New Zealand
HNZC is the biggest single provider of rented accommodation in Palmerston North, although
its share of the rental market is declining. However, of the households who are in rented
accommodation, the large majority pay rent to private sector landlords.
5. Affordability
Affordability is usually measured by determining the number of households for whom the cost
of housing (either mortgage or rental payments) is 30% or more of their disposable income.22
Households who pay more than 30% in housing costs are considered to be experiencing housing
stress. In 2009, 27% of New Zealand households spent more than 30% of their disposable income
on housing costs. Since the 1980s there has been a significant increase in the proportion of
households with this level of spending. The lowest income households are over-represented
here, with around a third experiencing housing stress.
Home ownership
There are various measures used to assess the affordability of home ownership. Measures which
are based on mortgage servicing costs show a greater improvement in affordability compared
with those which focus on house prices and median income measures.
22
Ministry of Social Development. (2010). The Social Report.The February 2011 Roost Home Loan Affordability Report23 for Palmerston North reported that the
median house price was $267,500 in January 2011, compared with $340,000 nationally. Five
years ago the median for the City was $230,000, compared with $300,000 nationally. It now takes
27.6% of the median household take-home pay to service a mortgage of a median priced home
(purchased in January 2011). This suggests that median-priced housing is reasonably affordable
for families in Palmerston North, when there is more than one adult working.24 25
Mortgage costs can also be considered in relation to the median income. In New Zealand overall,
it now takes 51.7% of one median income to pay the mortgage on a median priced house
24 (purchased in January 2011). (A typical buyer is assumed to be in the 30-34 age years group). This
is a decrease from 62.4% one year ago and 68.2% five years ago. Essentially the median income
for a typical buyer is not high enough to buy a median priced house, even with a 20% deposit.26
PALMERSTON NORTH HOUSING NEEDS ASSESSMENT
27
The comparable figure for Palmerston North is 41.5% of weekly take home pay. Palmerston
North compares well to many other cities (as shown in Table 4), however it is still a challenge for
single people, or households on a single income, to be able to afford to buy their own homes.
Table 4:
Percentage mortgage payment as a percentage of median weekly take-home pay
January 2011 January 2010
New Zealand 51.7% 62.4%
Auckland 64.6% 75.9%
Hamilton 53.5% 61.2%
Christchurch 53.3% 63.9%
Wellington 52.0% 61.8%
New Plymouth 51.4% 69.0%
Napier 45.8% 60.5%
Palmerston North 41.5% 48.0%
Dunedin 39.1% 53.4%
[ Where Are We Now? ]
Source: www.interest.co.nz
23
Roost. (2011). Home loan affordability in Palmerston North. http://www.interest.co.nz/sites/default/files/Palmerston%20North_home_loan_affordability_Feb_2011.pdf
24
Roost. (2011). Home loan affordability in Palmerston North.
25
The profile used in the Roost Homeloan Affordability Series for a standard buyer household is one adult male working full-time, one adult female working
50%, and one child aged 5 years.
26
Roost. (2011). Roost Homeloan Affordability Series. http://www.interest.co.nz/property/home-loan-affordability
27
The standard buyer index is calculated assuming that the house buyer has already has a 20% deposit. Based on current income and house prices it will
take an individual 8.4 years to save the 20% deposit now required by most banks.Home rental
At the time of the 2006 Census Palmerston North rents tended to be grouped towards the middle
and lower range of rents paid in New Zealand overall.
FIGURE 17: Weekly rent of households in
Palmerston North and New Zealand (2006)
30%
25%
20%
25
Percentage
15%
[ Where Are We Now? ]
10%
5%
0%
50
9
9
4
9
4
9
9
9
9
er
d( e
de er
$7
$9
12
14
17
19
24
29
34
ov
r$
2)
h
0–
0–
–$
–$
–$
–$
–$
–$
–$
clu w
d
de
$5
$8
00
25
50
75
00
50
00
an
in lse
Un
$1
$1
$1
$1
$2
$2
$3
te
50
No
$3
Weekly rental
Palmerston North New Zealand
PALMERSTON NORTH HOUSING NEEDS ASSESSMENT
Source: Statistics New Zealand
At March 2011 the weekly average rent paid in Palmerston North was $280, compared with the
New Zealand average rent of $320.28 It should be noted that this figure is only an average and
does not tell us where most rents are clustered.
More usefully, a rent ratio can be calculated which tells us the relationship between median
house price and the median annual rent. While Palmerston North rents are relatively affordable
when compared with other cities, it should be noted that affordability is a limited measure and
gives no indication of the suitability of the property for its purpose (in terms of size or home
health).
Table 5:
Rent ratio for February 2011
Median house price Median 3 bedroom yearly rent Rent ratio
New Zealand $350,000 $16,640 21.0
Auckland metro $465,000 $20,685 22.5
Wellington metro $408,500 $19,493 21.0
Christchurch $341,434 $17,160 19.9
Hamilton $317,000 $16,640 19.1
Napier $313,125 $16,640 18.8
New Plymouth $312,750 $16,640 18.8
Palmerston North $272,500 $14,560 18.7
Dunedin $245,000 $15,600 15.7
Source: www.interest.co.nz
28
Interest.co.nz (2011). The ratio between New Zealand house prices and rents. The rent ratio.6. Social Housing Need
Housing New Zealand Corporation
In Palmerston North there are currently 1,523 HNZC properties (see Table 6). The majority of
these homes have two or three bedrooms. A small number of these properties are not rented to
individuals or families, but rather provide accommodation for organisations to provide housing
(e.g. refuges).
26 HNZC acknowledges that, nationally, there are high-priority applicants with unmet housing
needs. Furthermore, many state houses need significant upgrading to current standards so
that homes are suitable for modern-day living. The current portfolio of houses still requires
PALMERSTON NORTH HOUSING NEEDS ASSESSMENT
(approximately) a further $1.7 billion in upgrading expenditure to bring the amenities up to an
acceptable standard.
Table 6:
Total HNZC properties in Palmerston North City by age and bedroom size (as at 27 March 2011)
Bedrooms
Age of unit (years) Bedsits 1 2 3 4 5 6 7 Total
1-10 4 1 5
11-20 1 22 5 1 29
21-30 12 104 18 5 139
31-40 18 132 128 27 1 306
41-50 4 45 110 155 25 1 340
51-60 4 38 38 217 31 1 329
61-70 50 165 73 12 300
71-80 12 31 12 1 56
81-90 5 7 1 13
91-100 3 2 1 6
Total 8 176 614 617 105 1 1 1 1,523
[ Where Are We Now? ]
Source: HNZC
HNZC reports that demand for housing in Palmerston North is moderate when compared with
similar centres such as Napier, Hastings, or Dunedin. Because the cost of rental accommodation
in Palmerston North is generally reasonable, demand for HNZC housing is more likely to stem
from a wide variety of complex needs (and not be solely due to cost). At present around half of
the HNZC properties have long term tenants, and half turn over reasonably regularly. The change
to HNZC’s national policy will mean that from July 2011 tenancies will become fixed term, and
then reviewable.
The waiting list for HNZC houses is shown in Table 7. HNZC notes that while a large percentage of
its housing stock is three or more bedrooms, the biggest demand is for smaller homes of one or
two bedrooms. See Appendix 2 for further information about the waiting list categories.Table 7:
Waiting list numbers for HNZC houses in Palmerston North (as at 27 March 2011)
Priority segment Short description Number on list
A At Risk 9
B Serious Housing Need 36
C Moderate Need 61
D Low Level Need 65
Total 171
27
Source: HNZC
[ Where Are We Now? ]
Palmerston North City Council
The 2007 Social Housing Strategy currently describes the Palmerston North City Council’s (PNCC)
agreed role as a housing provider. The PNCC has 311 community housing units at 17 locations
around the central city and in Ashhurst.29 The Council’s housing was primarily built in the
1960s and 1970s and has not been significantly retrofitted in terms of insulation (except where
redevelopment has occurred). The rigid 80:20 ration between community and public housing
allocation was disestablished by the 2007 strategy, and a decision was made to respond to
changing needs in a more flexible way. The four goals of the Social Housing Strategy are:
• Council tenants are well housed.
PALMERSTON NORTH HOUSING NEEDS ASSESSMENT
• Council housing is a well managed asset that offers accessible living arrangements.
• Provide support to social housing providers in Palmerston North.
• Council housing provides a safe, secure living environment.
The community housing units accommodate Superannuation and Invalids’ Benefit recipients, and
all the units have only one bedroom or are bedsits.30 Efforts are made to ensure an appropriate
mix of tenants in each housing complex, with the Council taking an active role in ensuring the
smooth operation of each area. Staff work with HNZC and social agencies in Palmerston North
to try and meet the housing needs of tenants appropriately and to address any issues that arise.
Council staff note that there is always a waiting list and that there is increasing demand from
people on the Invalids’ Benefit, many of whom are experiencing serious and complex social
needs. The duration of the average tenancy is seven years, with some tenants having been in
Council community housing for a great deal longer than this.
Community sector providers
There are a range of community sector organisations also meeting various aspects of social
housing need. These include refuges responding to family violence, night shelter accommodation
for single men, and supported accommodation in group homes. There are also agencies who
act as support and advocate for people requiring assistance with housing. Social housing
providers and those involved in social housing issues in Palmerston North meet regularly to
monitor and discuss the current situation in the City, and to work on solutions to help address
ongoing and emerging needs. The community agencies currently providing emergency or short-
term social housing (of various kinds) are the Salvation Army, Manawatu Community Housing
Trust, Shepherd’s Rest, Camellia House and Palmerston North Women’s Refuge. There are also a
number of low cost hostels and hotels providing unsupported accommodation on a casual basis.
At present, the Housing Advice Centre reports that the most pressing need for additional social
housing is for one to two bedroom accommodation for people on low incomes and for single
men with mental health and addiction issues.
29
Council also has 96 public housing units, which are primarily located in three villages. These units are rented out at market rates and are not part of the
Council’s social housing portfolio. Council’s public housing currently accommodates students, older people, and other people on low incomes. Most units
have two bedrooms, and there is currently a high demand for more one bedroom accommodation. There is little difference between the Council housing
and that provided by the wider private housing market.
30
Remaining bedsits are being converted to one bedroom units.Emerging
Issues
29
Some challenges emerge from this consideration of the issues and trends
[ Emerging Issues ]
for housing in Palmerston North. While Palmerston North does not exhibit
the extremes in overcrowding or unaffordability that may be experienced
elsewhere in New Zealand, there are some issues which can usefully be
taken into account in future planning. The following section draws some
tentative conclusions on the basis of the information considered so far.
1. Aging Population and Changing Demand for Housing
PALMERSTON NORTH HOUSING NEEDS ASSESSMENT
Statistics New Zealand currently suggests that there will be an additional 9,400 households in
Palmerston North in twenty years time, but that the size of these households will be smaller,
on average, than it is now. It is estimated that 30% of households (11,600) could be one person
households by 2031. The 2006 Census indicated that only around 24% (6,612) of private dwellings
in Palmerston North had one or two bedrooms31 and that by 2031 Palmerston North will need
over 11,000 dwellings to accommodate those people living in single-person households. Given
that this growth in one-person households can largely be attributed to the projected growth in
the older age group, this means there will be an increased demand for homes suitable for older
people living on their own. This has implications for the location of new housing, as well as the
proximity to services.
There continues to be growth in residential dwellings, largely in infill and greenfield developments.
The majority of this new housing has three or more bedrooms. The large majority of Palmerston
North housing stock overall now also has three or more bedrooms, with new homes tending to
be most suitable for families or other multiple person groups. There is potentially a mismatch,
therefore, between the size of the new housing which is predominantly being developed in
Palmerston North, and the size of much of the housing needed in the future.
New Zealand research also indicates that there will be an increase in the need for residential
care for older people, although there are some trends which may mitigate this,32 including a
preference for informal care arrangements or accommodation in retirement villages. The extent
to which the older population is projected to increase, however, means that even if the rate of
uptake of residential care decreases, there will still be a significant increase in the number of new
residential places required in Palmerston North (to around 900 places).
2. Quality of the Current Housing Stock
Current building codes ensure that new houses built in Palmerston North have adequate
insulation and are generally warmer and healthier than houses built in previous decades.
31
There were 1,251 (4.5%) one bedroom dwellings and 5,361 (19.3%) two bedroom dwellings at the 2006 Census.
32
Grant Thornton. (2010). Aged Residential Care Service Review.However, according to BRANZ (2009) “most (approximately 70%) of the houses that will be with
us in 2025 already exist”, and indeed around two thirds of current homes were built prior to
the 1980s. Given the relatively low impact of the EECA Warm Up New Zealand scheme so far, this
means that much of the housing which will need to accommodate Palmerston North’s growing
population has inadequate insulation, with associated impacts on the ongoing health and
wellbeing of residents. Furthermore, almost all housing in Palmerston North is subject to the
rising energy costs required for home heating.
Most of the rental accommodation in Palmerston North is in private ownership, and thus the
30 quality of this housing is determined by private landlords. The level of demand for rental housing
will help determine whether rental tenants have adequate housing choices. If the market is left to
determine the quality of the rental housing stock, then evidence to date suggests that landlords
PALMERSTON NORTH HOUSING NEEDS ASSESSMENT
may not have to upgrade their houses in order to let them.33 Furthermore, research also indicates
that rental housing may be maintained more poorly than that which is owner-occupied.34 This
has implications for the health of the City’s population, and particularly for people on low
incomes whose choices may be limited to lower quality housing.
3. Housing Affordability
The percentage of households who own the home they live in is lower in Palmerston North than
in the country overall, and is declining (as at the 2006 Census) across almost all income brackets.
An international survey of housing affordability shows that housing in New Zealand is “severely
unaffordable” overall.35 This study included the Palmerston North market, and noted that of the
eight markets considered (Auckland, Christchurch, Tauranga-Western Bay of Plenty, Palmerston
North, Napier-Hastings, Hamilton and Dunedin) none were considered “affordable”.
The cost of buying median-priced housing in Palmerston North is reasonably affordable for
households where there is more than one income. Palmerston North also compares well to other
centres in terms of rental affordability. In March 2011 the average rent was $280 per week, which
is significantly lower than the New Zealand average of $320. However, this weekly average does
not provide any information about the adequacy of the property (in terms of size or location) for
the needs of the tenants.
[ Emerging Issues ]
The availability of rental housing is dependent on the attractiveness of property investment,
and this has declined over recent years.36 The demand for rental housing is growing as home
ownership rates decline, and there are some indications that there is already an unmet need for
appropriate rental housing (for example, HNZC is able to meet the needs of people with only the
most serious needs). It is unclear what the long-term trends are in terms of rental availability, but
any decline in rental housing investment could potentially put pressure on the rental market and
raise rents. We also know that Palmerston North is an increasingly diverse population, and that
the range of housing needs is therefore likely to increase. We are able to conclude, therefore, that
the changing profile of available housing in combination with the changing population may
have negative implications for housing affordability.
33
There have been suggestions at various times that the City could introduce a voluntary Warrant of Fitness scheme for rental housing. One example of such
a scheme operates in Dunedin, where student accommodation is rated in terms of heating, insulation, security and other services. See http://www.dunedin.
govt.nz/student-housing/home/_nocache for more information about Stars Dunedin Student Housing.
34
BRANZ. (2011). Study Report No. 240. Preliminary BRANZ New Zealand 2010 House Condition Survey Report.
35
Cox, W., & Pavletich, H. (2011). 7th Annual Demographia International Housing Affordability Survey: 2011. The method of assessment was the median house
price divided by the gross median household income.
36
http://reports.asb.co.nz/report/article/4608/12/0/investor-confidence-on-the-rise.htmlYou can also read