Pandemic Risk "Life Insurer's Black Swan" - Yan Sun and Pierre Vende Aon Benfield
←
→
Page content transcription
If your browser does not render page correctly, please read the page content below
Pandemic Risk
“Life Insurer’s Black Swan”

Yan Sun and Pierre Vende
Aon Benfield
Agenda
•   What is the “Black Swan”?

•   Why is this a risk?

•   Modelling the risk?

•   Let’s not forget the “White Swan”?

•   Which “risk-transfer” solutions?

•   What can our Government do?

•   Q &A
Section 1: What is the Risk?
~ profiling the Black Swan

                The Black Swan: The Impact of the Highly Improbable
                Nassim Nicholas Taleb - 2007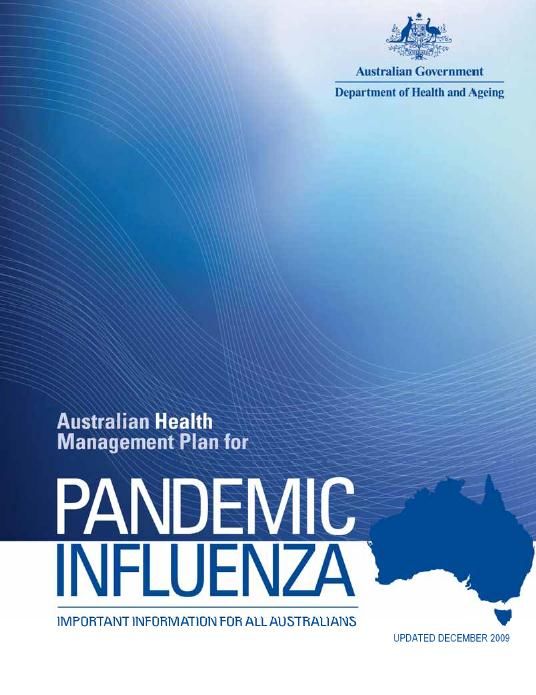
Pandemic: Definition
•   Pandemic (from Greek pan "all" + demos "people") is an epidemic of infectious disease
    that has spread through human populations across a large region; for instance multiple
    continents, or even worldwide.
•   A widespread endemic disease that is stable in terms
    of how many people are getting sick from it is not a
    pandemic.
•   Focusing on Influenza:
•   Throughout history there have been a number of
    pandemics, such as smallpox, tuberculosis, or HIV.
•   By pandemic we now often refer to flu (influenza)
    pandemic, such as the H1N1 pandemics of 1918 and
    2009. Flu pandemics normally exclude recurrences of
    seasonal flu.
Pandemic: History
    Approx 30 influenza                                    •      Most sources conclude that:
     pandemics in last                                             - a pandemic approximately occurs every 15 to 30 years
        500 years                                                  - thus, annual probability of a pandemic is between 3% to 7%
                                                           •      1918/1919 – Spanish flu – Influenza A (H1N1)
                                                                   • Over 40 million deaths in the world
                                                                   • Australia around 10,000 deaths (0.2% of the population)
      In the last Century                                          • 20 to 40 year-old people in particular (50% of the death)
                                                           •      1957/1959 – Asian flu – Influenza A (H2N2)
                                                                   - 1 to 4 million deaths in the world
                                                                   - Pandemic occurred in 2 waves following virus mutation
Sources:
1 http://en.wikipedia.org/wiki/2009_flu_pandemic
                                                           •      1968/1970 – Hong Kong flu – Influenza A (H3N2)
2 http://www.flupandemic.gov.au/internet/panflu/publishing.nsf/
Content/history-1                                                  - 1 to 2 million deaths in the world
3. http://wwwnc.cdc.gov/eid/article/18/2/10-2042_article.htm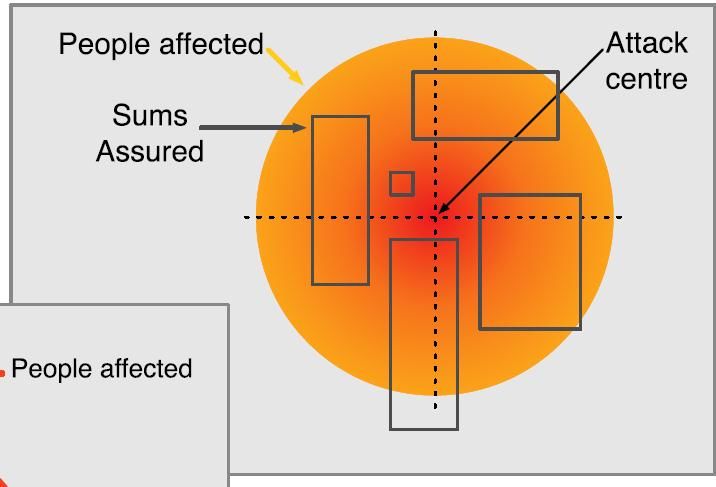
1918 Flu Mortality                                                                                1957 Flu Mortality

                             3500
                                                                                                                                   1200
                                                                                                                                                                                 1957
                             3000
                                                                                                                                   1000                                          1952-1956

                                                                                                        (per 100,000 population)
  (per 100,000 population)

                             2500                                            1918
                                                                                                                                   800

                                                                                                              Flu Mortality
                                                                             1913-1917
        Flu Mortality

                             2000
                                                                                                                                   600
                             1500
                                                                                                                                   400
                             1000
                                                                                                                                   200
                              500
                                                                                                                                     0
                                0                                                                                                         84
                                    84                                                              Age (years)
                                                               Age (years)
                                                      1968 Flu Mortality
                                                                                                                                                     Excess Deaths US Population             Excess
                             1400
                                                                                                                                      Pandemic          ('000s)      (millions)              Mortality
                             1200                                                                                                       1918              700          104                    0.67%
                                                                                                                                        1957               70          175                    0.04%
(per 100,000 population)

                             1000                                            1968
                                                                             1963-1967                                                  1968              33.8         200                    0.02%
      Flu Mortality

                             800

                             600

                             400
                                                                                                                                                20th Century Influenza
                                                                                                                                                 Pandemics (US data)
                             200

                               0
                                    84
                                                               Age (years)
Pandemic: Influenza A
•   Influenza A viruses distribution of
    subtypes

•   The type A viruses are the most
    virulent human pathogens among the
    three influenza types and cause the
    most severe diseases

•   Wild birds are the natural host for all
    known subtypes of influenza A
    viruses

                                              Source: Open Rome
Pandemic: Influenza A
•   Transmission of
    Influenza A viruses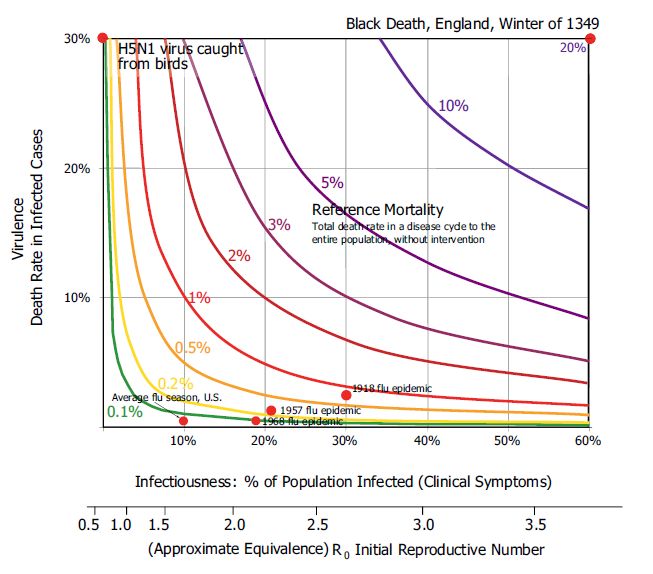
Pandemic: Black Swan ?
•   A (flu) pandemic may occur if three conditions are met:
     -   a new influenza virus emerges
     -   the virus infects humans
     -   the virus spreads efficiently and in a sustained manner from human to human

•   WHO – The World Health Report 2007:
•   “Scientists agree that the threat of a pandemic from H5N1 continues and that the question of a
    pandemic of influenza from this virus or another avian influenza virus is still a matter of when, not if.”

•   H5N1 (“Bird Flu”): as of Oct 2011, total of 566 human cases since 2003 – Case fatality rate 58%
•   SARs - Nov 2012 to Jul 2013: 8,273 cases – Case fatality rate 10%
•   2009-2010 Swine Flu (H1N1): .>500,000 cases – 18,000 deaths – Case fatality rate 3%
•   2013 China (H7N9): 126 cases as of 29 April 2013 – Case fatality rate 19%
•   New Coronavirus (nCov) originated in the Middle East: since Sept 2012: 40 cases – Case fatality rate 50%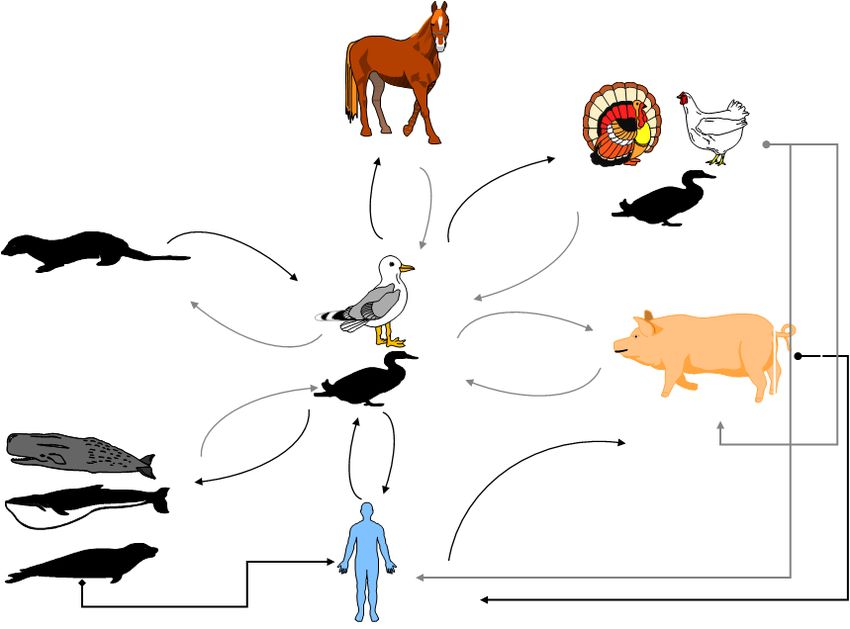
Pandemic: Black Swan ?
•     We don’t know when the next pandemic will occur
•     We don’t know how infectious and deadly the new virus will be
•     Will the next pandemic be more or less lethal than the 1918 flu ?
    Potential factors attenuating flu virulence / mortality                    Potential factors aggravating flu virulence / mortality

      Improvement in medical care and technology:
       antibiotics, vaccines, anti-viral drugs (though
     shortages in drugs are possible and a lead time is
              required for vaccine production                                    Greater number of areas with high population
                                                                                            density / megacities
      Establishment of global surveillance and early
           warning systems (WHO, CDC..) and                                            Greater and faster global air travel
          Crisis/emergency preparedness plans

       Improved socio-economic environment incl.
       hygiene conditions, nutrition, health status….

Source: CRObriefing - Emerging Risks Initiative – Position Paper – Sept 2007
Section 2: Why is this a Risk? ~ who’s afraid of the big black bird
Australian Health Management Plan for Pandemic Influenza
Australian Health Management Plan for Pandemic Influenza
• “If we were to experience a pandemic as severe as the one that occurred in 1918 and
we were not prepared and unable to respond, scientists have estimated that in Australia:
40 per cent of the population (8.5 million Australians) could show
clinical signs of infection during a pandemic
2.4 per cent of those affected would die (around 200,000 people)
50 per cent of the population may not go to work at the peak of the pandemic
several waves each lasting up to 12 weeks could occur
disruption to services could last as long as two years.”Australian Health Management Plan for Pandemic Influenza
• “Clearly, we are planning to respond and reduce the impact of this type of pandemic. It is
estimated that if we were unfortunate enough to experience a pandemic as severe as
that in 1918, but we were prepared and were able to respond effectively, then:
the number of cases could be reduced from 40 per cent clinically affected,
to 10 per cent clinically affected, that is around 2.1 million Australians
death rates could be halved to 1.2 per cent of those clinically affected,
that is around 25,000 people may die
absenteeism at the peak could be 30 to 50 per cent
the duration of the pandemic in Australia could be 7–10 months, in a single wave
the level of disruption across all sectors would be reduced
(although persisting for a longer period at a more manageable level).Insurance Business – Everyone should be afraid?
• Insurance • Market Risk (i.e. share
Risk (i.e. price volatility, market
mortality, downturn, recession etc.)
morbidity)
• Brand management and
Sales Volatility (i.e. boost
• Regulatory new business for life
Risk (i.e. policies causing new
solvency, business strain)
capital,
reserving etc.) • Other Risks (i.e. business
continuity and
counterparty)Potential Impact on Insurance Risk
• increase in Death claims (however, more deaths than expected may provide relief to other
insurance risks such as longevity and claim termination rates)
• possible increase in Disability claims (i.e. TSC or IP) ?
• temporary disability claims ? subject to waiting periods
• potentially lower recovery rates for open claims ?
• increase in Medical claims (Inpatient / Outpatient). Negatively correlated with the
effectiveness of a nationwide vaccine program run by the GovernmentPotential Impact on Insurance Risk
Example of Impact on Major Life Companies in Australia:
- Insurance Penetration (within population aged 20 to 65) = 50%
- Using APRA’s floor for the event stress charge = 1 per mille (i.e. 0.5 per mille over 2 years)
- Average Sum Assured per Life = $ 150,000
Approx .
Latest
Approx .
Earnings in Direct Direct
Market Share Est. No. of Latest
Additional the Impact on Impact on
(Premium) - Penetration Additional Earnings for
Company Claims Insurance/ Profitability Profitability
2011 based to Australian Insured Lives Parent
(million) Wealth - Insurance - Parent
on Plan 4 Life Lives on Claim Group
Mgmt Group Group
(million)
Group
(million)
A 17% 1,075,259 1,075 161 500 5,000 32% 3%
B 16% 1,012,009 1,012 152 700 700 22% 22%
C 13% 822,257 822 123 2,000 2,000 6% 6%
D 13% 822,257 822 123 300 7,000 41% 2%
E 12% 759,006 759 114 300 5,000 38% 2%
F 8% 506,004 506 76 100 1,000 76% 8%
Others 8% 506,004 506 76
H 7% 442,754 443 66 200 7,000 33% 1%
I 5% 316,253 316 47 3,000 3,000 2% 2%
J 1% 63,251 63 9 small 500 2%Potential Impact on Insurance Risk
Impact for the specific business
Impact for the Parent (especially
life/insurance or wealth management
banking parent) is relatively small
team can be significant
Approx .
Latest
Approx .
Earnings in Direct Direct
Market Share Est. No. of Latest
Additional the Impact on Impact on
(Premium) - Penetration Additional Earnings for
Company Claims Insurance/ Profitability Profitability
2011 based to Australian Insured Lives Parent
(million) Wealth - Insurance - Parent
on Plan 4 Life Lives on Claim Group
Mgmt Group Group
(million)
Group
(million)
A 17% 1,075,259 1,075 161 500 5,000 32% 3%
B 16% 1,012,009 1,012 152 700 700 22% 22%
C 13% 822,257 822 123 2,000 2,000 6% 6%
D 13% 822,257 822 123 300 7,000 41% 2%
E 12% 759,006 759 114 300 5,000 38% 2%
F 8% 506,004 506 76 100 1,000 76% 8%
Others 8% 506,004 506 76
H 7% 442,754 443 66 200 7,000 33% 1%
I 5% 316,253 316 47 3,000 3,000 2% 2%
J 1% 63,251 63 9 small 500 2%Regulatory requirements
• The event stress, before adjustment for diversification, must at a minimum include a
pandemic scenario with the following impacts on mortality and morbidity claims experience:
- annual mortality rates at each age increase by 0.5 per thousand for the 2 years following the
reporting date;
- an annual incidence rate of total disablement at each age, as a result of the event, of 10 per cent
of lives insured for the 2 years following the reporting date;
- of those lives becoming disabled as a result of the event, half remain disabled after 14 days, one
quarter remain disabled after 30 days and none remain disabled after 60 days; and
- if disability continues to the end of the policy waiting period, one month’s benefit will be paid. For
waiting periods other than zero, 14, 30 or 60 days, interpolation must be used to find the
proportion of policies for which a benefit will be paid
Overall, impact on capital requirements depend on the business mix within the
relevant stat fund and/or product group, as well as the level of future profits:
however this is a real risk, beyond capital considerationsMarket Risk?
Market experienced
a sharp, and then
sustained decline
since both major
Earthquakes in
Japan
(e.g. supply chain
disruptions, lower
market confidence,
slower consumption
etc,)Market Risk?
• It became a global contagion, during the trading day:
- German DAX lost 1.2% within minutes
- Hong Kong's Hang Seng index fell by 1.8%
- South Korea's Kospi index slumped by 1.3%
- MSCI Asia Pacific Index had dropped by 1.8%
• Specific insurance related companies:
- Munich Re and Swiss Re fell following the earthquake on speculation that they may face losses
"somewhere in the $10 billion range" even after certain costs were absorbed by Japan's primary
insurers and the government
Implications for Australian Insurers/Parent Companies:
A. Earnings impact (however small in relative) may lead to further slide to the
stock price amongst market panic
B. Given risk aversion, limited ability to replenish/raise capitalSection 3: Modelling the Risk?
Modelling Overview – Pandemic Risk
• Without reliable statistical data, Spanish flu –
killed more
no credible distributions can be than 10,000
utilised and targeted
young healthy
adults
Figure 1. Laboratory confirmed cases of pandemic (H1N1) 2009 and total influenza in
Australia, to 11 June 2010 (Department of Health and Ageing)
• Let the past be a guide to “what-if” scenarios
in which key virus parameters are Laboratory confirmed cases
amended: of pandemic (H1N1) 2009
and total influenza in
- the pandemic start location and start date Australia, to 11 June 2010
- the transmissibility virulence of the virus (Department of Health and
Ageing)
- the duration of the illness the virus causes, are
changed
- Impact of specific age groups
Source: GRIM BooksPandemic Risk - Assumptions
Historical Combinations of Severity and Attack rate
Frequency
?
Severity
Attack Rate
Age groups
Source: RMSPandemic Risk - Assumptions
• Stress testing across case-fatality rates and infection rates
• For Example:
Excess Mortality Rate APRA min. pandemic charge
Case - Fatality Infection Rate
(Mortality Rate once 1918/1919 Spanish Flu
Infected) 10% 20% 30%
0.2% 0.02% 0.04% 0.06% What if the next one is more
deadly?
0.5% 0.05% 0.10% 0.15%
1.0% 0.10% 0.20% 0.30% What if the next one is more
2.0% 0.20% 0.40% 0.60% contagious?Pandemic Risk - Assumptions • WHO (2008): Epidemiological indicators for pandemic influenza
1918 Flu Mortality 1957 Flu Mortality
3500
1200
3000 1918 Flu 1000
1957 Flu 1957
1952-1956
(per 100,000 population)
Mortality Mortality
(per 100,000 population)
2500 1918
800
Flu Mortality
1913-1917
Flu Mortality
2000
600
1500
400
1000
200
500
Example of 0
0
84
assumption 84 Age (years)
setting
Age (years)
1968 Flu Mortality Excess Deaths US Population Excess
ranges: 1400
Pandemic
1918
('000s)
700
(millions)
104
Mortality
0.67%
1200
1968 Flu 1957
1968
70
33.8
175
200
0.04%
0.02%
(per 100,000 population)
1000 1968
Mortality 1963-1967
Flu Mortality
800
600
Frequency: 3 per century
400
Attack rate: 10 – 60%
Severity: 1x to 6x normal mortality
200
0
84
Age (years)The Classic SIR Model
• Standard model used in epidemiology to model infectious diseases
• Segment modeled population into 3 key states
• Population is constant and closed
- No births or deaths
- No people leaving the infected area
• All people infected with the disease removed from study
- No differentiation between recoveries and deaths
• Once a person has recovered that person is immune to that particular strain
• Total Population = Susceptible + Infective + Removed
Interaction leading to
infection
Susceptible Infective Removed
(S) (I) (R)Enhanced SIR Model
Flowchart of the state progression of individuals among the different
epidemiological classes
Susceptible Latent Infectious Hospitalized Dead
Population is no longer constant
– Allows for births and deaths due to natural
causes
Not all infected individuals will recover, some will die Asymptomatic Recovered
Individuals that recover during the spring wave are
immune to the fall waveSection 4: The “White Swan”?
The “White Swan”
•   APRA:
•   “The event stress allows for the impact of single events that could commence in the 12 months following
    the reporting date and cause multiple claims. These events could include pandemics, terrorist attacks
    and natural catastrophes and may affect either or both of mortality and morbidity experience. The
    Appointed Actuary must determine an appropriate event stress that provides a 99.5 per cent
    probability of sufficiency with respect to single events that could potentially commence over the
    following 12 months.” ~ APRA LPS 115
•   Solvency II:
•   Arena disaster - to capture the insured risk of a catastrophic event affecting large numbers of people in
    a single place at one time
•   Concentration scenario - to capture the risk of a catastrophe affecting the largest concentration of
    exposures, for example a densely populated office block, most relevant Group Schemes

                   Terrorism Risk is real. Higher likelihood than pandemic ?
Types of Terrorism Attacks
4 7 7 3 3
Nuclear Conventional Radiological Biological Chemical
100 kiloton Cruise missile Cruise missile Large event Large event
20 kiloton Multiple aircraft Multiple aircraft Medium event Medium event
10 kiloton Single aircraft Single aircraft Small event Small event
1 kiloton Large truck bomb Large truck bomb
Small truck bomb Small truck bomb
Car bomb Car bomb
Human bomb Human bomb
Total attack types = 24Major Targets
Terrorism Risk - Modelling
• Scenario based approach
Identifying Peak • Based on portfolio information, identify the peak
Accumulations accumulations of lives and sums insured, which would
raise the highest potential losses
• Damage curves assessing different attack types (e.g.
car bomb, human bomb, large truck bomb, airplane
Computing Loss
crash, or nuclear, chemical, biological)
Estimation
• Based on the portfolio exposure near the site and the
damage curves related to the attack type, losses can
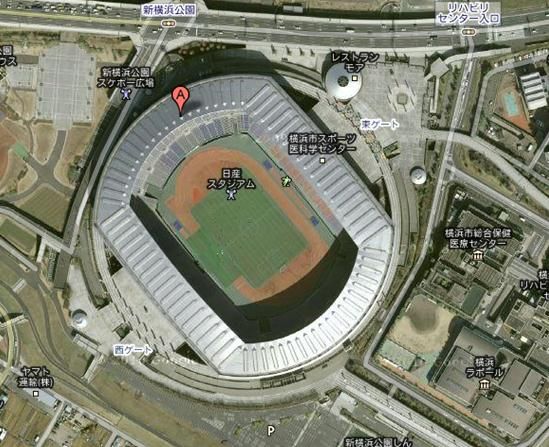
be estimatedTerrorism Risk - Modelling Illustration
Insurer's Share
Terrorism Risk - Modelling Killed Disabled Total
Cost Cost Cost
Number Number
(¥ billion) (¥ billion) (¥ billion)
Scenario assum ptions : Football Arena 100 KT 13,693 164.3 20,610 164.9 329.2
Nuclear
Insurer's share inside the Stadium 5.0% 20 KT 5,619 67.4 3,579 28.6 96.1
10 KT 4,620 55.4 3,301 26.4 81.8
No Lives inside the Stadium 70,000
1 KT 3,756 45.1 1,364 10.9 56.0
Insurer's share in surrounding area 5.0%
Example
Cruise Missile Attack 1,474 17.7 650 5.2 22.9
Conventional
Population Density (persons/km ²) 7,000 Multiple Aircraft 2,202 26.4 658 5.3 31.7
of a Average Disability Loss in JPY thousands 8,000
Single Aircraft
Large Truck Bomb
1,908
1,288
22.9
15.5
695
630
5.6
5.0
28.5
20.5
scenario,
Average Death Loss in JPY thousands 12,000
Small Truck Bomb 714 8.6 381 3.1 11.6
Car Bomb
occurring
127 1.5 386 3.1 4.6
Human Bomb 19 0.2 153 1.2 1.4
in a Cruise Missile Attack 1,554 18.6 737 5.9 24.5
Radiological
Multiple Aircraft 2,323 27.9 902 7.2 35.1
crowded Single Aircraft
Large Truck Bomb
2,010
1,358
24.1
16.3
806
708
6.4
5.7
30.6
22.0
public Small Truck Bomb 762 9.1 420 3.4 12.5
place
Car Bomb 140 1.7 425 3.4 5.1
Human Bomb 21 0.2 168 1.3 1.6
Large Attack 5,319 63.8 6,495 52.0 115.8
Biol.
Medium Attack 2,950 35.4 1,463 11.7 47.1
Small Attack 1,326 15.9 1,918 15.3 31.3
Large Attack
Chem.
4,663 56.0 6,067 48.5 104.5
Medium Attack 2,633 31.6 1,386 11.1 42.7
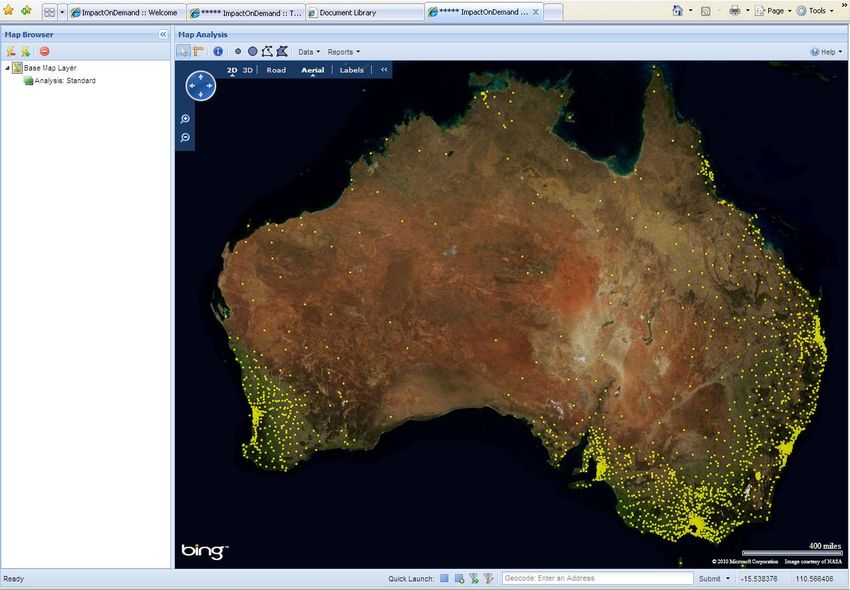
Small Attack 1,700 20.4 1,152 9.2 29.6Do you know where the Swans live? – Map Analysis
Section 5: What are the Risk Transfer Solutions?
Solutions – Stop Loss Reinsurance
•   Aggregate Stop Loss
     -   Excess mortality, disability and/or medical
     -   covers aggregated losses above Deductible X dollars
     -   covers up to Limit Y dollars
     -   can be multi-year coverage
     -   may include a Pandemic trigger
     -   (e.g WHO declaring phase 6 pandemic)

     -   overall, an appropriate coverage for longer duration pandemics and/or recurring waves
     -   Cost: current pricing in the range of 2% to 6% annual RoL
         (Rate on Line = reinsurance premium / limit of the cover).
Solutions – Stop Loss Reinsurance - Example
Solutions – Stop Loss Reinsurance - Example
Solutions – Stop Loss Reinsurance - Example
Solutions – Stop Loss Reinsurance - Example
Solutions – Cat XL and others
•   Pandemic Per Event XL
     - Similar to a standard Cat XL cover
     - Pandemic Event definition: e.g. trigger on WHO (World Health Organisation) or
        local body declaring pandemic state
     - Aggregation of the claims that arise out of a Pandemic Event, within X consecutive
        days (e.g. 60 or 90 or 120 days). Needs ability to identify claims due to the pandemic
        event within the mass of all claims during the period
     - Cover usually more affordable than on a Stop Loss basis

•   Others:
     - High cession rate quota-share
     - Parametric covers
Solutions - Capital Markets - Extreme Mortality Bond/Swap
Format
Multi-year coverage
Extreme Mortality Bond Lock in favourable pricing as excess capacity available for diversifying perils
Legal Structure largely similar to non-life ILS
Annual, retaining flexibility at renewals, but open to alteration in price
Lower frictional costs
Extreme Mortality Swap
Target fewer investors for smaller placement
Replicate existing swap with minimal additional legal costs
Trigger Options
Based on 2 year average mortality rate
Parametric
Transparent and well understood data providers
Untested in the public ILS market
Indemnity
Extensive disclosure requirements on underlying exposureLife Capital Markets - Extreme Mortality Pricing – (2011)
6%
4%
Risk Premium
2%
0%
0.00% 0.10% 0.20% 0.30% 0.40% 0.50% 0.60% 0.70% 0.80% 0.90% 1.00%
Expected Loss
Source: Aon Benfield Securities RLS Price SheetsSection 6: Role of the Government ?
Role of Governments ?
Aus Population

                        Through
  Not Insured                           X% of
                      “Pandemic”
                                      Income      Government
                       Tax Levy                    Terrorism
                                                      and
                                                   Pandemic
                      Through Life      Y% of
                                                   Pool (aka
                       Insurance     Insurance   “Swan” pool”)
     Insured            Premium       Premium
Role of Governments ?
• Why can the Government achieve
Global a better/cost-effective outcome?
Investors • “Skin in the Game”
Government • The government has every
Terrorism incentive and alignment to
and keeping Australians safe
Pandemic Capital and/or • 3+ billion per annum on Boarder
Pool (aka Reinsurance Security
“Swan” pool”) market • 150mil on Swine Flu Vaccinations
2010
• Anti-terrorism squad (i.e. Security
Intelligence Group)
Source: AustralianQuestions ?
You can also read