Pannon EGTC (Hungary - Croatia) - SITUATION ANALYSIS REPORT within the project Inter Ventures
←
→
Page content transcription
If your browser does not render page correctly, please read the page content below
Pannon EGTC (Hungary – Croatia)
SITUATION ANALYSIS REPORT
within the project Inter Ventures

Final Draft
25/02 2021

                           1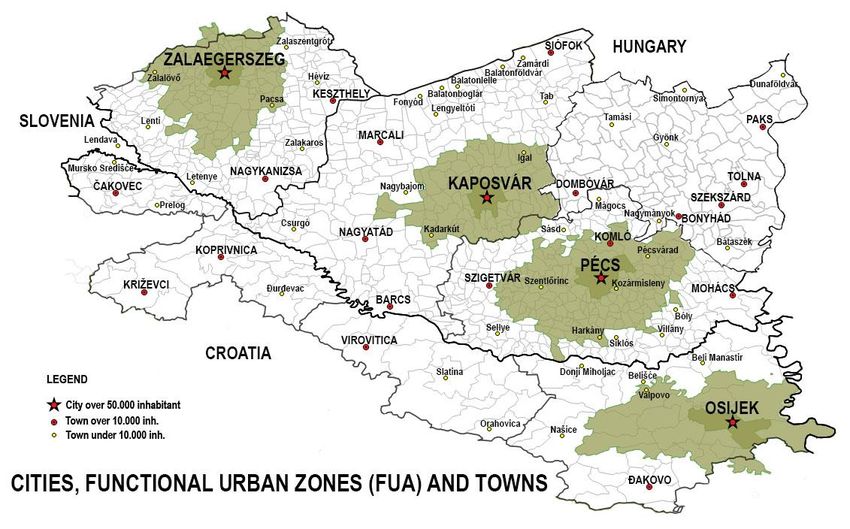
INTRODUCTION
The Pannon EGTC (European Grouping of Territorial Cooperation), seated in the city of Pécs, Hungary,
was established on 31 August, 2010 with the participation of Slovenian and Hungarian partners. The
aim of the cooperation is a well-tuned development of the south-western border area. Registration at
the Court of Registration is expected in January, 2012.

The goal of this non-profit organisation is to establish a successful cooperation among the
municipalities of two or more countries and among the local and regional authorities of the area. The
organization's members are 63 local governments from Hungary, Croatia and Slovenia and 3 regionally
significant organizations: the University of Pécs, University of Kaposvár and Duna-Dráva National Park.

Current analysis has been compiled in the framework of the Interventures project, funded by Interreg
Europe. Interventures promotes the internationalization of SMEs in EU border regions, thus
contributing to their growth and increased competitiveness. The main questions to be answered are
“What kind of capacities SME’s would need to engage in cross-border and international
collaborations?”, “How these skills and capacities can be developed?”, “Who are the key players

                                                  2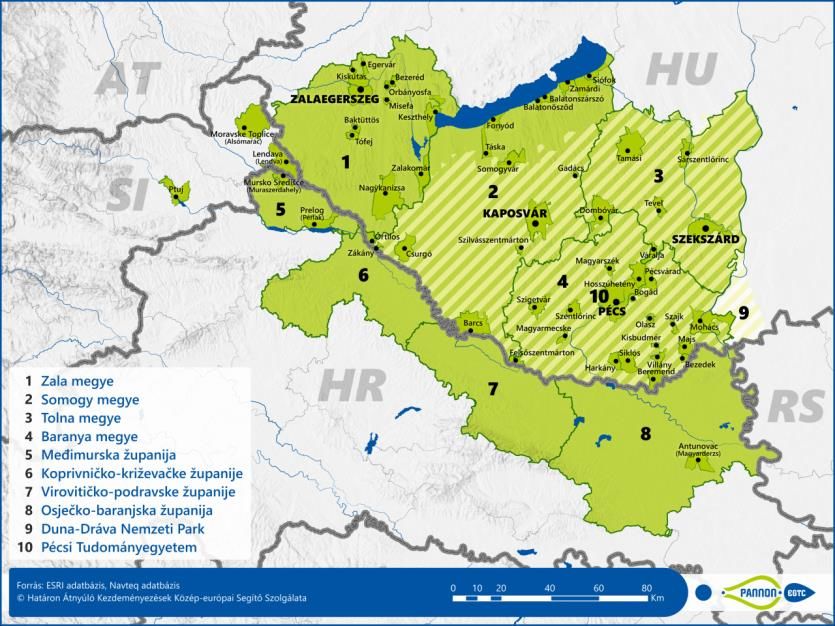
facilitating the internationalisation of SMEs? How do they work, and how could their activities be
improved?” The project brings together partners from five European border regions, representing
various stages of evolution of SME ecosystems, from occasional crossborder cooperation through
more structured networking to international clusterization.

Partners share their experiences and learn jointly on the course of the project. Regional stakeholders
in the regions of each partner are involved in the process, extending the learning opportunity to these
organisations, too. In the project each partner elaborates a tailor-made regional Action Plan will be
elaborated that can lead to the enhanced internationalisation of SMEs in the respective regions.

Participation of the EGTC in Interventures project focuses on the improvement of the policy
instruments serving the needs of the Hungarian and Croatian SME’s in the border area. Thus, Slovenian
partners of the EGTC do not participate in the activities of the projects and projects results are also
focussed on the needs of the Croatian and Hungarian stakeholders.

Analysis has been conducted by the internal staff of the Pannon EGTC. For data search and data-
processing – especially data from the Croatian statistical systems – external expert has been involved.

Main findings of the report have been discussed with the interested regional stakeholders both from
Hungary and Croatia and their views has been incorporated with the final version of the document.

List of institutions represented on stakeholder workshop is the following:

1.Baranya County Government

2. Somogy County Government

3. Koprivnica Križevci County

4. Medjimurje County

5. Osijek-Baranja County

6. Virovitica-Podravina County

7. HAMAG BICRO

8. VIDRA-Virovitica-Podravina County's Regional Development Agency

9. PORA Regional Development Agency of Podravina and Prigorje for promotion and implementation
of development activities

10. Regional Development Agency Međimurje

11. Regional Development Agency of Slavonia and Baranja

12.Mreza Poduzetnickih Inkubatora

13.Baranya County Development Agency

14. Chamber of Commerce and Industry of Pécs-Baranya

                                                   3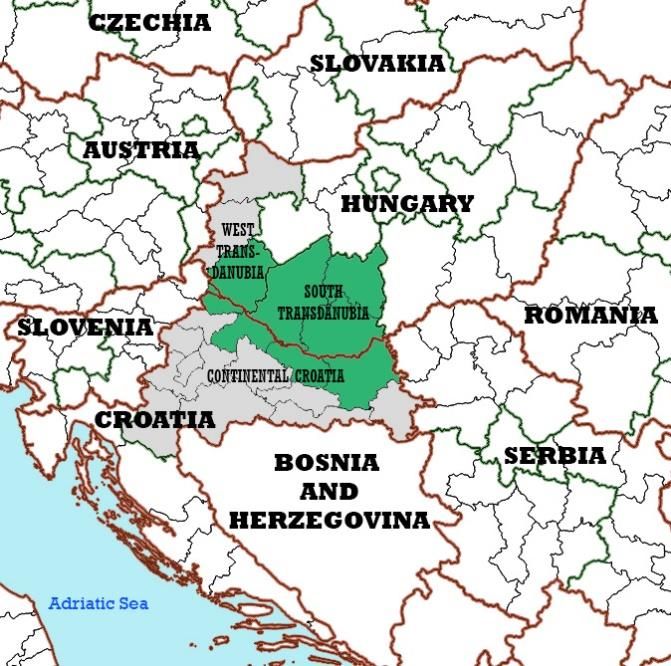
CHAPTER 1: METHODOLOGY
At the outset, no specific document has been available on regional level regarding the competitiveness
of the SME sector. While conducting the analysis, Croatian county level development strategies have
been prepared, focusing on supporting Croatia’s policy objectives for the cohesion policy of 2021 –
2027 budgetary period of the EU. Draft documents of the strategy-making process at county level have
been studied and main strategic directions of them has been incorporated with the analysis. In parallel
with the analysis, the programming for Hungary – Croatia Interreg crossborder cooperation
programme has been conducted. Programme area overlaps to great extent with the area of the
Pannon EGTC covers. Our decision was to use the programme area as territorial framework for our
analysis in order to exploit maximum synergies between the programming process and current
analysis. Thus, current analysis does not cover the Slovenian territories of the Pannon EGTC (as
referred to above) and has been extended to Croatian counties not members of the EGTC for the time
being, but being part of the programme area.

1.1 DESK RESEARCH
In desk research phase, following methods have been used:
internet research
key words for research (in Hungarian mostly, partially in Croatian language) have been:
competitiveness of SME’s, export of SME’s, development of SME’s, cooperation of SME’s, crossborder
research has been caried out in Hungarian and in Croatian, in two rounds: one in March and April 2020,
while the second one in October 2020.
statistical data
National Hungarian and Croatian statistics – available mostly via internet – has been searched. Sources
of have been marked in the relevant parts of the document.
research in documents
National and regional level documents – mostly strategies, programmes - have been searched for
information. Sources of have been marked in the relevant parts of the document.

1.2 ONLINE SURVEY
Online survey has been carried out in two steps. The survey has been sent out – via google - to the
email address of over 2000 Hungarian and Croatian SME’s. Database has been provided by JS of
Interreg HU – HR programme and to a lesser extent by our partners – most part by Chambers of
Commerce and County Development Agencies.
Altogether we received 49 responses, 33 from Hungarian and 16 from Croatian companies. In general,
all responses contain at sufficient and understandable information, so that all was taken into account
in the summary.
To increase the motivation of the SME’s to respond, a prize – a small collection of local wines – has
been offered to be among the respondents. Due to the lack of available capacities, no other mean has
been used (like phone calls, further reminder emails, etc.) to encourage and urge SME’s to respond.

For the time being, the number of responses cannot be judged as representative. To gather new
information, a further round of the survey is planned, still within the timeframe of the Interventures
project.

Questionnaire has been drafted in Croatian and in Hungarian language. The template has been
annexed to this analysis.

1.3 INTERVIEWS

                                                  4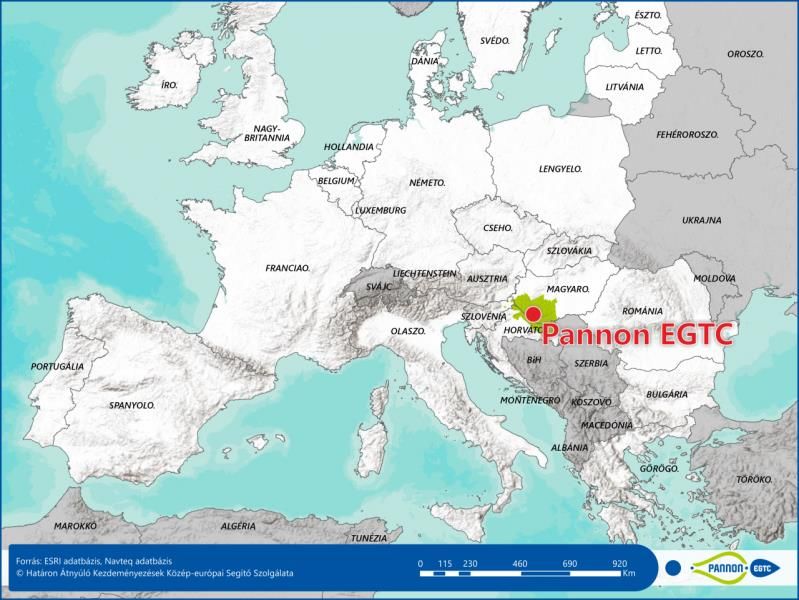
Altogether 8 interviews have been made, with 4 Croatian and 5 Hungarian local experts, working in
institutions in charge of SME development at local and regional level. Interviewees all had a
comprehensive view on the status and needs of local SME’s. Interviews have been carried out over the
phone, in Croatian and Hungarian language, then notes have been made by EGTC staff and conclusion
have been built into the Analysis.

List of interviewees is the following:

Croatia:

    1.     Anaela Sovagovic, Entrepreneurial Center, Local Development Agency Donji Miholjac, director
    2.     Tea Rados, Durdevac, Local Development Agency, director
    3.     Kristina Penzar Kularic, Business Incubator, Koprivnica, Director
    4.     Stimac Marijan, economist, SME development expert, Koprivnica-Krizevci County

Interviews took place during autumn 2020.

Hungary:

Interviews have been based on a pre-drafted list of questions that served as guidance for both the
interviewees and the interviewer.

    1.     Szabolcs Rabb, secretary general, Baranya and Pécs Chamber of Commerce and Industry
    2.     Istvan Göndöcs, economic development expert, Pécs
    3.     Kocsis Tibor, County Enterprise Development Agency, Somogy County, Kaposvár
    4.     Jelenka György, County Enterprise Development Agency, Somogy County, Barcs

Interviews took place in January 2021.

List of questions and guidance for interviewees have been annexed to the Analysis. Document is only
available in Hungarian language with English explanatory text.

                                                   5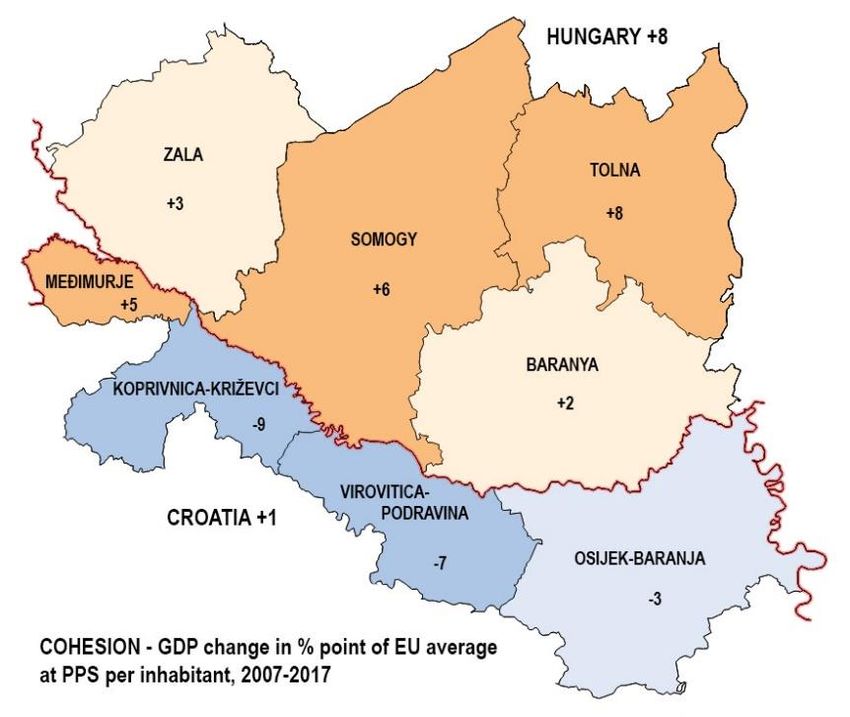
CHAPTER 2: PORTRAIT OF THE REGION
Portrait in this section largely builds on the findings of the situation analysis Pannon EGTC compiled in
the framework of the preparation of the Hungary – Croatia crossborder development strategy 2021 –
2027, commissioned by Pannon EGTC (document: SITUATION ANALYSIS OF THE HUNGARIAN-
CROATIAN BORDER REGION).
2.1. POPULATION, DEMOGRAPHY
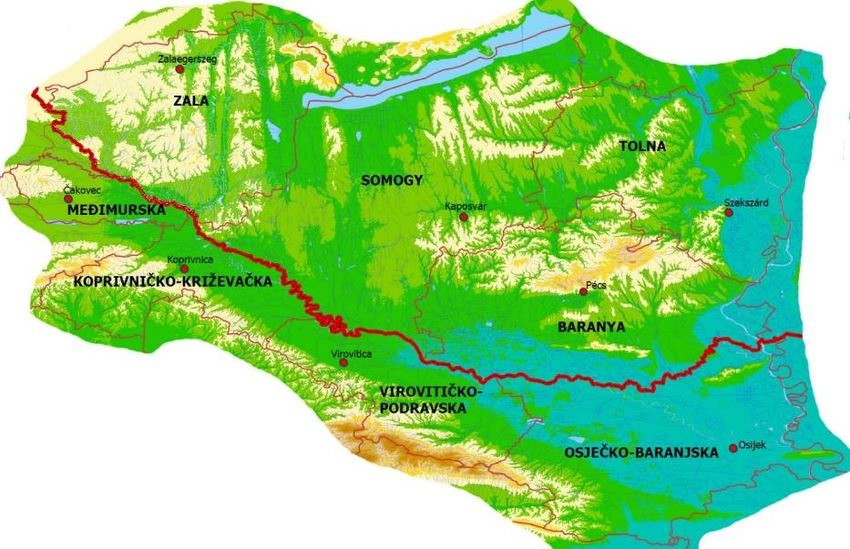
The area of the Hungarian-Croatian border region covers 26,809 km2 and hosts about 1.7 million
inhabitants. It includes four Hungarian counties, Zala (NUTS3) in Western Transdanubia (Nyugat-
Dunántúl), Somogy, Tolna and Baranya in South Transdanubia (Dél-Dunántúl), as well as four Croatian
counties, Koprivnica-Križevci, Međimurje, Osijek-Baranja and Virovitica-Podravina. The four Croatian
counties are part of the region of Continental Croatia (Kontinentalna Hrvatska) The area consists of
predominantly rural regions, that include a number of small and medium sized towns along with one
larger urban centre on each side of the border which are concentrated at and in the agglomeration of
Pécs and Osijek.
1. Figure: The territory of Pannon EGTC (green area) in Central Europe on context of system NUTS
(self-edited figure)
The Hungarian-Croatian border territory is partially surrounded by water systems. On the north by the
Lake Balaton, on the east by the Danube. The state border of Hungary and Croatia predominantly
follows the Mura and Drava rivers until Belišće. The Pannon EGTC area is mostly made up of hills and
fertile plains along the rivers. On the middle of the Croatian part the Slavonian Mountains (Papuk 953
m) are located with extensive forests. The hills of Mecsek (682 m) is situated mostly in Baranya county,
in the north of the city of Pécs and it is the highest mountain range of South Transdanubia and
Hungarian part of the area. Further to be mentioned is the mountain the Kalnik on the western part of
the Croatian side (642 m). The area is mostly rural, there are only four cities over 50,000 inhabitants:
one in Croatia (Osijek) and three in Hungary (Pécs, Kaposvár and Zalaegerszeg).
6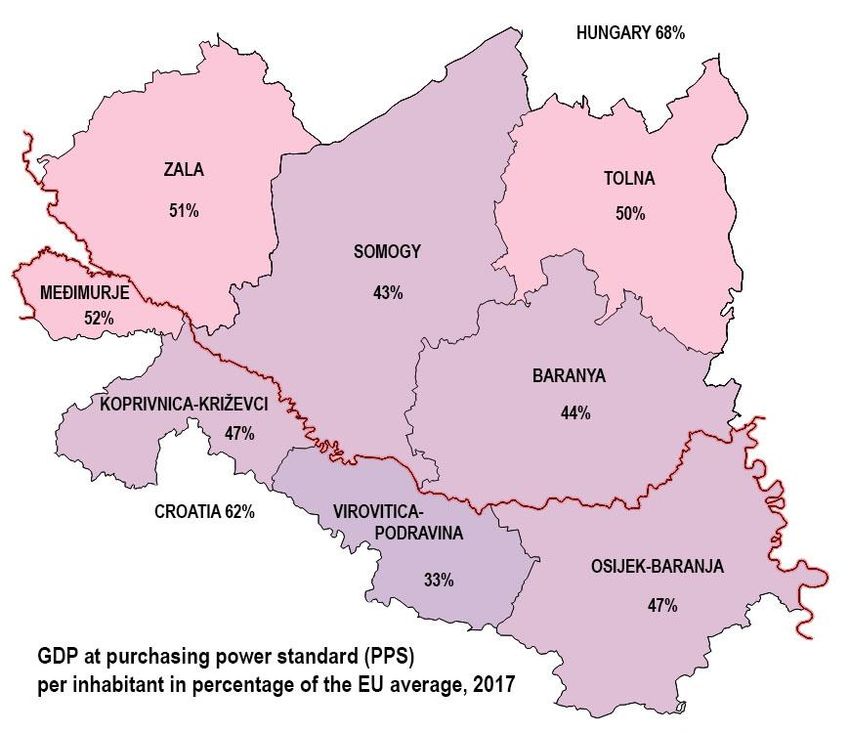
2. Figure: The eight counties of Pannon EGTC (self-edited figure)

The definition of urban areas uses population density to identify urban cores and travel-to-work flows
to identify the hinterlands whose labour market is highly integrated with the cores. The Functional
Urban Areas (FUA) being composed of a city and its commuting zone, FUAs encompass the economic
and functional extent of cities based on daily movements of people. There are four FUAs in the area,
the largest is Pécs with population of 250,000, FUA of Osijek has population of 170,000, Kaposvár and
Zalaegerszeg both have population of 110,000 each.

          3. Figure: Functional Urban Zones and towns of Pannon EGTC (self-edited figure)

On the Hungarian side there are four counties with three cities over 50.000 inhabitants which at the
same time are county seats. There are 14 towns with population over 10,000 and 34 towns with
population under 10,000. The area on the Croatian side consists of four counties, too whereas Osijek-
Baranja county has the biggest size and is the most populated. Besides Osijek, the city with population
over 50,000, five towns with a population over 10,000 and ten towns under 10,000.

                                                  7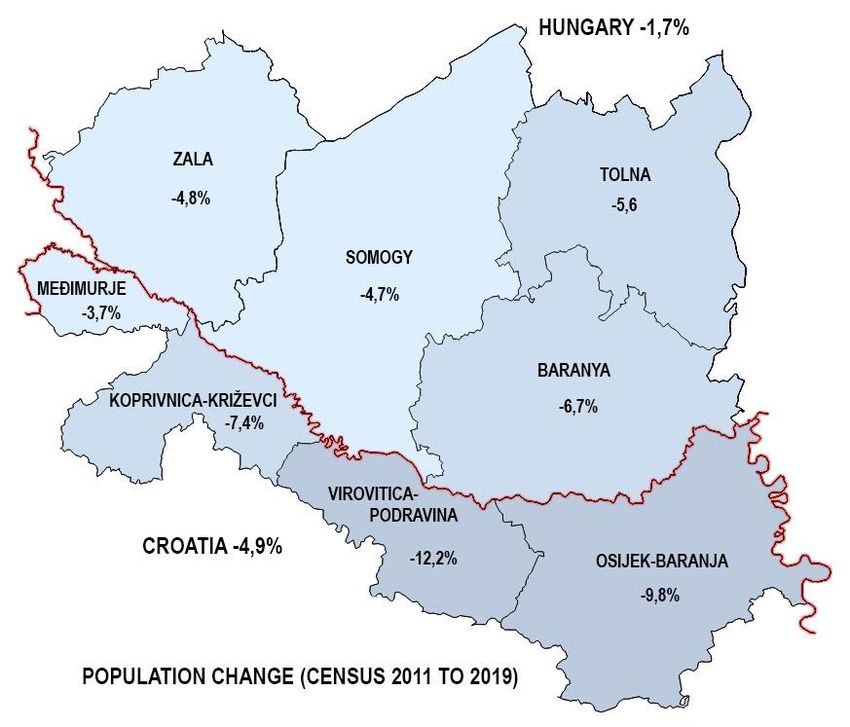
Local governments are functioning in settlements (város, község) in Hungary and in towns and
municipalities (grad, općina) in Croatia. In Hungary there is a subcounty administrative unit – district
(járás) – ten in Baranya, eight in Somogy, six in Tolna and six in Zala.
The area is characterised by a disperse small settlement system. On the Hungarian side Baranya and
Zala have the most disperse settlement structure with more than twice higher number of settlements
than on the Hungarian average. On the Croatian side there is a huge difference in the density of
settlements: western counties contain an extremely high number of settlements even comparing to
Croatian national average, while Eastern counties of Osječko-baranjska are characterised by much
lower density of settlements.

                      4. Figure: Density of settlements (Source: KSH, DZS, self-edited figure)

Altogether, 1760 settlements are situated in the area, out of which 846 is on the Croatian, while 914
is on the Hungarian side of the border.

                                             Population Number of                             Density of
                                                                                   Population
                      Area Population         density municipalities Number of                settlement
       County                                                                          per
                      (km2)  2019.             (pop./       (HR) /     settlements             (sett./100
                                                                                   settlement
                                                km2)    districts (HU)                            km2)
Koprivnica-
                      1 748      107 076               61                25             264       406    15
Križevci         HR
Međimurje        HR     729      109 537             150                 25             131        836   18
Osijek-Baranja   HR   4 155      275 056              66                 42             263      1 046    6
Virovitica-
                      2 024        74 521              37                16             188       396    9
Podravina        HR
Baranya          HU   4 430      360 704               81                10             301      1 198   7
Somogy           HU   6 036      301 429               50                 8             246      1 225   4
Tolna            HU   3 703      217 463               59                 6             109      1 995   3
Zala             HU   3 784      268 648               71                  6            258      1 041   7

                                                         8
Pannon EGTC
                     26 609    1 714 434               64               138           1 760     974     7
Area
Pannon CRO      HR 8 656         566 190               65               108             846      669   10
Pannon HU       HU 17 953      1 148 244               64                30             914    1 256    5
Croatia         HR 56 542      4 076 246               72               556           6756      603    12
Hungary         HU 93 026      9 772 756             105                175           3155     3 098    3
                    Table 1.: Population, area and settlements (Source: KSH, DZS)

Population density is in the medium range on both sides of the border. On the Hungarian side of the
Pannon EGTC area, Somogy county has the largest territory and Baranya county has the highest
population. On the Croatian side Osijek-Baranja county is the largest and also is the most populated.
In the area, which is 26 609 km2 large, the population exceeds 1.7 million heads (2019), 67% of that
lives in Hungary and 33% in Croatia. The population density is 64 capita/km2, amounting to 56% of the
figure of the European Union (EU 27) and lagging behind the national averages of the two countries as
well (62% of the Hungarian and 87% of the Croatian average). It is especially the centre of the area
which is scarcely populated, in the western part the population density could be regarded as high, but
despite of that strong urban centre could not be found there.

                        5. Figure: Population density (Source: KSH, DZS, self-edited figure)

Baranya county stands out somewhat, because of its county seat is Pécs, the largest city in the area.
Its neighbouring county, Somogy is the less populated county of Hungary, where the population
density is even lower than half of the national average.

                                                         9
In Croatia, Međimurje is particularly densely populated, above national average, in contrast to the
middle part of the territory: Virovitičko-podravska is the least densily populated county in the
Pannon EGTC area (37 inhabitants/km2).

The NUTS 3 regions in the area, the population density figures compared to the EU average vary
between counties. The population density is higher than the EU average (115 persons/km2) in only
one of the eight counties: Međimurska.

                        6. Figure: Population change (Source: KSH, DZS, self-edited figure)

In the entire area, according to the last decade, the population in general decreased by 4-12%. The
most dramatic fall of the population was registered in Virovitičko-Podravska county (-12.2% in
comparison to 2011), but Osijek-Baranja county also has quite a significant drop in the population
figures (-9.8%) in contrast with the Croatian average of -4.9%. In the three Hungarian counties the
decrease in the number of populations was similarly exceeding 5-7%, being three and four times as
high as the national tendencies.

The brain drain effect is shown, a significant number of young graduates leave the area yearly and
emigrate to the capitals, north-western part of Transdanubia or areas within as well as outside the EU
where better labour conditions are present. The result of the above impacts in the area is that the
proportion of the elderly increases and that of the young decreases within the region further
deteriorating the quality and number of available workforce.

These have severe negative social and economic consequences that already can be felt and are
expected to influence the future outlook of the region as well. The dependency ratio of the elderly

                                                       10
population is the most favourable in Baranya among the four Hungarian counties: it is 30.9% (2019),
being higher than the national average (29.3%). By contrast, the ratio of Zala county – 33.1% – even
exceeds the ratio of the European Union (31.4%). The dependency ratio in Croatia averages at 31.6%,
but it varies between the counties in the border areas.
On the Hungarian side of the border the share of people aged 19 and younger is 2-3% lower than the
EU average. In Zala and Somogy counties, the share of people aged between 20 and 34 is also lower
than the EU average by 2% and 1% respectively. In the Hungarian NUTS 3 regions the share of
population aged 50 to 64 is 1-2% higher, while the share of those persons above 65 is similar to EU
average shares.
In the four Croatian counties, the share of young and old people is similar to the EU average. In some
regions the share of those aged 35 to 49 is 2-3% lower than the EU average, while the share of those
50 to 64 is 2-3% higher.
Colourful cultural supply is available in the region as there is a wide range of different nationalities
present, who contribute to the collective cultural heritage. In Baranya county 6.6% of the population
is German, 4.5% Roma and 1.8% is Croatian. In Somogy 5.3% Roma and in Zala 2.6% Roma individuals
are registered. Increase of the Roma population causes constantly emerging problems as their social
integration is very problematic which is hindered by the fact that highest proportion of Roma
minorities can be found in the micro regions in the most disadvantageous social and economic
position, from which many lives on the peripheries of the region.
Croatia has 9.58% national minorities, of which Serbs are the largest (4.36%), followed by Bosnians
(0.73%), Italians (0.42%) and Albanians (0.41%) and Hungarians (0.33%). Out of the four counties
included in the area, Osijek-Baranja has the largest proportion of minorities (about 14% of the
population), of which 7.76% Serbs and 2.70% Hungarians. A significant Roma population lives in
Međimurska county (4.49%).
112.2 ECONOMY
Overall economic development
In general, the counties of the area perform economically rather weak, behind EU average. Since the
2008 economic downturn, the region’s performance was characterized by either stagnation or
decrease in general. Compared both to the respective countries’ as well as EU averages, the border
region is lagging behind. The economy has slow growth rates along with major disparities in the border
region. The north-western part of the area performs slightly better in economic terms and Hungarian
counties somewhat overperform the Croatian ones, but differences in general are not significant. The
relatively better performing counties are Međimurje in Croatia and Zala and Tolna in Hungary,
furthermore, only three counties have reached at least the half of the EU average in recent years,
namely Zala, Tolna and Međimurje counties.
2015 2016 2017 2018
European Union - 28 countries 29 100 29 300 30 100 31 000
Croatia 17 300 17 800 18 600 19 500
Kontinentalna Hrvatska 17 600 18 100 18 800 19 800
Koprivnicko-krizevacka zupanija 13 300 13 800 14 100 …
Medimurska zupanija 14 300 14 800 15 500 …
Viroviticko-podravska zupanija 9 300 9 800 10 100 …
Osjecko-baranjska zupanija 13 500 14 000 14 200 …
Hungary 20 000 19 800 20 600 21 900
Nyugat-Dunántúl 21 700 21 600 21 600 22 200
Zala 16 400 15 200 16 000 16 600
Dél-Dunántúl 13 300 13 200 13 900 15 100
Baranya 12 900 12 900 13 500 14 700
Somogy 12 500 12 400 13 300 14 400
Tolna 15 000 15 000 15 100 16 500
2. Table: Gross domestic product (GDP) at current market prices. Purchasing power standard (PPS) per inhabitant (Source:
EUROSTAT)
The north-western part consisted of Zala, Međimurje and Koprivnica-Križevci counties are the most
developed ones, the exception is being Osijek-Baranja with higher rate on the southeast side and in
north-east, Tolna have a nuclear power plant which is distorts the economic performance. Generally,
it can be said that the territory shows an East-West division in terms of economic activity and output.
127. Figure: GDP per inhabitant (Source: EUROSTAT, self-edited figure)
Considering the economic trends visible throughout 2007-2017, the whole area has been characterised
by the process of economic downturn, all counties concerned registered lower rates of development
than their respective national averages (EU28=100), while some are showing positive results that might
also be due to declining population numbers. These trends can be seen below.
8. Figure: Cohesion (Source: EUROSTAT, self-edited figure)
Hungary was able to increase its economic performance measured in GDP and compared to the EU
average by 8 %-point, whilst Croatia only managed to reach in 2016 the level of cohesion in 2007 after
suffering several crises from 2009 onwards. With regards to the counties of the Pannon EGTC area,
Tolna and Somogy county is to be considered as the most successful with its 6 %-point increase, while
13Međimurska county of Croatia have registered a 5% increase in the 2007-2017 period. The best
performing year regarding Hungary was 2016.
2015 2016 2017 2018
European Union - 28 countries 105.1 100.7 102.7 103.0
Croatia 106.1 102.9 104.5 104.8
Kontinentalna Hrvatska 106.7 102.8 103.9 105.3
Koprivnicko-krizevacka zupanija 105.6 103.8 102.2 …
Medimurska zupanija 105.9 103.5 104.7 …
Viroviticko-podravska zupanija 105.7 105.4 103.1 …
Osjecko-baranjska zupanija 107.1 103.7 101.4 …
Hungary 105.8 99.0 104.0 106.3
Nyugat-Dunántúl 108.5 99.5 100.0 102.8
Zala 109.3 92.7 105.3 103.8
Dél-Dunántúl 106.4 99.2 105.3 108.6
Baranya 105.7 100.0 104.7 108.9
Somogy 108.7 99.2 107.3 108.3
Tolna 105.6 100.0 100.7 109.3
3. Table: Change of gross domestic product (GDP) - % - Previous year = 100% (Source: EUROSTAT)
Real GDP growth has been robust in the past few years attributable to increased EU funding, higher
EU demand for Hungarian exports as well as a rebound in domestic household consumption. Regarding
Croatia 2016 seems to be the first year too showing trends of economic recovery after the 2009 crises.
What can be said about the region is that it shows a defined East-West division regarding economic
performance in view of GDP. Western counties generally perform much better than their eastern
counterparts, which show significant decline or stagnation in output.
The export data are not available at subnational level. In 2018, the value of export was €77.86 billion
in Hungary and €13.97 billion in Croatia.
export % 2015 2016 2017 2018
Croatia 111.3 105.6 111.1 105.3
Hungary 106.6 103.7 108.6 79.2
4. Table: Change of export % - previous year = 100% (Source: EUROSTAT)
Innovation, R&D
R&D is one of the major drivers of innovation, therefore expenditure in this field serves as a key
indicator to assess resources devoted to technology and science. In the EU, R&D expenditure has
slightly increased to 2.07% of total GDP in 2017 whereas it started off at 1.77% in 2007. The border
region of Hungary and Croatia is very similar to the situation to the country as a whole, since there was
no significant increase recorded in the intensity of R&D activity throughout the last 10 years.
2007 2008 2009 2010 2011 2012 2013 2014 2015 2016 2017
European Union 1.77 1.83 1.93 1.92 1.96 2 2.01 2.02 2.03 2.04 2.07
Croatia 0.79 0.89 0.84 0.74 0.75 0.75 0.81 0.78 0.84 0.86 0.86
Continental Croatia 1.17 1.11 0.98 0.95 0.96 0.99 0.98 1.08 1.11 1.07
14Hungary 0.96 0.98 1.13 1.14 1.19 1.26 1.39 1.35 1.35 1.19 1.33
Western Transdanubia 0.6 0.55 0.57 0.58 0.64 0.6 0.74 0.63 0.58 0.55 0.63
South Transdanubia 0.37 0.33 0.42 0.46 0.6 0.92 0.76 0.59 0.42 0.36 0.7
5. Table: Expenditure in Research and Development as % of GDP (Source: EUROSTAT)
The population ratio employed in High Technology Manufacturing and Knowledge Intensive Sectors
(HT KIS) both in the continental part of Croatia (5%) and in South and Western Transdanubia (2.6% and
3.9%, respectively) on NUTS 2 level is lower than the EU average that is 6.1% according to Eurostat
data from 2018.
Hungary performs below the EU average on both the Digital Technology Integration Index and in terms
of the Digital Transformation Enablers’ Index. Compared to other EU Member States, Hungary
performs below the average in 6 dimensions, integration of digital technology, changes in ICT start-
ups, e-leadership, supply and demand of digital skills, access to finance as well as digital infrastructure.
The digital infrastructure is the biggest challenge to overcome with 38% disparity compared to the EU
average. Croatia performs close to the EU average on the Digital Technology Integration Index, but is
significantly below the EU average in terms of the Digital Transformation Enablers’ Index. Compared
to other EU Member States, Croatia scores above the EU average in two out of seven dimensions. With
a lead of 15% compared to the EU average, the field where Croatia performs best is Entrepreneurial
Culture. While the investment climate for enterprises performs more than 30% below EU average,
digital infrastructure and the supply and demand of digital skills score approximately 20% below EU
average.
In terms of the ‘e-commerce’ index (taking into account enterprises selling online, receiving/serving
orders via computer mediated networks, electronic sales both domestically and to other EU countries)
Hungary has the 8th lowest score among EU countries. Croatia is slightly below the EU average with
respect to the e-commerce index. In terms of web sales, Croatia is slightly below the EU average and
Hungary is a bit behind Croatia. There is a very large difference between web sales to own country and
web sales to other EU countries in both Hungary and Croatia as inland web sales are predominant in
both.
On the Hungarian side, the R&D activities are concentrated in Pécs and to a lesser extent are present
in Zalaegerszeg, Keszthely and Kaposvár. This is due to the university basis as the University of Pécs is
one of the biggest universities of the country outside of Budapest, in terms of number of faculties,
lecturers and students as well. University of Pécs is a main actor not only in higher education but in
research alike. University research groups are working on different scientific domains, in 2012 the
Szentágothai Research Centre started its operation. University of Pécs also has wide range of research-
focused international relations.
On the Croatian side, the strongest university centre with a research potential is Josip Juraj
Strossmayer University in Osijek with various faculties (agriculture, engineering, medicine, biology,
chemistry, mathematics, physics, law, social sciences).
In Croatia, a set of Competitiveness Clusters was established for the key industrial sectors, based on
the “triple helix” principle namely, bringing together industries, research institutions and local and
regional governments with a set of others in different phases of establishment. Examples of these
clusters are the Euvita Cluster that is located in Northwest Croatia with the purpose of achieving
programme aims of rural development and to connect small and medium enterprises in programmes
of development of production and processing of agricultural products and rural tourism in accordance
with the notion of sustainable development. Another example is the Cluster of Cultural Routes that
was founded as a new destination marketing and management organisation, with the aim of realizing
goals and objectives in creation and development of cultural routes.
In the Croatian part a relatively fast development of the ICT sector is observable: in Međimurje county
(IT cluster) and in the broader Croatian territory. Međimurje county hosts the Technology and
15Innovation Centre Međimurje, which is focused primarily on ICT and cooperates closely with the faculty
in Varaždin (in addition to cooperation with Međimurje Polytechnics).
Labour Market
Due to the negative natural rate of population change and negative net migration rate, the population
changes follow a negative trend in both Hungary and Croatia. In Croatia net migration is the primary
factor influencing the negative net population change rates. The age profile of the population does not
deviate substantially from the average EU age profile. There is a trend of “brain-drain” effect in the
region that is happening as young, educated population emigrates to other European countries or
outside the EU.
The following characteristics can be said about the employment status of the region: employment
rates of the age group of 20-64 are 77.9% in Western Transdanubia and 69.4% in South Transdanubia,
while 66.4% in Continental Croatia and 73.2% in the EU.
The economic growth as well as the emigration of recent years has translated into reduced
unemployment in Croatia, but the employment rate remains comparatively very low. Long-term
unemployment for 2018 is slightly higher in Continental Croatia (3.3%) than the EU average figure
(2.4%). The rates are lower in Hungary in comparison to EU levels, i.e. 0.6% on Western Transdanubia
and 2.0% in South Transdanubia. The highest job vacancy rates can be observed in the ‘Manufacturing’,
‘Administrative and support service activities’ and ‘Arts, entertainment and recreation’ sectors in
Western Transdanubia, and in the ‘Education’ and ‘Administrative and support service activities’
sectors in South Transdanubia. Data on employment for the county level is available as numbers of
employed, where the largest share of employed compared to the total in Croatia (2018) are registered
in Osječko-baranjska county. According to data on national level for Croatia, the highest job vacancy
rate can be found in the ‘Accommodation and food service activities’ and ‘Public administration and
defence; compulsory social security’ sectors.
In Baranya (6.9%) and Somogy county (6.3%) the unemployment is problematic as its rate is far above
the national average (3.7% in 2018), but below the EU27 average. The most favourable situation is in
Zala county, caused by the proximity of this county to the Austrian labour market and the relatively
high number of commuters to Austrian workplaces. Distribution of unemployment is uneven on the
Hungarian side as in the Balaton and Pécs area it is lower than in the other parts of Baranya and Somogy
counties. The majority of them are low-skilled, their share in Somogy is 45% among the jobseekers.
This results the presence of long-term unemployment as 22-24% of the jobseekers are registered for
more than one year, similarly to the figure of the national average. The majority of the jobseekers are
men, though the difference between the two sexes is not significant. The number of registered job-
seeking career starters was decreased in the recent years and reached 9.2% of the registered jobseeker
total.
In the Croatian part of the programme area higher unemployment rate has been measured than in the
Hungarian part. However, the differences between the westernmost part of the area and the eastern
part are huge. Like in Hungary, there is a trend of decline in unemployment primarily due to
outmigration of younger population to western European countries like Germany, Austria and Ireland
in particular. The cross-border commuting is not significant because of the lack of large employers and
the low density of border crossing points. Language barrier also represents crucial hindering factor.
162015 2016 2017 2018 2019
European Union - 28 countries 9.4 8.6 7.6 6.9 6.3
Croatia 16.2 13.1 11.2 8.5 6.6
Kontinentalna Hrvatska 15.9 12.6 11.4 8.0 6.7
Koprivnica-Križevci … … … … …
Međimurje … … … … …
Osijek-Baranja … … … … …
Virovitica-Podravina … … … … …
Hungary 6.8 5.1 4.2 3.7 3.4
Nyugat-Dunántúl 3.8 2.7 2.4 2.0 1.8
Zala 5.4 3.8 4.3 2.6 2.2
Dél-Dunántúl 8.1 6.2 6.3 5.6 4.8
Baranya 8.5 7.6 7.5 6.9 6.6
Somogy 8.6 5.4 7.3 6.3 3.7
Tolna 6.9 4.6 3.0 2.2 3.2
6. Table: Unemployment rates - % (Sorce: EUROSTAT, KSH, DZS)
It can be stated that labour productivity is lacking of the EU average (EU: 100,1, Croatia: 72,2, Hungary:
69,4), which is a serious problem affecting both country’s overall competitiveness in the international
market.
In Croatia, there is notable disproportion between the labour market and educational system which is
reflected in the fact that the majority of unemployed are those with 1-3 year vocational secondary
schools, whose numbers prevail in the structure of unemployed even over those with no schooling or
with primary school. Most of the unemployed have been unemployed for over 12 months (the average
of long-term unemployment in the programme area is 42.8%, close to Croatian average) and majority
of the unemployed and particularly of long-term unemployed are women. A significant proportion of
unemployed are young (39.7% of all unemployed are below 30 in 2017), who have trouble entering
the labour market, but a problem is in particular the unemployed of the population of over 50 years of
age (17.2%), which tends to be hard to re-enter the job market. In spite of high unemployment rate
labour shortage occurs in some professions (for example CNC turner). In general, there is a significant
discrepancy between the demand and the supply of skills in the labour market in Croatia.
The activity rate of the labour force in Croatia has increased from 48.8% in 2007 to 51.6% in 2017. The
increase in the activity of the older working population has been noticed. Namely, in the period 2007–
2017, the activity rate of the age group 25-49 has increased from 84.99% to 85.6%. Meanwhile, the
activity rate of the age group 50-64 has increased from 52.04% to 53.2%. The increase in the activity
of the older working population is mostly a consequence of the retirement plan reform, which has
involved a gradual increase in the minimum retirement age. Until recently, the most usual plan to deal
with unemployment was early retirement. That fact is reflected in Eurostat data on duration of working
life. In 2011, number of years a person age 15 is expected to be active in the labour market was only
31.1 for Croatia, while the same indicator value for EU27 was 34.7. Therefore, not only that labour
market figures were below the desired level, but the unsustainable pressure was created upon pension
system and public financing.
17In summary, the Pannon EGTC area presents a relatively low contribution from technology and science
to the regional economy, which, in itself, requires an improvement of conditions in order to raise levels
closer to EU standards at national and regional levels as well. Barriers in this field are arising due to the
lack of business and entrepreneurship skills, low R&D activity, lack of experts and community, poor
availability of technology, or limited access to finance. Investors at this region retain from commitment
as they do not take the longer-term view into account and see no development of favourable
conditions regarding digitisation, education, infrastructure, bureaucracy or human capacities to name
a few.
2.3 SMEs IN THE REGION
Enterprise density is higher on the Hungarian territories. Operating enterprises are present in lower
numbers in rural areas. Density of the operating enterprises in none of the Hungarian counties reaches
the national average. Among the four Hungarian counties the highest number of operating enterprises
could be found in Baranya. The lowest density of the enterprises is in Somogy county.
The Croatian part of Pannon EGTC area shows a rather weak picture in terms of density of business
units compared to Hungarian and also to Croatian national average. In terms of density of active
enterprises Međimurje county clearly stand out. The density of enterprises with ten or more
employees shows a balanced picture in Pannon EGTC area, only Međimurje stands out from the other
counties.
On the other hand, the number of active business entities had been increasing within the period of
2011 and 2017.
Rates of Density of
Active
enterprises enterprises 10
Active enterprises Density of enterprises
less than 10 employees or
enterprises 10
employees more
2017 employees
per 10 000 per 10 000
or more per km2 %
inhabitants inhabitants
Croatia 168 168 14 171 3.0 408 91.6 34
Kontinentalna Hrvatska 101 461 9 653 3.2 367 90.5 35
Koprivnicko-krizevacka zupanija 2 574 260 1.5 236 89.9 24
Medimurska zupanija 3 898 474 5.3 351 87.8 43
Viroviticko-podravska zupanija 1 780 184 0.9 231 89.7 24
Osjecko-baranjska zupanija 7 307 682 1.8 258 90.7 24
Hungary 686 888 32 702 7.4 701 95.2 33
Nyugat-Dunántúl 67 339 2 962 6.0 685 95.6 30
Zala 18 312 761 4.8 666 95.8 28
Dél-Dunántúl 53 593 2 051 3.8 599 96.2 23
Baranya 23 602 887 5.3 645 96.2 24
Somogy 17 307 640 2.9 564 96.3 21
Tolna 12 684 524 3.4 572 95.9 24
Pannon EGTC Area 87464 4 412 3.3 500 95.0 25
Pannon CRO 15559 1 600 1.8 268 89.7 28
Pannon HU 71905 2 812 4.0 615 96.1 24
7. Table: Active enterprises (Source: EUROSTAT, KSH, DZS)
Both in the Hungarian and the Croatian part the lack of large enterprises is characteristic. In the
Hungarian part, the number of active corporations and unincorporated enterprises with 250 or more
persons employed is only 77 company: 20 in Zala, 22 in Somogy, 19 in Baranya and 16 in Tolna. The
total number of active enterprises in 2017 is 87,464 (71,905 in Hungarian part, 15,559 in Croatia) of
which 28,517 are referring to self-employment and 54,535 enterprises have 1-9 persons employed;
18therefore, entrepreneurs and SMEs have important role in employment as well. Although, the 95% of
active enterprises have less than 10 employees.
9. Figure: Density of Enterprises (Source: EUROSTAT, KSH, DZS, self-edited figure)
In Croatia, the North-Western part of the country, including Međimurje (2017: 3898 active companies)
overall have the largest number of SMEs, the greatest share of total employment in SMEs and the
greatest value-added generation by SMEs. The Central and Eastern part of Croatia except Osijek-
Baranja County (2017: 7307 active companies) is overall the poorest performing part of the whole
country in terms of SME activity and presence, as this largest part of the area possess the smallest
number of enterprises, the least employment in SMEs and the lowest generation of GDP.
Geographical distribution of SME’s in HU: Enterprise density is higher on the Hungarian territories.
Operating enterprises are present in lower numbers in rural areas.
In the Global Competitiveness Index (GCI) ranking in 2019, Croatia ranked 63rd showing a five-level
progress compared to the previous year, whereas Hungary ranked 47th that is stagnating compared
to 2018. Both countries are lagging behind of competitiveness compared with EU member states.
Representation of sectors in the economic structure
Agriculture plays a more important role in the area than it does in the national economy of the two
countries. This remark refers to both the sector’s income generation potential and to the employment
levels too. The share of agriculture is three times higher in the area than the European average.
Average parcel size is traditionally bigger in Hungary, due to the developing dominance of industrial
farming. In Croatia the lands are smaller and are predominantly being cultivated by family-run
agricultural businesses. On both sides of the border production of arable crops is typical, like maize,
wheat and other cereals, sunflower and rape. The number of livestock decreased in the past decades,
there are typically poultry and pigs for slaughter, cattle for milk and bee families for honey. Zala and
Somogy are the two most afforested counties of Hungary, but in Baranya and on the Croatian areas
there are extended forests as well that could serve as a basis for touristic and wood industry purposes.
The common asset of the area is the high level of wine-growing and production which is frequently
linked to tourism and catering industry.
Group of industry Agriculture, forestry and fishing Industry Construction Services Total
19NACE Code A B,C,D,E F G-U A-U
Croatia 3.8 21.4 5.3 69.5 100.0
Koprivnicko-krizevacka 13.3 35.7 5.1 45.9 100.0
Medimurska 7.4 43.6 4.2 45.0 100.0
Viroviticko-podravska 16.3 23.0 6.8 54.0 100.0
Osjecko-baranjska 11.4 22.1 6.4 60.2 100.0
Hungary 4.4 26.0 4.3 65.3 100.0
Zala 6.6 27.7 5.6 60.1 100.0
Baranya 10.0 19.1 4.6 66.3 100.0
Somogy 11.5 20.5 4.7 63.3 100.0
Tolna 11.0 32.9 6.1 50.0 100.0
8. Table: Distribution of gross value added by main groups of economy (Source: DZS, KSH)
Industry and services
Based on available data (Structural Business Statistics, SBS) data NUTS II Continental Croatia, in terms
of the share of people employed, has a relatively stronger focus on Wholesale trade, Retail trade, ICT
and Professional, scientific and technical activities. In Hungary, Western Transdanubia and Southern
Transdanubia have a stronger relative focus on Construction and Professional, scientific and technical
activities.
In Koprivnica-Križevci county there are 52 percent of all employees work for the manufacturing
industry, especially in the sectors of food and beverage and pharmaceutical production, followed by
wholesale and retail trade, construction and agriculture. Međimurje economy is predominantly based
on manufacturing industry, which generates the highest income and employs the most people, and
the agricultural, trade, transport and construction industries are also developed. It is export oriented,
with a significant share of labour-intensive, low-cumulative and traditional industries, with the
developing trend of high-tech industries. Within manufacturing, the most represented industries are
metal processing, textile and clothing, wood processing and food industry.
The main industries in Virovitica-Podravina county are agriculture (sugar beet, tobacco and medicinal
plants; beekeeping, fish farming), final wood processing (office, school and other furniture, parquet
floors, clogs), food and non-metal industries (ceramic tiles). Osijek-Baranja county has, beside
manufacturing and the food industry, timber, chemical and metal industry, machinery, building
materials, and also a growing IT industry.
NACE Share of value added by main groups of economy
Code Group of industry
Koprivničko- Virovitičko- Osječko-
Međimurska Croatia
križevačka podravska baranjska
Agriculture, forestry
A 13,3 7,4 16,3 11,4 3,8
and fishing
Manufacturing, mining
B,C,D,E and quarrying and 35,7 43,6 23,0 22,1 21,4
other industries
F Construction 5,1 4,2 6,8 6,4 5,3
Wholesale and retail
trade, transportation,
G,H,I storage, accommo- 14,2 13,5 12,4 15,9 22
dation and food
service activities
Information and
J 0,7 2,1 1,1 3,5 4,5
communication
Financial and
K 4,4 3 4,3 3,4 6,3
insurance activities
L Real estate activities 8,4 9,4 12,6 9,8 10
20NACE Share of value added by main groups of economy
Code Group of industry
Koprivničko- Virovitičko- Osječko-
Međimurska Croatia
križevačka podravska baranjska
Professional, scientific,
technical,
M,N administrative and 4,0 4,8 3,2 6 8,3
support service
activities
Public administration
and defence,
O,P,Q education, human 12,2 10,8 18,4 18,8 15,1
health and social work
activities
R,S,T,U Other service activities 2,0 1.4 2,0 2,8 3,3
A-U Total 100.0 100.0 100.0 100.0 100.0
9. Table: Distribution of gross value added by main groups of economy in Croatia, 2016 (Source: DZS)
In Hungary, regarding industrial production Tolna and Zala are the leader among the counties of the
cross-border region on the Hungarian side. The value of industrial production per capita of the
counties are in Tolna 82%, in Zala 77%, in Somogy it is 52% and in Baranya it is 44% of the national
average in 2018. Zala’s economy is characterised by strong links to the automotive and machinery
industries of the northern two counties of the Western Transdanubia region and a large share of
workforce commuting to Austrian workplaces, too, especially in the middle and the northern part of
the county. Baranya records the lowest figure of industrial production per capita despite the fact that
the biggest urban agglomeration of the area is located there. Economy of Somogy – and, to a relatively
lesser extent of Zala – is influenced by the strong presence of the service sector, partly due to the
developed tourism-related services (accommodation, catering) at the lake Balaton and spa resorts,
resulting in the share of services is the high in Somogy. Baranya performs above national levels, Zala
barely below, however, business services, especially info communication and financial services are
rather weak in all of the three counties. Among services the public ones – like – public administration,
education, social- and health services – are overrepresented in the Hungarian counties of Somogy and.
Business services are characteristically weak and are concentrated in larger cities in both counties,
however, IT sector is a bit over national average in Osijek-Baranja County (Croatia).
The Hungarian-Croatian border region shows no signs of real sector specialisation. Most segments of
the processing industry operate here, among them it is worth mentioning the food industry, the
machinery and there are significant capacities of electronic assembly plants as well. Due to the lack of
large enterprises indicated in the previous section, non-sectoral SME support as well as boost of the
already established agricultural sector is justifiable and could potentially strengthen capacities and
market share of the local establishments.
212.4. Relevant issues and challenges
General – national level – challenges in the two countries can be summarised as follows:
Relevant issues Hungary (National Strategy for SME’s, SBA-scores and GEM)
1. Expanding employment between 2013 and 2017, with unchanged proportions of employment
by SME’s and bigger companies
2. Employment and added value grew mostly in services and construction sectors. SME’s added
value grew mostly in commerce. Although relative weight of the central region decreased, the
counties of the EGTC area are not among the beneficiaries of this process.
3. Overall digital development of the Hungarian economic actors are among the less developed
in the EU, in digitization of business processes and e-commerce Hungary’s position is the last
one. In online commerce, only 7% of the companies (out of all ones active in e-commerce)
provides services internationally.
4. Relative (to gross value added) high performance of Hungarian SME’s in export, however,
export volume is added up by very few SME’s (in 2016 by 5,9% of all SME’s)
5. For Hungarian SME’s recruiting and retaining skilled workers is more difficult than in „V4”
countries
6. Low participation of employees/workers of SME’s in adult training
Relevant issues Croatia (based on SBA-scores and GEM)
1. Access to finance:
a. lowest SBA-score in equity funding for new and growing firms, and the lowest ranking
for SME financing by business angels, BUT
b. third best in the EU on access to public financial support
2. Worst performing EU country in terms of “responsive administration” (public administration
being responsive to the needs of SMEs):
3. Low rankings in the field of entrepreneurship education at school stage and post school stage,
too.
4. Weakness of research and development transfer, weak connections to research sites and
SMEs.
5. The low innovative capacity of SMEs has been identified as a long-term issue diminishing the
country’s competitiveness in international markets.
6. The share of new products produced by Croatian companies are much lower than other
European countries, whereas the technological readiness of Croatian businesses is about
average.
According to more than 300 academic experts from Global Entrepreneurship Monitor (GEM), which
has been collecting data continuously from more than 100 countries since 1999, and perform analyses
on entrepreneurial eco-system in national level. Perceived quality of entrepreneurial ecosystem -
average value of experts’ perceptions for the nine entrepreneurial framework components in Croatia
and Hungary:
2210. Figure: Expert ratings of the entrepreneurial eco-system in Croatia, 2017 (Source: Global Entrepreneurship Monitor)
11. Figure: Expert ratings of the entrepreneurial eco-system in Hungary, 2017 (Source: Global Entrepreneurship Monitor)
23At the regional level more specific challenges could be identified, as follows:
1. The whole area of the EGTC show strong characteristics of a peripheral status. Although
transport links to central areas of the states are developing in both countries, peripheral
situation in economic terms results in considerably less FDI then in more favoured parts of
the countries (especially in Hungary) and an outmigration of trained and young professionals
from the region towards the centres.
2. Additionally, capacities of transport links (e.g. the border-crossing points) between the two
countries are also very low, partially due to the geographic situation, namely the long section
of the border constituted by the river Drava. Further difficulty in crossborder trade is that
Croatia is not part of the Schengen Area, so that border crossing involves control procedure.
3. On the other hand, well-equipped higher educational institutions, strong cultural identity,
active institutional networks as well as some minorities living on the other side of the border
and traditions of cooperation may form the basis of a new, more knowledge-based economic
development path for the region.
CHAPTER 3: INTERNATIONALIZATION ENVIRONMENT
3.1. LEGAL BACKGROUND
The national law in Hungary is the XXXIV of 2004 on Small and medium-sized enterprises and support
for their development Act. The purpose of the law is to define SMEs and to summarize state aids to
promote their development, and thus to create economic conditions that ensure the long-term growth
of competitiveness and employment at both national and EU level, and the reduction of competitive
disadvantages and the catching-up of businesses with European Union requirements.
In Croatia, criteria for classifying entities in the small and medium enterprise sector are defined by the
Accounting Act and the Small Business Development Promotion Act.
There are no national or regional regulations about the internationalization of SMEs, the national law
in Hungary does not contain the phrase “export”.
The years of 2020 and 2021 are transition period between 2014-2020 and 2021-27 programming
periods, which is the time for strategy renewal.
Current strategies that regulate and encourage the development of the small and medium enterprise
sector in Croatia are1:
Strategy for Development of Entrepreneurship in the Republic of Croatia 2013-2020, whose aim is to
increase the competitiveness of small and medium enterprises in Croatia by improving entrepreneurial
skills, promoting entrepreneurship, facilitating access to finance and improving economic performance
and the business environment;
Strategic Plan of the Ministry of Economy, Entrepreneurship and Crafts for the 2019-2021 Period, is
based on the vision of shaping a more competitive market economy and creating a more favourable
entrepreneurial environment. The provisions of the Strategic Plan mandate implementation of an
analysis of the effects of tax legislation burden on small and medium enterprises, and adjustment of
1
Small and Medium Enterprises Report Croatia – 2019 - CEPOR
24legislation in line with EU recommendations on tax breaks and exemptions for small and medium
enterprises;
Strategy of Women Entrepreneurship Development in the Republic of Croatia 2014-2020, whose aim
is to achieve the coherence and interconnectedness of public policies, to improve systemic support for
women entrepreneurship through the entire institutional structure, and to promote women
entrepreneurship.
Cluster Development Strategy in the Republic of Croatia 2011-2020, whose aim is to improve the
management of Croatian cluster policy, strengthen clusters and cluster associations, to promote
innovation and transfer of new technologies, to conquer new markets and internationalisation of
clusters, and strengthen the knowledge and skills for cluster development;
Strategy for the Development of Social Entrepreneurship in the Republic of Croatia for the period
from 2015 to 2020, whose aim is to create a stimulating environment for the development of social
entrepreneurship in Croatia;
Strategy for Combating Poverty and Social Exclusion in the Republic of Croatia (2014-2020), in which
encouraging entrepreneurship and self-employment, and social entrepreneurship development are
stated as one of the main strategic activities. It is planned to achieve these strategic activities primarily
through stimulating education for the purpose of attaining the necessary competences for
employment and self-employment, stimulating entrepreneurial projects, social cooperatives
employing people with diminished working capacity and/or providing assistance to persons in
unfavourable personal, economic, social and other circumstances, and stimulating projects of women
entrepreneurship, youth entrepreneurship, the Roma and persons with disabilities;
Strategy for Innovation Encouragement of the Republic of Croatia 2014-2020, which aims to build an
efficient innovation system and improve the legal and fiscal framework, establish a means of
communication and models of cooperation between the public, scientific research and the business
sector in order to develop new products, services, business processes and technologies, and the
manner of applying the results of scientific research in the economy and society as a whole;
Regional Strategies 2014-2020: the four counties in the Pannon EGTC area have regional strategy
which aims to set development goals and priority axis in the County.
Current strategies that regulate and encourage the development of the small and medium enterprise
sector in Hungary are:
Program for a More Competitive Hungary (2019), which is a strategical document of the Government
of Hungary, whose aim is for the development of the Hungarian economy to exceed the average of the
European Union by 2 percentage points. The long-term relationship of enterprises based on mutual
trust with the public sector is of paramount importance. In transforming the corporate environment,
more emphasis should be placed on higher value-added production.
The National Reform Program (2020) addresses the issue caused by the coronavirus (COVID-19) The
Economic Protection Action Plan to avoid economic downturn is detailed and examine the results of
the last 10 years under the Europe 2020 Strategy.
Strategy for Strengthening Hungarian Micro, Small and Medium-sized Enterprises (2019-2030),
which aims are strengthening the value-creating capacity of a group of companies capable of growth
and providing a predictable framework for the entire SME sector to operate. The SME strategy has
seven pillars:
1. Creating a business-friendly regulatory and tax environment
2. Improving the business environment for SMEs and e-government tools
3. Strengthening the development capacity, innovation and digital performance of SMEs
4. Encouraging SMEs to access finance
5. Promoting the internationalization of SMEs
6. Acquire the necessary knowledge
7. Generational change
The fifth pillar is Promoting the internationalization of SMEs, under which
25- the SMEs with growth potential will find a foreign and domestic involvement in the
international division of labor opportunities and thereby achieve the growth goals;
- the SMEs account for the volume of their sales revenue from domestic sales keeping them
expanding their markets internationally, achieving their sales revenue a quarter from export
sales;
- expanding the range of exporting micro, small and medium-sized enterprises; a quarter from
export sales;
National Framework Strategy for Sustainable Development (2012-2024) which the overall aim is to
ensure the conditions for adaptability to the constantly changing socio-human-economic-natural
external environment, to improve the quality of the cultural adaptation necessary for it.
National Smart Specialisation Strategy (S3) - 2014-2020, which is a type of monitoring instrument for
counties and the RDI policy which enables them to support research, development and innovation
processes and the principle of regionality more effectively: it is a practical means for making strong
areas in a given region or county more visible for RDI stakeholders. The methodology of the S3 lays
great emphasis on the continuous assessment and analysis of and the provision of feedback to regional
implementation and economic and social changes with the involvement of a wide range of
stakeholders. Based on the S3 triple subdivision adopted in 2014 the following main specialisation
directions are identified:
- National Specialisation and Types of Regions: 3 national specialisations and 3 types of regions
- National (Sectoral) Priorities: 6 sectoral priorities and 2 horizontal priorities
- Smart technologies: 13 smart technologies
Regional Strategies 2014-2020: the four counties in the Pannon EGTC area have regional strategy
which aims to set development goals and priority axis of the County.
Current programmes that regulate and encourage the development of the small and medium
enterprise sector in Croatia are:
Rural Development Programme of the Republic of Croatia for the Period 2014-2020, which foresees
supports for entrepreneurship and the creation of new jobs in rural areas as measures that can
influence the retention of the young and active rural population and in the long term achieve the return
of those who have left rural areas;
Action Plan for Administrative Relief of the Economy for 2019, with which it is planned to reduce
administrative burden on the economy by 15.57%, by implementing 314 new measures aimed at
reducing the tax burden;
National Reform Programme 2019, foresees measures of particular importance for the
implementation of structural reforms aimed at achieving economic growth and the necessary
demographic renewal in Croatia. The measures that will affect the small and medium enterprise sector
the most relate to creating a predictable business environment, creating favourable conditions for
stimulating investment in Croatia and ensuring the sustainability of public finances.
Operational Programme Competitiveness and Cohesion 2014-2020 is the fundamental programmatic
document implementing for implementing the cohesion policy of the European Union. The purpose of
this programmatic document is to stimulate economic growth and create jobs through encouraging
investment in infrastructure projects (in the areas of transport, energy, environmental protection, ICT)
and providing support to the development of entrepreneurship and research activities.
National, regional and EU funds for the SME internationalization
Current programmes that regulate and encourage the development of the small and medium
enterprise sector in Hungary are:
Economic Development and Innovation Operational Programme (EDIOP) (source: ERDF, ESF, IKF; a
total of 8,813 M EUR over 7 years) The Operational Programme provides access to the instruments of
26You can also read