Paradigm changes in freshwater aquaculture practices in China: Moving towards achieving environmental integrity and sustainability
←
→
Page content transcription
If your browser does not render page correctly, please read the page content below
Ambio
DOI 10.1007/s13280-017-0985-8

 REVIEW

Paradigm changes in freshwater aquaculture practices in China:
Moving towards achieving environmental integrity and sustainability
Qidong Wang, Zhongjie Li, Jian-Fang Gui, Jiashou Liu,
Shaowen Ye, Jing Yuan, Sena S. De Silva

Received: 23 March 2017 / Revised: 17 August 2017 / Accepted: 12 October 2017

Abstract Contribution of fisheries and aquaculture to                systems including those on fisheries and aquaculture
global food security is linked to increased fish                     (Cochrane et al. 2009; De Silva and Soto 2009; Leung and
consumption. Projections indicate that an additional                 Bates 2013; Bell et al. 2016).
30–40 million tonnes of fish will be required by 2030.                  It is only in the recent past that the contributions of
China leads global aquaculture production accounting for             fisheries and aquaculture to global food security have come
60% in volume and 45% in value. Many changes in the                  to focus (Kawarazuka and Běně 2010; Belton and Thilsted
Chinese aquaculture sector are occurring to strive towards           2014; Youn et al. 2014; Běně et al. 2015, 2016; De Silva
attaining environmental integrity and prudent use of                 2016). This realisation is also linked to the fact that fish
resources. We focus on changes introduced in freshwater              consumption has increased very significantly over the
aquaculture developments in China, the main source of food           years. The World Bank (2013) estimated that globally the
fish supplies. We bring forth evidence in support of the             fish consumption per person would increase from 16.8 kg
contention that Chinese freshwater aquaculture sector has            in 2006 to 18.2 kg in 2030. In China, however, the fish
introduced major paradigm changes such as prohibition of             consumption per person would increase from 26.6 to
fertilisation in large water bodies, introduction of stringent       41.0 kg from 2006 to 2030. It is also important to note that
standards on nutrients in effluent and encouragement of              fish accounted for approximately 30% of the animal protein
practices that strip nutrients among others, which will              requirement for wellbeing, particularly in developing
facilitate long-term sustainability of the sector.                   countries (FAO 2014).
                                                                        It is estimated that even at the current rate of fish
Keywords Chemical usage  Farming systems                           consumption the world will require an additional 30–40
Food production  High-valued species                               million tonnes by 2030 to account for the expected pop-
Indigenous species  Paradigm changes                                ulation increase. The global food fish supplies, until
                                                                     recently, were predominantly of a hunted origin based on
                                                                     wild (marine) capture fisheries, and only in the last decade
INTRODUCTION                                                         has its predominance come to be based on a farmed
                                                                     supply, like our other staples (De Silva 2012). The situ-
In the wake of the projected population increase to nine             ation is further exacerbated as the traditional fish supplies
billion by year 2050, one of the major concerns confronting          from the marine capture fisheries, at best, have plateaued
the global community is in regard to providing the required          at around 100 million tonnes, as many of the traditionally
food needs. When the challenges of feeding nine billion              fished stocks have reached a dire state (Froese et al.
people are considered, the most commonly raised issues are           2012). Only 75% of this tonnage is available for direct
competition for land, water and energy, as well as main-             human consumption; however, the rest being reduced into
taining environmental integrity (Godfray et al. 2010;                fish meal and fish oil.
Hanjra and Qureshi 2010). The general consensus is that                 Aquaculture has continued to provide the additional
these issues are likely to be further exacerbated by                 food fish needs since the plateauing of the supplies from
impending climate change impacts on food production                  capture fisheries (Subasinghe et al. 2009, 2012). Over the

                                              Royal Swedish Academy of Sciences 2017
                                                         www.kva.se/en                                                 123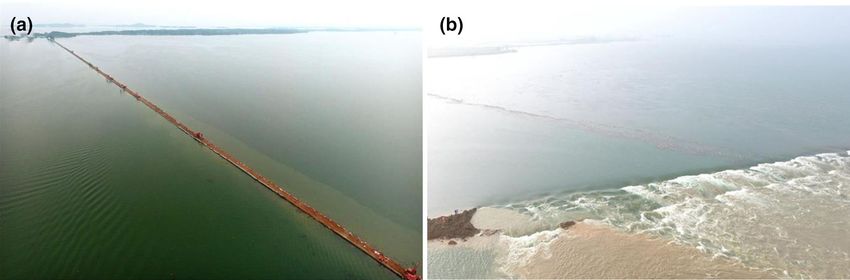
Ambio
180000 Global production Global value 75
Chinese production Chinese value
160000
% Chinese production to global production % Chinese value to global value 70
140000 65
h1000 t/ million USD)
120000 60
100000 55
Percent
Production/ Value (h
80000 50
60000 45
40000 40
20000 35
0 30
1985
1986
1987
1988
1989
1990
1991
1992
1993
1994
1995
1996
1997
1998
1999
2000
2001
2002
2003
2004
2005
2006
2007
2008
2009
2010
2011
2012
2013
Fig. 1 Trends in global and Chinese aquaculture production (in 9 1000 t) and the corresponding value of produce (in 9 million US $), and the
percent contribution from China to global production and value (based on FAO FishStatJ 2016)
last three decades the sector grew at a steady rate of acknowledged widely (Ahmed and Lorica 2002; World
approximately 6% per year, with the main bulk of the Fish Centre 2011; Subasinghe et al. 2012; Tacon and
global production being in China, accounting for around Metian 2013; Samples 2014; Troell et al. 2014; Běně et al.
60% in volume and 45% in value (Fig. 1). 2016). However, if aquaculture were to continue its sig-
In the recent past the long-term sustainability of the nificant contribution to global food security it is imperative
aquaculture sector has been questioned based primarily on that the sector in China, which contributes approximately
the grounds that feeds for aquatic animals utilise a dis- 60% in volume and 45% in value (Fig. 1) to the sector
proportionate proportion of global fish meal production, globally, be sustained.The aquaculture sector in China has
which in turn depends on the use of a resource that could be also been the subject of numerous critiques. As for the
utilised for feeding the needy, directly (Naylor et al. sector globally, such critiques have been on the negative
1998, 2000, 2001; Aldhous 2004). The other concerns and impacts of specific aquaculture practices (Chen 1989; Qin
critiques include the impacts of aquaculture on biodiversity et al. 2007, 2010; Xie and Yu 2007; Guo et al. 2009; Cai
and thereby on ecosystem integrity (Moyle and Leidy et al. 2013; Herbeck et al. 2013; Zeng et al. 2013; Zhou et al.
1992; Beardmore et al. 1997; Naylor et al. 2001), lack of 2016). Notably and more seriously, there also have been
social responsibility (Primavera 1997, 2005) and negative critiques on the negative impacts of Chinese aquaculture on
environmental impacts arising from individual case studies the global wild capture fisheries because of its supposedly
that are too extensive to enumerate here. excessive dependence on fish meal (Chiu et al. 2013; Cao
Notwithstanding all critiques on aquaculture it has to be et al. 2015). The latter contention has been refuted strongly;
conceded that it has become a very important food pro- has been provided evidence to demonstrate that the
duction sector, benefiting millions and contributing sig- dependence on fish meal in Chinese aquaculture has
nificantly to global food security, a contention that is decreased over the years with greater emphasis on the
Royal Swedish Academy of Sciences 2017
123 www.kva.se/enAmbio
Table 1 The average for 5-year periods of total and freshwater aquaculture production (t) and value (in 91000 USD) in China, and percent
contribution of freshwater (FW) aquaculture to total production and value (based on FAO FishStatJ 2016)
Production/value (%) 1986–1990 1991–1995 1996–2000 2001–2005 2006–2010 2011–2013
Production 6 764 977 14 332 305 24 825 054 33 790 371 43 306 443 53 743 080
Value 7 051 372 12 212 851 20 412 590 28 017 100 51 049 502 68 811 124
FW production 3 792 446 6 748 119 12 019 604 15 520 650 20 988 233 26 467 007
FW value 4 286 532 6 857 625 12 088 563 16 760 727 35 387 510 48 279 162
% FW production 56.1 47.4 48.6 45.9 48.4 49.3
% FW value 61.2 56.3 59.3 59.6 68.9 70.2
production of species feeding low in the trophic chain we have used the database on fishery statistics of the Food
combined with a rational use of fish meal in aquafeeds (Han and Agriculture Organisation of the United Nations (FAO
et al. 2016). It has been demonstrated that the overall 2016). We also used the China Fishery Yearbook (BFMA
trophic level of Chinese aquaculture was 2.25 in 2014 2004–2016) to access detailed information on the produc-
(Tang et al. 2016), and lower than that for aquaculture tion levels of individual species as well as areas devoted to
practices of developed countries or those of other devel- different culture practices. The China Seafood Imports and
oping countries (Tacon et al. 2010; Olsen 2011). Exports Statistical Yearbook (BFMA 2005–2015) was also
Beginning in the new millennium, China, following its used to extract data on volume and value exports to USA
very rapid economic development has started investing and EU from China. In addition, we used many other
heavily on protecting and restoring natural capital to databases of municipalities, provinces and the central
improve ecosystem services (Ouyang et al. 2016). We are government of China that have the purview to introduce
of the view that China has also started addressing issues decrees in relation to fish farming practices and environ-
with regard to environmental impacts, use of primary mental management and are in the public domain, and
resources and improving product quality and related other relevant published materials on aquaculture and
aspects leading to long-term sustainability of the aqua- fisheries.
culture sector; a major food production sector in the
country (Dong 2009, 2015; Wang et al. 2015; Han et al.
2016). These trends will enable it to maintain its contri- CHANGES IN THE FISHERIES SECTOR IN CHINA
bution to global aquaculture production and hence to food
security. Summary of trends of the sector
In the above context many paradigm changes have
occurred and are occurring in the sector, in particular in some China, the most populous nation in the world and with an
mariculture practices. In respect of molluscs and seaweed ever increasing middleclass (Kharaz and Gertz 2010) has
mariculture in China much progress has been made in the impacted the world in many ways. The country has become
sequestration of carbon that has resulted in high productive a global economic power and is ranked second in the
efficiency with low carbon emission that has helped alleviate world. The population and economic changes have also
coastal eutrophication (Dong 2011; Tang and Liu 2016). directly and or indirectly reflected in the fisheries sector.
Here, however, we address the paradigm changes in relation Figure 2 depicts the trends for the last three decades in the
to freshwater aquaculture in view of its relative importance six main components of the sector viz. capture fisheries
to the sector contributing predominantly to finfish and production, aquaculture production, export and import
crustacean culture, as opposed to molluscs and seaweed in volumes and values of fishery products. The most salient
mariculture (Wang et al. 2015; Table 1). In doing so, at the features emerging from these data (FAO 2016) can be
outset we will evaluate the major changes that have occurred summarised as follows:
in the Chinese freshwater aquaculture sector and then
• Capture fisheries production was superseded by aqua-
address issues on paradigm changes.
culture production in 1984, and the latter continued to
grow at the rate of 25.8% per year between 1990 and
2013
DATA SOURCES
• For the period between 1990 and 2013, the export
volume and value grew at an annual rate of 39.7 and
For purpose of our evaluation, especially to emphasise the
58.9% per year, respectively, and
importance of Chinese aquaculture in the global context,
Royal Swedish Academy of Sciences 2017
www.kva.se/en 123Ambio
60000 25000
Capture Aquaculture
Export volume Import volume
Export value Import value
50000
20000
h1000 t/ 106 USD)
40000
Exports/ Imports: Volume/ Value (h
Production (h1000 t)
15000
30000
10000
20000
5000
10000
0 0
1980
1981
1982
1983
1984
1985
1986
1987
1988
1989
1990
1991
1992
1993
1994
1995
1996
1997
1998
1999
2000
2001
2002
2003
2004
2005
2006
2007
2008
2009
2010
2011
2012
2013
Fig. 2 Trends in capture fisheries and aquaculture production in China together with import and export volumes and values of fishery products to
and from China (based on FAO FishStatJ 2016)
• For the same period, import volume and value grew by production was first alerted at the dawn of this millennium
43.2 and 151.2% per year, respectively. Of these fish (De Silva 2001), and now has been confirmed more
meal imports in 2013 accounted for 23.5% in volume recently (World Bank 2013). As such paradigm changes in
and 20% in value, and throughout was the main Chinese aquaculture are expected to reflect such trends,
imported commodity in volume (Han et al. 2016). which in the long-term facilitative sustainability.
Trends in the aquaculture sector of China
PARADIGM CHANGES
Much has been written about the aquaculture sector in
In this presentation we consider the paradigm changes
China, particularly in respect of its global dominance (FAO
relevant to the freshwater aquaculture sector in China to
2014), and relevant facets of it highlighted in different
fall under a number of facets which we consider as direct
narratives (De Silva 2001; Subasinghe et al. 2012; Wang
and indirect evidences in support of our contention.
et al. 2015), and we do not intend to dwell into the details
here. However and importantly, one of the major changes
Direct evidence
being witnessed is the gradual yearly decrease in percent
change per year of production volume (total and freshwater
The following are a summary of paradigm changes that
aquaculture) but not in the value of the produce as indi-
have occurred in the last decades or so in respect of
cated from the detailed fisheries data (FAO 2016). This
freshwater aquaculture in China that are believed to
decreasing comparable trend in global aquaculture
Royal Swedish Academy of Sciences 2017
123 www.kva.se/enAmbio
Table 2 A summary of municipal, provincial and national decrees issued since year 2000 with a view to combating negative environmental
influences that could arise from existing aquaculture practices; the relevant web link is given for each decree
Decree Scope Authority
Regulations for Lake protectiona Ban on the use of fertiliser for fish culture Wuhan City, 2002
b
Regulations for Lake protection Prohibition on modification of water bodies (e.g. Isolation of bays, side Jiangsu Province, 2005
arms with bunds/fences/netting)
Regulations on the Administration of the Prohibition on modification of water bodies (e.g. Isolation of bays, side The State Council of P.R.
Taihu River Basinc arms with bunds/fences/netting) China, 2011
Advocate environmental friendly aquaculture practices; reduce
pollution
Regulations for Lake protectiond Ban on the use of fertiliser for fish culture; Hubei province, 2012
Prohibition on modification of water bodies (e.g. Isolation of bays, side
arms with bunds/fences/netting)
Regulations for Lake protectione Ban on the use of fertiliser/feed for fish culture; Shandong Province, 2012
Prohibition on modification of water bodies (e.g. Isolation of bays, side
arms with bunds/fences/netting)
Regulations for water pollution controlf Ban on the use of fertiliser for fish culture; Hubei province, 2014
Prohibition on modification of water bodies (e.g. Isolation of bays, side
arms with bunds/fences/netting)
Water pollution control action plang Delimit given areas banning aquaculture in Lake and/or river The State Council of P.R.
China, 2015
a
http://baike.baidu.com/link?url=PRHvGPNc5QsYEwdf6abTtgSm8UZLMxIORPArv0gJ4gOo6WfaBil-vfn3iOh-
YzPnRbbE6MyNWRVrrGRMZ-pYfq (accessed 1 February 2017)
b
http://baike.baidu.com/view/8142489.htm (accessed 1 February 2017)
c
http://baike.baidu.com/link?url=cuUp86ueHESePjwRCQTU4MYk5Lb59S_VsVIdyrWkaeuiaP8YE1OTLzwax-
e60MMZcpgWqbYNc9q2FIjIP7FrXa (accessed 1 February 2017)
d
http://baike.baidu.com/view/9393733.htm (accessed 1 February 2017)
e
http://baike.baidu.com/view/9725408.htm (accessed 1 February 2017)
f
http://baike.baidu.com/view/13651454.htm (accessed 1 February 2017)
g
http://www.gov.cn/zhengce/content/2015-04/16/content_9613.htm (accessed 1 February 2017)
contribute to attaining sustainability and environmental nobilis) in particular. Often large water bodies were divided
integrity in the long term. into sections using netting and dykes, and leased to local
fisheries organisations (or fisheries bureaus) for promoting
• Decreased intensification of culture practices in large
fish culture practices. In this manner an average production
water bodies
of nearly 1800 kg ha-1 year-1 has been obtained through
• Rationalisation of farming systems
such culture-based fishery practices, a form of stock and
• Increasing emphasis on culture of species in conjunc-
capture in China (De Silva 2003; Wang et al. 2015).
tion with macrophytes and aquaponics
However, enhancement practices such as fertilisation
• Emphasis on the culture of indigenous species and
and modification of water bodies have resulted in
reduced dependence on alien species, and
eutrophication, unusual blooms of cyanobacteria and
• Expansion of regulatory measures on fish farming
overall deterioration of water quality (Cai et al. 2012, 2013;
effluent discharge(s) and chemical usage
Zhou et al. 2016). Such occurrences in large lakes have
brought about much public concern and outcry (Qin et al.
Decreased intensification of culture practices in large 2010; Zeng et al. 2013). In the above context the Chinese
water bodies Government banned the use of fertilisers to enhance fish
culture in lakes and reservoirs (Table 2), and curtailed the
It has been the common practice to fertilise lakes and division of large water bodies into suitably sized pens (by
reservoirs in order to increase plankton production that netting and/or dam building) for purposes of aquaculture
consequently enabled higher rate of stocking of filter- (Fig. 3). The improvements that resulted from these
feeding Chinese major carps, silver carp (Hypoph- decrees were demonstrated by Lin et al. (2015) in their
thalmichthys molitrix) and bighead carp (Aristichthys study on water quality in Wuhu Lake, Yangtze River Basin
Royal Swedish Academy of Sciences 2017
www.kva.se/en 123Ambio
Fig. 3 a An example of Liangzi Lake was divided into two parts by a dike built in 1979, for one of the purposes of practicing aquaculture as two
manageable units (http://ah.people.com.cn/n2/2016/0714/c227142-28664399-5.html; accessed 1 February 2017); b two parts of the lake were
connected again by blowing up the dike in 2016 (http://mt.sohu.com/20160714/n459241897.shtml; accessed 1 February 2017)
(Table 3). Also there had been a significant reduction in the on rice as well as on fish production in that it reduces the
pen culture area (in the past these areas were highly fer- quantity of pesticides and fertilisers used for the rice and
tilised to facilitate plankton production for feed for bighead improves the growth rate of the fish, and reduces nitrogen
carp and silver carp) and consequently production (Fig. 4). and phosphorous in the effluent (Miao 2010; Lansing and
This is a good example of government intervention to Kremer 2011; Xie et al. 2011), and offers definitive eco-
improve environmental integrity at the expense of overall nomic advantages (Berg 2002; Ahmed et al. 2011).
fish production, a distinct paradigm change in freshwater However, in the past the main fish species used were the
aquaculture practices in China. Chinese major carps (Li 1988). Ma (2016) reviewed the
It should also be pointed out that the approach to recent changes that have occurred in the IRFA systems in
decrease the intensity of culture practices in large water China, in the context of changes of the socio-economic
bodies was also accompanied with corresponding changes milieu of the nation. In this analysis it was pointed out that
to the optimisation of fish community structure that com- the species used in rice–fish culture have changed from use
menced as far back as 1998 (Liu and Cai 1998). This of carps to high-valued species such as soft-shelled turtle
approach has been gradually evolving over the years with (Pelodiscus spp.), crayfish (Procambarus clarkii) and
the aim to develop ecological fisheries in lakes and reser- mitten crab (Eriocheir sinensis) (Li et al. 2007; Miao 2010;
voirs (Liu and Cai 1998; Wang et al. 2006; Jia et al. 2013; Yan et al. 2014; Wang et al. 2015; Zhang et al. 2016). In
Lin et al. 2015). The overall impact of this approach has addition, the IRFA practices have changed to provide
been recently reviewed by Liu et al. (2017a, b) that suitable areas such as trenches around the rice paddy-
emphasises primarily the improvements in water quality, growing area (Fig. 5a), thereby enabling increased pro-
biodiversity, fish quality and economic gains at the expense duction of the high-valued aquatic animals. Often macro-
of total production. phytes are planted in the trenches to encourage food
organism for mitten crab and crayfish. For example, the
Rationalisation of farming systems crayfish production and the area of the IRFA in Hubei
Province have increased significantly over the past 10 years
One of the most traditional and long-standing aquaculture (Fig. 6). All such changes not only contribute effectively to
practices in China had been the rice–fish culture systems improving environmental integrity of the farming sys-
(Li 1988; Liu and Cai 1998; Edwards 2004). This practice tem(s) but also ensure economic viability. Comparable
is reckoned to be centuries old, and are gradually being trends are also occurring in other countries that have
adopted by many Asian countries (Hu et al. 2015). Rice– adopted the IRFA as an economically viable and an eco-
fish culture, now referred to as Integrated Rice Field logically desirable food production activity (Berg 2002;
Aquaculture (IRFA) (Ma et al. 2016) and earlier also Ahmed et al. 2011; Hu et al. 2015).
referred to as Integrated Aquaculture–Agriculture (IAA), is Over the last two decades changes have been introduced
mooted as an effective means rationalising water usage into other traditional farming practices particularly in
whilst increasing food production (Ahmed et al. 2014). relation to pond aquaculture. For example, increasing
Rice–fish culture is purported to have synergistic impacts emphasis has been laid on methods on reducing the nutrient
Royal Swedish Academy of Sciences 2017
123 www.kva.se/enAmbio
Table 3 Changes in water quality parameters from the periods of fish culture practices (mean ± SE) using fertilisers (2006–2007) and after the
ban of use of fertilisers (2008–2011) in Wuhu Lake, Yangtze River Basin, China. All the parameters monitored the values in the post-ban period
were significantly improved (modified after Lin et al. 2015)
Parameter (unit) Pre-ban period Post-ban period p value
Transparency (cm) 65.8 (± 9) 111.2 (± 9.6) 0.002
TP (mg L-1) 0.077 (± 0.01) 0.045 (± 0.005) 0.038
TN (mg L-1) 1.14 (± 0.11) 0.84 (± 0.07) 0.004
Chlorophyll a (lg L-1) 21.45 (± 4.5) 11.58 (± 1.46) 0.025
650 320
Producon Area
300
600
Production (h1000 t)
280
h1000 ha)
550
260
Area (h
500
240
450
220
400 200
2003 2004 2005 2006 2007 2008 2009 2010 2011 2012 2013 2014 2015
Fig. 4 Trends in production (in 91000 t) and farming area (in 91000 ha) of pen culture practices in freshwater large water bodies in China from
2003 to 2015 (based on data from BFMA 2004–2016)
contents of aquaculture effluent such as through recircu- such as in the Taihu Lake (119520 3200 * 120360 1000 E and
lation into artificial wetlands and the like. These aspects 30550 4000 * 31320 5800 N), the third largest inland lake in
have been discussed in detail by Liu et al. (2017a, b), who China (Zhang et al. 2015; Zhou et al. 2016).
described the many methods that are been used currently With the imposed ban on the use of fertilisers (Table 2)
and the relative efficacies of each. to enhance production in culture-based fisheries (CBF) of
plankton feeding Chinese major carps, in particular silver
Increasing emphasis on culture of species in conjunction and big head carps, in Lakes and reservoirs, the affected
with macrophytes and aquaponics fisheries bureaus that managed these practices had to
introduce changes to maintain the economic viability.
In the past fish farming integrated with livestock such as These changes include the encouragement of adjacent
pigs, chicken and ducks were common practice in rural wetlands been used for shallow ponds suitable for mitten
China (Li 1987; Cheng et al. 1995). However, in the light crab culture with macrophytes for example in Taihu Lake
of potential health risks and increasing emphasis on pro- (Cai et al. 2012, 2013), Hongze Lake (Wang et al.
duct quality related to marketing prospects, integrated fish 2016a, b) and Honghu Lake (Feng et al. 2010), which is the
farming is being gradually phased out (Edwards 2008). third, fourth and seventh largest freshwater lakes in China,
Moreover, the effluent discharge from integrated fish and respectively. With such strategic changes the economic
livestock farming is thought to have been largely respon- viability and the employment security of the respective
sible for deterioration of water quality in some watersheds, bureau personnel are often assured, and the environmental
Royal Swedish Academy of Sciences 2017
www.kva.se/en 123Ambio
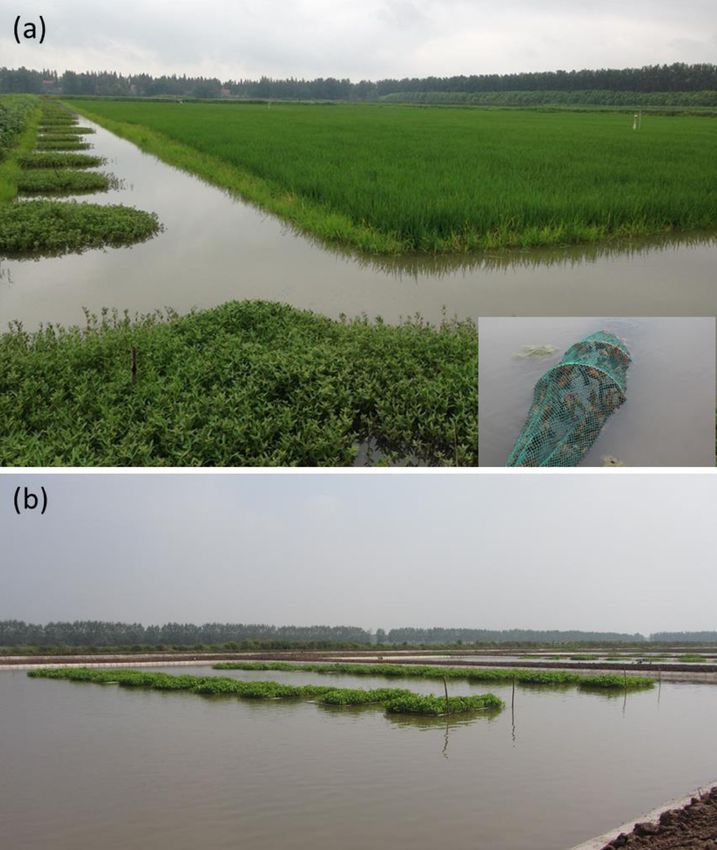
Fig. 5 a A typical rice–crayfish/rice–fish farming system outlay in Hubei Province, China; the outer trench maintained around 1 m is used for
crayfish/fish/mitten crab aquaculture, the inset shows haul of crayfish, and b a model of an aquaponics culture system; the plant beds consist of
water spinach and are used in conjunction with the culture of Chinese major carps in Gongan County, Hubei Province, China
integrity of large lake ecosystems is improved, and perhaps the fish and are encouraged by authorities (Chen et al.
over a period of time restored to original status (Feng et al. 2010; Vance 2015).
2010; Cai et al. 2013; Wang et al. 2016a, b).
There is also an increasing emphasis on the use of Emphasis on the culture of indigenous species and reduced
aquaponics in aquaculture practices, where beds of floating dependence on alien species
plants are introduced as a tool for stripping nutrients, which
also supplements the profitability (Table 4). It is also evi- Aquatic species have been translocated across watersheds
dent from Table 4 that the aquaponics model can be used and geo-political boundaries for varying purposes, includ-
irrespective of the fish species/species group cultured, and ing for aquaculture (Welcomme 1988; DIAS 2004).
is effective with both plankton feeding and carnivorous Aquaculture is often criticised for translocations that are
species. Use of aquaponics models (Fig. 5b) with different purported to have resulted in loss of biodiversity and
plants is becoming popular as it provides a significant thereby brought about ecosystem instability and hence
income from the harvest of the aquatic plants in addition to sustainability (Moyle and Leidy 1992; Naylor et al. 2001).
Royal Swedish Academy of Sciences 2017
123 www.kva.se/enAmbio
250 Area of Integrated Rice Field Aquaculture
500
Production of crayfish 450
200 400
Production (×1000 t)
350
Area (×1000 ha)
150 300
250
100 200
150
50 100
50
0 0
2006 2007 2008 2009 2010 2011 2012 2013 2014 2015
Fig. 6 Trends in the area of Integrated Rice Field Aquaculture and the production of crayfish in Hubei Province, the predominant province for
rice–crayfish co-culture in China (based on data from BFMA 2007–2016)
Table 4 A summary of different types of aquaponics systems used in conjunction with pond culture and indication of removal rates of selected
nutrients. WS, water spinach (Ipomoea aquatic, Convolvulaceae); Lettuce, (Lactuca sativa, Asteraceae); GC, Grass carp; CrC, crucian carp;
BHC, bighead carp; PL, Pond loach; LBB, Largemouth black bass; MF, mandarin fish; SC, Silver carp; CmC, Common carp
Aquaponics system species used Removal rate (%) Major province Authority
Plant Fish TN TP
WS GC, CrC, BHC 9.04–36.56 33.33–45.1 Jiangsu Chen et al. (2010)
WS Tilapia 6.82–47.2 43.01–85.59 Jiangsu Song et al. (2011)
WS PL 41.25–54.67 32.93–37.80 Zhejiang Zhang et al. (2012)
Lettuce LBB, MF, SC, BHC 8.12–36.20 33.33–46.15 Guizhou Guan et al. (2012)
WS CmC 54.7–56.9 91.4–92.6 Shandong Zhang et al. (2015)
However, such critiques have failed to provide explicit largemouth black bass (Micropterus salmoides), channel
evidence in regard to the negative interactions of exotics in catfish (Ictalurus punctatus) and freshwater crayfish (Liu
most instances (De Silva et al. 2004) and the fact that in and Li 2010; Lin et al. 2013). However, in the context of
some instances such negativity could be biased by cultural the drive towards sustainability and environmental integ-
attitudes (De Silva 2012). rity there is a trend to curtail fresh introductions for
China is purported to have a very rich and a diverse aquaculture purposes (Fig. 7a) in China, and the introduc-
finfish fauna (Kang et al. 2014; Xiong et al. 2015). Equally, tion of number of alien species has decreased markedly,
China is also reputed to have the largest number of alien since the upsurge in the 1980s, the period when there was a
finfish species, with the great bulk of it introduced through push to increase aquaculture production with little concern
the aquarium trade and or for aquaculture (Xiong et al. for environmental consequences (Xiong et al. 2015).
2015). Chinese aquaculture has been much impacted by Linked to the above strategy is an increasing realisation
alien species (Liu and Li 2010). The aquaculture produc- for risk management in respect of alien species (Lin et al.
tion of some alien species exceeded those in their native 2013), with a view to minimising potential negative
countries, such as the Nile tilapia (Oreochromis niloticus), impacts on biodiversity. These recent initiatives in Chinese
Royal Swedish Academy of Sciences 2017
www.kva.se/en 123Ambio
30 (a) 5000 (b) 120
Area Number
4500
25 100
4000
Number of species
20 3500
1000 ha)
80
3000
Number
15 2500 60
Area (
2000
10 40
1500
5 1000
20
500
0 0 0
1930s 1940s 1950s 1960s 19 70s 1980s 1990s 2000s 2010s 2006 2007 2008 2009 2010 2011 2012 2013 2014 2015 2016
Fig. 7 a Trend in number of non-native freshwater fish species introduced into China for aquaculture purposes (updated from Xiong et al. 2015),
and b trends in the total area (9 1000 ha) and the number of National Aquatic Genetic Resources Reserves (NAGRR) established in freshwater
lakes in China from 2006 to 2016
Table 5 Average values (in USD per t) for five high-valued and five low-valued cultured species over the period 2009–2013, cultured in China
(based on FAO FishStatJ 2016)
High-valued species USD t-1 Low-valued species USD t-1
Yellow catfish 1300 Common carp 1140
Paddy eel 2610 Crucian carp 1090
Mandarin fish 9310 Silver carp 1260
Mitten crab 6960 Bighead carp 1280
Soft-shell turtle 5190 Grass carp 1260
aquaculture, such as an increasing emphasis on indigenous (BFMA, 2004–2016; Wang et al. 2015). The emphasis on
species conforming to the general global trend to minimise the culture of relatively high-valued species tends to
and/or to curtail dependence on alien species, are major compensate for reduction in culture area of certain prac-
paradigm changes evident in aquaculture developments tices (see Fig. 4) and associated production volumes to
in the recent decades. We expect such trends to retain economic viability.
continue well into foreseeable future in Chinese aquacul- The curtailment of introduction of alien species for
ture developments. aquaculture in China, together with increasing emphasis on
Since the dawn of the new millennium, with increasing the culture of indigenous species, in particular high-valued
emphasis on environmental integrity and sustainable species, has gone hand in hand, with the trend of increasing
development globally, freshwater aquaculture in China has the number and the total area of National Aquatic Genetic
made a concerted effort to uplift culture practices on Resources Reserves in freshwater lakes in the country
selected, often high-valued, indigenous species. Accord- (Fig. 7b). Any form of aquaculture in the reserves is pro-
ingly, for example there has been a significant upsurge in hibited, but accessibility to germplasm for improving
the production of finfish species such as mandarin fish genetic diversity of cultured stocks is permitted. Such
(Siniperca chuatsi), yellow catfish (Pelteobagrus ful- paradigm changes in respect of Chinese aquaculture and
vidraco) and paddy eel (Monopterus albus), and other species conservation often go unnoticed by critiques of the
aquatic species such as the mitten crab and soft-shelled sector.
turtle, all relatively high-valued species (Table 5) over the
last decade or more. The production of paddy eel, mandarin Expansion of regulatory measures on fish farming effluent
fish, catfish, mitten crab, soft-shelled turtle have increased discharge(s) and chemical usage
from 125 336, 149 886, 54 819, 374 810, 143 816 tonnes in
2003 to 367 547, 298 057, 355 725, 823 259, and 341 588 In central Yangtze River basin, freshwater lakes have
tonnes in 2015, respectively, corresponding to 1.93, 0.99, undergone large-scale reclamation, especially from the
5.49, 1.2 and 1.38 times increase over the 12-year period 1950s to the late 1970s (Fang et al. 2005), resulting in
Royal Swedish Academy of Sciences 2017
123 www.kva.se/enAmbio
Table 6 A summary of maximum permissible limits of selected parameters in aquaculture effluents issued by the Ministry of Agriculture, P.
R. China (SC/T 9101-2007); for comparison levels issued by Global Aquaculture Alliance (GAA) and International Finance Corporation (IFC)
for the same parameters (Boyd and Gautier 2000)
Parameter Unit China, 2007 GAA, 2002 IFC, 1998
Discharge Initial Target Discharge
TSS mg L-1 B 50 B 100 B 50 B 50
DO mg L-1 – C4 C5 –
pH – 6.0–9.0 6.0–9.5 6.0–9.0 6.0–9.0
-1
CODMn mg L B 15 – – –
BOD5 mg L-1 B 10 B 50 B 30 B 50
Zn mg L-1 B 0.5 – – –
Cu mg L-1 B 0.1 – – –
TP mg L-1 B 0.5 B 0.5 B 0.3 –
-1
TN mg L B 3.0 – – –
Sulphide mg L-1 B 0.2 – – –
Total rest N mg L-1 B 0.1 – – –
substantial loss of lakes and wetland areas, and associated practices and application of chemicals that are purported to
ecological consequences such as eutrophication, decline in be environmentally harmful.
biodiversity and overall degradation of health of lakes (Jin In Table 6 the permitted discharge values of selected
et al. 2005; Zhao et al. 2005; Fang et al. 2006; Du et al. nutrients in Chinese aquaculture are compared with cor-
2011). Driven by economic interests, large amount of responding levels issued by the Global Aquaculture Alli-
reclaimed areas have been used for pond aquaculture. ance, a major body that audits aquaculture practices
Effluents from pond aquaculture typically are rich in worldwide and the International Finance Corporation
organic matter and nutrients such as nitrogen and phos- which provides financial support for aquaculture develop-
phorus and most of them originate from fertilisers and ment world over. It is evident that aquaculture authorities
feeds applied to increase production of the cultured species in China use many parameters and in some instances the
(Cai et al. 2012, 2013). There have been a few studies to former are much more stringent than those used by the
document the impacts on different types of water bodies other two agencies.
around the world in regard to the environmental impacts of Quantitative data on the use of chemicals in freshwater
aquafarm effluent on receiving waters and or relevant aquaculture practices in China are relatively difficult to
catchments (Xie et al. 2004; Bartoli et al. 2007; Thomas ascertain. It is noteworthy that the authorities in China are
et al. 2010; Herbeck et al. 2013; Molnar et al. 2013). expanding the list of prohibited chemicals in aquaculture
In the recent past rather unfortunate events occurred for (Table 7). These increased restrictions are relatively new
instance in Taihu Lake, the third largest freshwater lake in and also complements that endorses compliance with glo-
China, when unprecedented levels of blue–green algal bal certification standards (FAO 2011a) for aquaculture.
blooms occurred and impacted on the biota, the usability of However, an indirect index that could be deduced from the
the water for domestic purposes and the lake environment information available is the percent value of the chemicals
as a whole (Qin et al. 2007, 2010). These comparable used in aquaculture in relation to the value of freshwater
events in waters elsewhere in China prompted the gov- aquaculture production (Fig. 8). It is evident from Fig. 8
ernment to introduce stringent environmental guidelines that there is declining trend from 2007 onwards indicative
over last decade, particularly with regard to the use of of the reducing usage of chemicals in Chinese freshwater
chemicals in freshwater aquaculture. The major paradigm aquaculture.
changes that have been introduced in order to minimise the
impacts of aquaculture effluents on watersheds included for Indirect evidences
example the curtailment on the use of fertilisers to improve
plankton production associated with culture-based fisheries The primary and major line of indirect evidence comes
and, reduction in the areas devoted to pen culture that was from an evaluation of exports of cultured products to
dealt with earlier. Such paradigm changes went hand in developed countries, in a climate where the importing-de-
hand with the introduction of more stringent regulations on veloped countries impose increasingly stringent quality
the discharge levels of selected nutrients from aquaculture control standards and protocols. Seafood is among the most
Royal Swedish Academy of Sciences 2017
www.kva.se/en 123Ambio
Table 7 List of chemicals banned to be used in aquaculture practices in Circular No. 193 as issued by the Ministry of Agriculture, P.R. China,
2002, and list of chemicals that are prohibited for use in aquaculture practices in Professional Standard: NY5071-2002 as issued by the Ministry
of Agriculture, P.R. China, 2002
Circular of the Ministry of Agriculture, P.R. China (No. 193): Professional standard of P.R. China (NY5071-2002): Guideline of
Circular on issuing the detailed list of banning to use veterinary fisheries chemical usage in producing non-pollution food
medicine and other chemical compound on animal food commodity
Clenbuterol; Salbutamol; Cimaterol; Diethylstilbestrol; Zeranol; Fonofos; BHC (HCH); Benzene; Hexachloride; Lindane;
Trenbolone; Mengestrol acetate; Chloramphenicol; Gammaxare; Gamma-BHC Gamma-HCH; Camphechlor (ISO);
Chloramphenicol succinate; Dapsone; Furazolidone; Furaltadone; DDT; Calomel; Mercurous nitrate; Mercuric acetate; Carbofuran;
Nifurstyrenate sodium; Sodium nitrophenolate; Nitrovin; Chlordimeform; Anitraz; Cyfluthrin; Flucythrinate; PCP–Na;
Methaqualone; Lindane; Camahechlor; Carbofuran; Malachite green; Tryparsamide; Antimonyl potassium tartrate;
Chlordimeform; Amitraz; Antimony potassium tartrate; Sulfathiazolum ST; Norsultazo; Sulfaguanidine; Furacillinum;
Tryparsamide; Malachite green; Pentachlorophenol sodium; Nitrofurazone; Furazolidonum; Nifulidone; Furanace;
Calomel; Mercurous nitrate; Mercurous acetate; Pyridyl Nifurpirinol; Chloramphennicol; Erythromycin; Zinc bacitracin
mercurous acetate; Methyltestosterone; Testosterone; Propionate; premin; Tylosin; Ciprofloxacin (CIPRO); Avoparcin; Olaquindox;
Nandrolone; Phenylpropionate; Estradiol; Benzoate; Fenbendazole; Diethylstilbestrol; Stilbestrol; Methyltestosterone;
Chlorpromazine; Diazepam; Metronidazole; Dimetronidazole Metandren
60 40
3.5 Volume exports to USA
Volume exports to EU
Value exports to USA 35
55 Value exports to EU
3.0
100 million USD)
30
10000 t)
25
2.5 50
Ratio (‰)
20
Volume (
2.0 45
15
Value (
10
1.5
40
5
1.0
2003 2004 2005 2006 2007 2008 2009 2010 2011 2012 2013 2014 2015 35 0
2005 2006 2007 2008 2009 2010 2011 2012 2013 2014 2015
Fig. 8 Trend in the ratio of the value of chemical used in freshwater
aquaculture to the value of freshwater aquaculture in China from 2003 Fig. 9 Trends in the total volume exports to USA and EU, and the
to 2015 (based on data from BFMA 2004–2016) corresponding values in US Dollar from 2005 to 2015 (BFMA
2005–2015)
traded commodities globally and in 2010, 38% of all fish 2011a). In this context the changes in the volume and value
produced were exported (FAO 2014). World trade in fish of exports to two of the most stringent global markets viz.
and fish products increased from US$ 8 billion in 1976 to $ US and the European Union are shown in Fig. 9. Such
128 billion in 2012 (World Bank 2013). Developing sustained increase in export volume is indirect evidence
countries are at the forefront of the global seafood trade that aquaculture practices in China are in compliance with
with more than 54% of fishery exports by value and 60% global standards.
by live weight equivalent. As evident in Fig. 2 China
continues to be a dominant player in both import and
export trade of seafood. CONCLUSIONS
The trends in the export volume and value of selected,
high-valued, cultured commodities were shown previously. Fish have been an important component of our diet
It should be noted that in view of the increasing per capita throughout our evolutionary history, and is even thought to
food fish consumption in China the country is also have contributed to the development of the human brain,
becoming a major importer of fish (FAO 2014). At present thereby making us what we are (Crawford et al. 1999;
export markets could be sustained only if the production Cunnnane and Stewart 2010). In the modern era fish con-
processes and the product quality conform to international sumption has shown a significant increase, both in the
standards, such as HACCP, and are traceable and are in developing world and the developed world, perhaps driven
compliance with global certification guidelines (FAO by different entities; in the developing world fish may
Royal Swedish Academy of Sciences 2017
123 www.kva.se/enAmbio
provide a more affordable and readily available food item, Asia. Food Policy 27: 125–141. https://doi.org/10.1016/S0306-
particularly for rural populations, whilst in the developed 9192(02)00007-6.
Ahmed, N., K.K. Zander, and S.T. Garnett. 2011. Socio-economic
world it may be driven by the perceived health benefits fish aspects of rice-fish farming in Bangladesh: Opportunities,
are known to offer (Sastry 1985; Calder 2004; Siriward- challenges and production efficiency. The Australian Journal
hana et al. 2012). Fish is known to account for nearly 30% of Agricultural and Resource Economics 55: 199–219. https://
of animal protein intake, being significantly higher among doi.org/10.1111/j.1467-8489.2011.00535.x.
Ahmed, N., J.D. Ward, and C.P. Saint. 2014. Can integrated
rural communities in developing countries (FAO 2011b). aquaculture-agriculture (IAA) produce ‘‘more crop per drop’’.
Until just over a decade ago, the predominant fish sup- Food Science 6: 767–779. https://doi.org/10.1007/s12571-014-
ply was hunted—i.e. was from the capture fisheries, and its 0394-9.
predominance shifted to a farmed origin, like our other Aldhous, P. 2004. Fish farms still ravage the sea. Sustainable
aquaculture takes one step forward, two steps back. Nature
staple only a decade and half back (De Silva 2012). Online. https://doi.org/10.1038/news040216-10.
In the wake of plateauing of the fish supplies from the Bartoli, M., D. Nizzoli, D. Longhi, A. Laini, and P. Viaroli. 2007.
marine capture fisheries, the widening gap between Impact of a trout farm on the water quality of an Apennine creek
demand and supply was mainly met with aquaculture, from daily budgets of nutrients. Chemistry and Ecology 23:
1–11. https://doi.org/10.1080/02757540601084003.
which in the last three decades or more registered a mean Beardmore, J.A., G.C. Mair, and R.I. Lewis. 1997. Biodiversity in
annual rate of growth of nearly 6%, the highest for any aquatic systems in relation to aquaculture. Aquaculture Research
primary production sector globally (Subasinghe et al. 28: 829–839. https://doi.org/10.1046/j.1365-2109.1997.00947.x.
2012). This sustained growth in the sector over these Bell, J., W. Cheung, S.S. De Silva, M.A. Gasalla, S. Frusher, A.
J. Hobday, V. Lam, P. Lehodey, et al. 2016. Impacts and effects
decades was dominated by China, which currently account of ocean warming on the contributions of fisheries and aquacul-
for nearly 70% of global aquaculture production. However, ture to food security. In Explaining ocean warming: Causes,
aquaculture being a newly emerged sector, referred to by scale, effects and consequences, ed. D. Laffoley and J.M. Baxter,
some as ‘‘the new kid on the blocks’’ was subjected to a 409–437. Gland: International Union for Conservation of Nature
and Natural Resources (IUCN). https://doi.org/10.2305/IUCN.
higher degree of scrutiny by the public and was subjected CH.2016.08.en.
to major critiques on environmental and resource usage Belton, B., and S.H. Thilsted. 2014. Fisheries in transition: Food and
grounds (De Silva and Davy 2010). So was the aquaculture nutrition security implications for the global South. Global Food
sector in China. Security 3: 59–66. https://doi.org/10.1016/j.gfs.2013.10.001.
Běně, C., M. Barange, R. Subasinghe, P. Pinstrup-Andersen, G.
As such we encounter the dilemma of meeting a food Merino, G.I. Hemre, and M. Williams. 2015. Feeding 9 billion
need and ensuring food security and maintaining environ- by 2050-putting fish back on the menu. Food Security 7:
mental integrity and strive towards long-term sustainability 261–274. https://doi.org/10.1007/s12571-015-0427-z.
of the sector. It is in the latter regard that the aquaculture Běně, C., R. Arthur, H. Norbury, E.H. Allisonc, M. Beveridged, S.
Bushe, L. Camplingf, W. Leschen, et al. 2016. Contribution of
sector in China, the mainstay of global aquaculture, has fisheries and aquaculture to food security and poverty reduction:
endeavoured to make significant paradigm changes in the assessing current evidence. World Development 79: 177–196.
practices thereof with a view attaining long-term sustain- https://doi.org/10.1016/j.worlddev.2015.11.007.
ability. In this paper we have attempted to highlight these Berg, H. 2002. Rice monoculture and integrated rice-fish farming in
the Mekong Delta, Vietnam-economic and ecological consider-
significant paradigm changes, driven by governmental ations. Ecological Economics 41: 95–107. https://doi.org/10.
regulations as well as market forces, but which often go 1016/S0921-8009(02)00027-7.
unnoticed by critiques of the sector. Boyd, C.E., and D. Gautier. 2000. Effluent composition and water
quality standards. Global Aquaculture Advocate 3: 61–66.
Acknowledgements This work was financially supported by the BFMA (Bureau of Fisheries, Ministry of Agriculture, People’s
Science and Technology Service Network Initiative, Chinese Acad- Republic of China). 2005-2015. China Seafood Imports and
emy of Sciences (CAS) (No. KFJ-SW-STS-145), State Special Fund Exports Statistical Yearbook (2005-2015). China Society of
for Agro-scientific Research in the Public Interest Project (No. Fisheries, Beijing.
201303056) and the State Key Laboratory of Freshwater Ecology and BFMA (Bureau of Fisheries, Ministry of Agriculture, People’s
Biotechnology, China (No. 2016FBZ10). All of us are grateful to Dr Republic of China). 2004-2016. China Fishery Statistical
Wen Xiong who willingly and unreservedly provided us information Yearbook (2004-2016). China Agriculture Press, Beijing.
on non-native species used in freshwater aquaculture. The contribu- Cai, C., X. Gu, H. Huang, X. Dai, Y. Ye, and C. Shi. 2012. Water
tion of one of us (S.S. De Silva) was made when on a Visiting quality, nutrient budget, and pollutant loads in Chinese mitten
Professorship under the auspices of the CAS, tenable at the Institute crab (Eriocheir sinensis) farms around East Taihu Lake. Chinese
of Hydrobiology, Wuhan. This support from the CAS is gratefully Journal of Oceanology and Limnology 30: 29–36. https://doi.
acknowledged. org/10.1007/s00343-012-1034-x.
Cai, C., X. Gu, Y. Ye, C. Yang, X. Dai, D. Chen, and C. Yang. 2013.
Assessment of pollutant loads discharged from aquaculture
ponds around Taihu Lake, China. Aquaculture Research 44:
REFERENCES 795–806. https://doi.org/10.1111/j.1365-2109.2011.03088.x.
Calder, P.C. 2004. Long-chain n-3 fatty acids and cardiovascular
Ahmed, M., and M.H. Lorica. 2002. Improving developing country disease: further evidence and insights. Nutrition Research 24:
food security through aquaculture development-lessons from 761–772. https://doi.org/10.1016/j.nutres.2004.04.008.
Royal Swedish Academy of Sciences 2017
www.kva.se/en 123Ambio
Cao, L., R. Naylor, P. Henriksson, D. Leadbitter, M. Metian, M. Dong, S. 2015. On ecological intensification of aquaculture systems
Troell, and W. Zhang. 2015. China’s aquaculture and the world’s in China. Chinese Fisheries Economics 33: 4–9 (In Chinese with
wild fisheries. Science 347: 133–135. https://doi.org/10.1126/ English abstract).
science.1260149. Du, Y., H. Xue, S. Wu, F. Ling, F. Xiao, and X. Wei. 2011. Lake area
Chen, H.D. 1989. Impact of aquaculture on the ecosystem of Donghu changes in the middle Yangtze region of China over the 20th
Lake, Wuhan. Acta Hydrobiologia Sinica 13: 359–368. (In century. Journal of Environmental Management 92: 1248–1255.
Chinese with English abstract). https://doi.org/10.1016/j.jenvman.2010.12.007.
Chen, J., S. Meng, G. Hu, J. Qu, and L. Fan. 2010. Effect of Ipomoea Edwards, P. 2004. Traditional Chinese aquaculture and its impact
aquatica cultivation on artificial floating rafts on water quality of outside China. World Aquaculture 35: 24–27.
intensive aquaculture ponds. Journal of Ecology and Rural Edwards, P. 2008. The changing face of pond aquaculture in China.
Environment 26: 155–159 (In Chinese with English abstract). Global Aquaculture Advocate, 77–80.
Cheng, H., B. Hu, and A.T. Charles. 1995. Chinese integrated Fang, J., S. Rao, and S. Zhao. 2005. Human-induced long-term
farming: a comparative bioeconomic analysis. Aquaculture changes in the lakes of the Jianghan Plain, Central Yangtze.
Research 26: 81–94. https://doi.org/10.1111/j.1365-2109.1995. Frontiers in Ecology and the Environment 3: 186–192. https://
tb00887.x. doi.org/10.2307/3868462.
Chiu, A., L. Li, S. Guo, J. Bai, C. Fedor, and R.L. Naylor. 2013. Feed Fang, J., Z. Wang, S. Zhao, Y. Li, Z. Tang, D. Yu, L. Ni, H. Liu, et al.
and fishmeal use in the production of carp and tilapia in China. 2006. Biodiversity changes in the lakes of the Central Yangtze.
Aquaculture 414: 127–134. https://doi.org/10.1016/j. Frontiers in Ecology and the Environment 4: 369–377. https://
aquaculture.2013.07.049. doi.org/10.1890/1540-9295(2006)004[0369:BCITLO]2.0.CO;2.
Cochrane, K., C. De Young, D. Soto, and T. Bahri. 2009. Climate FAO. 2011a. Technical guidelines on aquaculture certification.
change implications for fisheries and aquaculture: overview of Rome, Italy: FAO.
current scientific knowledge. FAO, Fisheries and Aquaculture FAO. 2011b. World Aquaculture 2010. FAO, Fisheries and Aqua-
Technical Paper No. 530, Rome, Italy. culture Technical Paper No. 500/1, Rome, Italy.
Crawford, M.A., M. Bloom, C.L. Broadhurst, and W.F. Schmidt. FAO. 2014. State of the world fisheries and aquaculture 2014. Rome,
1999. Evidence for the unique function of DHA during the Italy: FAO.
evolution of the modern hominid brain. Lipids 34: S39–S47. FAO. 2016. FishStatJ. FAO, Rome, Italy. http://www.fao.org/fishery/
https://doi.org/10.1007/BF02562227. statistics/software/fishstatj/en (accessed 1 January 2017).
Cunnnane, S.C., and K.M. Stewart. 2010. Human brain evolution: Feng, T., J. Liu, T. Zhang, S. Ye, and Z. Li. 2010. Study on pond
The influence of freshwater and marine food resources. Hobo- culture technology of Chinese mitten crab (Eriocheir sinensis) in
ken: Wiley-Blackwell. lake reclaimed paddy of Honghu Lake. Freshwater Fisheries 40:
De Silva, S.S. 2001. A global perspective of aquaculture in the new 66–71 (In Chinese with English abstract).
millennium. In Aquaculture in the third millennium (technical Froese, R., D. Zellert, K. Kleisner, and D. Pauly. 2012. What catch data
proceedings of the conference on aquaculture in the third can tell us about the status of global fisheries? Marine Biology
millennium, Bangkok, 20–25 February, 2000), ed. R.P. Subas- 159: 1283–1292. https://doi.org/10.1007/s00227-012-1909-6.
inghe, P. Bueno, M.J. Phillips, C. Hough, S.E. McGladdery and Godfray, H.C.J., J.R. Beddington, I.R. Crute, L. Haddad, D.
J.R. Arthur, 431–459. Bangkok: NACA. Lawrence, J.F. Muir, J. Pretty, S. Robinson, et al. 2010. Food
De Silva, S.S. 2003. Culture-based fisheries: an underutilized security: The challenge of feeding 9 billion people. Science 327:
opportunity in aquaculture. Aquaculture 221: 221–243. https:// 812–818. https://doi.org/10.1126/science.1185383.
doi.org/10.1016/S0044-8486(02)00657-9. Guan, M., L. Zhu, L. Zhou, X. Jiang, X. Shen, and B. Han. 2012. The
De Silva, S.S., R.P. Subasinghe, D.M. Bartley, and A. Lowther. 2004. purification effect of aquaponics on water quality in aquaculture
Tilapias as alien aquatics in Asia and the Pacific: a review. FAO, ponds. Journal of Anhui Agriculture Sciences 40: 8088–8189 (In
Fisheries Technical Paper 453, Rome, Italy. Chinese with English abstract).
De Silva, S.S., and D. Soto. 2009. Climate change and aquaculture: Guo, L., Z. Li, P. Xie, and L. Ni. 2009. Assessment effects of cage
potential impacts, adaptation and mitigation. FAO, Fisheries culture on nitrogen and phosphorus dynamics in relation to
Technical Paper No. 530, Rome, Italy. fallowing in a shallow lake in China. Aquaculture International
De Silva, S.S., and F.B. Davy. 2010. Aquaculture successes in Asia, 17: 229–241. https://doi.org/10.1007/s10499-008-9195-5.
contributing to sustained development and poverty alleviation. In Han, D., X. Shan, W. Zhang, Y. Chen, Q. Wang, Z. Li, G. Zhang, P.
Success stories in asian aquaculture, ed. S.S. De Silva and F.B. Xu, et al. 2016. A revisit to fishmeal usage and associated
Davy, 8–21. Dordrecht: Springer. https://doi.org/10.1007/978- consequences in Chinese aquaculture. Reviews in Aquaculture.
90-481-3087-0_1. https://doi.org/10.1111/raq.12183.
De Silva, S.S. 2012. Aquaculture—a newly emergent food production Hanjra, M.A., and M.E. Qureshi. 2010. Global water crisis and future
sector- and perspectives of its impacts on biodiversity and food security in an era of climate change. Food Policy 35:
conservation. Biodiversity and Conservation 21: 3187–3220. 365–377. https://doi.org/10.1016/j.foodpol.2010.05.006.
https://doi.org/10.1007/s10531-012-0360-9. Herbeck, L.S., D. Unger, Y. Wu, and T.C. Jennerjahn. 2013. Effluent,
De Silva, S.S. 2016. Culture based fisheries in Asia are a strategy to nutrient and organic matter export from shrimp and fish ponds
augment food security. Food Security 8: 585–596. https://doi. causing eutrophication in coastal and back-reef waters of NE
org/10.1007/s12571-016-0568-8. Hainan, tropical China. Continental Shelf Research 57: 92–104.
DIAS. 2004. Database on introductions of aquatic species. FAO, https://doi.org/10.1016/j.csr.2012.05.006.
Rome, Italy: Fisheries Global Information Systems. Hu, L., J. Tang, J. Zhang, W. Ren, L. Guo, H. Matthias, K. Li, Z. Zhu,
Dong, S. 2009. On sustainable development of aquaculture: A et al. 2015. Development of rice-fish system: today and
functional perspective. Journal of Fishery Sciences of China 16: tomorrow. Chinese Journal of Eco-Agriculture 23: 268–275
798–805 (In Chinese with English abstract). (In Chinese with English abstract).
Dong, S. 2011. High efficiency with low carbon: The only way for International Finance Corporation. 1998. Environmental, health, and
China aquaculture to develop. Journal of Fishery Sciences of safety guidelines for fish processing. Washington, DC: Interna-
China 35: 1595–1600 (In Chinese with English abstract). tional Finance Corporation.
Royal Swedish Academy of Sciences 2017
123 www.kva.se/enAmbio
Jia, P., W. Zhang, and Q. Liu. 2013. Lake fisheries in China: Davy, 15–40. Dordrecht: Springer. https://doi.org/10.1007/978-
Challenges and opportunities. Fisheries Research 140: 66–72. 90-481-3087-0_2.
Jin, X., Q. Xu, and C. Huang. 2005. Current status and future Molnar, N., D.T. Welsh, C. Marchand, J. Deborde, and T. Meziane.
tendency of lake eutrophication in China. Sci China Ser C 48: 2013. Impacts of shrimp farm effluent on water quality, benthic
948–954. https://link.springer.com/content/pdf/10.1007/ metabolism and N-dynamics in a mangrove forest (New
BF03187133.pdf. Caledonia). Estuarine, Coastal and Shelf Science 117: 12–21.
Kang, B., J. Deng, Y. Wu, L. Chen, J. Zhang, H. Qiu, Y. Lu, and D. https://doi.org/10.1016/j.ecss.2012.07.012.
He. 2014. Mapping China’s freshwater fishes: Diversity and Moyle, P.B., and R.A. Leidy. 1992. Loss of biodiversity in aquatic
biogeography. Fish and Fisheries 15: 209–230. https://doi.org/ ecosystems; evidence from fish faunas. In Conservation biology:
10.1111/faf.12011. The theory and practice of nature conservation, ed. P.L. Fielder
Kawarazuka, N., and C. Běně. 2010. Linking small scale fisheries and and S.K. Jain, 129–161. London: Chapman and Hall. https://doi.
aquaculture to household nutritional security: An overview. org/10.1007/978-1-4684-6426-9_6.
Food Security 2: 342–357. https://doi.org/10.1007/s12571-010- Naylor, R.L., R.J. Goldburg, H. Mooney, M. Beveridge, J. Clay, C.
0079-y. Folke, N. Kautsky, J. Lubchenco, et al. 1998. Nature’s subsidies
Kharaz, H., and G. Gertz. 2010. The new global middle class: A to shrimp and salmon farming. Science 282: 883–884. https://
cross-over from West to East. In China’s emerging middle class: doi.org/10.1126/science.282.5390.883.
Beyond economic transformation, ed. C. Li, 32–51. Washington Naylor, R.L., R.J. Goldburg, J. Primavera, N. Kautsky, M.C.
DC: Brookings Institution Press. Beveridge, J. Clay, C. Folke, J. Lubchenco, et al. 2000. Effect
Lansing, J.S., and J.N. Kremer. 2011. Rice, fish and the planet. PNAS of aquaculture on world fish supplies. Nature 405: 1017–1024.
108: 19841–19842. https://doi.org/10.1073/pnas.1117707109. https://doi.org/10.1038/35016500.
Leung, T.L.F., and A.E. Bates. 2013. More rapid and severe disease Naylor, R.L., S.L. Williams, and D.R. Strong. 2001. Aquaculture—A
outbreaks for aquaculture in the tropics: Implications for food gateway for exotic species. Science 294: 1655–1666. https://doi.
security. Journal of Applied Ecology 50: 215–222. https://doi. org/10.1126/science.1064875.
org/10.1111/1365-2644.12017. Olsen, Y. 2011. Resources for fish feed in future mariculture.
Li, S. 1987. Energy structure and efficiency of a typical Chinese Aquaculture Environment Interactions 1: 187–200. https://doi.
integrated fish farm. Aquaculture 65: 105–118. https://doi.org/ org/10.3354/aei00019.
10.1016/0044-8486(87)90255-9. Ouyang, Z., H. Zheng, Y. Xiao, S. Polasky, J. Liu, W. Xu, Q. Wang,
Li, K.M. 1988. Rice-fish culture in China: A review. Aquaculture 71: L. Zhang, et al. 2016. Improvements in ecosystem services from
173–186. https://doi.org/10.1016/0044-8486(88)90257-8. investments in natural capital. Science 352: 1455–1459. https://
Li, X., S. Dong, Y. Lei, and Y. Li. 2007. The effect of stocking doi.org/10.1126/science.aaf2295.
density of Chinese mitten crab Eriocheir sinensis on rice and Primavera, J.H. 1997. Socio-economic aspects of shrimp culture.
crab seed yields in rice-crab culture systems. Aquaculture 273: Aquaculture Research 28: 815–827. https://doi.org/10.1046/j.
487–493. https://doi.org/10.1016/j.aquaculture.2007.10.028. 1365-2109.1997.00946.x.
Lin, Y., Z. Gao, and A. Zhan. 2013. Introduction and use of non- Primavera, J.H. 2005. Mangroves, fish ponds and the quest for
native species for aquaculture in China: Status, risks and sustainability. Science 310: 57–59. https://doi.org/10.1126/
management solutions. Reviews in Aquaculture 5: 1–31. science.1115179.
https://doi.org/10.1111/raq.12052. Qin, B.Q., P.Z. Xu, Q.L. Wu, L.C. Luo, and Y.L. Zhang. 2007.
Lin, M., Z. Li, J. Liu, R.E. Gozlan, S. Lek, T. Zhang, S. Ye, W. Li, Environmental issues of Lake Taihu. Hydrobiologia 581: 3–14.
et al. 2015. Maintaining economic value of ecosystem services https://doi.org/10.1007/s10750-006-0521-5.
whilst reducing environmental cost: A way to achieve freshwater Qin, B.Q., G.W. Zhu, G. Gao, Y.L. Zhang, W. Li, H.W. Paerl, and
restoration in China. PLoS ONE 10: e0120298. https://doi.org/ W.W. Carmichael. 2010. A drinking water crisis in China:
10.1371/journal.pone.0120298. Linkage to climatic variability and lake management. Environ-
Liu, J., and Q. Cai. 1998. Integrated aquaculture in Chinese lakes and mental Management 45: 105–112. https://doi.org/10.1007/
paddy fields. Ecological Engineering 11: 49–59. https://doi.org/ s00267-009-9393-6.
10.1016/S0925-8574(98)00022-6. Samples, S. 2014. Towards a more sustainable production of fish as
Liu, J., and Z. Li. 2010. The role of exotics in Chinese inland an important protein source for human nutrition. Journal of
aquaculture. In Success stories in Asian aquaculture, ed. S.S. De Fisheries & Livestock Production 2: 119. https://doi.org/10.
Silva and F.B. Davy, 173–186. Dordrecht: Springer. https://doi. 4172/2332-2608.1000119.
org/10.1007/978-90-481-3087-0_9. Sastry, P.S. 1985. Lipids of nervous tissue: Composition and
Liu, J., Q. Wang, T. Zhang, S. Ye, W. Li,, J. Yuan, and Z. Li. 2017. metabolism. Progress in Lipid Research 24: 69–176. https://
Development of lake and reservoir fisheries in China. In Chinese doi.org/10.1016/0163-7827(85)90011-6.
aquaculture: Success stories and modern trends, ed. J-F. Gui, Q. Siriwardhana, N., N.S. Kalupahana, and N. Moustaid-Moussa. 2012.
Tang, Z. Li, J. Liu and S.S. De Silva. Chichester: Wiley (in Health benefits of n-3 polyunsaturated fatty acids: Eicosapen-
press). taenoic acid and docosahexaenoic acid. Advances in Food
Liu, X.G., H. Xu, and C. Liu. 2017. Ecological engineering Nutrition Research 65: 211–222. https://doi.org/10.1016/B978-
technologies for optimizing freshwater pond aquaculture. In 0-12-416003-3.00013-5.
Chinese aquaculture: Success stories and modern trends, ed. J-F. Song, C., J. Chen, X. Ge, W. Wu, L. Fan, S. Meng, and G. Hu. 2011. The
Gui, Q. Tang, Z. Li, J. Liu and S.S. De Silva. Chichester: Wiley control of nitrogen and phosphorus to Tilapia fish pond by floating-
(in press). bed-grown Water Spinach (Ipomoea aquatica). Chinese Agricul-
Ma, D., J. Qian, J. Liu, and J. Gui. 2016. Development strategy for the tural Science Bulletin 27: 70–75 (In Chinese with English abstract).
integrated rice field aquaculture. Engineering Sciences 18: Subasinghe, R., D. Soto, and J. Jia. 2009. Global aquaculture and its
96–100 (In Chinese with English abstract). role in sustainable development. Reviews in Aquaculture 1: 2–9.
Miao, W. 2010. Recent developments in rice-fish culture in China: A https://doi.org/10.1111/j.1753-5131.2008.01002.x.
holistic approach for livelihood improvement in rural areas. In Subasinghe, R.P., J.R. Arthur, D.M. Bartley, S.S. De Silva, M.
Success stories in asian aquaculture, ed. S.S. De Silva and F.B. Halwart, N. Hishamunda, C.V. Mohan, and P. Sorgeloos. 2012.
Royal Swedish Academy of Sciences 2017
www.kva.se/en 123You can also read