PART 1: TRANSPORT SECTOR POLICY NOTE - AUGUST 2016 - UPDATED NATIONAL TRANSPORT STRATEGY OF UKRAINE
←
→
Page content transcription
If your browser does not render page correctly, please read the page content below
UPDATED NATIONAL
TRANSPORT STRATEGY
OF UKRAINE

PART 1:
TRANSPORT
SECTOR
POLICY
NOTE
AUGUST 2016
Support to the Implementation of the Association Agreement
                                  and of the National Strategy in the Transport Sector in Ukraine
This project is funded            Update / Upgrade National Transport Strategy 2030
by the European Union
                                         PART 1: Transport Sector Policy Note

TABLE OF CONTENT
1      INTRODUCTION                                                                                          4

2      DESCRIPTION OF THE APPROACH                                                                           6
2.1                      Data Screening                                                                       7
2.2                      Situation Analysis                                                                   7
       2.2.1                Sector and Sub-sectors Analysis                                                   7
       2.2.2                Regional Analysis                                                                 7
       2.2.3                The Vision, Global Goals and Objectives                                           7
2.3                      Stock Taking and Stakeholder Consultations                                           8

3      TRANSPORT SECTOR DIAGNOSIS                                                                            9
3.1                      Transport Sector in a Wide Contexts                                                  9
3.2                      Transport Sector Characteristics                                                    11
       3.2.1                The Modes of Transport                                                           11
       3.2.2                Institutional Framework and Levels of Competency                                 12
       3.2.3                Transport Networks and Rolling Stock                                             15
       3.2.4                Freight transport                                                                23
       3.2.5                Passenger Transport                                                              26
       3.2.6                Urban Mobility                                                                   28
       3.2.7                Export/Import and Transit                                                        31
       3.2.8                Transport Safety and Security                                                    35
       3.2.9                Transport Environmental and Health Issues                                        36
       3.2.10               Transport Sector Funding                                                         36
       3.2.11               Transport Users and the Demand for Services                                      40
3.3                      SWOT Analysis for Transport sector and Individual Transport Modes and Conclusions 46

4      THE VISION                                                                                            60
4.1                      Long-Term Vision                                                                    60
4.2                      Transport Policy and the Strategy                                                   61

                                                                                                    1|Page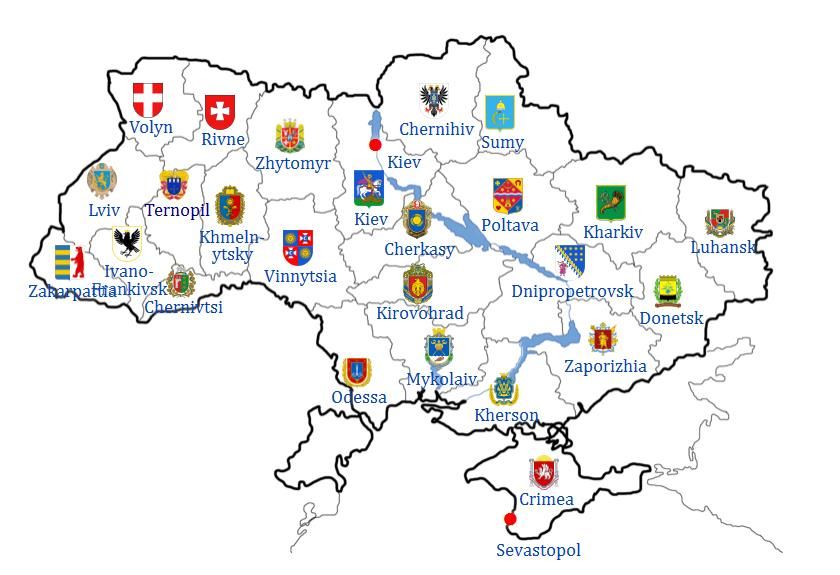
Support to the Implementation of the Association Agreement
                                  and of the National Strategy in the Transport Sector in Ukraine
This project is funded            Update / Upgrade National Transport Strategy 2030
by the European Union
                                         PART 1: Transport Sector Policy Note

5      STRATEGIC FRAMEWORK                                                                                      63
5.1                      Ukraine 2020 Strategy for Sustainable Development                                      63
5.2                      European Framework                                                                     65
       5.2.1                Europe 2020                                                                         65
       5.2.2                Policy White Paper                                                                  65
       5.2.3                Trans-European Networks Policy                                                      66
5.3                      Association Agreement between the European Union and its Member States and Ukraine
                                                                                                         66
5.4                      Other Strategies and Starting Points                                                   67
       5.4.1                At the European level                                                               67
       5.4.2                At the National Level                                                               68

6      STRATEGIC PLANNING OF TRANSPORT DEVELOPMENT                                                              70
6.1                      Key challenges to be addressed in the transport sector, expected results and targets   70
       6.1.1                Institutional Challenges                                                            71
       6.1.2                Planning and Investment Challenges                                                  71
       6.1.3                Pricing, Cost Recovery, Taxation and Subsidy Challenges                             71
       6.1.4                Operational, Regulatory and Licensing Challenges                                    72
       6.1.5                Safety Challenges                                                                   72
       6.1.6                Regional/Political Challenges                                                       72
       6.1.7                Environmental Challenges                                                            72
6.2                      Transport Sector Global Goal and Objectives                                            73
6.3                      Governance Principles                                                                  76

7      PRIORITY AXES, MEASURES AND ACTIONS                                                                      77
Priority Axis 1: Efficiency in Public Governance in The Transport Sector                                        77
Priority Axis 2: Provide Quality and Efficient Transport Services                                               77
Priority Axis 3: Achieve Sustainable Financing for Transport                                                    77
Priority Axis 4: Improving Transport Safety and Security                                                        78
Priority Axis 5: Improved Urban Mobility and Regional Integration                                               78

                                                                                                    2|Page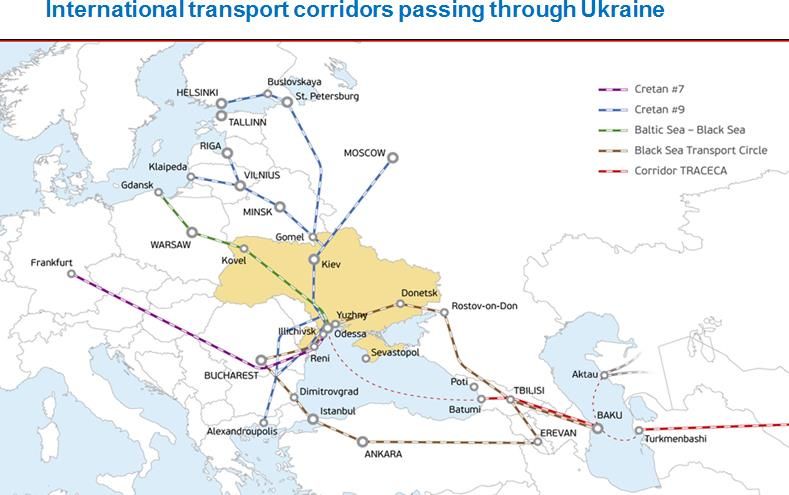
Support to the Implementation of the Association Agreement
                         and of the National Strategy in the Transport Sector in Ukraine
This project is funded   Update / Upgrade National Transport Strategy 2030
by the European Union
                                PART 1: Transport Sector Policy Note

                                                                          THE VISION,
                                                                       TRANSPORT POLICY
                                                                       AND THE STRATEGY

                                                                                           3|Page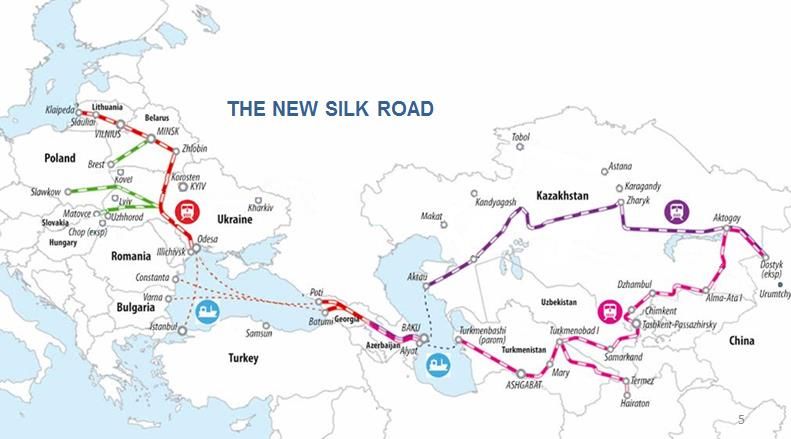
Support to the Implementation of the Association Agreement
and of the National Strategy in the Transport Sector in Ukraine
This project is funded Update / Upgrade National Transport Strategy 2030
by the European Union
PART 1: Transport Sector Policy Note
1 INTRODUCTION
The purpose of the National Transport Strategy (hereafter “NTS” or ‘the Strategy’) is to establish
conceptual basis for implementing the state policy in order to provide sustainable and efficient
transport sector operation, to create conditions for social and economic development of the country, to
improve competitiveness of national economy and wellbeing of its people.
The Association Agreement between the European Union and its Member States and Ukraine of June
2014 enable Ukraine to drive reforms, to consolidate the rule of law and good governance; and to give
an impetus to economic growth in the region by granting access to the world's largest internal market
and by encouraging cooperation across a wide range of sectors.
Through the Deep and Comprehensive Free Trade Area (hereafter “DCFTA”) as an integral part of the
Agreement and with extensive regulatory approximation Ukraine will further develop and achieve
economic integration.
The conclusion of DCFTA
brought an impetus to reviving
the Ukrainian external trade
sector, thereby diversifying its
trade flows towards EU
countries and stimulating
domestic production. Owing to
a reduction of duties charged,
DCFTA has an impact on a
reduction of transport costs in a
total value chain. This will go
along with the reduction of
technical formalities
(regulatory, customs, border-
crossing, sanitary/phytosanitary
regulations etc.).
By the time the National Transport Strategy of Ukraine up to 2020 was developed, Ukraine was
characterized by different political and geopolitical frameworks and European Unions’ Eastern
Partnership and the extension of the Trans-European Transport Network (TEN-T) were not on the
agenda during the development of the Strategy. The document was created in 2009 and does not reflect
the changes in Ukraine in recent years. The changing political situation in Ukraine in 2014 calls for new
approaches for establishing a new Ukraine.
The National transport Strategy starts with a setting the vision and the strategic framework for the
development of transport sector as part of national development goals and continues with introduction
of key challenges and diagnosis in the transport together with the strategic framework enable the
definition of the global goals, objectives and priorities that are crumbled into specific strategies and
measures .
The Consultation with the stakeholders created the transport sector policy / priorities.
Implementing the Strategy would allow for:
Satisfying the need of transport users for transport services
Upgrading transport system and improving its operation efficiency
4|Page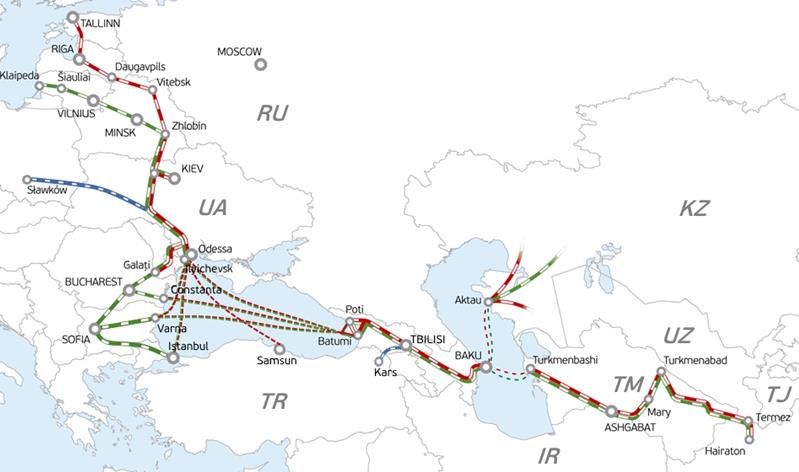
Support to the Implementation of the Association Agreement
and of the National Strategy in the Transport Sector in Ukraine
This project is funded Update / Upgrade National Transport Strategy 2030
by the European Union
PART 1: Transport Sector Policy Note
Improving the quality and accessibility of transport services
Refining the transport sector governance /management system
Increasing transport network handling capacity
Delivering transport service in proper time
Improving transport safety rate
Reducing volumes of hazardous substance emissions in the atmosphere (by 30%)
Decreasing the transport power consumption (by 15-20%, including in road transport from 43.6
to 34.8 gram of coal equivalent per 1 ton/km and in rail transport from 10.30 to 8.75 gram of
coal equivalent per 1 ton/km)
Accelerating rates of national transport system integration into the single European and global
transport systems and maximise utilisation of transit potential
5|Page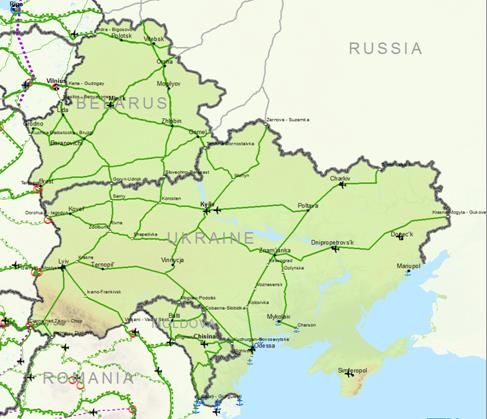
Support to the Implementation of the Association Agreement
and of the National Strategy in the Transport Sector in Ukraine
This project is funded Update / Upgrade National Transport Strategy 2030
by the European Union
PART 1: Transport Sector Policy Note
2 DESCRIPTION OF THE
APPROACH
The methodology adopted for updating and upgrading of the National Transport Strategy incorporates
common strategic planning methods.
In that order, drafting the Updated National Transport Development Strategy is mainly based on:
recommendations of a mid-term review on the National Transport Strategy, conducted in
October 2015 (Ref. to Annex),
sub-sectorial inputs – strategic plans of individual sub-sectors development up to 2020,
approved by the Minister of Infrastructure in December 2015 (Ref. to Annex), and their
assessment,
impact of the national and European Union developments
official statistical data on the transport and other industries, on trade modalities;
urban, sub-urban and regional transport performance in Ukraine;
transport and other national and European Unions’ development policies;
Association Agreement between the European Union and its Member States and
Ukraine.
The updated National Transport Strategy is built on the findings and the assessment. All information was
analysed and merged in this step taking into account multimodal considerations.
As a results,
a data inventory is developed;
SWOT analysis are performed to obtain a clear picture of the current situation of the transport
sector;
goals and objectives are defined;
priorities, measures and actions to be implemented to meet these objectives are identified;
targets and the key performance indicators are introduced.
The Strategy follows from the global goal into vertical and cross-sectional objectives and priorities; their
fulfilment is approached through individual strategies and measure.
The update of the National Transport Strategy was pursued along specific steps:
Policy Concept – a set of basic objectives and principles (policy concept) to guide the efforts to
meet these objectives;
Transport sector diagnosis;
Assessment of the sector challenges to meet the objectives;
Introduce priority axis, measures and actions, as well as targets and key performance
indicators;
Progress monitoring;
Mechanism for updating or adjusting the National Transport Strategy.
6|Page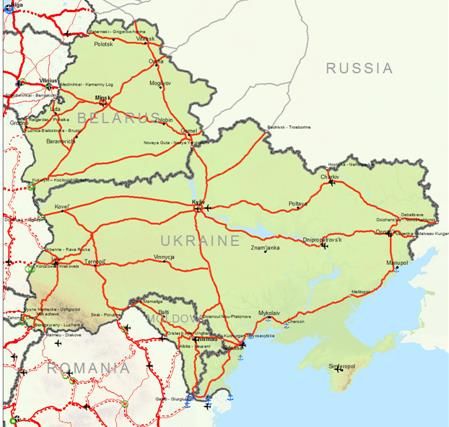
Support to the Implementation of the Association Agreement
                          and of the National Strategy in the Transport Sector in Ukraine
This project is funded    Update / Upgrade National Transport Strategy 2030
by the European Union
                                 PART 1: Transport Sector Policy Note

This methodology of updating the Strategy has been performed in parallel with the Strategic
Environmental Assessment procedure (SEA) to which the preparation of the Strategy is subjected,
according to the European and International Conventions. As a result of the SEA process, an
Environmental Report has been prepared (ref. to Annex), the findings of which have been integrated
into the Strategy.

Main steps of the methodology used in updating the National Transport Strategy are presented below:

2.1                  DATA SCREENING
All relevant data/information about the organization, operations and infrastructure of the relevant sub-
sector of the transport system are collected (data inventory) and presented in a way appropriate to a
situation and strategic analysis. Based on that, a data analysis on the quality and actuality of the
collected data as well as the identification of the missing data are performed.

2.2                  SITUATION ANALYSIS
2.2.1 SECTOR AND SUB-SECTORS ANALYSIS
For each transport mode (sub-sector) the relevant analyses (demand analysis, accessibility analysis,
infrastructure quality assessment, capacity assessment, interoperability assessment, operational
constraints analysis, delay analysis, accident black spot analysis, functionality, environment, etc.) have
been performed in order to identify significant/key issues. The analysis is based on the existing data.

2.2.2 REGIONAL ANALYSIS
The analysis has been based on the existing data, focussing on the transport needs from a long distance,
regional, suburban and local perspective considering the sectorial inputs prepared as a basis for the
Strategy updating, and identifying key aspects that should be improved, taken in advantage and/or
solved.

2.2.3 THE VISION, GLOBAL GOALS AND OBJECTIVES
Taking into account the outcomes of the analysis (SWOT), the vision of transport sector development up
to 2030, a global goal and specific objectives and the priorities has been established to address the
needs and potentials, to keep the strengths or to overcome the weaknesses or threats of the transport
Sector.
For each priority axis the measures and actions has been introduced and the targets and indicators are
set.

                                                                                            7|Page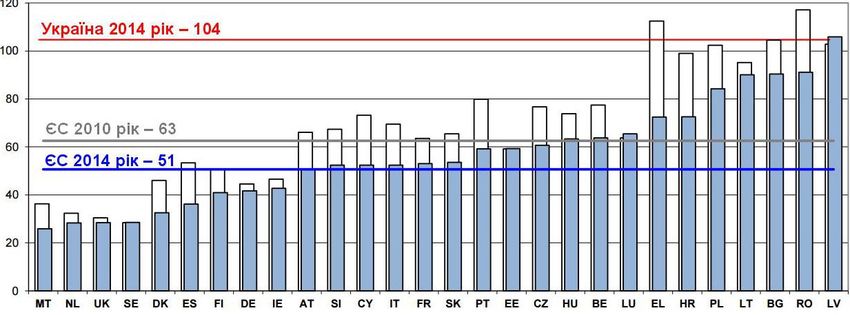
Support to the Implementation of the Association Agreement
                             and of the National Strategy in the Transport Sector in Ukraine
This project is funded       Update / Upgrade National Transport Strategy 2030
by the European Union
                                    PART 1: Transport Sector Policy Note

2.3 STOCK TAKING AND STAKEHOLDER
   CONSULTATIONS
The elaboration of National Transport Strategy is based on an implementation of a top-down planning
approach followed by a bottom-up consultation processes with transport sector stakeholders and users
at a later stage. The major groups of stakeholders to be covered include:
      -     the Strategy Work Group established at a Ministry of Infrastructure of Ukraine (MIU) and let by
            the Minister of Infrastructure and 1st Deputy Minister that includes:
                 o Technical Team at the Ministry of Infrastructure;
                 o Departments of Ministry of Infrastructure dealing with rail, road, air, maritime and
                      river transport;
      -     public national rail operator JSC “Ukrzaliznytsia”, Administration of Sea Ports of Ukraine, State
            Road Agency of Ukraine, State Transport Safety Service, State Aviation Service;
      -     other regulatory bodies and structures facilitating the transport, e.g. border-crossing and
            customs service, State Security Service of Ukraine, State Fiscal Service of Ukraine,
      -     ministries of finance and economy, other profile ministries (fuel and energy, industrial
            production, agriculture, etc.);
      -     freight forwards, air and sea port operators, Civil Society Organizations and other users in the
            field of transport and business promotions;
      -     donor community (multi-lateral and bi-lateral, International Finance Institutions (IFIs)).

After having exchanged on views and policies included into the draft National Transport Strategy with
the above mentioned stakeholders, the Strategy Work Group receives a generalized transport sector
feedback. Based on this information a final decision on the strategy is taken.

                                                                                               8|Page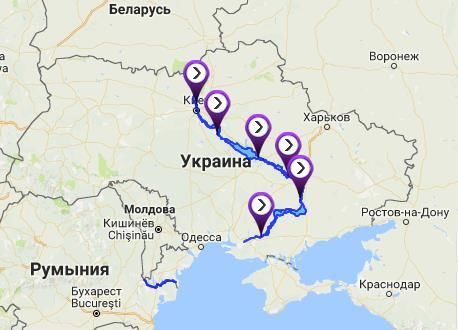
Support to the Implementation of the Association Agreement
and of the National Strategy in the Transport Sector in Ukraine
This project is funded Update / Upgrade National Transport Strategy 2030
by the European Union
PART 1: Transport Sector Policy Note
3 TRANSPORT SECTOR DIAGNOSIS
3.1 TRANSPORT SECTOR IN A WIDE CONTEXTS
The transport sector significantly contributes to Ukrainian economy. Its dynamics heavily depends on
the performance of national economy.
The transport sector of Ukraine accounts for about 6% of the country's GDP and 7% of total
employment. As reported by the State Statistics Service of Ukraine, in Q1 2016 GDP generated by
transport decreased by 13.8% (from 20.994 mn UAH to 18.099 mn UAH).
Ukraine: GDP produced by transport and storage
Source: State
Statistics Service of
Ukraine
Transport sector
in Ukraine
integrates five
modes:
land
transport (road
and rail),
waterbor
ne transport
(maritime and inland waterways),
air transport.
Over 2014-2015 Ukrainian economy experienced a significant downturn. The economy has been hit by
unprecedented shock due to conflict in Eastern Ukraine, annexation of Crimea that resulted both in a
loss of transport assets (roads, railway tracks and stations, airports, sea ports) and the market. Besides
of that, an additional load on social infrastructure has been created due to the allocating of temporarily
displaced people at controlled territories and fighting a growing unemployment rate. On the external
markets Ukraine faced a significant reduction of commodity prices. All the above mentioned reasons
have multiplied by a backlog of structural reforms in Ukraine and resulted in a drastic economic crisis.
Real GDP contracted by 6.8% and 9.9% in 2014 and 2015, correspondingly. In 2015 real GDP i amounted
to 1 979.5 bn UAH and GDP per capita constituted 46 201 UAH.
GDP trends, 2010-2015, % yoy*
9|PageSupport to the Implementation of the Association Agreement
and of the National Strategy in the Transport Sector in Ukraine
This project is funded Update / Upgrade National Transport Strategy 2030
by the European Union
PART 1: Transport Sector Policy Note
10
5,5
5 4,1
0,2 0,0
0
-5 -6,6
-9,9
-10
* data exclude temporarily occupied territories of AR of Crimea and Sevastopol, and territory of anti-terrorist
operations
On 27 June 2014 the Association Agreement between Ukraine and European Union was signed. Since 1
January 2016 the Clause IV of the Agreement dealing with the establishment of a Deep and
Comprehensive Free Trade Area started to be applied provisionally.
Following a considerable downturn, the economy started to stabilize. In Q1 2016 real GDP increased by
0.1% yoy and decreased by 0.7% in quarterly terms. Real GDP in the 1st quarter of 2016 amounted to
453.2 bn UAH and GDP per capita – 10 605 UAH (the 1st quarter of 2015 – 8 753 UAH).
GDP trends, 2011-2016 (quarterly), % yoy*
Source: State Statistic Office of Ukraine
* data excluding temporarily occupied territories of AR of Crimea and Sevastopol, and territory of anti-terrorist
operations
Over January-June 2016 the industrial production index (excluding the temporarily occupied territories
of AR of Crimea and Sevastopol, and territory of anti-terrorist operations) started exhibiting a slight
increase by 2.0% yoy.
According to State Statistic Service of Ukraine, in June 2016 industrial production index constituted 97.9
(seasonally adjusted – 97.5) implying a slight contraction of industrial production by 2.1% (2.9%) in
monthly terms.
The passenger transport services have been rendered to 2.4 bn passengers, which is by 6.6% less than
in S1 2015. Over the same period transport enterprises shipped 291.0 mn tons of cargo, which is by
3.9% more than in S1 2015.
Along with wholesale and retail trade, repair of motor vehicles and motorcycles (14.6%), manufacturing
(12.1%), agriculture, forestry and fishing (11.9%), transport is one of important sectors of Ukrainian
10 | P a g eSupport to the Implementation of the Association Agreement
and of the National Strategy in the Transport Sector in Ukraine
This project is funded Update / Upgrade National Transport Strategy 2030
by the European Union
PART 1: Transport Sector Policy Note
economy. Transport costs have a direct contribution to a retail price of various goods. In 2015 transport,
storage, postal and courier sector contributed to up to 6.6% of GDP.
GDP by types of economic activity, 2015 and Q1 2016
Source: State Statistic Office of Ukraine
In 2015 about 998 thousand employees (6.1% of total labour force excluding temporarily occupied
territories of AR of Crimea, city of Sevastopol and part of the anti-terrorist operation zone) worked in
transport, storage and communication sector, or.
In 2014 the number of business entities in transport, storage and communication activities accounted
for 111.8 thousand (5.8% of total business entities), out of which of 14.9 thousand (13.3%) constituted
legal persons and 96.9 thousand (86.7%) – natural persons-entrepreneurs.
According to preliminary data, in 2015 the number of enterprises accounted for 15.1 thousand,
including 32 (0.2%) large enterprises (with more than 250 employees), 13 973 (92.5%) – small
enterprises (with less than 50 employees) and 1 095 (7.3%) middle-size enterprises. About 75.9% of
small enterprises had less than 10 employees and annual income of less than 2 mn Euro.
3.2 TRANSPORT SECTOR CHARACTERISTICS
3.2.1 THE MODES OF TRANSPORT
Ukrainian transport covers five distinct transport modes: land (road and rail), waterborne (maritime and
inland waterways) and air transport.
In 2015 the share of transport modes in freight transportation was as follows: railways – 25.4%, road –
74.1%, maritime – 0.2%, inland waterways - 0.2%, aviation – 0.01%.
In Ukraine the road transport has the largest share in the passenger transport modal split. Road
transport is covered by mostly private motor vehicles.
Passenger transport mode split, January-June 2016
11 | P a g eSupport to the Implementation of the Association Agreement
and of the National Strategy in the Transport Sector in Ukraine
This project is funded Update / Upgrade National Transport Strategy 2030
by the European Union
PART 1: Transport Sector Policy Note
Passenger turnover by transport Passenger turnover by transport
mode I-VI/2016 per passengers mode I-VI/2016 per passenger km undergro
transported railway trolleybu und
undergro 8% s (metro)
und
tram 6% 5%
(metro)
14% 4%
aircraft railway
trolleybu motor 13% 37%
s vehicles water
21% 42% 0% motor
tram aircraft water vehicles
15% 0% 0% 35%
Source: State Statistic Service of Ukraine
1
Excluding the temporarily occupied territories of AR of Crimea, the city of Sevastopol and part of the
anti-terrorist operation zone
2
Railway including transportation by urban electric trains
Freight transport modal split, January-June 2016
Freight turnover by transport mode Freight turnover by transport mode
I-VI/2016 per tkm I-VI/2016 per tons
aircraft water aircraft
water
motor 0% 1%
2% 0%
vehicles
16%
motor
vehicles
31%
railway
railway trains
trains 68%
82%
Source: State Statistic Service of Ukraine
1
Excluding the temporarily occupied territories of AR of Crimea, the city of Sevastopol and part of the
anti-terrorist operation zone
3.2.2 INSTITUTIONAL FRAMEWORK AND LEVELS OF COMPETENCY
Ministry of Infrastructure
The Ministry of Infrastructure is in charge of development and implementation of national policy in
road, rail, maritime, river transport and aviation, postal services, roads, navigation and hydrographic
support of navigation, merchant shipping, safety of road, urban electric, rail, maritime and river
transport, and state supervision of road, urban electric, rail, maritime and river transport safety (except
maritime safety of vessel fishing fleet).
12 | P a g eSupport to the Implementation of the Association Agreement
and of the National Strategy in the Transport Sector in Ukraine
This project is funded Update / Upgrade National Transport Strategy 2030
by the European Union
PART 1: Transport Sector Policy Note
Besides the Ministry of Infrastructure, several other executive and independent bodies, public
institutions are in charge of various areas of transport sector:
Transport safety
The State Service of Ukraine for Transport Safety (“Ukrtransbezpeka”) is a central executive body
directed and coordinated by the Cabinet of Ministers of Ukraine through the Minister of Infrastructure.
It implements state safety policy and state supervision (control) of road, rail, maritime, river (except
maritime safety of vessel fishing fleet) and urban electric transport; licensing (passengers and goods
transportation by road, rail, maritime and river transport), weight control of vehicles on public roads and
charging fees. It is in charge of operational controlling.
Road transport
State Roads Agency of Ukraine (Ukravtodor) is a central executive body directed and coordinated by
the Cabinet of Ministers of Ukraine through the Minister of Infrastructure. It implements state policy in
road maintenance and management; organizes construction, reconstruction, repair and maintenance of
roads; develops and implements national strategy and program for road infrastructure; develops
standards for construction, reconstruction, repair and maintenance of roads in coordination with
relevant government authorities on road safety, provides concession bidding.
State Road Transport Research Institute is a state enterprise under the Ministry of Infrastructure. Its
functions include research, certification, expertise, standardization and metrology, testing of vehicles,
designing, issuing of tachograph cards, consulting, etc.
Rail Transport
The railway network is operated by Public Joint Stock Company "Ukrainian railways" (Ukrzaliznytsya)
fully state owned. The company was established according to the Decree of the Cabinet of Ministers of
Ukraine dated of 25/06/2014 №200 “On the establishment the Public Joint Stock Company "Ukrainian
railways". The company has been established on the basis of merging State Administration of rail
transport, enterprises and institutions of public rail transport. The Cabinet of Ministers performs the
functions of the company's supreme governance body.
The operations of PJSC “Ukrzaliznytsia” areas are as follows: i) freight transport, ii) passenger transport,
iii) infrastructure and iv) industrial entities. The structure of Ukrainian Railways includes following
entities:
6 Railways – Donetsk, Lviv, Odesa, Prydniprovska, Southwest, South
18 Enterprises
6 Industrial production enterprises
5 State Design – survey institutes of railway transport
3 Scientific organisations
4 State enterprises of other kind of activities
13 | P a g eSupport to the Implementation of the Association Agreement
and of the National Strategy in the Transport Sector in Ukraine
This project is funded Update / Upgrade National Transport Strategy 2030
by the European Union
PART 1: Transport Sector Policy Note
Structure of PJSC “Ukrzaliznytsia”
Source: PJSC “Ukrzaliznytsia”
With more than 300 000 employees, Ukrzaliznytsia is currently one of the largest employers in Ukraine,
including (non-core) activities, such as medical facilities and engineering research institutions.
Certification bodies of rail transport (Dnipropetrovsk rail transport certification body, Automated and
automatic control systems for rail transport certification body) provide certification of rail transport.
Maritime Transport
The Ukrainian Sea Ports Authority (USPA) is a state unitary enterprise subordinated to the Ministry of
Infrastructure. It acts as a state commercial enterprise. The Company was established according to the
Law "On Sea Ports of Ukraine” № 4709-VI of 17.05.2012. USPA is responsible for the management and
ensuring the safety of navigation, the maintenance, efficient use and development of state property
assigned to USPA on the right of economic authority. It has Headquarters Office in Kyiv, a Main
Representative Office in Odessa, and branches in all sea ports of Ukraine, the «Delta-pilot» Branch,
Maritime Search and Rescue Service. the company employs more than 10 500 persons.
Maritime Rescue Service is a state enterprise subordinated to USPA. It ensures a proper functioning of
seaports, manages and controls safety of navigation, maintenance, efficient use and development of
state property assigned to USPA.
Classification Society Shipping Register of Ukraine is a state enterprise ensuring safety of maritime and
river transport.
The Inspectorate for Training and Certification of Seafarers is a state organization and operates under
the supervision of the Ministry of Infrastructure of Ukraine in charge of training and certification.
Inland Waterways Transport
The State Administration of River Ports is a state commercial enterprise subordinated to the Ministry of
Infrastructure. It ensures efficient use of inland waterways, the passenger fleet and other state property
and control over their construction, maintenance, repair and modernization, recovery and efficient use
of river port charges in river ports, passenger and goods transportation; repairs, modernization and
reconstruction of hydraulic structures and river ports fleet.
State Enterprise of Inland Waterways “Ukrvodshlyakh” is a state commercial enterprise subordinated
to the Ministry of Infrastructure. It is in charge of implementing transport, technical and environmental
14 | P a g eSupport to the Implementation of the Association Agreement
and of the National Strategy in the Transport Sector in Ukraine
This project is funded Update / Upgrade National Transport Strategy 2030
by the European Union
PART 1: Transport Sector Policy Note
policies in operating inland waterways and shipping gateways, as well as dredging, providing for safe
operations of inland waterways and shipping locks.
Air Transport
The State Aviation Services of Ukraine (SASU) is a state executive body. Its activity is directed and
coordinated by the Cabinet of Ministers via the Minister of Infrastructure of Ukraine that implements
state policy in the field of civil aviation and airspace; implements state control and supervision of civil
aviation safety and air navigation services.
The National bureau of air accidents investigation of Ukraine is the national civil aviation incident
investigation authority of Ukraine, a "specialist expert organization" subordinated to the Cabinet of
Ministers of Ukraine.
The Ukrainian State Air Traffic Services Enterprise “Ukraeroruh” is subordinated to the Ministry of
Infrastructure. It is in charge of air traffic management, air traffic services, organization and
management of airspace; radio and electrical support of air traffic services and flight operations;
development and maintenance of subdivisions of civil and military air traffic management system;
organization of emergency notification and participation in search and rescue operations; provision of
aeronautical information; and training.
3.2.3 TRANSPORT NETWORKS AND ROLLING STOCK
Ukraine has one of the largest railway networks in Europe with links to Russian Federation, Belarus,
Moldova, Poland, Romania, Slovakia and Hungary, as well as the Ukrainian seaports.
Owing to its favourable geographical position, a number of international transport corridors passes
through the territory of Ukraine:
Pan-European transport corridors № 3, 5, 7, 9;
Rail Co-Operation Corridors (ORC) № 3, 4, 5, 7, 8, 10 and
European Transport Corridors - Caucasus - Asia (TRACECA) and Europe - Asia.
15 | P a g eSupport to the Implementation of the Association Agreement
and of the National Strategy in the Transport Sector in Ukraine
This project is funded Update / Upgrade National Transport Strategy 2030
by the European Union
PART 1: Transport Sector Policy Note
Source: Ministry of Infrastructure of Ukraine
Transport routes, 2013-2015, km
Operational length of:
public including public public of which, trolley bus public tram subway
railways electrified navigable automobile with hard routes routs (double-
tracks river roads coating (single- (single- track
routes track) track railroads)
railroads)
2013 21604.9 10237.5 2120.7 169648.5 166084.9 4379.0 1914.6 112.3
1
2014 20948.1 9975.5 1613.1 163027.6 159463.2 3567.9 1803.0 112.3
20151 20954.2 9974.5 1562.6 163024.2 159447.1 3350.8 1584.1 112.3
1
Excluding the temporarily occupied territories of AR of Crimea, the city of Sevastopol and part of the
anti-terrorist operation zone
Source: State Statistic Service of Ukraine
The priority transport network of Ukraine:
16 | P a g eSupport to the Implementation of the Association Agreement
and of the National Strategy in the Transport Sector in Ukraine
This project is funded Update / Upgrade National Transport Strategy 2030
by the European Union
PART 1: Transport Sector Policy Note
Source: Ministry of Infrastructure, Ukraine
Road Networks
The road transport infrastructure of Ukraine is characterized by a relatively high low density compared
to other European countries.
Total road length in Ukraine constitutes 163 024.2 km, out of which 159 447.1 km are paved roads1.
About 31% of paved roads are state roads and 69% - local. Most of these roads are in non-satisfactory
technical conditions. In particular, ca 50% of the roads do not meet roughness standards, ca 40% - that
for road strength. The average speed on highways is 2-3 times lower than in Western European
countries.
Priority road network of Eastern Partnership (TEN-T):
1Excluding the temporarily occupied territories of AR of Crimea, the city of Sevastopol and part of the anti-
terrorist operation zone
17 | P a g eSupport to the Implementation of the Association Agreement
and of the National Strategy in the Transport Sector in Ukraine
This project is funded Update / Upgrade National Transport Strategy 2030
by the European Union
PART 1: Transport Sector Policy Note
Source: Ministry of Infrastructure of Ukraine
The road transport network (100% state-owned) is managed by the State Road Agency of Ukraine
(Ukravtodor).
Railway Networks
The network of railways of Ukraine is about 20 954.2 km of tracks. out of which 9 974.5 km (47.6%) is
electrified. It is (by far) the largest railway networks in Europe.
Priority railway network of Eastern Partnership (TEN-T):
18 | P a g eSupport to the Implementation of the Association Agreement
and of the National Strategy in the Transport Sector in Ukraine
This project is funded Update / Upgrade National Transport Strategy 2030
by the European Union
PART 1: Transport Sector Policy Note
Source: Ministry of Infrastructure of Ukraine
Railways Fleet
JSC Ukraine Railways UZ possessed 5 289 passenger cars, 36 180 freight cars, 1 749 electric locomotives,
2 281 diesel-powered locomotives.
Transport assets: PJSC Ukrainian Railways (dated of 31.12.2014)
Freight transport Passenger transport
Electric locomotive 1 270 498
Diesel locomotive (without maneuverable 693 71
locomotives)
Freight cars 116 063 -
Passenger cars - 5 291
High speed inter-regional trains - 14 trains
Source: Ukrzaliznytsia
Overall, private companies account for approximately 40% of the total freight car fleet (with about 70%
in the tank car segment, 50% for open cars, and 5-10% for hoppers, platform and box cars),
private operators have about 138 000 wagons (mostly gondolas).
The degree of depreciation of freight cars (wagons) is 89.7%, passenger cars – 86%. 100% of locomotives
and 56% of passenger cars have an average age more than 40 years.
19 | P a g eSupport to the Implementation of the Association Agreement
and of the National Strategy in the Transport Sector in Ukraine
This project is funded Update / Upgrade National Transport Strategy 2030
by the European Union
PART 1: Transport Sector Policy Note
Waterborne Networks
Ukraine has 1.6 thousand km navigable waterways. The water transport industry of Ukraine is based
on a network of sea and river ports, as well as loading terminals, moorings and transport facilities of
various forms of ownership. According to MOIU, 130 000 persons are employed in maritime transport,
out of which 36 000 employees working in 38 public or private enterprises.
At present 492 ships of a total deadweight of 607.44 thousand tons are operated under Ukrainian flag.
The average operational life of river crafts is 21-25 years, and only 18% of fleet is operated over less
than 20 years.
As of July 2014, there have been 13 sea ports (excluding 5 sea ports operate in AR Crimea) operated in
continental part of Ukraine. The biggest of them in terms turnover are Yuzhnyi (deep sea) port, Odessa
and Illichivsk sea ports.
Two main river arteries are Danube river (Waterway E 80, E 80-09 according to UNECE classification) and
Dnipro river (Waterway E 40 according to the UNECE classification). The existing port infrastructure on
Dnipro river covers 16 river ports and terminals that can potentially provide for transporting and
processing of up to 50 mn tons of cargo. Major port infrastructure belongs to private companies
(Ukrrichflot, Nibulon and Germes-Trading).
At the beginning of 2015 the total length of Ukrainian navigable IWW equaled to 1562.6 km. Key IWW
arteries that are operated now include Dnipro river (Kyiv and Kaniv sections for cabotage and
Zaporizhzhia/Dnipro-Kherson section for river-sea transport), Yuzhnyi Bug river (Mykolaiv-Nova Odessa
section) and Danube river.
The capacity of IWW is limited by the capacity of navigable water along key river arteries. For Dnipro
river the controlling depth indicator varies from 1.9 m to 3.6 m and for Yuzhnyi Bug river – up to 2.2 m.
Figure 1: Navigable water along Ukrainian inland waterways, meters
20 | P a g eSupport to the Implementation of the Association Agreement
and of the National Strategy in the Transport Sector in Ukraine
This project is funded Update / Upgrade National Transport Strategy 2030
by the European Union
PART 1: Transport Sector Policy Note
1.9 m
3.6 m
3.6 m
3.6 m
3.6 m
2.2 m 3.6 m
Source: River information service of Ukraine
Although the cargo throughput of Ukrainian river ports increased since 2008, it still merely reaches
about one fifth of total river port design capacity.
Table 1: Technical characteristics and cargo throughput at Ukrainian river ports
River ports: Technical characteristics Cargo throughput, mn t
Design capacity, Length of berths, Depth at berth, 2008 2010 2012
mn tonnes m m
Chernygiv 6.7 n/a n/a 0.3 0.5 0.9
Kyiv 37.9 1479 5.0 2.2 3.5 5.7
Cherkassy 4.6 519 3.6 0.1 0.2 0.3
Kremenchuk 13.0 608 4.0 0.6 0.6 0.1
Kam`ianske 5.4 340 3.3 0.8 0.7 0.8
Dnipro 26.3 1345 3.0-4.0 2.0 2.1 2.8
Zaporizhzhia 31.4 2786 3.5-4.0 1.9 2.7 2.9
Nova 2.9 1200 3.4-3.8 0.2 0.1 0.2
Kakhovka
Kherson 12.7 950 4.5-7.8 0.9 0.5 1.4
21 | P a g eSupport to the Implementation of the Association Agreement
and of the National Strategy in the Transport Sector in Ukraine
This project is funded Update / Upgrade National Transport Strategy 2030
by the European Union
PART 1: Transport Sector Policy Note
Mykolaiv 10.4 n/a n/a 0.8 0.9 1.3
Source: River information service of Ukraine
Commodity structure of freights transported by IWW is overpresented (ca 80% of total freight
throughput) by dry bulk cargoes, namely, ferrous metals and construction materials.
Figure 2: Commodity structure of freights transported by river ports, 2014, %
other cargoes
grains construction materials
ferrous metals
coke
All types of vessels navigating Ukrainian IWW and utilizing river locks are charged a lock fee. Effective
lock rates are defined by the Governement of Ukraine (CMU Resolution No553 dated of 16/10/2014).
Table 2: Effective lock rates, UAH per vessel
Type of vessel, m3
up to 2000 2001-4000 4001-10000 over 10000
for Kyiv, Kaniv, Kremenchuk and Kamenskoe locks:
Vessels calling abroad 806 1241 1614 1981
Cabotage vessels 251 372 497 557
for Zaporizhzhia lock:
Vessels calling abroad 3344 4958 6569 8183
Cabotage vessels 618 991 1241 1614
for Kakhovka lock:
Vessels calling abroad 2169 3223 4337 5457
Cabotage vessels 497 618 869 1112
Source: UkrVodShliakh
Maritime Fleet
In 2015 Ukrainian maritime fleet amounted to 477 vessels in 2015 compared to 729 ships in 2011.
Ukrainian Maritime Fleet, 2011-2015, thousand deadweight tonnes
22 | P a g eSupport to the Implementation of the Association Agreement
and of the National Strategy in the Transport Sector in Ukraine
This project is funded Update / Upgrade National Transport Strategy 2030
by the European Union
PART 1: Transport Sector Policy Note
Source: UNCTAD statistics
Urban Transport Networks
Urban trolleybus networks of account for up to 3.4 thousand km, tram tracks - for around 1.6 thousand
km.
Ca 93% of tramcars, 59% of trolleybuses and 76% of subway cars have been operated for about 15
years.
According to State Statistics Service the depreciation rate of transport (including land, water, air
transport, additional transport services and auxiliary operations) stands at about 96%.
State programs to upgrade railway rolling stock and electric transport, roads actually are not effectively
implemented due to lack of funding.
Passenger transport should be commercialized, self-sustainable and commercially attractive. This would
make it possible to attract private capital and to upgrade transport systems.
3.2.4 FREIGHT TRANSPORT
In 2015 road transport accounted for 21% of total freight turnover in tkm, rail transport - for 76.7%,
waterborne transport - 2.2%, and air transport - 0.08%.
In 2015, the freight transportation accounted for 1 377.2 mn tons (-9.6% in comparison to 2014). Freight
turnover experienced a 6.8% reduction in 2015.
Over the period of 2005-2013 freight transportation increased by 7.5% (in tons), despite a sharp
economic decline of 2009. Since 2014 the sector has entered another economically and politically
unstable period due to military actions in Eastern Ukraine.
Freight transport, 2005 – 2015, mn tons
23 | P a g eSupport to the Implementation of the Association Agreement
and of the National Strategy in the Transport Sector in Ukraine
This project is funded Update / Upgrade National Transport Strategy 2030
by the European Union
PART 1: Transport Sector Policy Note
1
2014, 2015 – data excluding the temporarily occupied territories of the Autonomous Republic of Crimea,
the city of Sevastopol and part of the anti-terrorist operation zone
2
road transport – data including commercial shipment of cargo by physical persons – entrepreneurs
3
data covers rail, road, maritime, river, aviation
Source: State Statistical Office of Ukraine
In January-June 2016, transport enterprises shipped 291.0 mn tons of cargo, i.e. 152 087.0 mn tkm of
cargo, which is by 3.9% more in terms in annual terms.
Although in 2013-2015 cargo transport dropped by 16.8% (from 379 045.0 mn tkm to 315 341.8 mn
tkm), in January –June 2016 cargo transportation resumed growing in Ukraine.
In of January – June 2016, rail transport represented more than 82% of total cargo transport (excluding
pipelines).
Total Shipment of Cargo, January-June 2016
Freight turnover I-VI 2016 Freight shipped I-VI 2016
mn. T*km in % of total mn.t in % of total
shipment shipment
TOTAL SHIPMENT 152 087.0 291.0
WITH PIPELINES
TOTAL SHIPMENT 107 814.6 100.0 239.9 100.00
WITHOUT PIPELINES
out of which, by
railway trains 88 780.8 82.35 162.2 67.61
motor vehicles 17 227.0 15.97 75.2 31.34
water 1 690.7 1.57 2.5 1.04
pipelines 44 272.4 - 51.1 -
aircraft 116.1 0.11 0.04 0.01
1
Excluding the temporarily occupied territories of AR Crimea, the city of Sevastopol and part of the anti-
terrorist operation zone
Source: State Statistics Service of Ukraine
24 | P a g eSupport to the Implementation of the Association Agreement
and of the National Strategy in the Transport Sector in Ukraine
This project is funded Update / Upgrade National Transport Strategy 2030
by the European Union
PART 1: Transport Sector Policy Note
Road Transport
In January – May 2016 freight turnover by road amounted to 14.1 bn t*km and exhibited an increase of
5.8% yoy. By the same period of time 60.7 mn tons of cargo (by 13.4% more in annual terms) has been
transported.
In Ukraine road transport dominates in domestic transport; its share in international and transit
transport is relatively modest. The domestic transport covers mining and metal products, coal and
mineral construction materials.
Rail Transport
In January-June 2016 136.7 mn tons of cargo have been transported within Ukraine and exported by rail.
Rail transport is mainly used to transport bulk cargo. During the 1st semester of 2016 certain bulk cargo
categories showed an increase in transport volumes (chemicals and mineral fertilizers, oil and oil
products, ferrous metals, coke), others (construction materials, scraps, timber, cement) – decreased.
Rail transport commodity structure, January-June 2016
Total, mn tones Annual growth rate, %
Freight total 162.2 98.8
of which, shipped 136.7 100.1
of which, by commodity groups
coal 27.1 100.6
coke 3.6 115.7
oil and oil products 1.3 109.6
iron and manganese ore 35.0 95.6
ferrous metals 12.3 112.5
scrap ferrous metals 1.3 75.1
timber 2.4 92.2
chemical and mineral fertilizers 2.2 102.9
grain and milled products 12.8 109.6
cement 2.7 75.1
construction material 14.8 80.3
other commodities 21.2 119.1
Source: State Statistical Office of Ukraine
Waterborne Transport
According to official data, in 2015 the freight maritime transport accounted for 1 246 thousand tons
(37.9%) of domestic transport and 2 045.6 thousand tons (62.1%) of international transport.
25 | P a g eSupport to the Implementation of the Association Agreement
and of the National Strategy in the Transport Sector in Ukraine
This project is funded Update / Upgrade National Transport Strategy 2030
by the European Union
PART 1: Transport Sector Policy Note
Freight turnover at Ukrainian sea ports accounted for 453.7 mn t*km (11.7%) of domestic transport and
3 408.4 mn t*km (88.3%) of international transport.
The river freight transport reached ca 2 mn tones (62.3%) of domestic transport, and 1.2 mn tones
(37.7%) of international transport. The river freight turnover estimated at 0.3 bn t*km (18.1%) in
domestic transport and 1.3 bn t*km (81.9%) in international transport.
Over 2013-2015 cargo processing in Ukrainian sea ports dropped down from 153 541.7 to 136 714.5 or
by 11.0%.
Cargo transport at Ukrainian sea and river ports, January-November 20151
Total of which:
exports imports transit cabbotage (short
sea)
Freights shipped, 136 714.5 94 948.0 17 393.9 15 654.6 8 718.0
thousand tons
sea ports 131 910.5 92 619.8 17 038.3 15 646.7 6 605.7
% to January- 102.6 100.4 112.4 83.5 261.8
November 2014
river ports 4 804.0 2 328.2 355.6 7.9 2 112.3
% to January- 98.5 113.3 121.2 59.8 84.0
November 2014
1
Excluding the temporarily occupied territories of the Autonomous Republic of Crimea. the city of
Sevastopol.
Source: State Statistical Office of Ukraine
Air Transport
According to State Statistics Service of Ukraine, in 2015 air international freight transport represented
most (about 99.9%) of the total air transport freight turnover.
In January-May 2016 the air transport turnover amounted to 94.4 mn t*km, which is by 3.5% more than
in January-May 2015. Air transport carried 32.2 tons of cargo, which is by 14.1% more than in January-
May 2015.
3.2.5 PASSENGER TRANSPORT
Passenger Transport
According to official data during the last four years the demand for passenger transport was decreasing
demand.
26 | P a g eSupport to the Implementation of the Association Agreement
and of the National Strategy in the Transport Sector in Ukraine
This project is funded Update / Upgrade National Transport Strategy 2030
by the European Union
PART 1: Transport Sector Policy Note
In 2015 passenger transport services of were rendered to 5.2 bn passengers (-12.3% yoy). During the
first semester of 2016 ca 2.4 bn passengers have been transported (-6.6%).
Over 2015-2016 the passenger transport modal split of remained stable: 41.8% journeys (1 009.3 mn
passengers) by buses, 21.4% (517 mn passengers) – by trolleys, 14.6% (352.3 mn passengers) – by trams,
14.1% (339.4 mn passengers) - by subway, 8% (192.9 mn passengers) – by rail, 0.14% (3.3 mn
passengers) - by air, and 0.004% (0.1 mn passengers) – by water transport.
The buses remained the most commonly used mode of public transport. Bus transport is the only public
transport service in 412 out of 460 cities and covers more than 96% of transport services in rural
settlements.
Passenger transport, 2013-2015, thousand passengers
railway sea river automob air trams trolley- subway
ile buses
(buses)1
2013 425216.9 6642.0 631.1 3343659.5 8107.2 757382.8 1306228.5 774794.0
20142 389305.5 29.4 565.1 2913318.1 6473.3 769911.1 1096884.8 725819.9
20152 389794.1 25.5 550.8 2243734.9 6302.7 738603.2 1080772.6 700369.5
1
Including transportation of passengers by businessmen of small business (legal and natural persons)
2
Excluding the temporarily occupied territories of AR of Crimea, the city of Sevastopol and part of the
anti-terrorist operation zone
Source: State Statistic Office of Ukraine
Passenger transportation. January-June 20161
Passenger turnover Passengers transported
mn. % yoy % of total mn. pass % yoy % of total
Pass*km transport transport
Total 48161.9 102.9 100.0 2414.3 93.4 100.0
transported,
including:
railway2 17682.5 105.9 36.72 192.9 100.1 7.99
motor vehicles 16795.5 96.0 34.87 1009.3 87.6 41.80
water 12.0 108.1 0.02 0.1 65.0 0.01
aircraft 6110.5 124.2 12.69 3.3 119.1 0.14
tram 2028.0 100.2 4.21 352.3 99.3 14.59
trolleybus 2932.2 97.8 6.09 517.0 96.6 21.41
underground 2601.2 97.4 5.40 339.4 97.3 14.06
(metro)
1
Excluding the temporarily occupied territories of the Autonomous Republic of Crimea, the city of
Sevastopol and part of the anti-terrorist operation zone
2
Including transportation by urban electric train
27 | P a g eSupport to the Implementation of the Association Agreement
and of the National Strategy in the Transport Sector in Ukraine
This project is funded Update / Upgrade National Transport Strategy 2030
by the European Union
PART 1: Transport Sector Policy Note
Source: State Statistic Office of Ukraine
Another important observation is that bus passenger transport dominates over rail passenger transport.
Modal split of passenger transport, 2015, % of total passengers
1
Excluding the temporarily occupied territories of AR Crimea, the city of Sevastopol and part of the anti-terrorist
operation zone
2
Including passenger transportation by city train (Kyiv – 4 892.7 thousands passengers)
Passenger transport by the type of connection:
According to State Statistics Service of Ukraine, in 2015 road passenger transport accounted for: urban
transport – 1 659.9 mn passengers (74%), suburb transport– 459.7 mn passengers (20.5%), intercity
transport – 122.9 mn passengers (5.5%), international transport – 1.2 mn passengers (0.05%).
Passenger turnover by road covered: urban transport – 14.7 mn passengers (42.6%), suburban transport
– 8.8 mn passengers (25.4%), intercity transport – 10.4 mn passengers (30%), international transport –
0.7 mn passengers (2%).
In 2015 rail passenger departures structure looked as follows: 6.7% - by through trains, 3.4% - local,
89.9% - suburban.
Maritime passenger transport: domestic – 9.7 thousand passengers (38%), international – 15.8
thousand passengers (62%). Maritime transport passenger turnover: domestic – 216.1 thousand p*km
(1,5%), international – 14 mn p*km (98,5%). The regions of maritime passenger transportation are
Odesa and Mykolayiv oblasts.
River passenger transport is solely entitled for domestic market: 549.3 thousand passengers (99.7%) and
international transport covers 1.5 thousand passengers (0.3%). In terms of river transport passenger
turnover, domestic transport contributes to 66.6% (5.4 mn p*km), implying that international transport
is associated with long-distance travels (2.7 mn p *km or 33.4%).
Air passenger transport is dominated by international travels: 5 678 thousand passengers or 90.1% of
total passenger transport. Air transport passenger turnover confirms that the same tendency:
international travels cover 11.1 bn p*km or 97.5% of total passenger turnover.
3.2.6 URBAN MOBILITY
28 | P a g eSupport to the Implementation of the Association Agreement
and of the National Strategy in the Transport Sector in Ukraine
This project is funded Update / Upgrade National Transport Strategy 2030
by the European Union
PART 1: Transport Sector Policy Note
The division of labour between the Minister for Regional Development and the Ministry of
Infrastructure re. the urban mobility is not clear. Ministry of Infrastructure is involved in tariff regulation
and licensing, Ministry of Regional Development is in charge of urban development and norms,
however, the overall tasks of guidance in respect of urban mobility is not taken up. At present, the cities
are more or less left on their own.2
Populated places of Ukraine are split into two categories: urban and rural. From around 45.9 (2013)
million of inhabitants about 39% people of Ukraine live in urban areas.
Figure: Ukraine Administrative Division
Source: Wikipedia
Figure: Cities of Ukraine (No. of cities/towns per No. of inhabitants)
Source: Urban
Mobility in Ukraine:
The 13 billion Euro
Number of Cities/towns gap, GIZ, April 2014
Large city (≥ 1 million inhabitants): 5
Medium-sized City (0.5 - 1 million inhabitants): 4
Small city (100 000 - 500 000 inhabitants): 37
Large town (50 000 - 100 000 inhabitants): 55
Meduim-sized
2 Urban mobility in Ukraine: town 20 000 - 50 000 inhabitants):
The 13 billion Euro gap, GIZ, April 2014
133
2% 2%
16%
57% 23% 29 | P a g eSupport to the Implementation of the Association Agreement
and of the National Strategy in the Transport Sector in Ukraine
This project is funded Update / Upgrade National Transport Strategy 2030
by the European Union
PART 1: Transport Sector Policy Note
The increasing popularity of private cars has cities firmly in its grip. Congestions, accidents, lack of
parking space, air pollution and overcrowded buses and trains affect urban transport users alike.
Urban transport services and infrastructure have encountered enormous devastation. Many tram and
trolley bus systems are in danger of being shut down due to the lack of investments in rolling stocks and
infrastructure. The investment in rolling stock has stopped at early nineties.
Inadequate tariff regulations underfinanced investments and only partially compensated free-rider
privileges are major reasons.
The low fares, limited investments, declining service quality and ridership resulting in ever less revenues
are all visible in any cities.
Fuel taxis are a major income sources for public budgets. Low fuel prices create hjgher use of private
cars. Transport fares are comparatively low, single trip fares are low and so monthly passes are not
attractive. There is also lack of integration of fares for all public transport modes.
Pedestrians and cyclists are involved in traffic accidents, mainly because of high speed of motorised
traffic and lack of safe cycling lines and road crossings.
The investment in sustainable urban mobility is hampered by outdated standards and regulations as
well as insufficiently staffed and equipped institutions. In most cities, responsibilities in transport are
spread over a wide range of stakeholders that limits the identification and implementation of projects to
improve the mobility.
The overall investment need of a comprehensive investment scenario of Urban transport development
was estimated to 13 495 600 000 (GIZ, Urban Mobility in Ukraine: The 13 billion Euro gap, April 2014).
This includes rehabilitation of tram tracks, trolley track, rehabilitation of or procurement of new trams,
trolleybuses and buses, road safety measures, mobility planning, etc.
Figure: Investment needs in urban transport in Ukraine
Million Eur
Tram system Improvement
Trolley Bus Improvement
Bus improvements
Non-motorised Transport- Million Eur
Cycling
Non-motorised Transport -
Road Safety & Walking
Strategic Planning&Transport
Management
0 2000 4000 6000
Source: GIZ: Urban Mobility in Ukraine: The 13 billion Euro gap, April 2014
30 | P a g eSupport to the Implementation of the Association Agreement
and of the National Strategy in the Transport Sector in Ukraine
This project is funded Update / Upgrade National Transport Strategy 2030
by the European Union
PART 1: Transport Sector Policy Note
The governmental bodies (Ministry of regional Development and Ministry of Infrastructure) have to re-
assess their roles on respect of urban mobility. A national urban transport funds needs be established to
tackle immediate deficit in quality of urban transport infrastructure.
3.2.7 EXPORT/IMPORT AND TRANSIT
Export/Import
Due to stagnating economy, the volumes of Ukrainian exports went down from 63.3 bn USD in 2013 to
38.1 bn USD in 2015 or by 39.8 %. At the same time imports reduced from 76.96 bn USD in 2013 to 37.
5bn USD in 2015 or by 51.3 %. During the 1st semester of 2016 the same tendency continued: exports
reduced by 11.5% yoy and imports – by 6.2% yoy.
As for commodity structure of Ukrainian imports, growth is observed in live animals, animal products,
sugar and confectionery, cork and cork articles , straw articles , silks and textile fibres, hats, processed
feather and down. Growing export commodities include plant products, cereals, base metals and
corresponding articles, ferrous metals and machines, equipment and mechanisms, electric and technical
equipment.
Commodity structure of Ukrainian foreign trade, January-May 20161
Commodity groups Exports Imports
th.USD % yoy % in th.USD % yoy % in
exports imports
Total, including: 13 693 732.7 88.5 100.0 14 387 694.0 93.8 100.0
II. Plant products 2934160.4 101.7 21.4 697895.2 110.5 4.9
10 cereals 2326669.0 102.2 17.0 113727.5 86.7 0.8
III.15 Animal or plant 1597632.6 121.1 11.7 93591.1 146.1 0.7
fats and oils
V. Mineral products 1004606.5 76.5 7.3 2663596.6 48.4 18.5
XV. Base metals and 3124852.8 73.8 22.8 834730.1 113.3 5.8
preparations thereof
72 ferrous metals 2713611.1 75.3 19.8 288569.7 114.6 2.0
ХVІ. Machines, 1401275.2 89.9 10.3 2766917.5 127.4 19.2
equipment and
mechanisms, electric
and technical
equipment
ХVІ. Machines, 1401275.2 89.9 10.3 2766917.5 127.4 19.2
equipment and
mechanisms, electric
and technical
31 | P a g eSupport to the Implementation of the Association Agreement
and of the National Strategy in the Transport Sector in Ukraine
This project is funded Update / Upgrade National Transport Strategy 2030
by the European Union
PART 1: Transport Sector Policy Note
equipment
84 nuclear reactors, 570059.7 73.9 4.2 1654288.0 138.2 11.5
boilers, machines
85 electric machines 831215.5 105.5 6.1 1112629.5 114.1 7.7
XVII. Ground, air and 210724.8 85.6 1.5 1062657.3 179.7 7.4
water transport
facilities
87 ground transport 54299.3 73.0 0.4 1026928.3 188.2 7.1
facilities excluding
railway
1
Excluding the temporarily occupied territories of AR Crimea, the city of Sevastopol and part of the anti-
terrorist operation zone.
Source: StateSstatistics Office of Ukraine
Transit
In 2014 transit freight accounted for ca. 13% of foreign freight transported by all transport modes
except pipelines (66.5% for exports and 19.7% for imports).
Structure of foreign freight transport, excluding pipelines
Source: State Statistical Office of Ukraine
In 2010-2014 Ukraine lost 1/3 of its transit traffic. The most concerned by transit are railways (by 34%)
and maritime transport (78.2%), while the road transit recorded a growth (26%).
Structure of cargo transit by modes of transport, th. tones, 2010-2014
2010 2011 2012 2013 2014 1
Road 4 649.12 5 011.20 4 850.03 5 584.97 5 863.86
32 | P a g eYou can also read