Part 3.5: Site-Specific Loss Adjustments - Market Manual 3: Metering PUBLIC - Independent Electricity ...
←
→
Page content transcription
If your browser does not render page correctly, please read the page content below
PUBLIC                                                   MDP_PRO_0011

PROCEDURE
                 Market Manual 3: Metering

            Part 3.5: Site-Specific
               Loss Adjustments
                                                     Issue 9.0

                                 This document provides guidance to metering
                             service providers on how to calculate and submit
                            Site-Specific Loss Adjustments (SSLA) to the IMO.

                   Public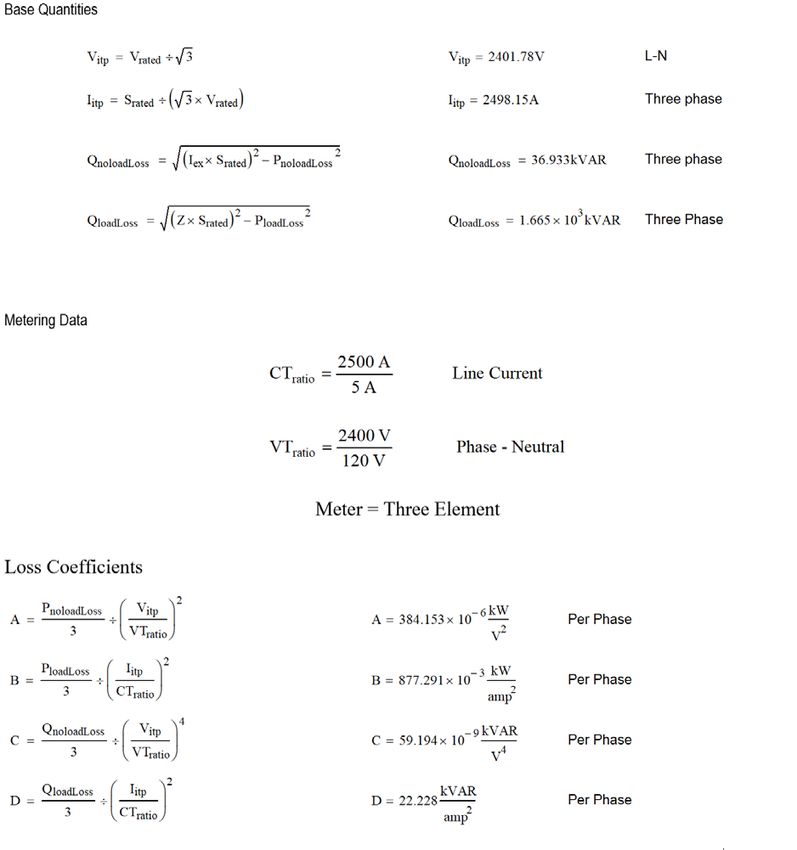
Disclaimer
        The posting of documents on this Web site is done for the convenience of market participants and
        other interested visitors to the IESO Web site. Please be advised that, while the IESO attempts to
        have all posted documents conform to the original, changes can result from the original, including
        changes resulting from the programs used to format the documents for posting on the Web site as well
        as from the programs used by the viewer to download and read the documents. The IESO makes no
        representation or warranty, express or implied, that the documents on this Web site are exact
        reproductions of the original documents listed. In addition, the documents and information posted on
        this Web site are subject to change. The IESO may revise, withdraw or make final these materials at
        any time at its sole discretion without further notice. It is solely your responsibility to ensure that you
        are using up-to-date documents and information.
        This market manual may contain a summary of a particular market rule. Where provided, the
        summary has been used because of the length of the market rule itself. The reader should be aware,
        however, that where a market rule is applicable, the obligation that needs to be met is as stated in the
        ”Market Rules”. To the extent of any discrepancy or inconsistency between the provisions of a
        particular market rule and the summary, the provision of the market rule shall govern.

Document ID                 MDP_PRO_0011
Document Name               Part 3.5: Site-Specific Loss Adjustments
Issue                       Issue 9.0
Reason for Issue            Issue released for Baseline 44.1
Effective Date              December 2, 2020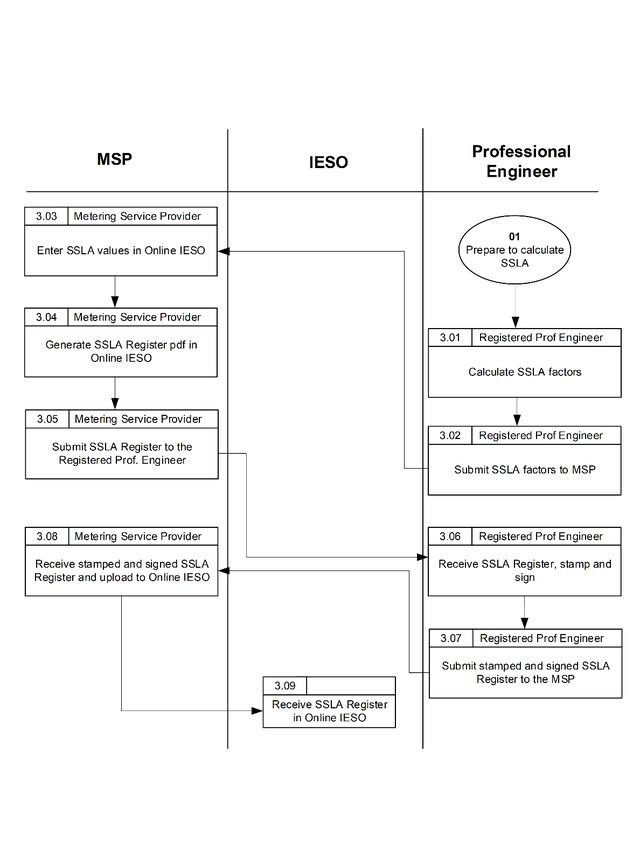
Part 3.5: Site-Specific Loss Adjustments                                              Document Change History

        Document Change History
          Issue             Reason for Issue                                   Date
          1.0               Approved by IMO Board                              April 7, 2000
          2.0               Board approved version released for Baseline 3.0   June 2, 2000
          3.0               Unapproved version for Baseline 5.0                January 8, 2001
          4.0               Issue released for Baseline 7.0                    January 16, 2002
          5.0               Issue released for Baseline 9.1                    June 4, 2003
          6.0               Issue released for Baseline 15.0                   March 8, 2006
          7.0               Updated for Baseline 28.0                          September 12, 2012
          8.0               Issue Released for Baseline 33.1                   June 3, 2015
          9.0               Updated for Baseline 44.1                          December 2, 2020

        Related Documents
          Document ID                 Document Title

          N/A

Issue 9.0 – December 2, 2020                                   Public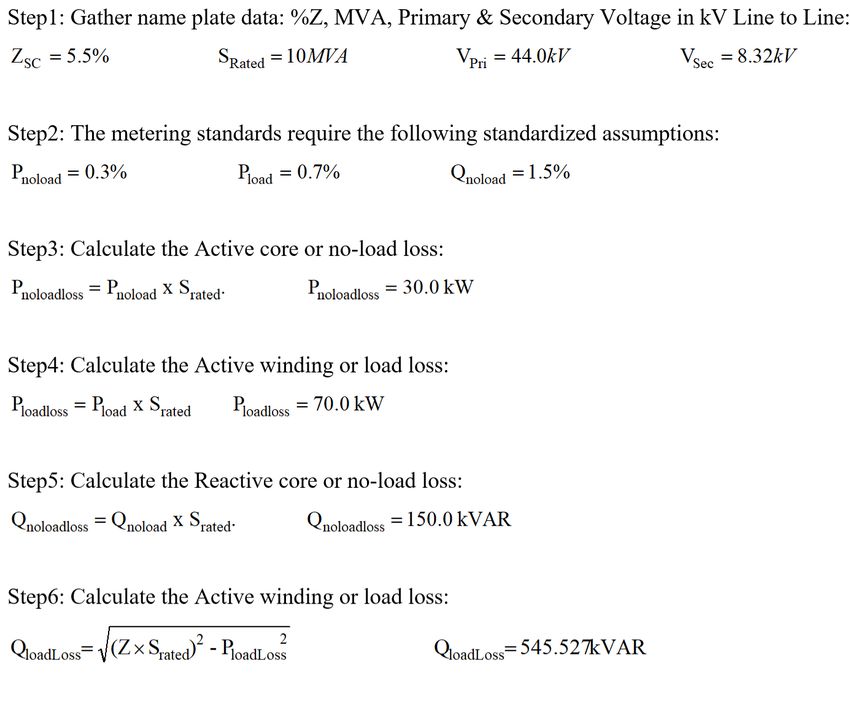
Part 3.5: Site-Specific Loss Adjustments                                                                                          Table of Contents

        Table of Contents
        Table of Contents.......................................................................................................... i

        List of Figures            .......................................................................................................... ii

        List of Tables             ......................................................................................................... iii

        Table of Changes ........................................................................................................ iv

        Market Manuals 1

        Market Procedures ...................................................................................................... 1

        1.     Introduction .......................................................................................................... 2
               1.1       Purpose ........................................................................................................ 2
               1.2       Scope ........................................................................................................... 2
               1.3       Overview ....................................................................................................... 2
               1.4       Roles and Responsibilities ............................................................................. 3
               1.5       Contact Information ....................................................................................... 3

        2.     Procedural Work Flow ......................................................................................... 5

        Appendix A:                Forms ......................................................................................... A–1

        Appendix B:                Method 1 - Volt Squared and Amp Squared Coefficients
           (A,B,C,D)               ..................................................................................................... B–1

        Appendix C:                Method 2 - Equation Coefficients (K1, K2, K3) ..................... C–1

        References                 .......................................................................................................... 1

Issue 9.0 – December 2, 2020                                               Public                                                                     i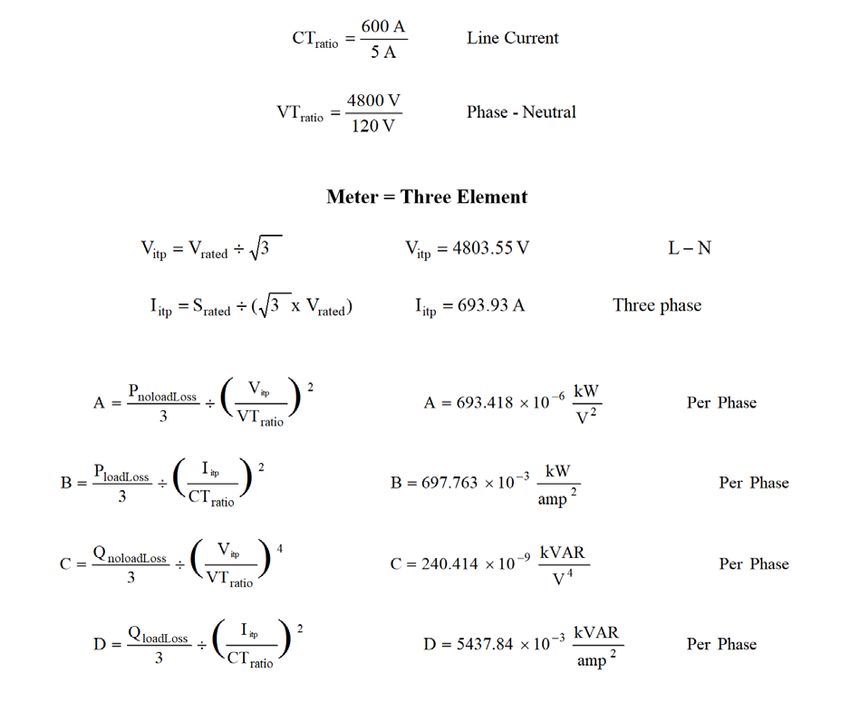
List of Figures                                                                                                            MDP_PRO_0011

         List of Figures
         Figure 2–1: Procedural Work Flow for Site-Specific Loss Adjustments (SSLA) .................... 6
         Figure B-1: Metering Installation for which Site Specific Loss Adjustments are
             Calculated .............................................................................................................B–1
         Figure B-2: Metering Data for the Metering Installation shown in Figure B-1 ....................B–2
         Figure B-3: Factory Test Results for Transformer 1 ........................................................B–2
         Figure B-4: Calculation of Transformer 1Losses .............................................................B–3
         Figure B-5: Calculation of Loss Coefficients for Transformer 1 ........................................B–3
         Figure B-6: Metering Data .............................................................................................B–4
         Figure B-7: Calculation of Loss Coefficients for Two Element Metering ...........................B–4
         Figure B-8: Factory Test Results For the 18 MVA Transformer .......................................B–5
         Figure B-9: Factory Test Data for the 18 MVA Power Transformer ..................................B–5
         Figure B-10: Calculation of Loss Coefficients for the 18 MVA Transformer ......................B–6
         Figure B-11 Factory Test Results for the 50 MVA Power Transformer .............................B–7
         Figure B-12: Calculation of Loss Coefficients for 50 MVA Power Transformer .................B–8
         Figure B-13: Default Assumptions when Factory Test Results are Unavailable .............. B–10
         Figure B-14: Calculation of Loss Coefficients when Transformer Factory Test Data is
              not Available (Steps 1 to 6) .................................................................................. B–11
         Figure B-15: Calculation of Loss Coefficients when Transformer Factory Test Data is
             not Available (Step 7) ........................................................................................... B–12
         Figure B-16: Typical Metering Installation at a DESN Station ........................................ B–13
         Figure B-17: Current Transformer Summated Metering Installation ............................... B–16
         Figure C-1: Three Winding Transformer ........................................................................ C–4
         Figure C-2: TEE Model of Transformer Leakage Impedance.......................................... C–5
         Figure C-3: Equivalent Delta Model for Leakage Impedance .......................................... C–6
         Figure C-4: Double Bus Transformer Station ............................................................... C–14

ii                                                                       Public                                 Issue 9.0 – December 2, 2020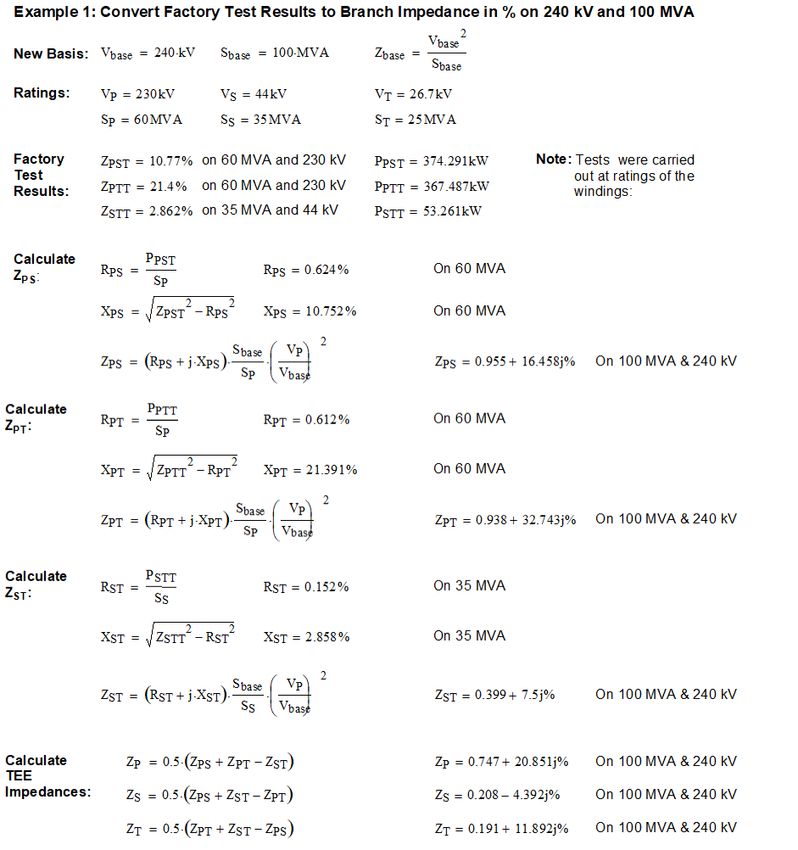
Part 3.5: Site-Specific Loss Adjustments                                                                            List of Tables

        List of Tables
        Table 2–1: Legend for Procedural Work Flow Diagrams ..................................................... 5
        Table C-1: Measured Impedance .................................................................................. C–5
        Table C-2: Per Cent or Per Unit Equations .................................................................... C–5
        Table C-3: Wye-Delta Transformation ........................................................................... C–6

Issue 9.0 – December 2, 2020                                      Public                                                             iii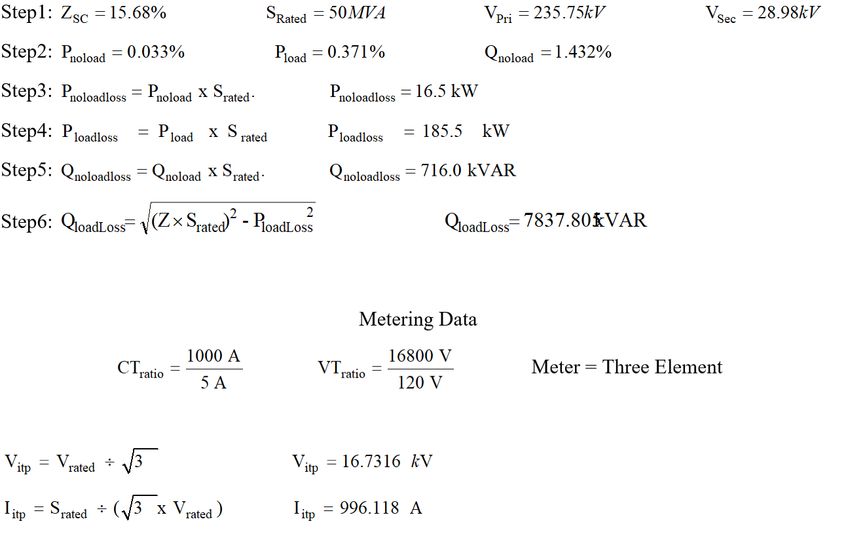
Table of Changes                                                                               MDP_PRO_0011

        Table of Changes
              Reference:                              Description of Change
          Throughout       Updated to meet accessibility requirements pursuant to the Accessibility for
          Document         Ontarians with Disabilities Act.

iv                                                     Public                         Issue 9.0 – December 2, 2020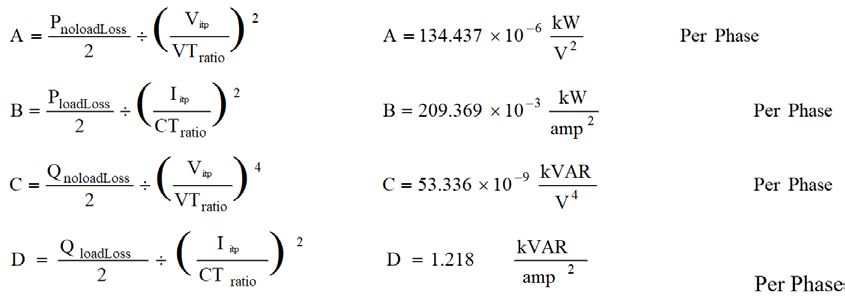
Part 3.5: Site-Specific Loss Adjustments                                                              Market Manuals

        Market Manuals
        The market manuals consolidate external procedures and associated forms, standards, and policies
        that define specific elements relating to the operation of the IESO-administered markets. External
        procedures are guides for the use of market participants that provide a more detailed description of
        the requirements for various activities than is specified in the “Market Rules”. Standards and policies
        provide a supporting framework for the external procedures. Where there is a discrepancy between
        the requirements in a document within a market manual and the “Market Rules”, the ”Market Rules”
        shall prevail. (Chapter 1, Section 7.6A.1)

        Market Procedures
        This document is Volume 3.5 of the market manuals, where:
        •    ”Market Manual 3” is the ”Metering Manual”, and
        •    Part 5 describes the ”Site Specific Loss Adjustments (SSLA)” procedure.
        A list of the other component parts of the “Metering Manual” is provided in “Part 3.0: Metering
        Overview”.

        Structure of Market Procedures
        Each market procedure is composed of the following sections:
               1. “Introduction”, which contains general information about the procedure, including an
                  overview, a description of the purpose and scope of the procedure, and information about
                  roles and responsibilities of the parties involved in the procedure.
               2. “Procedural Work Flow”, which contains a graphical representation of the steps and flow
                  of information within the procedure.
               3. “Procedural Steps”, which contains a table that describes each step and provides other
                  details related to each step.
               4. “Appendices”, which may include such items as forms, standards, policies, and agreements.

        Conventions
        The market manual standard conventions are defined in the “Market Manual Overview” document.

                                                  – End of Section –

Issue 9.0 – December 2, 2020                                Public                                                     1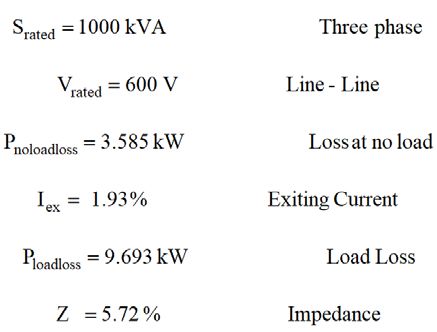
1. Introduction                                                                                            MDP_PRO_0011

         1.             Introduction

         1.1            Purpose
         This procedure describes how to calculate and submit Site-Specific Loss Adjustments (SSLA) to the
         IESO.

         1.2            Scope
         This procedure is intended to provide market participants with a summary of the steps and interfaces
         between market participants, the IESO and other parties for performing site-specific loss adjustment.
         The procedural steps and work flows described in this document serve as a roadmap for market
         participants and the IESO, and should be used in conjunction with the ”Market Rules”. The overview
         information in Section 1.3, below, which is provided for convenience of reference only, highlights the
         main actions that comprise the procedure as described in greater detail in later sections of this
         document. For further information see “IESO Standard Site Specific Loss Adjustments –
         Requirements for Adjustment of Meter Readings for Site-Specific Losses in the IESO-Administered
         Market (SSLA standard)”.
         Site-specific loss adjustments apply to metering service providers (MSPs) and all metering
         installations in the IESO-administered markets.
         Loss adjustments are required for:
                  •   radial line loss (voltage-dependent loss and current-dependent loss); and
                  •   transformer loss (voltage-dependent power loss and current-dependent power loss).

         1.3            Overview
         The ”Market Rules” include requirements that are designed to ensure the equitable treatment of all
         metered market participants (MMPs) in terms of measurement in the context of the IESO-
         administered markets. To promote maximum measurement accuracy, the meter point of a wholesale
         meter is required to be located as close as possible to the defined meter point for each connection
         point. (Chapter 6, Section 4.2.1.1) When this is not the case, data obtained from the metering
         installation requires site-specific loss adjustment (SSLA). (Chapter 6, Section 4.2.3) The adjusted
         readings reflect the readings that would have been obtained if the metering were installed at the
         defined meter point. (Chapter 6, Section 4.2.4)
         Site-specific loss adjustments are calculated for both power transformers and radial transmission
         lines. The IESO provides separate loss models for lines and transformers, respectively.
         At the time that the meter point associated with a metering installation is registered, the metering
         service provider must submit SSLA coefficients to the IESO using the SSLA register available on the
         IESO’s Web site. See also “Market Manual 3: Metering, Part 3.2: Meter Point Registration and
         Maintenance”. When loss adjustments are required to be provided to the IESO, the metering service
         provider must also ensure that the SSLA register containing the final loss adjustment coefficients is
         stamped and signed by a registered professional engineer. Site-specific loss adjustments are then re-

2                                                               Public                            Issue 9.0 – December 2, 2020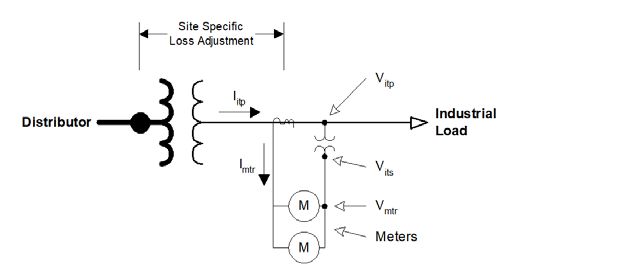
Part 3.5: Site-Specific Loss Adjustments                                                                 1. Introduction

        submitted by the metering service provider during the submission of totalization tables. For details,
        see Market Manual 3: Metering Part 3.7: Totalization Table Registration.
        Examples of the manner in which loss coefficients may be calculated are set forth in Appendix B.
        Additional calculation examples and supplementary information may be found in the SSLA Standard.
        Additional SSLA-relevant information may also be found in the ”IESO Standard Wholesale Revenue
        Metering Standard-Hardware”. Additional information of loss calculation for the settlement system
        can be found in the MDMS Reference Guide – Loss Equations.
        At the present time, the settlement system will only adjust losses for Active Energy (kWh). MSPs
        must submit an SSLA register that contains coefficients for all applicable kWh related loss
        components (A,B,E,F,K1,K2,K3). At the present time the IESO will accept SSLA registers that do
        not include kVARh related coefficients (C,D,G,H,K4,K5,K6). However, when the settlement system
        is modified to adjust losses for Reactive Energy (kVARh), the active MSP responsible for a metering
        installation for which the SSLA register on file with the IESO does not contain kVARh related
        coefficients (C,D,G,H,K4,K5,K6) will be required to submit a revised SSLA register including these
        coefficients.

        1.4            Roles and Responsibilities
        Responsibility for carrying out site-specific loss adjustments is shared among:
               •   Metering service providers, which are responsible for:
                   •   providing valid and accurate SSLA coefficients for radial line loss (voltage-dependent
                       loss and current-dependent loss);
                   •   providing valid and accurate SSLA coefficients for transformer loss (voltage-dependent
                       power loss and current-dependent power loss);
                   •   ensuring that a registered professional engineer stamps and signs the SSLA Register;
                   •   submitting SSLA information to the IESO at the time of meter point registration; and
                   •   re-submitting SSLA when necessary by following the relevant change process
                       described in ”Market Manual 3: Metering, Part 3.2: Metering Point Registration.
               •   The IESO, which is responsible for:
                   •   defining loss adjustment models and submission format; and
                   •   receiving and reviewing SSLA loss adjustment coefficients.

        1.5            Contact Information
        If the market participant wishes to contact the IESO, the market participant can contact the IESO
        Customer Relations via email at customer.relations@ieso.ca or via telephone, mail or courier to the
        numbers and addresses given on the IESO’s Web site ((http://www.ieso.ca) If the IESO Customer
        Relations is closed, telephone messages or emails may be left in relevant voice or electronic IESO
        mail boxes, which will be answered as soon as possible by Customer Relations staff.
        Standard forms that participants must complete for this procedure are listed in Appendix A. These
        forms are generally available for downloading on the IESO’s public Web site. The Site Specific Loss
        Adjustment Register must be generated and submitted to the IESO using Online IESO
        (https://online.ieso.ca).

Issue 9.0 – December 2, 2020                                Public                                                         3
1. Introduction MDP_PRO_0011
– End of Section –
4 Public Issue 9.0 – December 2, 2020Part 3.5: Site-Specific Loss Adjustments 2. Procedural Work Flow
2. Procedural Work Flow
The following diagram represents the flow of work and information related to Site-Specific Loss
Adjustments (SSLA) among the IESO, the metering service provider and the Registered Professional
Engineer.
The steps illustrated in the diagram are described in detail in Section 3.
Table 2–1: Legend for Procedural Work Flow Diagrams
Legend Description
Oval An event that triggers task or that completes task. Trigger events and
completion events are numbered sequentially within procedure (01 to 99).
Task Box Shows reference number, party responsible for performing task (if “other
party”), and task name or brief summary of task. Reference number (e.g.,
1A.02) indicates procedure number within current market manual (1),
subprocedure identifier (if applicable) (A), and task number (02).
Solid horizontal Shows information flow between the IESO and external parties.
line
Solid vertical line Shows linkage between tasks.
Broken line Links trigger events and completion events to preceding or succeeding task.
Issue 9.0 – December 2, 2020 Public 52. Procedural Work Flow MDP_PRO_0011
Figure 2–1: Procedural Work Flow for Site-Specific Loss Adjustments (SSLA)
– End of Section –
6 Public Issue 9.0 – December 2, 2020Part 3.5: Site-Specific Loss Adjustments Appendix A: Forms
Appendix A: Forms
This appendix contains a list of the forms and letters associated with the SSLA procedure, which are
available on the IESO’s public Web site (http://www.ieso.ca). The forms and letters included are as
follows:
Form Name Form Number
Totalization Table Form IMO-FORM-1310
– End of Section –
Issue 9.0 – June 3, 2015 Public A–1Part 3.5: Site-Specific Loss Adjustments Appendix B: Method 1 - Volt Squared and Amp Squared Coefficients (A,B,C,D)
Appendix B: Method 1 - Volt Squared and
Amp Squared Coefficients
(A,B,C,D)
B.1 Introduction
The ”Market Rules” permit a metering installation to be registered notwithstanding that the meter
point is not located at the defined meter point, if appropriate site-specific loss adjustment parameters
are provided at the time of registration. (Chapter 6, Section 4.2.4) This may mean adjusting for losses
in a radial line or in a power transformer.
This appendix provides additional examples showing how loss coefficients can be developed for
power transformers in compliance with the SSLA Standard posted at www.ieso.ca.
In most cases, factory test results for impedance and load loss are available and loss calculations are
based on these test results. In cases where the factory test results have been lost, the SSLA Standard
requires the use of default transformer parameters. Use of default assumptions is illustrated below.
All metering installations that comply with the IESO requirements will record volt squared and
ampere squared hours per element. Use of these figures achieves the best accuracy. For metering
installations that are permitted to be registered even if they do not record volt squared, amp squared
or var hours, the use of standard loss coefficients is also possible. The calculation of such coefficients
is illustrated below.
B.2 Fixed Tap Power Transformer on Rated Tap
The figure below illustrates a typical situation requiring site specific loss adjustments for active and
reactive power.
Figure B-1: Metering Installation for which Site Specific Loss Adjustments are Calculated
In this example, the metering installation has been installed on the secondary side of the power
transformer but the defined meter point is on the high voltage side. The power transformer is a 1000
kVA, 44kV/600V, delta-wye grounded. The transformer does not have an under load tap changer but
Issue 9.0 – December 2, 2020 Public B–1Appendix B:Method 1 - Volt Squared and Amp Squared Coefficients (A,B,C,D) MDP_PRO_0011
the high voltage winding has fixed taps at 44.0, 41.8, 42.9, 45.1 and 46.2 kV. The transformer is
operating on the 44.0 kV tap, which is the nominal, or principal tap.
Meter = Three Element
Figure B-2: Metering Data for the Metering Installation shown in Figure B-1
The factory test results for transformer 1
Figure B-3: Factory Test Results for Transformer 1
B–2 Public Issue 9.0 – December 2, 2020Part 3.5: Site-Specific Loss Adjustments Appendix B: Method 1 - Volt Squared and Amp Squared Coefficients (A,B,C,D)
Calculation of Transformer 1 Losses from Factory Test Results
Figure B-4: Calculation of Transformer 1 Losses
Calculation of Loss Coefficients for Transformer 1
Figure B-5: Calculation of Loss Coefficients for Transformer 1
NOTE: Non-Blondel metering installations waivered into the IESO-administered Markets after seal-
expiry may use a 2 ½ element meter provided that: the compliant Main meter can 1) calculate the
missing voltage and 2) record the volt square hour (missing voltage) in channel 6 for each interval.
Issue 9.0 – December 2, 2020 Public B–3Appendix B:Method 1 - Volt Squared and Amp Squared Coefficients (A,B,C,D) MDP_PRO_0011
B.3 Delta Connected Metering Installations
This example shows how to calculate loss coefficients for two-element metering installations. For
this example, it is assumed that the transformer has a delta-connected secondary and that a two-
element meter is used to measure the power flow on the secondary.
Meter = Two Element
Figure B-6: Metering Data
The factory test results are as shown in Figure B-3. The transformer losses are calculated as shown in
Figure B-4. The loss coefficients, however, are not the same as for three element metering. Their
calculation is shown below.
Figure B-7: Calculation of Loss Coefficients for Two Element Metering
B–4 Public Issue 9.0 – December 2, 2020Part 3.5: Site-Specific Loss Adjustments Appendix B: Method 1 - Volt Squared and Amp Squared Coefficients (A,B,C,D)
B.4 Power Transformer Off Principal Tap
System voltage conditions often require that transformers be placed into service on a tap other than
the principal or nominal tap. Since CSA and ANSI require factory testing at the principal and at the
extreme taps only, the factory test results may not have the loss figures for every tap. This example
shows how to apply linear interpolation when the power transformer is not on the principal tap.
In this example, the factory test data refers to an 18 MVA, 130/4.16 kV power transformer. The
transformer has five primary taps, ±10% in 5% steps. The transformer is in service on tap 2. The
secondary taps are fixed. The factory test results are shown below.
Figure B-8: Factory Test Results For the 18 MVA Transformer
Linear interpolation is required to determine the load loss and percentage impedance on tap 2.
Srated = 18 MVA Three phase
Vrated = 4.160 kV Line-Line on secondary
PnoloadLoss = 16.62 kW Loss at no load
Iex = 0.225% Exiting Current
Linear Interpolation for Off Nominal Tap
Load Loss:
PloadLoss = 67.49 ⋅kW +
63.909 ⋅kW − 67.490 ⋅kW ( 2 − 3) P
loadLoss = 65.7 kW
1−3
Impedance:
Z = 9.32 ⋅% +
9.19 ⋅% − 9.32 ⋅% ( 2 − 3)
Z = 9.255 %
1−3
Figure B-9: Factory Test Data for the 18 MVA Power Transformer
Three-element metering is installed on the secondary side of the power transformer.
The loss coefficients are as follows:
Issue 9.0 – December 2, 2020 Public B–5Appendix B:Method 1 - Volt Squared and Amp Squared Coefficients (A,B,C,D) MDP_PRO_0011
Figure B-10: Calculation of Loss Coefficients for the 18 MVA Transformer
B–6 Public Issue 9.0 – December 2, 2020Part 3.5: Site-Specific Loss Adjustments Appendix B: Method 1 - Volt Squared and Amp Squared Coefficients (A,B,C,D)
B.5 Power Transformer with ULTC
In applications requiring voltage regulation or line drop compensation, power transformers are fitted
with under load tap changers (ULTC). These are motor-driven devices that can alter the number of
turns in either the low voltage or high voltage winding.
In addition, the winding without ULTC may also be fitted with fixed taps. For example, should the
ULTC be on the secondary winding, the primary may have fixed tap positions.
CSA and ANSI standards require that impedance and load loss be determined at the principal and
extreme taps.
Loss coefficients for transformers fitted with ULTC will be calculated based on the fixed tap used in
operation and the average tap position of the ULTC. This would normally be determined by
observation, documented in the periodic reading sheets and include seasonal variation. Linear
interpolation would be applied if these positions are between tested positions. If reading sheets are not
available, the fixed tap used in operation and the ULTC tap with the highest loss will be used as the
basis for the calculation of loss coefficients.
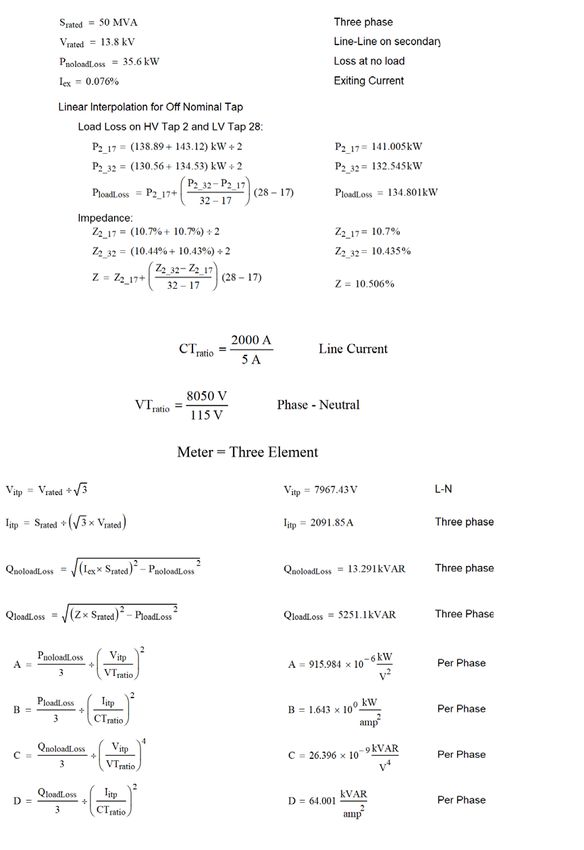
The transformer for this example is rated at 50 MVA, 230/13.8 kV. The factory test results are as
shown below.
Figure B-11 Factory Test Results for the 50 MVA Power Transformer
The high voltage winding is on service on tap 2 and the average tap position of the ULTC on the
secondary winding is tap 28.
The metering installation is on the low voltage side and has three elements. The loss coefficients are
calculated as shown in Figure B-12:
Issue 9.0 – December 2, 2020 Public B–7Appendix B:Method 1 - Volt Squared and Amp Squared Coefficients (A,B,C,D) MDP_PRO_0011
Figure B-12: Calculation of Loss Coefficients for 50 MVA Power Transformer
B–8 Public Issue 9.0 – December 2, 2020Part 3.5: Site-Specific Loss Adjustments Appendix B: Method 1 - Volt Squared and Amp Squared Coefficients (A,B,C,D)
B.6 Calculation Of Loss Coefficients When Factory Test
Results Are Unavailable
B.6.1 Requirement for Loss Coefficients
The loss coefficients for power transformers are normally calculated based on iron and copper losses
measured in the factory at the time of manufacture. Since factory test results are not available for all
power transformers, the SSLA Standard requires the application of standardized assumptions.
This section shows how loss coefficients may be calculated for power transformers when factory test
results are unavailable.
B.6.2 Default Assumptions for Power Transformers Losses
The standard assumptions for loses in power transformers are as follows:
Active Power Loss at Rated Load 0.7%
Active Power Loss at No-Load 0.3%
Reactive Power Loss at No-Load 1.5%
This data is combined with information available on the nameplate of the transformer. Together the
two sets of information provide the details required for calculating the required loss coefficients.
B.6.3 Other Transformer Information Required
Both CSA and ANSI standards require that the following information be displayed on the nameplate
of the power transformer and the nameplates of the instrument transformers connected to the
metering.
Apparent Power Rating kVA or MVA
Rated High Voltage kV phase to phase
Rated Low Voltage kV phase to phase
Impedance on Short Circuit Percent of rated
Test voltage
Current transformer ratio To 5A Secondary
Voltage transformer ratio To 120V Secondary
Issue 9.0 – December 2, 2020 Public B–9Appendix B:Method 1 - Volt Squared and Amp Squared Coefficients (A,B,C,D) MDP_PRO_0011
B.6.4 Equivalent Circuit
Shown below is the equivalent circuit upon which the loss coefficients are calculated. The no-load
losses occur in the core of the transformer. No-load loss is often termed iron loss or core loss. No-
load losses are a function of the voltage applied to the power transformer.
The load loss occurs in the windings and is often termed copper loss or winding loss. Load loss is a
function of the current delivered by the power transformer.
Figure B-13: Default Assumptions when Factory Test Results are Unavailable
B.6.5 Example of Steps for Calculation of Loss Coefficients when
Factory Test Data is not Available
The loss coefficients are calculated as constants of proportionality based on the losses at the rated
load.
B–10 Public Issue 9.0 – December 2, 2020Part 3.5: Site-Specific Loss Adjustments Appendix B: Method 1 - Volt Squared and Amp Squared Coefficients (A,B,C,D)
Figure B-14: Calculation of Loss Coefficients when Transformer Factory Test Data is not
Available (Steps 1 to 6)
Issue 9.0 – December 2, 2020 Public B–11Appendix B:Method 1 - Volt Squared and Amp Squared Coefficients (A,B,C,D) MDP_PRO_0011
Step7: Calculate the Loss Coefficients for Power Transformer:
Figure B-15: Calculation of Loss Coefficients when Transformer Factory Test Data is not
Available (Step 7)
B.7 Existing Metering Does Not Record amp-squared-
hours, volt-squared-hours
Meters that were in service on April 17, 2000 or that are part of a metering installation that was the
subject of an application for registration prior to the market commencement date, and for which major
components were ordered or procured prior to April 17, 2000, and which do not record amp-squared-
hours, volt-squared-hours or kVARH need not be replaced until the Measurement Canada seal
expires. (Chapter 6-Appendices, Appendix 6.2, Section 1.1.1 and 1.1A)
For these metering installations, the IESO will use, for calculation purposes, the Assumed Voltage ,
where secondary voltage, assumed power factor, service type, ct ratio and pt ratio are provided by the
Metering Service Provider. The IESO software system will then calculate both amp-squared-hours
and volt-squared-hours for each interval. A secondary voltage of 120 volts and a power factor of 0.95
will be used as default values, if not specified.
B–12 Public Issue 9.0 – December 2, 2020Part 3.5: Site-Specific Loss Adjustments Appendix B: Method 1 - Volt Squared and Amp Squared Coefficients (A,B,C,D)
This calculation will also be used when the Main meter fails (amp-squared-hours and/or volt-squared-
hours are not available). This calculation only applies to Method 1.
B.8 Connected Transformation Serving a Single Metered
Market Participant
B.8.1 Introduction
The most common multi-transformer installation is the “Jones” station, or the dual element spot
network (DESN). The DESN is a load serving facility consisting of two power transformers supplied
from different high voltage circuits. The secondaries are bussed together through a normally closed
breaker.
The facility has two defined meter points, both located on the high voltage side of the power
transformers. Revenue metering may be installed at the defined meter point, in which case no site
specific loss adjustments are required. This method is to be applied when revenue metering is
installed on the low voltage side of a power transformer.
The IESO requires individual metering to be installed on each power transformer when the metering
installations is installed on the low voltage side of a DESN substation. Loss adjustments for such
installations are the same as for single transformer installations.
B.8.2 Individually Metered Power Transformers
Figure B-16, below, illustrates the individual metering at a DESN substation.
Figure B-16: Typical Metering Installation at a DESN Station
Issue 9.0 – December 2, 2020 Public B–13Appendix B:Method 1 - Volt Squared and Amp Squared Coefficients (A,B,C,D) MDP_PRO_0011
B.8.3 Loss Calculation At The IESO
For settlement purposes, the total energy consumption at each point of sale must be calculated. This
calculation comprises the metered energy and the losses in the power transformer connected to each
defined meter point.
Loss coefficients are developed for each power transformer based on the factory test data. The amp
squared hours and volt squared hours recorded by the metering installation are used to calculate the
losses in each power transformer as part of the settlement process. The calculated losses are added to
the metered energy in order to obtain the total consumption at each defined meter point.
B.8.4 Factory Test Data for Power Transformers
Factory test data for the power transformers at the DESN station in Figure B-19 is provided below,
together with the operating tap positions.
Parameter Transformer 1 Transformer 2
MVA Rating 50 MVA 50 MVA
Rated Primary Voltage 230 kV 230 kV
Rated Secondary Voltage 27.6 kV 27.6 kV
High Voltage Taps ± 10% in 4 Steps ± 10% in 4 Steps
Secondary ULTC ± 10% in 32 Steps ± 10% in 32 Steps
HV Tap Position Tap 4 (235.75 kV) Tap 4 (235.75 kV)
Most Frequent LV Tap Tap 25 (28.98 kV) Tap 25 (28.98 kV)
The losses and impedance depend on the high voltage fixed tap position and the most frequently
occurring ULTC tap position. The table below shows the data listed in the factory test results for
each power transformer on the operating tap positions of HV Tap 4 and LV Tap 25:
Parameter Transformer 1 Transformer 2
Impedance on Taps 15.68% 15.71%
No-Load kW Loss 0.033% 0.032%
No-Load kVAR Loss 1.432% 1.453%
Load kW Loss 0.371% 0.393%
B–14 Public Issue 9.0 – December 2, 2020Part 3.5: Site-Specific Loss Adjustments Appendix B: Method 1 - Volt Squared and Amp Squared Coefficients (A,B,C,D)
B.8.5 Loss Coefficients for the Power Transformers
Based on the factory test results for Transformer 1::
Follow same steps, for Transformer 2
Therefore, the loss coefficients required for settlement purposes are as follows:
Coefficient Transformer 1 Transformer 2 Unit
A 385.073E-6 373.404E-6 kW/V2
B 2.4926 2.6405 kW/Amp2
C 1.1699E-6 1.1871E-6 kVAR/V4
D 105.3201 105.5181 kVAR/Amp2
Issue 9.0 – December 2, 2020 Public B–15Appendix B:Method 1 - Volt Squared and Amp Squared Coefficients (A,B,C,D) MDP_PRO_0011
B.8.6 Current Transformer Summated DESN Station
Background
At certain DESN transformer stations built before April 17, 2000, current transformer summation was
used to measure the “station total” consumption.
Division of Load
The total power measured by the meter is assumed to be carried in fixed proportions by each of the
two power transformers. At the DESN station shown in figure B-17, transformer T1 is observed to
carry 48% on the total current delivered to the 27.6 kV bus.
In the absence of better information, the IESOwill assume that the current divides equally between
power transformers of the same MVA rating.
Meter Connection Diagram
The figure below illustrates the current transformer summated metering connection:
Figure B-17: Current Transformer Summated Metering Installation
– End of Section –
B–16 Public Issue 9.0 – December 2, 2020Part 3.5: Site-Specific Loss Adjustments Appendix C: Method 2 - Equation Coefficients (K1, K2, K3)
Appendix C: Method 2 - Equation
Coefficients (K1, K2, K3)
C.1 Estimating Transformer Losses
Introduction to Transformer Loss Calculation
For most transformer loss calculations the primary voltage is known. The kW and kVAR loads at the
secondary and tertiary terminals are also known. An iterative solution can thus be applied to find the
voltage and current to derive the power losses at each of the secondary and tertiary terminals. Once a
solution is found, the losses can be calculated as the difference between the power in and the power
out. Alternatively the I2R and I2X in each branch of the circuit can be summed to arrive at the
transformer losses.
Power transformers are affected by iron and copper losses. Iron loss is also known as core loss or
excitation. Copper losses are often termed winding loss or load loss.
Transformers are tested in the factory to establish the load and excitation losses. Load losses are
measured by testing pairs of windings and recording the results of each test in the factory test report.
Before loss calculations can be carried out, the "pair wise" test results must be converted into
equivalent TEE impedances which will carry the specified loads to the secondary and tertiary
terminals. Losses can be calculated directly from the TEE equivalent but this is not illustrated in this
paper.
The format of the test results is standardized by ANSI. For load losses the percentage impedance and
watt loss are reported for each winding pair. The percentage impedance is usually based on the
ratings of the primary winding for tests involving it and on the ratings of the secondary winding for
the remaining test.
Excitation losses are measured by energizing one of the windings to full rated voltage, with the other
remaining open, then measuring the exciting current as a percentage of the rated current for the
winding and the watt loss.
C.1.1 Operation of Transformers in Parallel
If two or more transformers operate in parallel, the standard power flow equations may be used to
calculate losses. Example 3 demonstrates the use of the bus admittance power flow equations for loss
calculation.
Application of the bus admittance model requires that the TEE impedances be converted into branch
impedances that directly connect the primary, secondary and tertiary nodes. The wye-delta transform
is applied to eliminate the common connection point of the equivalent TEE impedances. Note that the
pair-wise test results and the equivalent delta impedances do not take on the same numeric values.
Issue 9.0 – December 2, 2020 Public C–1Appendix C:Method 2 - Equation Coefficients (K1, K2, K3) MDP_PRO_0011
C.2 No-Load Loss
Excitation Loss
The CSA Standard C88 defines the excitation loss of a transformer to be the active power absorbed
by the transformer when rated voltage is applied at rated frequency to the terminals of one of the
windings, all others being open circuited. The excitation loss includes the active power required to
overcome hysteresis loss in the iron core, dielectric loss, and the I2R loss caused by the exciting
current.
Exciting Current
The exciting current is defined in the C88 Standard as the current flowing through a line terminal
when rated voltage is applied at rated frequency, all other windings being open circuited.
Excitation Loss and Exciting Current Tests
The excitation loss and exciting current are measured in the factory at the time of manufacture. Rated
voltage is applied to one of the windings with all of the others open circuited. Before the test
commences each winding is placed on the principal tap position. The principal tap position is the
rated voltage that will appear on the transformer nameplate.
The factory test records:
• the active power loss in watts, and
• the exciting current stated in amperes or as a percentage of the stated base current, usually
the rated current for the winding being energized. The rated current is calculated from the
rated kVA or MVA and rated voltage.
The test is repeated at 110% of rated voltage. Most manufacturers do not record the active power loss
at this voltage.
Harmonic content is unavoidable, so results are stated on an equivalent sine-wave basis.
The no-load loss is independent of loading and is assumed to be constant as long as the excitation
voltage is constant, regardless of which winding supplies the excitation energy.
No-Load Loss
The no-load loss is the phasor power representing the sum of the active and reactive power required
to excite the iron core. The no-load loss is often in a per unit or percentage basis of the rated MVA
and rated kV of the highest voltage winding.
Variation with Voltage
The active power loss varies as VX where X varies from 1.6 to approximately 4 depending on the type
of magnetic material and method of manufacture. Since the watt loss for most transformers is
recorded only at nominal voltage, the true value at any other voltage cannot be determined. For this
reason the revenue metering industry has standardized on the assumption that X is equal to 2.0.
The reactive power consumed by the core is also a function of voltage and varies as VY where Y
varies from 2 to approximately 16, depending on the type of magnetic material and method of
manufacture. And because the watt loss at 110% of rated voltage is not recorded for most
transformers, the true value of Y cannot be determined. For this reason, the industry has standardized
on the assumption that Y takes the value 4.
C–2 Public Issue 9.0 – December 2, 2020Part 3.5: Site-Specific Loss Adjustments Appendix C: Method 2 - Equation Coefficients (K1, K2, K3)
C.3 Load Loss
Active Power Loss
The active power loss in the windings of a power transformer arise from I2R loss in the windings and
I2R losses due to circulating current in parallel windings and core clamps, etc.
Reactive Power Loss
The windings also consume reactive power. Some flux always leaks from the core and pass through
the air to link with the winding. Because a portion of the path followed by the leakage flux is in the
air, the permeability of the air dominates and the leakage reactance is linear thus showing almost none
of the saturation or hysteresis expected from an iron cored inductor.
Load Loss and Impedance Test
The load loss is determined in the factory by testing pairs of windings. Before the test all windings
are placed on the principal tap position. One winding of the pair is shorted out and sufficient voltage
is applied to the other to cause current, corresponding to some stated MVA base, to flow in the
shorted winding. All other windings are open-circuited.
The C88 standard states that impedance voltage on any tap is expressed on a percentage or per unit
basis of the rated voltage of the tap when current corresponding to the stated, although not necessarily
rated, MVA base is circulating through the winding. Care must be taken when carrying out load flow
and loss evaluation studies to ensure the MVA base is in the calculations.
Transformer manufacturers test the load loss and impedance voltage on the rated tap position and test
for impedance voltage on the extreme tap positions. If the transformer is not operating on one of the
tested tap positions, interpolation must be used to determine the percentage impedance on the actual
tap position before any other calculations are carried out1. Load loss is recorded in watts and is not
always recorded for tap positions other than the principal tap.
The impedance voltage for each pair of windings on the transformer nameplate is determined with all
windings in at their principal tap positions. The applied voltage is adjusted until current
corresponding to the lesser of the MVA ratings of the two windings flows through the winding that is
shorted out.
The impedance voltage is usually expressed as a percentage of the rated voltage of the tap to which
the voltage was applied. The MVA base used is stated.
The impedance voltage for each winding pair may also be adjusted to either the MVA base of the
winding to which the voltage was applied or an MVA base common to all of the windings. The
MVA base will be stated in the factory test results. Care must be used to ensure correct base values
are used in load flow and loss studies.
The loss values shown on the factory test card for load loss and impedance are adjusted to reflect a
winding temperature of the 85°C.
1
The standard equation for converting percent impedance from one base to another (SNewV2Old/SOldV2New =
ZBaseOld/ZBaseNew) assumes the impedances on each tap are known and the base voltages are in the same ratio as the
tapped voltages.
Issue 9.0 – December 2, 2020 Public C–3Appendix C:Method 2 - Equation Coefficients (K1, K2, K3) MDP_PRO_0011
Variation with Voltage
The active and reactive losses caused by the flow of load are proportional to the square of the current
in each winding. Load loss is only approximately proportional to load MVA.
Modeling No-Load Loss
If the power flow software being used for loss evaluation does not allow the no-load loss or be
evaluated at a function of voltage, valid results can still be obtained. Evaluation of site specific losses
requires that one the windings be the slack bus in the analysis.
Since the slack bus operates at fixed voltage specified before the study begins, the active and reactive
no-load losses can be evaluated at that voltage then applied to the slack bus as a fix load or as the
equivalent linear shunt impedance.
Example No-Load Loss Model
The factory test report for a three winding 60/35/25 MVA 230/44/27.6 kV transformer lists the
exciting current as 0.92% and the excitation loss as 53.2 kW. If a loss study were to be carried out
with the voltage at the 44 kV winding fixed at 46.2 kV, the active power would be 53.2 kW x
(46.2/44)2 = 58.65 kW.
The apparent power loss at rated voltage would be 0.92% x 60 MVA = 552.0 kVA. The reactive
power loss at rated voltage is (5522-58.652)1/2 = 548.9 kVAR. The reactive power loss at 46.2 kV
would be 548.9 x (46.2/44)4 = 667.19 kVAR.
C.4 Equivalent TEE Branch Impedances
The equivalent circuit of one phase of a three-winding transformer is shown below:
Figure C-1: Three Winding Transformer
where P, S & T represent the primary, secondary and tertiary windings respectively and ZP, ZS, ZT
represent the resistance and reactance of each winding.
C–4 Public Issue 9.0 – December 2, 2020Part 3.5: Site-Specific Loss Adjustments Appendix C: Method 2 - Equation Coefficients (K1, K2, K3)
The factory tests carried out by the transformer manufacturer determine the total impedance between
each pair of windings. These are:
Table C-1: Measured Impedance
Winding Pair Measured Impedance
PS ZPS = ZP + ZS
PT ZPT = ZP + ZT
TS ZTS = ZT + ZS
For losses within the transformer to be modeled properly, the factory test results must be converted
into equivalent branch impedances. The 1998 IEEE paper titled "Effect of Three-Winding
Transformer Models on the Analysis and Protection of Mine Power Systems" by Oommen and
Kohler2 shows that significant error occurs when the transformer model uses the factory test results
directly and the effect of changes in base MVA is ignored.
The TEE equivalent model of the leakage impedances can be calculated by solving the system of
equations shown in Table B-1. If all of the leakage impedance figures listed in the factory test report
are in percent or per unit on the same MVA base, result is:
Table C-2: Per Cent or Per Unit Equations
But transformer manufacturers often use the rated MVA of one of the windings in the winding pair
being tested as the base MVA for the impedance test. As a result the impedances are usually on
different bases. These impedances must be brought to a common base MVA before calculations can
begin.
C.5 TEE and Delta Models for Leakage Impedance
The equivalent TEE model is shown in Figure B-25. The leakage impedances for each winding are in
per unit on the same MVA base. The primary, secondary and tertiary terminals are marked P, S and
T respectively.
P ZP Z S
ZT T
Figure C-2: TEE Model of Transformer Leakage Impedance
2
Available at http://www.cdc.gov/niosh/ciss/pdfs/eotw.pdf
Issue 9.0 – December 2, 2020 Public C–5Appendix C:Method 2 - Equation Coefficients (K1, K2, K3) MDP_PRO_0011
The loss in each winding can be calculated from the TEE impedances once the load and voltage at
each terminal is determined. This is achieved by specifying the voltage at one terminal and the load
on the other two terminals. The power flow equations are than solved to arrive at the voltage and
load at all terminals.
When two or more transformers operating in parallel, application of the standard power flow models
requires that the common connection point of the TEE impedances be eliminated. This is achieved
through application of the wye-delta transform:
Table C-3: Wye-Delta Transformation
ZPS∆ = ( ZP ⋅ ZS + ZS ⋅ ZT + ZP ⋅ ZT) ÷ ZT
ZPT∆ = ( ZP ⋅ ZS + ZS ⋅ ZT + ZP ⋅ ZT) ÷ ZS
ZST∆ = ( ZP ⋅ ZS + ZS ⋅ ZT + ZP ⋅ ZT) ÷ ZP
where ZPSΔ, ZPTΔ, ZSTΔ, directly connect the P, S and T terminals as shown below:
P ZPSD S
Z PTD
D
ST
Z
T
Figure C-3: Equivalent Delta Model for Leakage Impedance
The wye-delta transformation is power invariant and the total energy loss is the same as in the TEE
model.
Note that the delta impedances do not take on the same numeric values as the pair-wise impedances
measured in the factory.
The bus admittance power flow model requires the delta impedances be converted into admittance
values that are the reciprocal of the impedance value. The current in the P-S branch is then calculated
as (VP - VS) x YPS rather than (VP - VS) / ZPS.
C–6 Public Issue 9.0 – December 2, 2020Part 3.5: Site-Specific Loss Adjustments Appendix C: Method 2 - Equation Coefficients (K1, K2, K3)
C.6 Example Calculations for TEE Leakage Impedance
Example 1
Assume we have a three winding transformer with the factory test results as shown below and that we
wish to carry out power flow, short circuit or loss analysis on a 240 kV/100 MVA base. The
transformer ratings are 60/35/25 MVA and 230/44/27.6 kV for the P, S and T windings respectively.
The primary has 5 taps at 230, 235.75, 241.5, 247.25 and 253 kV The transformer is operating on the
247.25 kV tap. The secondary and tertiary windings are not tapped and neither is fitted with ULTC.
Ratings
Primary Winding 230 kV 60 MVA
Secondary Winding 44 kV 35 MVA
Tertiary 27.6 kV 25 MVA
The factory test report shows the following results:
Test Report
Winding Load Loss Impedance Tap Impedance Tap
Pair
P-S 374.291 ZPS = 10.447% on 60 230 ZPS = 10.878% on 60 253 kV
kW MVA kV MVA
P-T 367.487 ZPT = 21.400% on 60 230
kW MVA kV
S-T 53.261 ZST = 2.862% on 35 44 kV
kW MVA
First, the impedances listed on the test report must be adjusted to reflect the actual operating taps.
Since the primary winding is the only one operating in a position different than that shown on the
factory test report, only ZPS needs to be adjusted:
Issue 9.0 – December 2, 2020 Public C–7Appendix C:Method 2 - Equation Coefficients (K1, K2, K3) MDP_PRO_0011
Note that ZS is negative. Zero and negative values are common and should be treated as such in loss
calculations. The negative value does not represent a capacitor and the common connection point is
not the system neutral.
C–8 Public Issue 9.0 – December 2, 2020Part 3.5: Site-Specific Loss Adjustments Appendix C: Method 2 - Equation Coefficients (K1, K2, K3)
Example 2
In this example, the manufacturer has expressed the impedances for the transformer on the base
values other than those of the windings. The 230 kV winding operates on the 230 kV tap and has an
impedance of 2.244% on that tap at 12.5 MVA. Calculation of power flow, short circuit or loss
analysis on a 240 kV and 100 MVA base is then required.
Ratings
Primary Winding 230 kV 60 MVA
Secondary Winding 44 kV 35 MVA
Tertiary 27.6 kV 25 MVA
The factory test report shows the following results:
Load Loss Test Results
Winding Load Loss Impedance Operating
Pair Tap
P-S 16.245 ZPS = 2.244% on 12.5 MVA and 44.0 kV
kW 44 kV
P-T 33.074 ZPT = 6.42% on 18 MVA and 27.6 kV
kW 27.6 kV
S-T 8.895 kW ZST = 1.115% on 15 MVA and 27.6 kV
28.0 kV
Issue 9.0 – December 2, 2020 Public C–9Appendix C:Method 2 - Equation Coefficients (K1, K2, K3) MDP_PRO_0011 C–10 Public Issue 9.0 – December 2, 2020
Part 3.5: Site-Specific Loss Adjustments                       Appendix C: Method 2 - Equation Coefficients (K1, K2, K3)

        Example 3: Evaluation of Loss in One Transformer
        For the transformer in Example 1, determine the losses when the primary winding operates at 245 kV
        and the secondary and tertiary windings carry a range of loading. The secondary loads are typical of
        the loading experienced under actual operating conditions. Past readings were used to establish actual
        loads for the secondary and tertiary windings.
        The MathCad spreadsheet below demonstrates the application of the bus admittance model and the
        solution of the power flow equations to the calculation of losses in one transformer.
        The spreadsheet automates the calculation of total loss at each specified loading. Listed are the losses
        for five different load combinations applied to the secondary and tertiary windings. The user
        specifies the:
                   •   base MVA and kV
                   •   TEE impedance of each winding on the specified base
                   •   voltage at the primary terminals
                   •   MVA load and power factor on each of the secondary and tertiary terminals
        at the top of the work sheet. The total loss is then read off at the bottom of the spreadsheet.
        Repeating the process for several other loads and pasting the results into the table results in the
        summary shown at the bottom of the spreadsheet.

Issue 9.0 – December 2, 2020                                  Public                                                 C–11
Appendix C:Method 2 - Equation Coefficients (K1, K2, K3) MDP_PRO_0011 C–12 Public Issue 9.0 – December 2, 2020
Part 3.5: Site-Specific Loss Adjustments                                    Appendix C: Method 2 - Equation Coefficients (K1, K2, K3)

        The summary table of the spreadsheet of Example 3 was completed by typing the specified loads and
        power factors into the variables SS and ST above and pasting the converged solution from SLossTotal
        back into the matrix. The matrix was then pasted into an Excel spreadsheet and the total kVA in the S
        and T winding summed in a new column. The total kVA was then plotted against the active and
        reactive power losses as an X-Y scatter chart without lines joining the plotted points.
        Excel's curve fitting routine is then used to draw the lines joining the points and calculate the
        coefficients shown below. These coefficients are submitted to the IESO when application of Method
        2 is required for loss adjustments. The IESO will read the meters installed on the S and T windings,
        sum them and then compute the total loss in the transformer.
        The R2 value shown on the graph is a measure of best fit and takes on values that range from zero to
        one. A value between 0.95 and 1.0 indicates that total kVA can be used to reliably predict losses.

                                                T MVA S MVA Total kW Loss kVAR Loss
                                                    5     5 10      68.647   929.115
                                                   10    12 22 100.902      1832.252
                                                   20     8 28 128.884      2252.876
                                                   35    25 60 341.516      8026.879
                                                   40    27 67 477.684 11131.188

                                                 Total Loss in Three Winding Transformer

                                    12000
                                                                kVAR = 2.8312 kVA2 - 49.034 kVA + 1313.4
                                                                               2
                                                                              R = 0.9934
                                    10000
                   Loss (kW/kVAR)

                                     8000

                                     6000

                                     4000

                                                                              kW = 0.1116 kVA2 - 1.9224 kVA + 84.363
                                     2000                                                   2
                                                                                           R = 0.9881

                                        0
                                            0              20                 40                 60                80
                                                          Secondary+Tertiary Loading (MVA)

Issue 9.0 – December 2, 2020                                               Public                                                 C–13
Appendix C:Method 2 - Equation Coefficients (K1, K2, K3) MDP_PRO_0011
Example 4: Loss Calculation for Transformers Operating in Parallel
Three winding transformers are often used in a double bus configuration as illustrated below.
230 kV
230 kV
T3 T4
44 kV 27.6 kV 27.6 kV 44 kV
M1
M2
Figure C-4: Double Bus Transformer Station
The ratings for both transformers are as shown below:
Ratings T3 & T4
Primary Winding 230 kV 60 MVA
Secondary Winding 44 kV 35 MVA
Tertiary 27.6 kV 25 MVA
C–14 Public Issue 9.0 – December 2, 2020Part 3.5: Site-Specific Loss Adjustments Appendix C: Method 2 - Equation Coefficients (K1, K2, K3)
The no-load losses are:
Excitation Test Results for T3 & T4
T3 T4
kW 53.2 55.3
KVAR 549.43 579.36
% Iex 0.92 0.97
Load Loss Test Results for T3
Winding Pair Load Loss Impedance Tap
P-S 374.291 kW ZPS = 10.770% on 60 MVA 230 kV
P-T 367.487 kW ZPT = 21.400% on 60 MVA 230 kV
S-T 53.261 kW ZST = 2.862% on 35 MVA 44 kV
Load Loss Test Results for T4
Winding Pair Load Loss Impedance Tap
P-S 380.223 kW ZPS = 10.750% on 60 MVA 230 kV
P-T 386.835 kW ZPT = 21.450% on 60 MVA 230 kV
S-T 61.282 kW ZST = 2.871% on 35 MVA 44 kV
Issue 9.0 – December 2, 2020 Public C–15Appendix C:Method 2 - Equation Coefficients (K1, K2, K3) MDP_PRO_0011
The TEE impedances on 240 kV and 100 MVA are:
TEE Impedance for T3 & T4
Winding Pair T3 T4
P-S 0.747 +j 20.851 % 0.749 +j 20.862 %
P-T 0.208 -j 4.392 % 0.221 -j 4.436 %
S-T 0.191 +j 11.892 % 0.238 +j 11.956 %
The equivalent delta circuit for the T3 and T4 is as shown below.
Z
P Z S
Z
Z
Z
Z
T
The meters measure the total flow from each of the secondary and tertiary windings. The average
voltage at the primary windings is 245 kV.
The spreadsheet following illustrates the calculations and lists the losses over a range of values taken
from past reading sheets.
C–16 Public Issue 9.0 – December 2, 2020You can also read