PCCP PERSPECTIVE - RSC ...

Page created by Kimberly Schmidt
 
CONTINUE READING
PCCP PERSPECTIVE - RSC ...
PCCP
                                                                                                                                                                                                                                                 View Article Online
                                                                                                      PERSPECTIVE                                                                                                                                View Journal | View Issue

                                                                                                                                               Material properties particularly suited to be measured
            This article is licensed under a Creative Commons Attribution 3.0 Unported Licence.

                                                                                                                                               with helium scattering: selected examples from 2D
Open Access Article. Published on 01 February 2021. Downloaded on 09/14/2021 09:04:09.

                                                                                                  Cite this: Phys. Chem. Chem. Phys.,
                                                                                                  2021, 23, 7653                               materials, van der Waals heterostructures, glassy
                                                                                                                                               materials, catalytic substrates, topological insulators
                                                                                                                                               and superconducting radio frequency materials
                                                                                                                                               Bodil Holst, *a Gil Alexandrowicz, b Nadav Avidor, c Giorgio Benedek, de
                                                                                                                                               Gianangelo Bracco,f Wolfgang E. Ernst, g Daniel Farı́as, h Andrew P. Jardine,c
                                                                                                                                               Kim Lefmann, i Joseph R. Manson, ej Roberto Marquardt, k
                                                                                                                                               Salvador Miret Artés, le Steven J. Sibener, m Justin W. Wells, no
                                                                                                                                               Anton Tamtögl g and William Allisonc

                                                                                                                                               Helium Atom Scattering (HAS) and Helium Spin-Echo scattering (HeSE), together helium scattering, are well
                                                                                                                                               established, but non-commercial surface science techniques. They are characterised by the beam inertness and
                                                                                                                                               very low beam energy (o0.1 eV) which allows essentially all materials and adsorbates, including fragile and/or
                                                                                                                                               insulating materials and light adsorbates such as hydrogen to be investigated on the atomic scale. At present
                                                                                                                                               there only exist an estimated less than 15 helium and helium spin-echo scattering instruments in total, spread
                                                                                                                                               across the world. This means that up till now the techniques have not been readily available for a broad scientific
                                                                                                                                               community. Efforts are ongoing to change this by establishing a central helium scattering facility, possibly in
                                                                                                                                               connection with a neutron or synchrotron facility. In this context it is important to clarify what information can
                                                                                                                                               be obtained from helium scattering that cannot be obtained with other surface science techniques. Here we
                                                                                                                                               present a non-exclusive overview of a range of material properties particularly suited to be measured with
                                                                                                                                               helium scattering: (i) high precision, direct measurements of bending rigidity and substrate coupling strength of a
                                                                                                                                               range of 2D materials and van der Waals heterostructures as a function of temperature, (ii) direct measurements
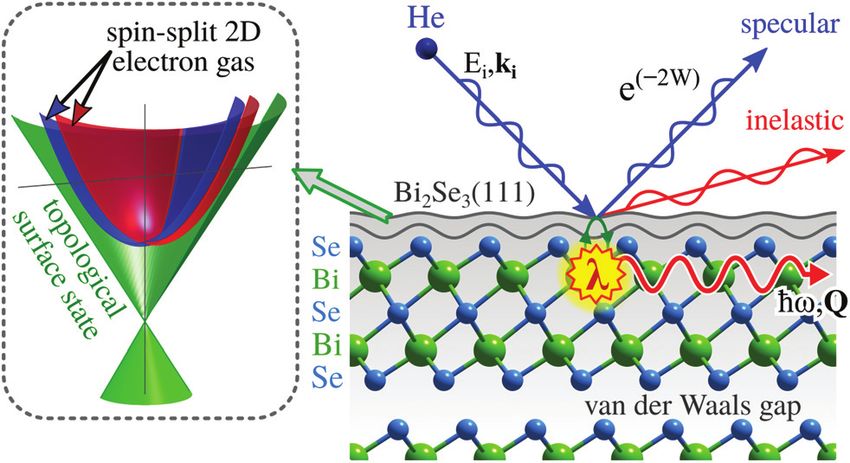
                                                                                                                                               of the electron–phonon coupling constant l exclusively in the low energy range (o0.1 eV, tuneable) for 2D
                                                                                                                                               materials and van der Waals heterostructures (iii) direct measurements of the surface boson peak in glassy
                                                                                                                                               materials, (iv) aspects of polymer chain surface dynamics under nano-confinement (v) certain aspects of
                                                                                                  Received 9th November 2020,                  nanoscale surface topography, (vi) central properties of surface dynamics and surface diffusion of adsorbates
                                                                                                  Accepted 1st February 2021                   (HeSE) and (vii) two specific science case examples – topological insulators and superconducting radio frequency
                                                                                                  DOI: 10.1039/d0cp05833e                      materials, illustrating how combined HAS and HeSE are necessary to understand the properties of quantum
                                                                                                                                               materials. The paper finishes with (viii) examples of molecular surface scattering experiments and other atom
                                                                                                  rsc.li/pccp                                  surface scattering experiments which can be performed using HAS and HeSE instruments.

                                                                                                  a
                                                                                                     Department of Physics and Technology, University of Bergen, Allegaten 55, 5007 Bergen, Norway. E-mail: bodil.holst@uib.no
                                                                                                  b
                                                                                                     Department of Chemistry, College of Science, Swansea University, Swansea, SA2 8PP, UK
                                                                                                  c
                                                                                                    Department of Physics, Cavendish Laboratory, University of Cambridge, J. J. Thompson Avenue, Cambridge CB3 0HE, UK
                                                                                                  d
                                                                                                     Dipartimento di Scienza dei Materiali, Universitá di Milano-Bicocca, Via R. Cozzi 55, 20125 Milano, Italy
                                                                                                  e
                                                                                                     Donostia International Physics Center (DIPC), Paseo Manuel de Lardizabal 4, 20018 Donostia/San Sebastián, Spain
                                                                                                  f
                                                                                                    CNR-IMEM, Department of Physics, University of Genova, V. Dodecanesco 33, 16146 Genova, Italy
                                                                                                  g
                                                                                                     Institute of Experimental Physics, Graz University of Technology, 8010 Graz, Austria
                                                                                                  h
                                                                                                     Departamento de FÍsica de la Materia Condensada, Instituto Nicolás Cabrera and Condensed Matter Physics Center (IFIMAC), Universidad Autónoma de Madrid, 28049 Madrid, Spain
                                                                                                  i
                                                                                                    Nanoscience Center, Niels Bohr Institute, University of Copenhagen, 2100 Copenhagen, Denmark
                                                                                                  j
                                                                                                    Department of Physics and Astronomy, Clemson University, Clemson, South Carolina 29634, USA
                                                                                                  k
                                                                                                    Laboratoire de Chimie Quantique de l’Institut de Chimie, UMR 7177 CNRS/UdS Université de Strasbourg, 1, rue Blaise Pascal, 67008 Strasbourg, France
                                                                                                  l
                                                                                                    Instituto de Fı́sica Fundamental, Consejo Superior de Investigaciones Cientı́ficas, Serrano 123, 28006 Madrid, Spain
                                                                                                  m
                                                                                                      James Franck Institute and Department of Chemistry, University of Chicago, Chicago, Illinois 60637, USA
                                                                                                  n
                                                                                                     Center for Quantum Spintronics, Department of Physics, Norwegian University of Science and Technology, 7491, Trondheim, Norway
                                                                                                  o
                                                                                                     Department of Physics, University of Oslo, Sem Sælands vei 24, 7491, Oslo, Norway

                                                                                                  This journal is © the Owner Societies 2021                                                                 Phys. Chem. Chem. Phys., 2021, 23, 7653–7672 | 7653
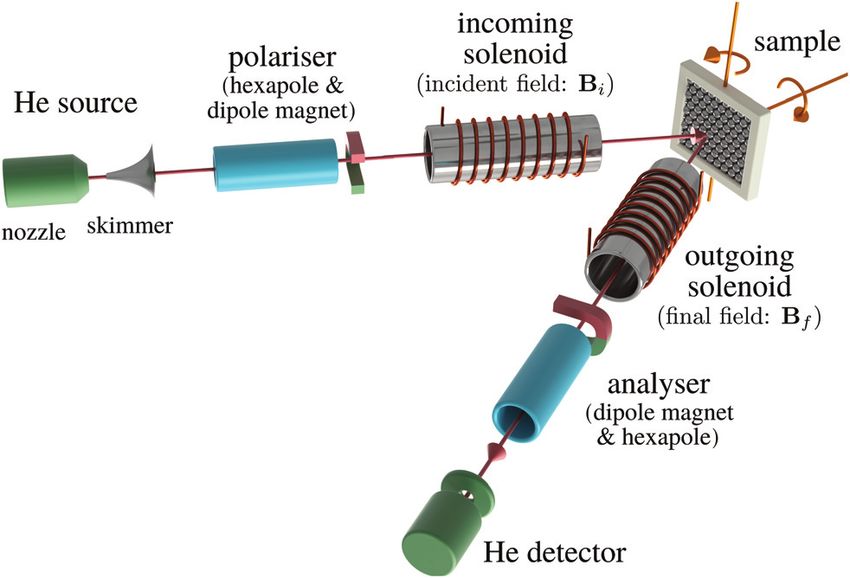
PCCP PERSPECTIVE - RSC ...
View Article Online

                                                                                                  Perspective                                                                                                                                   PCCP

                                                                                                  1 Introduction                                                              The only scattering probes that do not penetrate at all into the
                                                                                                                                                                          bulk are neutral molecular and atomic beams including neutral
                                                                                                  New materials require adequate tools in order to characterise and       helium, created by supersonic expansion. Unlike electrons, X-rays
                                                                                                  understand their fundamental properties. No single technique            and neutrons which all interact with the core electronic cloud and
                                                                                                  provides all the answers. It is usually necessary to use several        atomic nuclei in the sample, as described above, the neutral
                                                                                                  different probes in combination. Each technique exploits the             molecules and atoms scatter off the outermost electron density
                                                                                                  unique features of the interaction between the probe and the            distribution at the sample surface. This is illustrated for helium in
                                                                                                  material under investigation. A key feature of all the methods in       Fig. 1. The surface sensitivity arises from a combination of low
                                                                                                  use today is the ability to provide information with high spatial       energies and the Pauli exclusion principle, which gives an inter-
            This article is licensed under a Creative Commons Attribution 3.0 Unported Licence.

                                                                                                  resolution since the design of new materials rests on characteri-       action dominated by the valence electrons of the sample. The
Open Access Article. Published on 01 February 2021. Downloaded on 09/14/2021 09:04:09.

                                                                                                  sation on the atomic scale. Furthermore, the enormous develop-          classical turning point for helium is a few Ångstroms above the
                                                                                                  ments in 2D materials, van der Waals (vdW) heterostructures and         surface.5 A key feature of the He-electron collision is its softness:
                                                                                                  nano-structured surfaces in general, have enhanced the need for         the energy of a 0.1 nm wavelength helium atom is only 20 meV,
                                                                                                  surface/few atomic layers sensitive techniques.                         see Section 2, so no sample damage is induced. Helium scattering
                                                                                                      Many probes are available to characterise materials and they        can probe essentially all materials and adsorbates, including
                                                                                                  offer a rich palette of opportunity because their properties and         fragile and/or insulating materials and light adsorbates such as
                                                                                                  their interaction with the material differ so profoundly. In general     hydrogen. The technique has been presented as the surface
                                                                                                  the best quantitative information on the smallest length scale          analogy to neutron scattering from bulk materials. As we shall
                                                                                                  with ordered structures is obtained from scattering experiments,        see it is still possible to probe some properties related to the first
                                                                                                  while microscopy is preferred on longer length scales and with          few atomic layers.
                                                                                                  heterogeneous structures. In this paper we concentrate exclusively          Despite a significant body of literature, including both hard and
                                                                                                  on scattering experiments done using beam-probes: photons,              soft surfaces and metal, semiconductor and insulating materials,
                                                                                                  electrons, ions, neutrons, and neutral molecules or atoms. Scat-        helium atom scattering (HAS) and helium spin-echo (HeSE) cannot
                                                                                                  tering experiments separate into experiments probing ‘‘static’’         be described as mainstream techniques, due to the fact that they
                                                                                                  structure, such as diffraction and experiments probing dynamical         are not readily accessible for the broad scientific community at
                                                                                                  processes such as diffusion or vibrations (i.e., phonons). The           present. The purpose of this paper is to describe, through a series
                                                                                                  energy of the scattering particles together with the nature of the      of examples, the unique benefits offered by helium scattering with
                                                                                                  interaction potential define the information that can be obtained       an emphasis on encouraging and extending its range of applica-
                                                                                                  from an experiment. Major (interrelated) parameters of a scattering     tion. For overviews of work on HAS and HeSE see ref. 6–8 and the
                                                                                                  probe are (i) wavelength, (ii) time-resolution, (iii) energy and        very recent book by Benedek and Toennies dedicated to surface
                                                                                                  (iv) penetration depth. The wavelength determines the spatial           phonon dispersion measurements.9 This book also serves as an
                                                                                                  resolution. The time-resolution is of central importance to the         excellent introduction to the topic of helium atom scattering. See
                                                                                                  study of dynamical processes (i.e., phonons and diffusion). It is        also the classical work on Atomic and Molecular Beam Methods
                                                                                                  usually limited by beam intensity and detector response, or by          edited by Scoles, in particular the chapter by Miller on free jet
                                                                                                  the range of energy-transfer that is accessible. The energy             sources.10
                                                                                                  determines both the wavelength and thus the spatial resolu-
                                                                                                  tion, as well as the excitations that can be observed and also the
                                                                                                  damage that individual quanta can create through inelastic
                                                                                                  scattering. It also has some influence on the penetration depth.
                                                                                                  Furthermore the energy spread of the incident beam limits the
                                                                                                  time-resolution. This limitation can be overcome by the spin-echo
                                                                                                  principle, see Section 3.6. The final parameter, the penetration
                                                                                                  depth, is particularly important for the investigation of surfaces
                                                                                                  and ‘‘few atomic layers’’ materials. If the scattered signal contains
                                                                                                  a too large contribution from the bulk the information from the
                                                                                                  surface/first few atomic layers may be entirely swamped. The
                                                                                                  penetration depth is determined by the interaction potential between
                                                                                                  the scattering probe and the sample in combination with the probe
                                                                                                  energy: electrons, X-rays and neutrons all scatter off the electronic
                                                                                                  cloud of the atomic cores and atomic nuclei in the sample, and
                                                                                                  always have a certain penetration into the bulk. Specific methods       Fig. 1 Graphical representation of the different processes for the scattering
                                                                                                  have been developed to enhance the surface sensitivity of the           of He atoms on a crystal surface. Note how the helium atom scatters off the
                                                                                                                                                                          electron density distribution, indicated as red lines, without any penetration
                                                                                                  techniques: low energy electron diffraction,1 grazing incidence
                                                                                                                                                                          into the bulk. Selective adsorption refers to the trapping of a helium atom in
                                                                                                  wide angle X-ray scattering,2 grazing incidence small-angle X-ray       the helium surface interaction potential, see ref. 9 for further discussion.
                                                                                                  scattering3 and grazing incidence small-angle neutron scattering,4      Here li and lf denote the wavelength of the incident and scattered helium
                                                                                                  but a certain penetration always remains for these probes.              atoms, respectively. Inelastic scattering leads to a wavelength change.

                                                                                                  7654 | Phys. Chem. Chem. Phys., 2021, 23, 7653–7672                                                   This journal is © the Owner Societies 2021
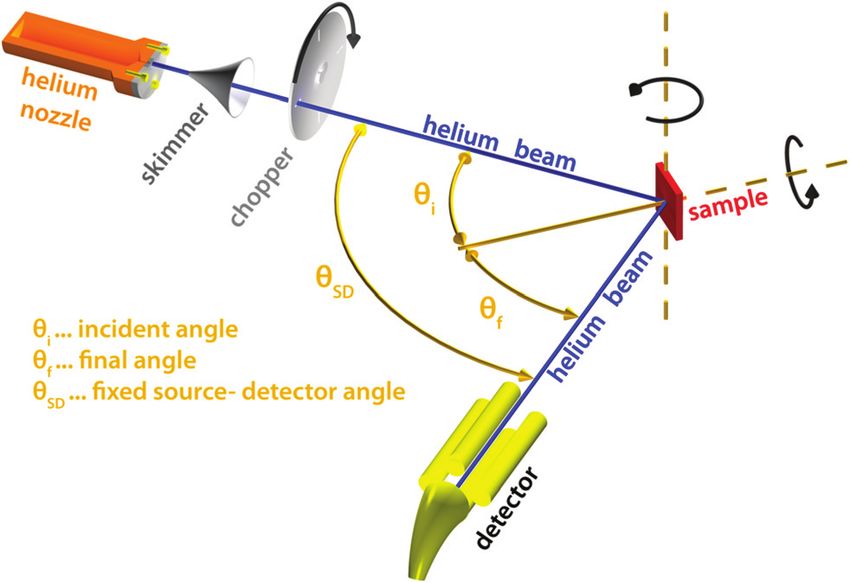
PCCP PERSPECTIVE - RSC ...
View Article Online

                                                                                                  PCCP                                                                                                                                    Perspective

                                                                                                  2 The experimental setup                                                  that scatter without energy loss or gain. Elastic scattering
                                                                                                                                                                            experiments can be used to obtain information about the
                                                                                                  Of all scattering techniques, helium scattering arguably uses the         surface topography (corrugation) of crystalline surfaces and
                                                                                                  simplest source: a helium pressure bottle. The first helium               amorphous surfaces that are corrugated on the nanoscale.
                                                                                                  scattering experiment was performed by Otto Stern and                     For crystalline materials the lattice parameter and corrugation
                                                                                                  co-workers in 1930.11 The observation of diffraction peaks from            amplitude can be extracted from the diffracted intensities
                                                                                                  LiF and NaCl not only confirmed the de Broglie matter wave                whereby the term corrugation amplitude refers to the electronic
                                                                                                  hypothesis for atoms but also provided the basis for a new                charge corrugation at the surfaces. For amorphous surfaces, the
                                                                                                  material characterisation technique. However, the low pressure,           characteristic distance can be determined by the radius of
            This article is licensed under a Creative Commons Attribution 3.0 Unported Licence.

                                                                                                  effusive source used in the initial experiments with a broad               the amorphous (vitreous) ring. For further discussion of the
                                                                                                  velocity distribution and low intensity was not ideal for scatter-
Open Access Article. Published on 01 February 2021. Downloaded on 09/14/2021 09:04:09.

                                                                                                                                                                            measurement of nanoscale surface topography using HAS, see
                                                                                                  ing experiments. A breakthrough came in 1951 when Kanrowitz               Section 3.5.
                                                                                                  and Grey proposed to use gas at high pressure.12 In these novel               Inelastic helium scattering is illustrated in Fig. 3. Here the
                                                                                                  sources, the pressure is so high that the atoms collide in the exit       energy loss or gain through the surface scattering process is
                                                                                                  aperture of the source (the nozzle) as the beam expands into              measured using time-of-flight (TOF). By varying the incident angle
                                                                                                  vacuum. The centre part of the beam is selected by a so called            of the beam (and hence the in-plane wavevector component K),
                                                                                                  skimmer and the resulting supersonic beam has a source                    phonon dispersion curves can be measured. An example for
                                                                                                  pressure dependent velocity distribution narrower than the                graphene on Cu(111) can be found in Fig. 4. Moreover, low energy
                                                                                                  equilibrium Maxwell distribution of the gas in the source.                vibrations of adsorbed molecules such as frustrated translational
                                                                                                  The velocity of the beam can be changed by cooling or heating             and rotational modes can be measured below the energy range
                                                                                                  the nozzle. A liquid nitrogen cooled beam has a wavelength                that is accessible with optical methods.15 In general the
                                                                                                  around 0.1 nm corresponding to a velocity of around 1000 m s1            phonon energy that can be probed in a scattering experiment
                                                                                                  and an energy of around 20 meV.10 The energy is usually                   is determined by the energy of the incident probe. HAS, with its
                                                                                                  kept at less than 0.1 eV to stay in the quantum mechanical                incident energy of less than 0.1 eV is the only technique that
                                                                                                  scattering regime, see Section 3.8.3. The energy resolution, as           can probe surface phonons exclusively in the low energy
                                                                                                  determined by the velocity spread of the beam, varies with                regime. The upper limit probed can be tuned down by cooling
                                                                                                  pressure and temperature, but is typically around 0.3 meV for             of the nozzle as discussed above. The very low energy of
                                                                                                  a liquid nitrogen cooled beam.13,14 Essentially, two different             the helium beam (4 orders of magnitude less than an electron
                                                                                                  types of experiments can be performed in HAS: Elastic and                 at a similar wavelength) combined with the inertness
                                                                                                  inelastic scattering. The different scattering processes are               also makes helium very attractive for probing insulating,
                                                                                                  illustrated in Fig. 1.                                                    fragile structures as well as 2D materials or materials where
                                                                                                      Fig. 2 shows a diagram of a standard HAS instrument. See              the interaction within a few atomic layers are of particular
                                                                                                  Section 3.6 for a description of the HeSE extension. Elastic              interest, such as van der Waals heterostructures and topological
                                                                                                  scattering measures the angular dependence of helium atoms                insulators.

                                                                                                  Fig. 2 Diagram of a HAS instrument. Shown here in a fixed source-         Fig. 3 Diagram illustrating the principle in a helium time-of-flight (TOF)
                                                                                                  detector angle configuration. The beam is produced by supersonic expan-   experiment. An incident helium pulse is visible at the left-hand side of the
                                                                                                  sion of He gas through a nozzle, with the central part of the expansion   sample, with the initial velocity distribution indicated as a single blue peak.
                                                                                                  selected by a skimmer. For energy resolved experiments the beam is        After scattering off the surface the helium beam has excited and annihilated
                                                                                                  pulsed using a chopper and the arrival time of the pulse measured         phonons at the surface, leading to an energy loss and an energy gain
                                                                                                  (time-of-flight – TOF), see Fig. 3. Typical dimensions are around 1.5–    respectively, visible as two additional peaks before and after the elastically
                                                                                                  2 m for each beam arm.                                                    scattered fraction in the middle.

                                                                                                  This journal is © the Owner Societies 2021                                              Phys. Chem. Chem. Phys., 2021, 23, 7653–7672 | 7655
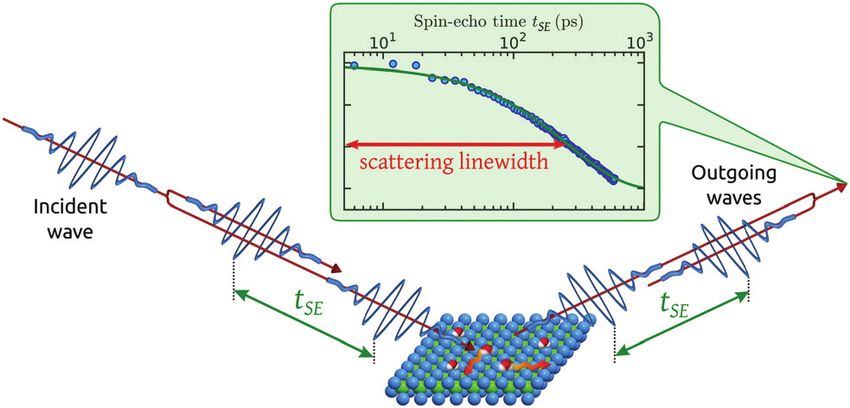
PCCP PERSPECTIVE - RSC ...
View Article Online

                                                                                                  Perspective                                                                                                                                    PCCP

                                                                                                                                                                                      In classical mechanics k can be derived for an amorphous
                                                                                                                                                                                   membrane structure of thickness h using Young’s modulus
                                                                                                                                                                                   Y and Poisson’s ratio s as17
                                                                                                                                                                                                                       Yh3
                                                                                                                                                                                                           kðhÞ ¼             ;                    (1)
                                                                                                                                                                                                                    12ð1  sÞ

                                                                                                                                                                                   the SI unit of k is Pa m3 = J, usually expressed in eV for
                                                                                                                                                                                   nanomaterials. Note that in general for crystalline materials the
                                                                                                                                                                                   elastic properties need to be expressed as a tensor rather than
            This article is licensed under a Creative Commons Attribution 3.0 Unported Licence.

                                                                                                                                                                                   simple numbers. However, for hexagonal structures, the behaviour
Open Access Article. Published on 01 February 2021. Downloaded on 09/14/2021 09:04:09.

                                                                                                                                                                                   is similar to amorphous materials.17 Most 2D materials are hex-
                                                                                                                                                                                   agonal. A relatively simple method for measuring Y and s for 2D
                                                                                                                                                                                   materials is to use an atomic force microscope to poke the surface
                                                                                                                                                                                   with a well-defined force and measure the response (nano-
                                                                                                                                                                                   indentation).18 It should then be possible to determine k from
                                                                                                                                                                                   the formula above. However, this implies knowing h which is
                                                                                                  Fig. 4 Experimentally derived surface phonons for Gr/Cu(111)/Al2O3               difficult to determine for 2D materials and it implies that the 2D
                                                                                                  (black dots) and Gr on Cu(111) foil (red dots) measured along the GM             materials behave classically, which they usually do not. To the best
                                                                                                  direction shown with DFT calculations for free standing Gr (dashed               of our knowledge, the only 2D materials where the bending rigidity
                                                                                                  curves).25 The red curve is a fit to the experimental data using eqn (2) with
                                                                                                                                                                                   has been measured directly using methods other than HAS are
                                                                                                  DE = h ocoupled(DK). In the abscissa DK is the change in parallel wave vector
                                                                                                                                                                                   graphene, bilayer graphene19 and 2–5 layer MoS2.20 All measure-
                                                                                                           ZA
                                                                                                  of the helium atoms, and DE the change of energy of the helium atoms
                                                                                                  which is the energy exchange (loss or gain) with the surface corresponding       ments were done at room temperature and involved advanced
                                                                                                  to phonon excitation or annihilation. See also Fig. 3. Reproduced with           nano-engineering: The 2D-materials were spanned over gaps in a
                                                                                                  permission from ref. 24 r(2015) Elsevier.                                        drum-like structure with mechanical stressing and thus limited
                                                                                                                                                                                   certainty as to the unperturbed values of rigidity. The measure-
                                                                                                                                                                                   ments all had very large uncertainties. A further experimental value
                                                                                                                                                                                   for the bending rigidity of graphene often cited, is inferred from
                                                                                                  3 Selected material properties                                                   Raman spectroscopy measurements on bulk graphite.21
                                                                                                  particularly suited to be measured with                                              In 2013 Amorim and Guinea presented an analytical expres-
                                                                                                                                                                                   sion for extracting the bending rigidity for a free-standing thin
                                                                                                  helium scattering                                                                membrane (i.e., graphene, Gr), from a phonon dispersion curve
                                                                                                  We now approach to a series of examples of studies of material                   for the perpendicular acoustic (ZA) phonon mode, obtained from
                                                                                                  properties, where the use of HAS is instrumental.                                a membrane weakly bound to a substrate:22
                                                                                                                                                                                                                    rffiffiffiffiffiffiffiffiffiffiffiffiffiffiffiffiffiffiffiffiffiffiffiffiffiffiffiffiffiffi
                                                                                                                                                                                                                        k
                                                                                                                                                                                                    ocoupled
                                                                                                                                                                                                      ZA     ðDKÞ ¼         DK 4 þ o02 ;            (2)
                                                                                                  3.1 Bending rigidity and substrate coupling strength of 2D                                                          r2D
                                                                                                  materials                                                                        where ocoupled  is the angular phonon frequency, DK is the
                                                                                                                                                                                            ZA
                                                                                                  In this section we show how HAS is the most versatile method                     parallel wave vector, r2D is the two-dimensional mass density
                                                                                                  for measuring the bending rigidity of 2D materials and the                       and ho0 the binding energy with the substrate, with o0 given as:
                                                                                                  only method which can potentially measure the temperature                                                       rffiffiffiffiffiffiffiffi
                                                                                                                                                                                                                      g
                                                                                                  dependence of bending rigidity for a range of 2D materials,                                                o0 ¼           ;                  (3)
                                                                                                                                                                                                                     r2D
                                                                                                  something which to the best of our knowledge has not been
                                                                                                  done so far. Furthermore we show that HAS is a very unique                       where g is the coupling strength between the thin membrane
                                                                                                  method for precise measurements of the substrate coupling                        and the substrate. Eqn (2) should also contain, under the square
                                                                                                  strength for 2D materials.                                                       root, a term quadratic in DK that arises from the linear term in
                                                                                                      The mechanical properties of 2D materials are crucial for a                  DK in the dispersion relation for the ZA mode of a free-standing
                                                                                                  number of applications, from biological membranes to flexible                    thin film obeying fixed or periodic boundary conditions.23 How-
                                                                                                  electronics. To design flexible electronic components that do not                ever, this term is negligible compared to the term in o02 and is
                                                                                                  fracture when bent, it is important to know how flexible the                     usually omitted.
                                                                                                  different material layers are, relative to each other. This is expressed             In 2015 Al Taleb et al. applied eqn (2) as a new method for
                                                                                                  by the bending rigidity, k, a measure of material resistance to                  measuring the bending rigidity of 2D materials by means of HAS.24
                                                                                                  deformation. It is particularly important to know how the bending                Since He beams used in HAS are typically 1–5 mm in diameter, the
                                                                                                  rigidity varies with temperature, k(T), to design flexible electronics           method provides information over a large sample area.
                                                                                                  components with a big enough temperature working range for                          We illustrate the way in which both the bond strength and
                                                                                                  specific applications, typically 40 1C to 85 1C for commercial                  the bending rigidity are determined with HAS for the case of
                                                                                                  electronics.16                                                                   Gr/Cu(111).24 Fig. 4 shows the acoustic phonon dispersion curves

                                                                                                  7656 | Phys. Chem. Chem. Phys., 2021, 23, 7653–7672                                                        This journal is © the Owner Societies 2021
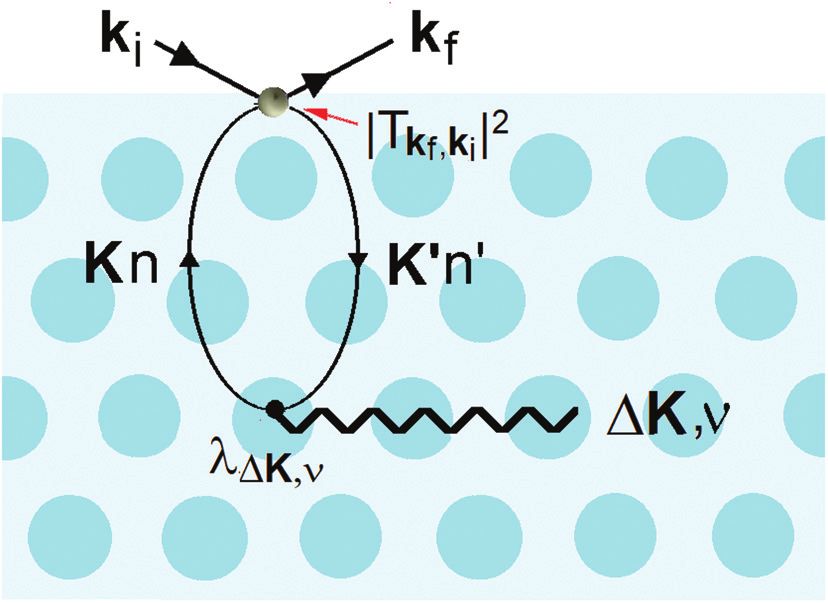
PCCP PERSPECTIVE - RSC ...
View Article Online

                                                                                                  PCCP                                                                                                                             Perspective

                                                                                                  measured with HAS along the GM direction for two different                   that it already behaves classically, which is not the case for
                                                                                                  Gr/Cu(111) samples. Phonon dispersion curves for free standing Gr           bilayer graphene.
                                                                                                  calculated from first principles25 are also shown as dashed lines.              Finally it should be mentioned that phonon dispersion
                                                                                                     The ZA phonon mode is clearly visible. This is the mode that             curves are extremely sensitive to interatomic forces of adsorbed
                                                                                                  corresponds to the dispersion curve in eqn (2). The transverse              layers, including the interaction between adlayer and substrate
                                                                                                  acoustic (TA) mode is forbidden for planar scattering in the GM             atoms also for non-weakly bound systems. A range of HAS
                                                                                                  direction, whereas the low cross section for excitation of the              measurements of graphene on metal surfaces provide a good
                                                                                                                                                                              example of how small changes in the substrate coupling
                                                                                                  longitudinal acoustic (LA) mode makes its detection quite
                                                                                                                                                                              strength modify the corresponding phonon dispersion
            This article is licensed under a Creative Commons Attribution 3.0 Unported Licence.

                                                                                                  difficult. First principles phonon calculations of a Gr/Cu inter-
                                                                                                                                                                  point,26   curves.36 Softening of optical modes and signatures of the
                                                                                                  face predict a few meV shift of the ZA mode near the G
Open Access Article. Published on 01 February 2021. Downloaded on 09/14/2021 09:04:09.

                                                                                                                                                                              substrate’s Rayleigh wave are observed for strong graphene–
                                                                                                  which is a direct measure of the Gr–Cu coupling strength
                                                                                                                                                                              substrate interactions,37 while acoustic phonon modes resemble
                                                                                                  according to eqn (3). A similar shift (of a different energy)
                                                                                                                                                                              those of free-standing graphene for weakly interacting systems.32
                                                                                                  was recently predicted for graphene on another weakly bound                 Moreover, phonon dispersion curves provide an excellent scenario
                                                                                                  substrate SiC.27 This shift is clearly seen at ho0 B 6 meV in Fig. 4.      to test the performance of current state-of-the-art calculations.
                                                                                                  An overtone of this mode is also observed at ho B 12 meV.
                                                                                                  An unshifted dispersion curve is also present, which resembles the          3.2 The electron–phonon coupling constant k in the low
                                                                                                  ZA mode of free-standing Gr. This is very likely due to the Rayleigh        energy range
                                                                                                  wave of the Cu(111) substrate, since at this wavevector the penetra-        In this section we show how HAS is idealy suited to measure the
                                                                                                  tion depth of He atoms is large enough to sample it.28 Fitting the          electron–phonon e–ph coupling constant l (also known as
                                                                                                  ZA mode using eqn (2), it is possible to determine both g and k. The        the mass correction factor of superconductivity) exclusively in
                                                                                                  best-fit (red curve in Fig. 4) leads to g = (5.7  0.4)  1019 N m3 and    the low energy range (o0.1 eV, tuneable) for 2D materials and
                                                                                                  k = (1.30  0.15) eV. The derived g is 2–3 times smaller than that          van der Waals heterostructures. The energy range can be tuned
                                                                                                  reported for Gr/SiO2 interfaces, which is very reasonable.29 The            to a desired maximum by changing the energy and/or the
                                                                                                  derived k value is consistent with DFT calculations that predict            incident angle of the helium beam. As will be explained in
                                                                                                  values of k in the range 1.20–1.61 eV.30                                    more detail below, measurements of l in the low energy range
                                                                                                      HAS was recently used to obtain also the bending rigidity               are of particular importance for understanding superconduc-
                                                                                                  and coupling strength of a 2D silica bilayer weakly bound on                tivity in 2D materials.
                                                                                                  Ru.31 Furthermore the bending rigidity and coupling strength                    The e–ph coupling constant l came into importance in 1957
                                                                                                  of graphene on sapphire32 have been measured. The latter                    when Bardeen, Cooper and Schrieffer developed the first compre-
                                                                                                  experiment illustrates how the defect density affects the bending            hensive theory of superconductivity.38 They gave what is now
                                                                                                  rigidity of the graphene.                                                   known as a crude expression for the superconducting transition
                                                                                                      The fact that measurements done on a 2D material weakly                 temperature in terms of l, which was later developed into a more
                                                                                                  bound to a substrate can be used to extract the value of k for the          accurate expression by McMillan.39 In bulk materials l plays a role
                                                                                                  free-standing 2D material, is a big experimental advantage which            in all phenomena in which phonons interact with electrons. For
                                                                                                                                                                              bulk materials l can be determined from heat capacity measure-
                                                                                                  should make it possible to measure k(T) for the free-standing
                                                                                                                                                                              ments, the linewidths of spectral lines emitted from bulk samples,
                                                                                                  material simply by varying the temperature of the substrate. So far
                                                                                                                                                                              heat transfer between electrons and phonons under non-
                                                                                                  no such temperature dependent measurements have been pub-
                                                                                                                                                                              equilibrium conditions, laser pump–probe measurements and
                                                                                                  lished. As mentioned at the beginning of this section it is
                                                                                                                                                                              many other experiments.40 Since the early HAS measurements
                                                                                                  particularly important to know how the bending rigidity changes
                                                                                                                                                                              by Toennies and coworkers on metal surfaces,41,42 e–ph inter-
                                                                                                  with temperature to design flexible electronics components with a
                                                                                                                                                                              action was shown to have remarkable effects, unveiled by the
                                                                                                  big enough temperature working range for specific applications.             discovery of a soft longitudinal resonance, now recognized as an
                                                                                                  The theoretical values for the temperature dependence of the                ubiquitous feature of all metal surfaces. This discovery led to a
                                                                                                  bending rigidity of various 2D materials are heavily contested in           radical change in the theory of inelastic HAS from a conducting
                                                                                                  the literature. For graphene, several publications claim it will            surface: from the two-body collision model to the e–ph interaction
                                                                                                  decrease with temperature whereas others predict that it will               model described below.
                                                                                                  increase, see for example.33,34 For bilayer graphene, there are also            In recent years several 2D materials have been shown to be
                                                                                                  conflicting results suggesting both increase and decrease with              superconducting. A particularly prominent example being
                                                                                                  temperature and deviations of more than two orders of magnitude             Jarillo-Herrero and co-workers’ magic-angle graphene demon-
                                                                                                  as summarised in ref. 19, see also ref. 35.                                 stration in 2018 that two graphene sheets placed on top of each
                                                                                                      Another important point is to understand the behaviour of               other on hexagonal boron nitride and twisted 1.11 relative to
                                                                                                  k as a function of material thickness. How thick does a 2D                  each other display superconductivity.43
                                                                                                  material have to be to behave classically and follow eqn (1) The                In 2019 it was shown that trilayer graphene (ABC type) on
                                                                                                  answer is likely to differ for different material classes. First              hexagonal boron nitride also shows signs of superconductivity.44
                                                                                                  experiments on bilayer silica (SiO2) mentioned above31 suggest              Another class of 2D materials that displays superconductivity is

                                                                                                  This journal is © the Owner Societies 2021                                              Phys. Chem. Chem. Phys., 2021, 23, 7653–7672 | 7657
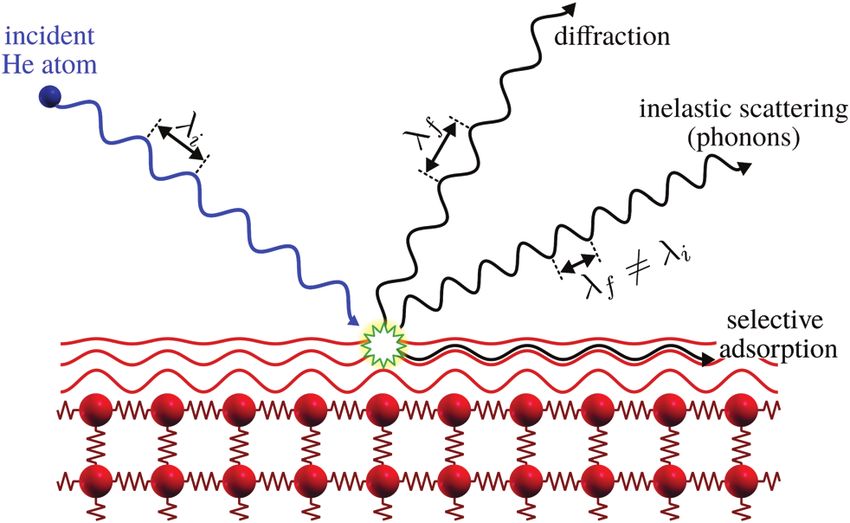
PCCP PERSPECTIVE - RSC ...
View Article Online

                                                                                                  Perspective                                                                                                                                  PCCP

                                                                                                  the transition metal chalcogenides: among others, monolayer              that the superconducting properties of magic-angle graphene
                                                                                                  MoS2,45 monolayer and bilayer WS246,47 and monolayer NbSe2.48            improve significantly, when the magic-angle graphene is placed
                                                                                                  However, the nature of superconductivity in several of these new         on a monolayer of WSe2 instead of boron nitride.57 Further-
                                                                                                  2D superconductors, in particular, the relative contributions            more, a recent theoretical paper shows that for monolayer
                                                                                                  from e–ph coupling and electron correlation are not at all               graphene, the main phonon mode involved in e–ph coupling
                                                                                                  understood. For example, there is an intense debate about the            in the p-band for moderate doping is one of the lower energy
                                                                                                  value of l for magic-angle graphene. Some simulations indicate           acoustic modes.58 It appears that an informed design of new 2D
                                                                                                  electron correlation is dominant and hence l should be small             materials, with the ultimate aim of achieving room temperature
                                                                                                  ({1),43,49 whereas other studies suggest that the e–ph coupling          superconductivity, will require systematic measurements of
            This article is licensed under a Creative Commons Attribution 3.0 Unported Licence.

                                                                                                  is dominant for the superconductivity and l could be as large as         l in the low energy phonon regime for a broad range of 2D
Open Access Article. Published on 01 February 2021. Downloaded on 09/14/2021 09:04:09.

                                                                                                  1.050–53 or even as large as 1.5.54 Further, if the e–ph coupling is     material systems.
                                                                                                  dominant, it is not clear if it is the higher or lower energy               3.2.1 Measuring k with HAS. The potential energy function
                                                                                                  phonons that mediate the superconductivity. This lack of under-          governing the interaction between a He atom and a surface
                                                                                                  standing of l makes it difficult to decide on the best experi-           during a collision is known to consist of a long-range attractive
                                                                                                  mental path for designing new 2D materials that display                  van der Waals contribution combined with a short-range repulsive
                                                                                                  superconductivity at higher temperatures.                                part. The repulsive part, which actually reflects the He atoms, is
                                                                                                      One problem has been that, while there are several ways to           due to the Pauli repulsion arising when the electron wave
                                                                                                  measure l for bulk materials as discussed above, up to very              functions of the He atom begin to overlap with the outermost
                                                                                                  recently there was no straightforward method for measuring               edge of the surface electron density. This repulsive part has
                                                                                                  l directly for the low energy phonon regime.203                          been shown to be proportional to the rapidly decaying surface
                                                                                                      Up until now the experimental method usually applied to              electron density outside the surface.59 Thus the He atoms never
                                                                                                  measure l in 2D materials has been angular resolved photoelec-           come close to the atomic cores in the surface as discussed also
                                                                                                  tron spectroscopy (ARPES). ARPES measures the momentum                   in Section 1, instead they sense the presence of those cores
                                                                                                  distribution of electrons ejected from a solid exposed to UV             indirectly through the corrugations induced in the electron
                                                                                                  light/soft X-rays (typically the energy of the incident beam is          density.
                                                                                                  around 20 eV; note, this is around 1000 times bigger than the               It is also at the repulsive part of the potential where the He
                                                                                                  energy of the atoms in a helium scattering beam). The ejected            atoms sense the vibrations of the surface, i.e., the phonons.
                                                                                                  electrons reflect the electronic excitations in the material and thus    Since the 1980s it has been known that HAS is uniquely
                                                                                                  allow the electronic structure to be probed. l can be measured as        sensitive to measuring phonon modes in the surface region,
                                                                                                  so-called ‘‘kinks’’ in the valence bands. ARPES is a very powerful       such as the Rayleigh mode or modes due to adsorbate layers.
                                                                                                  technique, but the measurements of l tend to be biased towards           However, the He atoms do not directly sense the vibrational
                                                                                                  the higher energy optical phonon modes. In the cases where the           motions of the atomic cores, instead they measure the phonons
                                                                                                  momentum transfer is small (and dispersive), i.e., when the              of the electron density that are induced by the cores. In other
                                                                                                  relevant phonon mode(s) is the low energy part of the acoustic           words, inelastic He atom scattering excites phonon modes in
                                                                                                  mode(s) ARPES may struggle: The contribution from the lower              the cores via the e–ph interaction. This is shown schematically
                                                                                                  energy phonons (in the acoustic phonon regime) cannot be                 in Fig. 5.
                                                                                                  extracted without extensive calculations that are not always                This process was theoretically quantified in 2011 where it
                                                                                                  feasible (this is discussed in more details in Section 3.2.2).           was shown that the He atom scattering intensity associated
                                                                                                  l values for higher energy phonons have been successfully                with excitation of a surface phonon, having parallel momentum
                                                                                                  extracted using ARPES for example for graphene (s-band)55 and           hDK and mode number n, is directly proportional to its corres-
                                                                                                  MoS2.56 For graphene, the s-band is too far away from the Fermi          ponding mode component of the e–ph coupling constant
                                                                                                  level to have any influence on superconductivity. For MoS2 the           lDK,n.28,60 The e–ph coupling constant l is given by the average
                                                                                                                                                                                                                 P
                                                                                                  values found for l were too low to contribute to superconductivity.      over the mode components, l ¼            lDK;n =N where N is the
                                                                                                                                                                                                                         DK;n
                                                                                                      A further challenge with ARPES for 2D material examination
                                                                                                  is that there are some cases where the substrate bands mask             total number of modes.61 The He atom scattering inelastic
                                                                                                  the 2D material bands. Furthermore the interaction between a            intensity IDK,n for a specific phonon mode is given by28
                                                                                                  2D material and the supporting substrate modifies the outer-                                                            
                                                                                                                                                                            IDK;n ðkf ; ki Þ / e2W ðkf ;ki ;T Þ Tkf ; ki 2lDK;n
                                                                                                  most electron density distribution of the 2D material, which                                                                                   (4)
                                                                                                  will particularly affect the low energy e–ph coupling23 (see also                              jnBE ðoðDK; nÞÞjdðEf  Ei  
                                                                                                                                                                                                                             hoðDK; nÞÞ;
                                                                                                  the final paragraph of Section 3.1). This illustrates how complex
                                                                                                  the superconducting challenge is: for 2D materials, l is not            where Tkf,ki is the transition matrix element determined from
                                                                                                  necessarily a material constant but may depend on the inter-            the interaction potential, nBE is the Bose–Einstein function, ho is
                                                                                                  action with the substrate underneath. This is supported by a            the phonon energy, and exp{2W(kf,ki,T)} is the Debye–Waller
                                                                                                  paper on superconductivity in MoS2 published in 2020, where             factor. Ei is the incident and Ef the final energy of the He atom.
                                                                                                  the superconductivity appears to be ‘‘induced’’ by the Pb                  The Debye–Waller factor multiplies all quantum mechanical
                                                                                                  substrate45 and another paper from the same year, which shows           intensities, which includes diffraction peaks, single-phonon peaks,

                                                                                                  7658 | Phys. Chem. Chem. Phys., 2021, 23, 7653–7672                                                      This journal is © the Owner Societies 2021
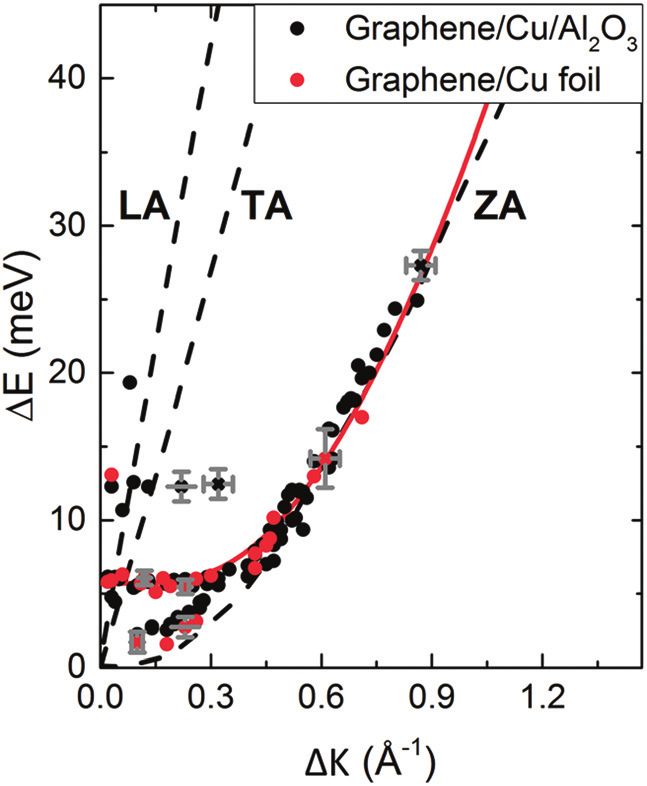
PCCP PERSPECTIVE - RSC ...
View Article Online

                                                                                                  PCCP                                                                                                                                        Perspective

                                                                                                                                                                                      metal chalagonide MoS2,65 see also the specific science case on
                                                                                                                                                                                      topological materials. Section 3.7.1.
                                                                                                                                                                                          3.2.2 Specific science case: k for magic-angle graphene. We
                                                                                                                                                                                      finish the discussion of l by addressing the issue of magic-angle
                                                                                                                                                                                      graphene in more detail. As discussed in the beginning of Section
                                                                                                                                                                                      3.2.1 the value of l for magic-angle graphene is a topic of intense
                                                                                                                                                                                      debate in the literature. ARPES measurements on magic-angle
                                                                                                                                                                                      graphene (twisted bilayer graphene) were published in 2020,66
                                                                                                                                                                                      however, no value for l was obtained. The flat-bands which are
            This article is licensed under a Creative Commons Attribution 3.0 Unported Licence.

                                                                                                                                                                                      thought to be responsible for the superconductivity43 (together with
Open Access Article. Published on 01 February 2021. Downloaded on 09/14/2021 09:04:09.

                                                                                                                                                                                      the complex back folding of the Brillouin zone) makes it extremely
                                                                                                                                                                                      challenging to extract the e–ph ‘‘kink’’ using ARPES. Furthermore,
                                                                                                                                                                                      to analyse the e–ph ‘‘kink’’ (i.e., renormalisation of the electron
                                                                                                  Fig. 5 An incoming He atom of momentum h           ki is inelastically scattered
                                                                                                  by the electron density (light blue color) into the final state of momentum
                                                                                                                                                                                      band due to the interaction) in an ARPES dataset, it must be
                                                                                                   kf, creating a virtual electron–hole pair, where an electron is excited from
                                                                                                  h                                                                                   possible to describe the unrenormalised band accurately.67 For
                                                                                                  a surface state of parallel wavevector K and band index n to the state K 0 ,        monolayer graphene, the p-band is famously linear close to the
                                                                                                  n 0 via the transition matrix Tkf,ki. The electron–hole pair recombines by          Fermi level, and therefore this is relatively straightforward. For
                                                                                                  creating a phonon of frequency o(DK,n), where n is the branch index, via
                                                                                                                                                                                      twisted bilayer graphene, there is a complex back folding and the
                                                                                                  the electron–phonon coupling lDK,n.
                                                                                                                                                                                      p-band becomes replicated and gapped.66 A further problem is that
                                                                                                                                                                                      the e–ph calculations of the renormalisation are only feasible on
                                                                                                  diffuse elastic intensity due to defects and adsorbates, etc. It                    especially simple unit cells (such as monolayer graphene),27 but the
                                                                                                  describes the attenuation of all quantum features due to the                        twist in magic-angle graphene leads to a moiré pattern which
                                                                                                  phonons that are excited in the collision. Its argument                             increases the size of the unit cell by orders of magnitude. For
                                                                                                  2W(kf,ki,T) is proportional to the mean square phonon displace-                     HAS such matters are not a problem, and it is thus clear that HAS is
                                                                                                  ment, hence for temperatures larger than the zero point motion                      particularly suited to measure l for magic-angle graphene.
                                                                                                  region it is approximately proportional to the temperature T.
                                                                                                  Since 2W(kf,ki,T) depends on an average over all phonon modes,                      3.3   The surface boson peak
                                                                                                  it is intuitively reasonable to expect that it could also be
                                                                                                  expressed as a function of the e–ph constant since l is also an                     In this section we show how HAS is the only method which can be
                                                                                                  average over all modes. Recently, it has been demonstrated that                     used to directly measure the boson peak on a surface for glassy
                                                                                                  the Debye–Waller exponent is proportional to l and for the                          materials. This implies that HAS is also the only method that can be
                                                                                                  special case of the specular diffraction peak it can be written                     used to measure directly the boson peak on 2D materials. The
                                                                                                  simply as62                                                                         boson peak as a 2D phenomenon has been predicted,68 and recently
                                                                                                                                                                                      observed in a model system of a highly jammed two-dimensional
                                                                                                                                                   mEiz                               granular material,69 but not yet experimentally measured in a 2D
                                                                                                                     W ðkf ; ki ; T Þ ¼ 4N ðEF Þ         lkB T;              (5)
                                                                                                                                                   me f                              material.
                                                                                                                                                                                          The Debye model predicts that the vibrational density of
                                                                                                  where N ðEF Þ is the electron density of states at the Fermi surface,
                                                                                                                                                                                      states (VDOS) for a material is proportional to the frequency
                                                                                                  m is the He atomic mass, me is the effective electron mass, Eiz is the
                                                                                                                                                                                      squared in the low energy range. However in many materials
                                                                                                  incident He atom energy due to motion normal to the surface, f is
                                                                                                                                                                                      the spectrum departs from this law and thus, when the VDOS is
                                                                                                  the work function, and kB is the Boltzmann constant. Eqn (5) shows
                                                                                                                                                                                      normalized by the frequency squared, a peak (or rather a hump)
                                                                                                  that the temperature dependence of the Debye–Waller exponent,
                                                                                                                                                                                      occurs, i.e., an excess in the phonon density of states with a
                                                                                                  which is easily measured, can be used to extract values of l. For
                                                                                                                                                                                      corresponding excess in heat capacity. This peak/hump is
                                                                                                  simple metals, the effective mass me is known and a reasonable
                                                                                                                                                                                      known as the boson peak. It has been observed in the bulk of
                                                                                                  approximation to the density of states is that of a free electron gas
                                                                                                                  .                                                                   numerous materials using optical,70 neutron71 and thermal72
                                                                                                  N ðEF Þ ¼ 3Zme ðhkF Þ2 where hkF is the Fermi momentum and Z                     techniques. The boson peak has long been considered a feature
                                                                                                  is the valence number. Using eqn (5) with the free electron gas                     of disordered materials such as glassy materials, where it is typically
                                                                                                  density of states, Table 1 shows, in the next-to-last column, the                   observed at energies in the THz range (1 THz E 4 meV), but
                                                                                                  values of l = lHAS that are obtained from all simple metals                         recently it has also been observed in single crystals.73 A theoretical
                                                                                                  for which the temperature dependence of the Debye–Waller                            explanation for this was provided last year.74 Recent result on
                                                                                                  factor has been measured. The values obtained from HAS are                          polymer glasses show that the boson peak frequency is propor-
                                                                                                                                                                                                pffiffiffiffi
                                                                                                  remarkably similar to values of l from other sources shown                          tional to G, where G is the macroscopic shear modulus.72
                                                                                                  in the last column, which are almost all measured for the                               Given the importance of the heat capacity for a big range of
                                                                                                  bulk metal crystals.62 HAS measurements have recently been                          material applications, it is clearly very important to understand
                                                                                                  used to obtain values for l in the low energy range also for                        and potentially tailor the magnitude and/or position of the
                                                                                                  degenerate semiconductors (PtTe2, PdTe2)63,64 and a transition                      boson peak also for surfaces and 2D materials. As mentioned

                                                                                                  This journal is © the Owner Societies 2021                                                       Phys. Chem. Chem. Phys., 2021, 23, 7653–7672 | 7659
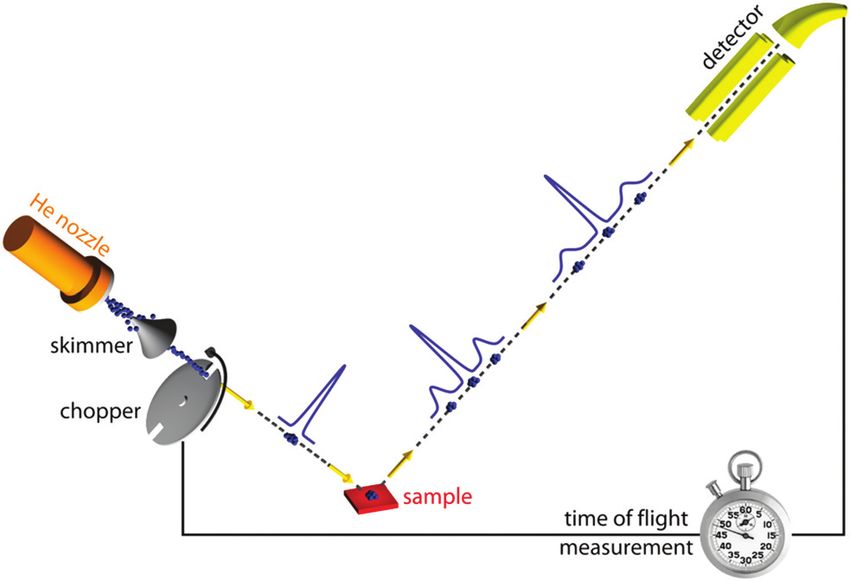
PCCP PERSPECTIVE - RSC ...
View Article Online

                                                                                                  Perspective                                                                                                                                    PCCP

                                                                                                  Table 1 The e–ph coupling constant lHAS as derived from the temperature dependence of the HAS elastic diffraction intensity for all simple metals that
                                                                                                  have been measured is shown in the next-to-last column. These values are compared with values of l from other sources, mainly bulk measurements, in
                                                                                                  the last column. For reference information on the experimental data and other input parameters, see ref. 62

                                                                                                                              D ln I (T)/DT                                                                                              l (bulk and
                                                                                                  Surface                     [103 K 1]             kiz2 [Å2]          f [eV]           kF [Å1]         Z            lHAS            other sources)
                                                                                                  Cu(111)                     4.2 yi = 56.91          30.36               4.94             0.25             1            0.083           0.093
                                                                                                                                                                                                                                         0.13
                                                                                                                                                                                                                                         0.15
                                                                                                  Cu(110)                     1.7 yi = 671            6.20                4.48             0.25             1            0.148           0.17
                                                                                                                                                                                                                                         0.23
            This article is licensed under a Creative Commons Attribution 3.0 Unported Licence.

                                                                                                  Cu(001)                     6.61 yi = 191           108.2               4.59             B0.6             1            0.195           0.15  0.03
                                                                                                                                                                                                                                         0.13
Open Access Article. Published on 01 February 2021. Downloaded on 09/14/2021 09:04:09.

                                                                                                  Ni(111)                     1.25                    14.7                5.15             1.49             10           0.19            0.21–0.24
                                                                                                                                                                                                                                         0.167
                                                                                                  W(001)1  1                 4.1                     26.3                4.32             1.19             6            0.31            0.28
                                                                                                  Pb(111)                     5.0                     5.65                4.25             0.65             4            0.769           0.95
                                                                                                                                                                                                                                         0.7–0.9
                                                                                                  Ag(111) (1,0) peak          3.4                     16.82               4.74             0.22             1            0.082           0.059
                                                                                                                                                                                                                                         0.12
                                                                                                                                                                                                                                         0.13  0.04
                                                                                                  K(110)                      8.07                    16.29               2.30             0.27             1            0.16            0.13  0.03
                                                                                                                                                                                                                                         0.11
                                                                                                  Cs(110)                     17.8                    26.9                2.1              0.26             1            0.18            0.15  0.03
                                                                                                                                                                                                                                         0.16
                                                                                                  Sb(111)                     5.6                     22.8                4.56             0.80             5            0.28            0.27
                                                                                                  Bi(111)                     11.5                    16.79               4.23             0.72             5            0.57            0.60
                                                                                                                                                                                                                                         0.45

                                                                                                  above theoretical predictions suggest that the boson peak                      spectroscopic or X-ray scattering methods while revealing a clear
                                                                                                  should be present in 2D materials,68 however, none of the                      picture of surface dynamics isolated from the bulk signatures.82
                                                                                                  standard methods used to measure boson peaks can be applied
                                                                                                  to surfaces and 2D materials because they penetrate too far into               3.5   Nanoscale surface topography
                                                                                                  the materials. The only, method that can be used to probe the                  In this section we show how HAS in some cases can provide
                                                                                                  boson peak on surfaces in the THz (meV) range, relevant for                    important information about surface topography, that cannot
                                                                                                  glassy materials, is the strictly surface sensitive HAS.                       be obtained with other techniques.
                                                                                                      A few years back the first and so far only measurements of the                As discussed in Sections 1 and 3.2.1, HAS is unique in that
                                                                                                  boson peak on a surface were performed using HAS on vitreous                   the atoms scatter off the outmost electron density distribution
                                                                                                  silica, where it was found at an energy of around 1 THz (4 meV).               of the surface. For this reason a close-packed crystalline metal
                                                                                                  As mentioned above the boson peak is typically observed at                     surface, with its de-localized outer valence band, appears flat
                                                                                                  energies in the THz (meV) range, exactly the energy range that                 with negligible diffraction peaks in a HAS experiment.6 For
                                                                                                  can be probed by HAS. The first publication showed that the                    more corrugated periodic structures including adsorbate struc-
                                                                                                  surface boson peak was in the predicted energy range.75 In a                   tures, the HAS diffraction peaks can provide very accurate infor-
                                                                                                  second publications it could be shown that the surface boson                   mation about the characteristic lateral repeat distance. The
                                                                                                  peak on vitreous silica displays a strong temperature dependence,              information can be extracted using the standard reciprocal lattice
                                                                                                  blueshifting with increasing temperature,76 see also ref. 77 and 78.           formalism. In cases where the diffraction pattern can potentially
                                                                                                                                                                                 be explained by contributions from domains, a combination with
                                                                                                  3.4   Polymer chain surface dynamics under nano-confinement                    a direct imaging technique is necessary to determine the surface
                                                                                                  In this section we argue that HAS is a useful complimentary                    structure. One of the largest surface reconstructions ever observed
                                                                                                  method for investigating dynamical properties of polymer thin                  on a bulk substrate, a 5.55  0.07 nm reconstruction on annealed
                                                                                                  films. Polymers represent a very important class of glassy                     a-quartz was recently identified in a combined HAS and atomic
                                                                                                  materials, they are usually ‘‘soft’’ and insulating, which means               force microscopy study.83 HAS can also be used to extract infor-
                                                                                                  that they can be challenging to investigate with other techniques,             mation about the vertical step-height by looking at the conditions
                                                                                                  in particular with regards to the surface properties. HAS has                  for positive and negative interference effects in the perpendicular
                                                                                                  proven a very useful probe for studying the vibrational dynamics               k-vector. This can also be used to monitor thin film growth
                                                                                                  of polymer surfaces, revealing how the surface dynamics change                 modes.8,84–86 and real time relaxation effects by monitoring
                                                                                                  due to nano-confinement as film thickness approaches the                       changes in the Helium signal after the deposition has been
                                                                                                  radii of gyration of the polymer chains,79–81 and how surface                  completed,87 see also specific science case Section 3.7.2. As
                                                                                                  vibrational dynamics change when going from the amorphous to                   mentioned in Section 1 HAS is particularly sensitive to light
                                                                                                  the crystalline phase.82 HAS measurements provide a precise                    adsorbates, including hydrogen, which has been used in a large
                                                                                                  window into polymer surface dynamics, complementing other                      number of fundamental structure and dynamic studies, see for

                                                                                                  7660 | Phys. Chem. Chem. Phys., 2021, 23, 7653–7672                                                      This journal is © the Owner Societies 2021
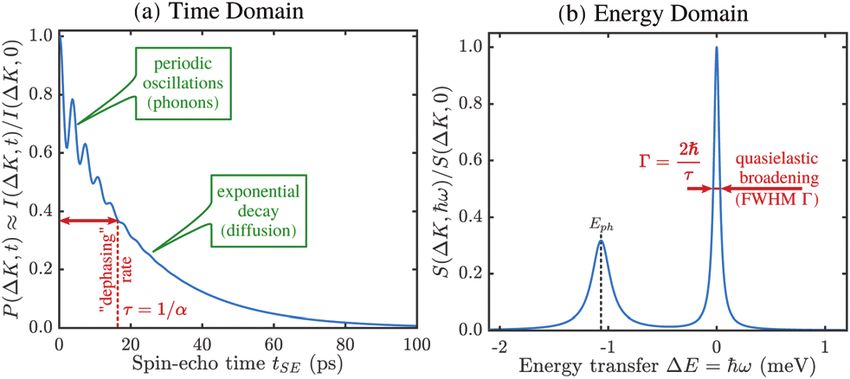
PCCP PERSPECTIVE - RSC ...
View Article Online

                                                                                                  PCCP                                                                                                                          Perspective

                                                                                                  example ref. 9, 15 and 88. In principle HAS can also provide very     systems and as a promising 2D insulator layer. It can be made
                                                                                                  precise information of the surface topography for periodic struc-     both as crystalline and vitreous films. For a recent review see
                                                                                                  tures. The surface corrugation is reflected in the relative inten-    ref. 97. A density functional theory (DFT) model of 2D silica
                                                                                                  sities of the HAS diffraction peaks (the form factor). However,       suggests that the topmost layer consists of a network of oxygen
                                                                                                  because inelastic scattering also plays a role, knowledge about the   atoms. This could not be confirmed using STM studies alone,
                                                                                                  interaction potential between the helium atom and the surface is      since depending on the bias voltage the oxygen atoms or the
                                                                                                  required to extract the surface corrugation. This can be obtained     silicon atoms were shown on top. However, from the STM
                                                                                                  as a model issued mainly from first principle calculations (or ab     studies the characteristic O–O distance of (0.26  0.02) nm
                                                                                                  initio calculations) or some simple interaction and geometrical       could be obtained. This could then be compared to HAS rocking
            This article is licensed under a Creative Commons Attribution 3.0 Unported Licence.

                                                                                                  models with fitting parameters. The best and more convenient          scans which displays a clear vitreous ring with a characteristic
Open Access Article. Published on 01 February 2021. Downloaded on 09/14/2021 09:04:09.

                                                                                                  dynamical theory is the close-coupling formalism which is exact       length of (0.25  0.01) nm. Since HAS probes the outermost
                                                                                                  when the numerical convergence is reached. In this formalism,         electron density distribution, the combination of STM and HAS
                                                                                                  the different diffraction channels are coupled among them and         could thus be used to confirm the DFT model for the structure of
                                                                                                  the number of channels depend strongly on the surface corruga-        2D silica.31
                                                                                                  tion. Single and multi-phonon events need to be calculated in             3.5.2 Specific science case: ripple corrugation of Gr/Ru(0001).
                                                                                                  order to obtain the attenuated diffraction intensities.89 This        The ripple corrugation of Graphene on Ruthenium has been
                                                                                                  method has been used, among others, to determine the surface          studied intensively both theoretically and experimentally using
                                                                                                  corrugation on semi-metals.90 Recently, an extension of this          STM, surface X-ray diffraction (XRD), low-energy electron diffraction
                                                                                                  theory which takes into account the e–ph coupling has also been       and theoretical calculations. XRD measurements display a periodi-
                                                                                                  proposed.91 It should also be noted that the position, shape and      city of (25  25)98 which differs from the (12  12) periodicity
                                                                                                  width of selective adsorption resonances, see Fig. 1, provides a      measured by STM.99 This discrepancy could be resolved as a
                                                                                                  powerful route for an experimental determination of the attractive    distortion of the first Ru layer under the graphene, which is
                                                                                                  part of the atom–surface interaction potential92 (see also Section    picked up by XRD. A combination of ultrahigh-resolution STM
                                                                                                  3.6.2). An article describing in detail the methods for obtaining     images and HAS diffraction data, could eventually show that the
                                                                                                  atom–surface interaction potentials from HAS experiments can be       graphene lattice is not only rippled, it is also rotated 51 relative to
                                                                                                  found as part of this special issue.92                                the Ru substrate.100 Furthermore the corrugation of the ripples
                                                                                                      It is appropriate to compare the capabilities of HAS to the       was investigated. The apparent amplitude in STM of the corru-
                                                                                                  standard tools for measuring nanoscale topography: Scanning           gation of the ripples decreases from 0.11 nm to 0.05 nm when
                                                                                                  Tunnelling Microscopy (STM) and Atomic Force Microscopy               the tunnelling bias goes from 0.8 to 0.8 V.101 The corrugation
                                                                                                  (AFM). Firstly it should be noted that both of these techniques       amplitude measured by HAS is 0.015 nm. DFT including van der
                                                                                                  are obviously more versatile than HAS because they provide real       Waals (vdW) interactions could later reproduce the change in
                                                                                                  space images and thus do not require the investigated samples         corrugation of the ripples with tunneling bias observed by STM,
                                                                                                  to contain periodic features.                                         but not the corrugation amplitude measured by HAS.102
                                                                                                      STM probes a combination of the surface topography and                3.5.3 Specific science cases: H-positions, proton order and
                                                                                                  the local density of states (LDOS). Which LDOS are sampled            water layers. Due to the large cross section of HAS to isolated
                                                                                                  depends on the bias voltage.93 In many cases this is a big            adsorbates (including hydrogen as described in Section 3.5),
                                                                                                  strength of STM because this flexibility in bias voltage can          the position and structure of hydrogen atoms and adsorbed
                                                                                                  provide additional, important information, but in some cases it       water layers can be readily determined.103–105 These include also
                                                                                                  can be valuable to distinguish the contribution from the surface      the hydrogenation of a graphene surface106 while H-positions are
                                                                                                  topography, a couple of examples are provided in Sections 3.5.1       hard to determine with other methods (e.g., hydrogen is a weak
                                                                                                  and 3.5.2 below. It should also be noted that STM requires the        scatterer for electrons) which also present a severe risk of
                                                                                                  substrate to be conducting.                                           damaging the H-layer.107 In a study of highly proton-ordered
                                                                                                      AFM probes the interaction potential between a tip and the        water structures on oxygen pre-covered Ru(0001) it could be
                                                                                                  surface. It is a very powerful technique which works regardless       shown that the atomic oxygen and the oxygen from water form
                                                                                                  of the substrate conductivity. Topographic information can be         a (2  2) surface reconstruction, which however, is broken by the
                                                                                                  obtained with any type of AFM imaging mode, but atomic                hydrogen to give a (2  4) surface reconstruction: while LEED
                                                                                                  resolution generally needs the use of dynamic AFM.94 In               measured a (2  2), HAS measured a (2  4) superstructure.108
                                                                                                  particular non-contact AFM has succeeded in atomic resolution
                                                                                                  imaging,95 however, as in STM, the contrast may be convoluted         3.6   HeSE: a unique tool for studying surface dynamics
                                                                                                  with other effects. For example it has been demonstrated that          Helium spin-echo (HeSE) is a recent variation on the HAS
                                                                                                  the type of atoms that form the tip apex decide the contrast,         technique109,110 which adds manipulation of the helium wavepack-
                                                                                                  which has lead to, e.g., hydrogen adsorbed on an oxide being          ets using the nuclear spin of 3He atoms, to enable dynamical
                                                                                                  imaged inversely as holes in the surface.96                           measurements to be obtained in a completely different way. Essen-
                                                                                                      3.5.1 Specific science case: the structure of 2D silica. 2D       tially, each helium wavepacket is split into two spin-components,
                                                                                                  silica (bilayer silica) is a novel, transferable 2D material, which   which are separated by a time, tSE, using a magnetic field, before
                                                                                                  has garnered interest as a model glass for supporting catalytic       they scatter in turn from the surface being studied. The two

                                                                                                  This journal is © the Owner Societies 2021                                         Phys. Chem. Chem. Phys., 2021, 23, 7653–7672 | 7661
PCCP PERSPECTIVE - RSC ...
View Article Online

                                                                                                  Perspective                                                                                                                                    PCCP

                                                                                                  scattered components are then recombined, and by averaging over
                                                                                                  the beam a surface correlation measurement is obtained as a
                                                                                                  function of the time, tSE, see Fig. 6.
                                                                                                      A schematic of the experimental setup can be found in
                                                                                                  Fig. 7. Measurements typically have the general form shown
                                                                                                  in Fig. 8, where phonons and other vibrations show up as
                                                                                                  oscillations and aperiodic changes, such as diffusion, show up
                                                                                                  as an overall decay.
                                                                                                      The result is a very powerful surface-correlation measurement
            This article is licensed under a Creative Commons Attribution 3.0 Unported Licence.

                                                                                                  in reciprocal space. The technique is sensitive between timescales
Open Access Article. Published on 01 February 2021. Downloaded on 09/14/2021 09:04:09.

                                                                                                  of less than a picosecond and nanoseconds, and on lengthscales
                                                                                                  between Ångstroms and many tens of nanometres. A very wide
                                                                                                  range of important physical processes occur within this measure-
                                                                                                  ment window (a more detailed comparison of experimental
                                                                                                  techniques is given in ref. 110) and in particular there are simply         Fig. 7 Schematic showing the principle parts of the Cambridge spin-echo
                                                                                                                                                                              scattering apparatus. An unpolarised beam of 3He is generated from a
                                                                                                  no other techniques that can probe equilibrium processes at
                                                                                                                                                                              supersonic beam source at the top left in a fixed direction. The beam is
                                                                                                  surfaces in this regime. The nearest comparable technique –                 then passed through a polariser and the aligned nuclear spins are rotated
                                                                                                  neutron spin-echo – is only weakly surface sensitive, so is limited         by the incoming solenoid (precession coil) before being scattering from
                                                                                                  to certain very specific systems.112 HeSE has therefore become the          the sample surface. The scattered beam passes back through the identical
                                                                                                  tool of choice for studying many surface processes and has already          but reversed field in the outgoing solenoid before being spin-analysed and
                                                                                                                                                                              counted in the detector.
                                                                                                  revealed a range of unique and otherwise unavailable physical
                                                                                                  insights. Moreover, due to the low energy of the probing particle
                                                                                                  beam delicate adsorbates such as water can be studied without
                                                                                                  disruption of the motion113 or dissociation of the molecule (see
                                                                                                  also Section 3.5.3).
                                                                                                      3.6.1 Mobility of atoms and molecules – rates and
                                                                                                  mechanisms. One of the core applications of HeSE is in
                                                                                                  measuring the rate and mechanism of motion of atoms and
                                                                                                  molecules on surfaces. Such measurements are deceptively
                                                                                                  difficult, and although many techniques attempt to measure
                                                                                                  surface diffusion,110 few can do so reliably, and no other
                                                                                                  technique can examine the detailed mechanisms of motion.
                                                                                                  Simple theoretical models of surface motion often assume
                                                                                                                                                                              Fig. 8 Representative form of a typical HeSE measurement, showing
                                                                                                  activated hopping, which is a gross simplification of reality.
                                                                                                                                                                              surface correlation as a function of time. Phonons and other vibrations
                                                                                                  HeSE measurements enable both rates and mechanisms to be                    show up as oscillations, while diffusion gives an overall decay.
                                                                                                  examined in detail.110 Activation energies can be obtained

                                                                                                                                                                              extremely accurately, for example to within 2 meV,114 and by
                                                                                                                                                                              using long length-scale measurements, both tracer and collective
                                                                                                                                                                              diffusion coefficients can be obtained. While microscopy may
                                                                                                                                                                              provide information in the low temperature regime, only HeSE
                                                                                                                                                                              can follow the diffusive process at high and industrially relevant
                                                                                                                                                                              temperatures i.e., studies on both microscopic length scales and
                                                                                                                                                                              on pico- to nanosecond timescales while the system is in true
                                                                                                                                                                              thermal equilibrium. By obtaining correlation measurements at
                                                                                                                                                                              a range of scattering momentum transfers, the entire mechanism
                                                                                                                                                                              of motion can be determined with great precision. It is possible to
                                                                                                                                                                              clearly distinguish jumping versus gliding (for example, for ring
                                                                                                  Fig. 6 Two wavepackets scatter from the surface with a time difference
                                                                                                                                                                              molecules on graphite115), as well as more complex motion such
                                                                                                  tSE, allowing the motion of molecules on the surface to be interrogated     as flapping (in the case of thiophene116), reorientation (pentacene
                                                                                                  through the loss in correlation, measured through the polarisation of the   moves on ‘‘rails’’117), rotational jumps118 and quantum tunnelling.119
                                                                                                  beam. The top inset shows a typical measurement with the linewidth          No other experimental technique has access to such a broad range of
                                                                                                  caused by a small Doppler broadening upon scattering from moving
                                                                                                                                                                              surface dynamical phenomena, with such precision.
                                                                                                  adsorbates and thus corresponding to the timescale of the molecular
                                                                                                  movement.111 Since the process is based on self-interference of each 3He
                                                                                                                                                                                 3.6.2 Potential energy surfaces, interaction potentials and
                                                                                                  atom, the polarisation loss depends only on the change in energy and not    benchmark for theory. HeSE data has been widely interpreted
                                                                                                  the beam energy itself.109                                                  within the Langevin dynamics model, which enables potential

                                                                                                  7662 | Phys. Chem. Chem. Phys., 2021, 23, 7653–7672                                                     This journal is © the Owner Societies 2021
You can also read