Brief communication: Remotely piloted aircraft systems for rapid emergency response: road exposure to rockfall in Villanova di Accumoli central ...
←
→
Page content transcription
If your browser does not render page correctly, please read the page content below
Nat. Hazards Earth Syst. Sci., 19, 325–335, 2019
https://doi.org/10.5194/nhess-19-325-2019
© Author(s) 2019. This work is distributed under
the Creative Commons Attribution 4.0 License.

Brief communication: Remotely piloted aircraft systems for rapid
emergency response: road exposure to rockfall in Villanova
di Accumoli (central Italy)
Michele Santangelo1 , Massimiliano Alvioli1 , Marco Baldo2 , Mauro Cardinali1 , Daniele Giordan2 , Fausto Guzzetti1 ,
Ivan Marchesini1 , and Paola Reichenbach1
1 Consiglio Nazionale delle Ricerche, Istituto di Ricerca per la Protezione Idrogeologica, via Madonna alta 126,
06128 Perugia, Italy
2 Consiglio Nazionale delle Ricerche, Istituto di Ricerca per la Protezione Idrogeologica, Strada delle Cacce 73,

10135, Turin, Italy

Correspondence: Michele Santangelo (michele.santangelo@irpi.cnr.it)

Received: 15 June 2018 – Discussion started: 16 July 2018
Revised: 29 December 2018 – Accepted: 18 January 2019 – Published: 7 February 2019

Abstract. The use of remotely piloted aircraft systems            41 500 simulated trajectories may potentially reach or cross
(RPASs) in geosciences is often aimed at the acquisition of       this tract of the road. Based on these data, limited protection
an image sequence to produce digital models and orthopho-         measures were suggested. The combined use of RPAS data,
tographs of the topographic surface. The technology can be        fused with ground GPS points, an accurate geomorpholog-
applied for rockfall hazard and risk assessment. To study         ical survey, and terrain static and dynamic parameters from
rockfalls, an approach consists in the application of numeri-     the literature allows fast, low-cost, and replicable rockfall nu-
cal models for the computation of rockfall trajectories. Data     merical modelling useful for emergency response and adop-
required for such simulations include digital terrain models,     tion of proper protection measures.
location of the instability source areas, and the mechanical
properties of the terrain. In this article, we present an anal-
ysis of the earthquake-triggered rockfall that occurred along
the SP18 in Villanova di Accumoli (Lazio, central Italy) dur-
ing the seismic sequence that started on 24 August 2016. A        1   Introduction
survey with a multicopter was carried out to obtain a sur-
face model of the terrain and identify and characterize the       Rockfall is a widespread natural hazard that poses continuous
source areas and other instable blocks in areas not accessible    risk to the population in mountain areas worldwide (Whal-
in the field. The investigated area extends for 6500 m2 and       ley, 1984; Guzzetti et al., 2002). Due to the prevalent type of
was covered by 161 photographs that were used to obtain an        movement (free falling, bouncing, rolling, sliding), rockfalls
orthophoto with a ground resolution of 2.5 cm and a digi-         are among the fastest and deadliest landslide type (Evans,
tal surface model with a ground resolution of 20 cm × 20 cm,      1997; Guzzetti et al., 2002). Rockfalls can be triggered by
which was processed and fused with GNSS real-time kine-           earthquakes, intense rainfall, frost weathering, wind, root
matic data. To obtain a map of potential rockfall trajecto-       growth, and even traffic (Guzzetti et al., 2004). The ele-
ries, we run the numerical model STONE, using as origin           ments most exposed to rockfall hazard are transport corri-
of the boulders both source areas mapped in the field and         dors (Guzzetti et al., 2002; Budetta, 2004; Guzzetti et al.,
pixels with a slope angle above a selected threshold. Results     2004), which often cross hazardous areas. In particular, rock-
showed that only the part of the road SP18 already affected       falls cause relevant damage to structures and infrastructures
by the rockfall was exposed to further rockfall impacts. In       along secondary and minor transport networks, where ade-
particular, it was observed that 29.2 % (i.e. 12 123) of the      quate protection measures are not economically sustainable

Published by Copernicus Publications on behalf of the European Geosciences Union.
326                                                                        M. Santangelo et al.: RPAS for rockfall modelling

(Corominas et al., 2005; Ferlisi et al., 2012), and pose a se-        High-resolution elevation data can also be collected by
vere risk to people.                                               aerial and terrestrial laser scanners, which acquire a set
   During triggering events such as seismic sequences, ar-         of measures of distance between the laser scanner and the
eas exposed to rockfall hazard can be hit in several places        ground surface (Jaboyedoff et al., 2012; Razak et al., 2013).
(Guzzetti et al., 2004), causing much damage and multi-            A terrestrial laser scanner (TLS) is often adopted to study
ple interruptions of the infrastructure, particularly roads and    rocky slopes and other types of landslides (Baldo et al.,
rails. In such events, it is important to characterize the most    2009). Use of a TLS often requires the integration of mul-
critical situations along roads and rails to guarantee, in short   tiple surveys taken by different points of measure to ensure
time spans, the safe use of the transportation infrastructure.     the coverage of complex morphologies. Arguably, the ap-
Operating workflows to better characterize rockfall source         plication of such a technique is limited by an overall ben-
areas and trajectories could lead to identifying areas where       efit in terms of quality and time compared to other tech-
rockfalls can interact with roads, allowing for tailored pro-      niques. In particular, the local morphological setting could
tection measures, and developing more rapid infrastructure         require multiple points of acquisition, which would imply a
protection activities.                                             longer acquisition and processing time. An aerial laser scan-
   Defining the potential interaction of rockfalls with            ner (ALS) has shown good performances in densely vege-
elements at risk, knowing their geographic location, is            tated areas (Razak et al., 2013) where photogrammetric tech-
a challenging task. Empirical, process-based, and GIS-             niques are more limited in obtaining ground elevation data.
based software including STONE (Guzzetti et al., 2002),            Conversely, ALS is not effective for the characterization of
HY-STONE (Agliardi and Crosta, 2003), CONEFALL                     sub-vertical slopes, and rock cliffs, where the acquisition of
(Jaboyedoff and Labiouse, 2011), and Rockyfor3D (Luuk              oblique photo-sequences is the best solution for a more de-
Dorren, 2015) has been implemented and used to model               tailed representation of rockfall source areas (Giordan et al.,
the spatial pattern of rockfall trajectories. All the mod-         2015a). Use of RPASs for SfM is a solution that requires
elling approaches are based on at least a given distribution       limited costs, short mission planning, and a brief setup time
of rockfall source areas and a digital elevation model             compared to ALS, particularly when the study area is small
(DEM). Detection and mapping of unstable rock masses               (up to a few square kilometres). Such advantages can be im-
can be accomplished by field activities, interpretation            portant, particularly where a multi-temporal approach has
of high- and very high-resolution images and DEMs,                 to be adopted to detect the evolution of the studied area
or using morphometric criteria (Michoud et al., 2012).             (Fiorucci et al., 2018) or during emergencies, when support
Depending on the scale of the modelling, elevation data            to decision makers for the identification and planning of first
can be coarse to very fine. For example, for regional-scale        responses must be provided quickly (Giordan et al., 2015b).
modelling, a ground sampling distance (GSD) of 25 m                The capability of RPASs to provide very high-resolution geo-
(Guzzetti, 2003) (http://damocles.irpi.cnr.it/docs/final_          referenced images in a short time can be effective to support
reports/Perugia-Detailed-Report-Feb2001-Mar2003.pdf,               fast emergency responses in areas affected by natural disas-
last access: 25 January 2019) or 10 m is adequate (Guzzetti        ters (Chou et al., 2010; Ezequiel et al., 2014; Xu et al., 2014;
et al., 2003), whereas very high-resolution elevation data         Boccardo et al., 2015; Liu et al., 2015; Huang et al., 2017).
(GSD of 1 m or less) are suitable for slope-scale models.          The major limitation of RPASs is the extension of the area
   High- and very high-resolution elevation data can be suc-       that can be surveyed in a single flight (Fiorucci et al., 2018).
cessfully acquired using cameras mounted on remotely pi-              According to Giordan et al. (2015a), two approaches can
loted aircraft systems (RPASs). The acquired high(ultra)-          be adopted for the use of RPASs depending on the slope
resolution images with different orientations of the camera        steepness and the target resolution. For steep slopes, the
(nadir, oblique) can be used to obtain elevation data through      use of multirotor RPASs, which allow us to acquire oblique
the application of structure from motion (SfM) algorithms          photographic-sequences, is recommended. Conversely, on
(Westoby et al., 2012; Nex and Remondino, 2014). SfM is            gentle slopes nadir acquisition carried out by fixed-wing
a photogrammetric-range imaging technique capable of find-         RPASs can be considered the best solution to obtain a high-
ing homologue points in a sequence of images acquired with         resolution coverage of large areas. In the study of areas
a high overlap and transforming the homologue points in a          affected by rockfall, a hybrid approach can be considered
georeferenced cloud of elevation points (Turner et al., 2012).     for the acquisition of a DSM that can be used for the def-
The accuracy of the positioning of SfM products can be im-         inition of rock block trajectories and the identification of
proved using ground control points (GCPs) whose position is        source areas. RPASs guarantee the possibility of also acquir-
measured using GNSS (Global Navigation Satellite System)           ing high-resolution DEMs in inaccessible areas (Obanawa et
(Nex and Remondino, 2014). The main products of RPAS               al., 2014). Several examples of the use of RPASs for the ac-
photogrammetry that can support the study of rockfalls are         quisition of oblique (Salvini et al., 2016, 2018; Giordan et al.,
digital surface models (DSMs) and true orthophotographs            2015b; Török et al., 2018; Huang et al., 2017) and nadiral im-
(Giordan et al., 2018).                                            age sequences (Saroglou et al., 2018) for the identification of
                                                                   rock slope instabilities have been published in recent years.

Nat. Hazards Earth Syst. Sci., 19, 325–335, 2019                            www.nat-hazards-earth-syst-sci.net/19/325/2019/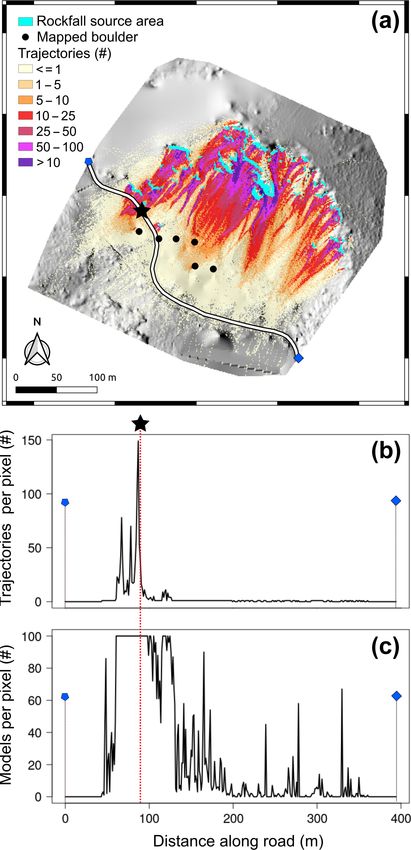
M. Santangelo et al.: RPAS for rockfall modelling 327
Despite such an increasing attention to applications of crops out. At the base of the slope, the top of the landslide
RPAS images and photogrammetry to landslide risk assess- deposit is covered partially by talus that supports a dense de-
ment, only a limited number of articles focuses on applica- ciduous wood.
tions during emergencies (Chou et al., 2010; Boccardo et al., In the study area, a regional thrust brings the carbonatic
2015; Liu et al., 2015; Huang et al., 2017) and on the as- units of the Umbria-Marche stratigraphic sequence over the
sessment of the extent of damage caused by natural disasters Laga Formation (Cacciuni et al., 1995). The boulders that
(Gomez and Purdie, 2016). Furthermore, none of them, to hit the SP18, and the majority of the boulders found on the
the best of our knowledge, focus on testing a procedure that talus slope above the SP18 road, belong to the Maiolica Fm.,
guarantees semi-quantitative information in a relatively short a layered and highly fractured mudstone, upper Jurassic to
time to provide an evaluation of the residual rockfall risk dur- lower Cretaceous in age.
ing emergencies, when there are time and budget constraints. In the following, we describe the two rockfall source ar-
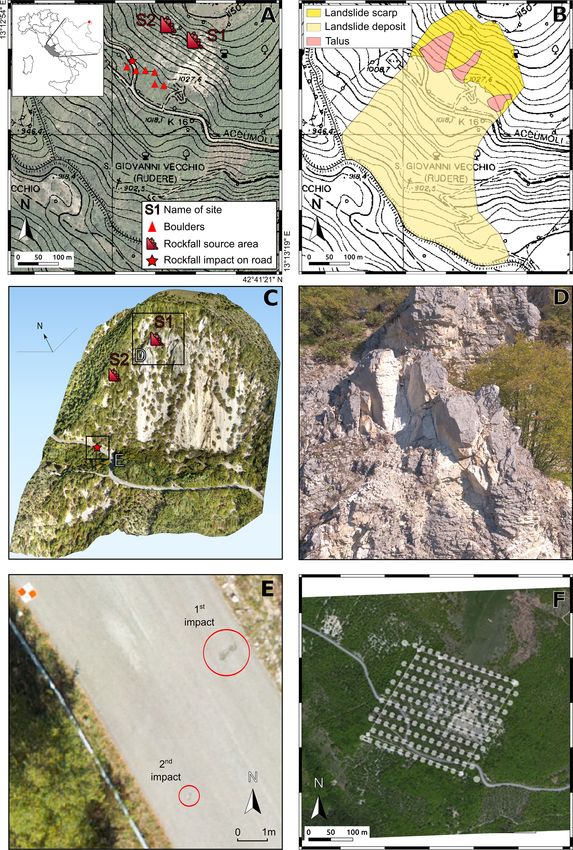
In 2016, central Italy was affected by a very long and se- eas, shown as “site 1” (S1) and “site 2” (S2) in Fig. 1a, c,
vere seismic sequence that began on 24 August with a Mw recognized during the field survey.
6.0 earthquake, followed by a second main shock on 26 Octo- Site 1 (S1 in Fig. 1c, d) is a 30 m high cliff in fractured
ber (Mw 5.9), and third on 30 October (Mw 6.5). The seismic limestone 110 m NE from the road. The talus downhill of
sequence, characterized by more than 50 000 aftershocks in 4 the cliff has an average slope of about 31◦ . It was partly
months, triggered numerous rockfalls that caused damage to exploited in the 1950s, and in the quarry area, the average
structures and infrastructures. In this paper, we describe the slope is 40◦ . Moving from the source area to the road, the
use of RPASs to study an earthquake-triggered rockfall in slope shows a decreasing inclination. For a distance of 50 m
the vicinity of the Villanova di Accumoli, Rieti, central Italy. uphill of the road, a system of scarps, counter scarps and
The provincial road SP18 near Villanova di Accumoli was rough and ruined embankments parallel to the SP18 was de-
closed after a 1 m3 boulder fell from a rock cliff and crossed veloped to protect the road during the quarry activities that
the road (Fig. 1). During the seismic emergency, the Italian removed a large part of the original talus. The quarry protec-
National Department of Civil Protection was supported by tion system is now completely wooded. Field observations
the Research Institute for Geo-Hydrological Protection of the revealed that the boulders detached from S1, moved primar-
Italian National Research Council (CNR-IRPI) in the defini- ily along ballistic trajectories (“ree fall”) as suggested by the
tion of the conditions to safely reopen the road. To answer impact points found on the ground and the scars left on the
the request, a numerical model was applied to evaluate pos- tree trunks. At impact points on bedrock and talus, the fallen
sible rockfall trajectories and to define locations where the blocks broke up in pieces, the larger of which 0.25–0.30 m3
road was exposed to further rockfall hazard. in volume, were found on the nearly flat area uphill of the
road. Analysis of the scars left by the falling blocks on the
trees revealed that the rockfall trajectories did not exceed an
2 Study area elevation above the local terrain of about 1.5 m. Based on the
boulders found in the field, the area enclosing the trajecto-
The study area is located close to the village of Villanova ries of the rockfalls detached from S1 is estimated in about
di Accumoli, in the Accumoli municipality, central Italy 4000 m2 . The pre-failure morphology of the S1 source area
(Fig. 1a). In the area, the main vulnerable element subject was estimated heuristically, by visual interpretation of the or-
to rockfalls was a portion of the SP18 road connecting Vil- thophotos, which then allowed to estimate the volume of the
lanova di Accumoli to the San Giovanni village (Fig. 1a). detached mass (about 7 m3 ) from the DEM, where the height
The area consisted of a rocky hillslope from which rock- of the unstable wedge was measured. Based on the evidence
falls detached, reaching the SP18 road (Fig. 1a). Visual inter- of the fracturing of the remaining unstable rock mass (i.e.
pretation of stereoscopic black and white aerial photographs orthophotos and field observations), it is possible to hypoth-
taken in 1954 at 1 : 33 000 scale revealed that the cliff from esize that the initial detached rock mass consisted of a few
where the rockfall originated is part of a partially dismantled large boulders that then further fragmented. The rocky mate-
scarp of a deep-seated, disrupted rockslide (Fig. 1b). Addi- rial detaching from S1 did not reach the SP18, but stopped on
tional visual interpretation of stereoscopic colour aerial pho- the talus deposit and on the quarry protection system. Visual
tographs taken in 1977 at 1 : 13 000 scale revealed that the analysis of the photographs taken by the RPAS (Fig. 1d) al-
main landslide rocky escarpment is characterized by two ar- lowed identification of several unstable rock blocks present
eas that underwent progressive retreat, forming three cone- in the vicinity of S1. Such rock blocks were partially sep-
shaped, convex, sparsely vegetated talus deposits (Fig. 1b). arated from the bedrock by open fractures, which could be
The analysis of the two sets of aerial photographs revealed further enlarged due to intense rainfall and by frost and thaw
that in the central part of the escarpment the talus deposit was cycles, not infrequent in the area from late autumn to early
mined and partly removed between 1954 and 1977 (Fig. 1b). spring. The overall volume of the unstable blocks was esti-
Outside of the talus deposits, the landslide scarp shows an mated in the range of 30–50 m3 by combining a GIS measure
average slope of around 40◦ , it is mainly bare and bedrock of the area recognized on the orthophoto (10 m2 ) and field
www.nat-hazards-earth-syst-sci.net/19/325/2019/ Nat. Hazards Earth Syst. Sci., 19, 325–335, 2019328 M. Santangelo et al.: RPAS for rockfall modelling Figure 1. Location of the study area. (a) Topographic map: Carta Tecnica Regionale of the Lazio region, at 1 : 10 000 scale. Colour orthophoto map: Ortophoto 50 cm copyright 2012 AGEA – all rights reserved. Symbols named S1 and S2 indicate the source areas of the fallen boulders. The red star shows the location where a boulder hit and crossed the SP18 road. Red triangles indicate the boulders found at the farthest locations from the source areas along the talus slope during the field survey. (b) Map of surface deposits obtained through the visual interpretation of the available aerial photographs. (c) Three-dimensional perspective of the study area. Image base and elevation data were obtained ad hoc through a RPAS flight carried out on 10 October 2016. (d) S1 rockfall source area. Oblique photograph taken by the RPAS. (e) Detail of the orthophotograph obtained by the RPAS showing impact points of the boulder detached from the S2 source area. (f) Flight plan of the multicopter for the acquisition of aerial photographs. Nat. Hazards Earth Syst. Sci., 19, 325–335, 2019 www.nat-hazards-earth-syst-sci.net/19/325/2019/
M. Santangelo et al.: RPAS for rockfall modelling 329
observation together with 3-D measures obtained from the The geographical coordinates of both GCPs and CPs were
DEM, for which the height of the unstable rock blocks was obtained using a GNSS RTK VRS (Global Navigation Satel-
estimated to range between 3 and 5 m. lite System, real-time kinematic, virtual reference station)
Site 2 (S2 in Fig. 1c) is located along a slope covered positioning technique. The estimated planimetric–altimetric
by a talus deposit, with a mean slope angle of about 32◦ . accuracy of the absolute positioning of the GCPs and CPs
From S2, a 1 m3 boulder detached and reached the SP18 road was about 10 cm.
(Fig. 1c, e). The analysis of the boulder impact points on the To produce a DEM, the fingerprint of vegetation and other
road (Fig. 1e) and its final position allowed us to reconstruct elements that could hide the ground were filtered out. For
the boulder trajectory, from 70 to 90 m uphill of the road, this purpose, we first used a geometric and a radiometric
where we were able to identify the most likely source area filter available in Photoscan® . Next, we performed a man-
(Fig. 1a, c). Along the hillslope of S2, six boulders of sim- ual cleaning of the terrain elevation data. After the cleaning,
ilar size were found on the talus deposit. It is possible that Photoscan® was used to interpolate the remaining ground
the seismic shocks worsened the stability conditions of the points. In some sectors, the interpolation was based on a very
boulders, increasing the rockfall hazard along the road. limited number of data points due to the coverage of trees,
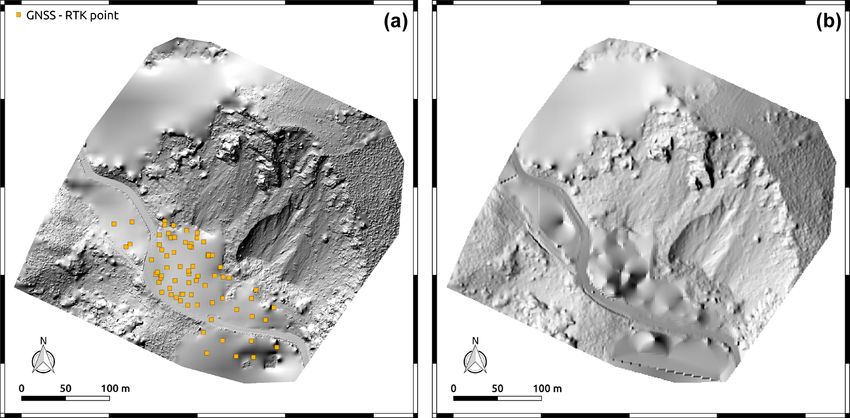
Analysis of the distribution of the rockfall impact points which resulted in an over-smoothed DEM (Fig. 2a).
and of the tree scars suggested that the height of the trajectory
of the 1 m3 boulder never exceeded 1 m above the ground. 3.3 GNSS RTK VRS elevation data integration
The boulder did not break along its path and stopped 15 m
downslope of the SP18. In the areas where the elevation information was unavail-
able (due to the presence of trees), we obtained additional
elevation information with a GNSS survey, applying an
3 Methods RTK VRS correction. For this purpose, we used a Leica®
Zeno 20 (https://leica-geosystems.com/, last access: 25 Jan-
3.1 Elevation data acquisition uary 2019) device in conjunction with an Android smart-
phone with GPRS connection for the real-time correction of
Numerical modelling of rockfalls requires the availability of the positioning (RTK VRS). We acquired a total of 73 points
an accurate digital model of the topographic surface. For this (Fig. 2a), corresponding to an average density of one point
purpose, we performed a dedicated RPAS image sequence every 100 m2 (i.e. a GSD of approximately 10 m) with a nom-
acquisition using a SenseFly® Albris® multicopter equipped inal positional accuracy of less than 1 m.
with a 34 Mpixel RGB camera and an on-board GNSS sys- To obtain a continuous DEM covering the entire study
tem for the accurate geolocation of the acquired images. A area, we merged the two elevation data sets obtained from the
total of 161 nadir photographs with a frontal overlap of 75 % aerial and the ground-based surveys. For this purpose, a mask
and a side overlap of 60 % were taken at an altitude of 90 m of the wooded area was drawn in the GIS, and a 5 m external
above the ground (Fig. 1f). The altitude above the ground was buffer was applied to enclose a 5 m wide band containing el-
set up using the dedicated mission planner using the SRTM evation data from the DEM generated by SfM in the area.
DEM (Farr et al., 2007) for reference. Keeping constant the Elevation data contained in the buffer were then included
elevation of the flight with respect to the ground guaranteed in the interpolation of the 73 GNSS RTK VRS data points
a homogeneous GSD across the study area. The resulting using the linear Delaunay interpolation method available in
photographs cover an area of about 65 000 m2 with a GSD the v.surf.nnbathy GRASS GIS tool (GRASS Development
of about 1.5 cm × 1.5 cm. Using this ultra-resolution photo- Team, 2017). Using the elevation data available in the buffer
graphic sequence, we prepared an orthophotograph of the en- guaranteed that no step-like features occurred at the junc-
tire study area with a nominal ground resolution of about tion between the original DEM and the DEM obtained by the
2.5 cm × 2.5 cm and a DSM with a nominal ground resolu- GNSS RTK VRS survey in the wooded area (Fig. 2b). The
tion of about 20 cm × 20 cm. GSD of the merged DEM was set to 1 m, the highest res-
olution handled by the rockfall modelling software STONE
3.2 Structure from motion applied to RPAS
(Guzzetti et al., 2002).
ultra-resolution images
We stress that the DEM accuracy is not uniform over the
We processed the collected images using Agisoft entire study area. The information is denser and more ac-
PhotoScan® software (http://www.agisoft.com, last access: curate in unwooded areas, where the elevation was obtained
25 January 2019) and produced the true orthophotograph by the SfM, as opposed to areas where data were collected
and the DSM. A total of 10 GCPs were used to improve the by the GNSS survey. Despite the information under the tree
accuracy of the geographic positioning of the DSM and the canopies being less dense than in the rest of the area, the
orthophotograph. GCPs consisted in 40 cm × 40 cm targets. GNSS points were acquired to best represent the ground mor-
The positioning accuracy of the resulting DSM and true phology.
orthophotograph was evaluated using 70 additional CPs.
www.nat-hazards-earth-syst-sci.net/19/325/2019/ Nat. Hazards Earth Syst. Sci., 19, 325–335, 2019330 M. Santangelo et al.: RPAS for rockfall modelling
Figure 2. Shaded relief images of the elevation of the study area. (a) Image prepared using the DEM obtained with the photogrammetric
procedure, after vegetation filtering. (b) Image prepared integrating the GNSS RTK data points (yellow squares in a) with the DEM. DEM
shown in (b) was resampled at a resolution of 1 m × 1 m, for modelling purposes.
3.4 Numerical modelling of rockfalls Table 1. Values of the dynamic rolling friction angle and of the nor-
mal and tangential energy restitution coefficients assigned to differ-
ent terrain types.
Numerical modelling of rockfall was performed using
STONE, a software for the 3-D, kinematical simulation of Terrain type Rolling Normal Tangential
rockfalls (Guzzetti et al., 2002). STONE simulates the move- friction restitution restitution
ment of a boulder along a slope within a three-dimensional
Landslide scarp 0.30 65 80
approach, considering the moving boulder dimensionless and Talus 0.65 35 55
with all the mass concentrated in the centre of mass, and Landslide deposit 0.40 45 55
computing the trajectory at discrete time steps. Within each
time step, the boulder can be in one of three “states”, i.e.
free fall, rolling, or bouncing. The trajectory of a boulder is
computed automatically from the DEM, and it depends on
the starting point, the topography, and the coefficients used ing information is given: (i) the number of modelled rock-
to simulate the loss of velocity at the impact points or during fall trajectories, (ii) the maximum velocity of the simulated
the rolling state. The coefficients can be obtained from exist- rockfalls, and (iii) the maximum height reached by the simu-
ing thematic data or estimated analysing geological, geomor- lated trajectory. The three quantities can be used to evaluate
phological, and land cover maps (Table 1). For each simula- rockfall hazard (Guzzetti et al., 2003, 2004). In particular,
tion, and for each simulated trajectory, the program allows we considered the count of the simulated rockfall trajecto-
a random variation in the coefficients and in the initial di- ries as a proxy for the probability that a given grid cell is
rection of motion, resulting in an output with probabilistic affected by a rockfall. The larger the number of trajectories,
content. The minimal input required to perform a simulation the larger the expected likelihood of rockfall occurrence in a
with STONE consists of four raster maps, containing (i) el- given cell. The grids containing the maximum velocity and
evation information (i.e. the DEM), (ii) the location of the height of the possible rockfall were not used in this work.
rockfall detachment areas (source grid cells), (iii) values of Analysis of the map of the trajectories allows us to distin-
the parameters describing the tangential and the normal en- guish segments of the road that are predicted to be safe from
ergy restitution at each impact point, and (iv) values of the the ones with a non-negligible probability to be hit by a rock-
parameter used to describe the dynamical friction coefficient fall. Rockfall source areas were selected based on field ob-
where the rockfall is rolling (Guzzetti et al., 2002). servations and orthophoto interpretation. Additional source
The output of the software consists of three raster maps areas were singled out by selecting cells with a slope steeper
(Guzzetti et al., 2002) in which, for each grid cell, the follow- than 60◦ according to the measurement of the slope (derived
Nat. Hazards Earth Syst. Sci., 19, 325–335, 2019 www.nat-hazards-earth-syst-sci.net/19/325/2019/M. Santangelo et al.: RPAS for rockfall modelling 331
from the DEM) of the potentially unstable rocky escarpments
observed in the field.
Assigning the values of energy restitution and dynamic
friction parameters required by the STONE model is a some-
what arbitrary, heuristic operation. In this work, parame-
ters were assigned modifying the values selected in previous
works (Guzzetti et al., 2003, 2004) according to the field ob-
servations.
We have prepared 100 different DEMs modifying the el-
evation values of the 73 GNSS RTK points by adding delta
values to the original elevation data. Delta values were ob-
tained randomly sampling from a Gaussian distribution that
reproduces the error values declared by the instrumentation
(µ = 0, σ = 0.25). Each set of modified elevation points was
interpolated following the approach described before. The set
of 100 DEMs was used to evaluate the spatial distribution of
rockfall trajectories considering the topographic uncertainty.
4 Results and discussion
From the 1938 cells identified as source areas (light blue
polygons in Fig. 3a), STONE was run 100 times, one for
each modified DEM (see Sect. 3.4), simulating a total of
193 800 rockfall trajectories per simulation (i.e. 100 launches
per source cell). The raster map in Fig. 3a shows, for each
cell, the mode of the number of trajectories obtained in the
100 simulations, whereas the plot in Fig. 3b shows the val-
ues obtained along the SP18 track. Figure 3c shows, for the
pixel along the road, the number of simulations in which the
trajectory count is greater than 0.
Considering the map in Fig. 3a, the trajectories affect an
area of 56 032 cells (m2 ), with the count values ranging be-
tween 1 and 652. Furthermore, a total of 32 800 pixels as-
sume a value greater than 1.
Inspection of Fig. 3b–c reveals that the tract of the road Figure 3. (a) The map shows the mode of count of trajectories of
downhill of S2 is the most hazardous and that the location of 100 STONE simulations (see text for explanation). Black circles
the impact point matches the area where the STONE output indicate the location of large boulders observed during the field sur-
assumes the highest values of both the number of trajectories vey at their farthest distance from the source areas (light blue poly-
(Fig. 3b) and the hit frequency (Fig. 3c). The portion of the gons). For each pixel along the road track, (b) shows the values of
SP18 closest to the source site S1 was not hit by the rock- the map (a) and (c) shows the number of STONE simulations in
falls during the seismic sequence. This is confirmed by the which trajectory count is greater than 0. The star indicates the posi-
STONE simulations, which reveal a total of 957 pixels af- tion of the impact point along the SP18; blue symbols show the end
points of the road track.
fected by possible trajectories with a mode value of 1 within
the road or downhill of it. The 957 pixels represent 0.49 %
of the total number of the simulated trajectories and 0.6 % of
the trajectories simulated uphill from this tract of the road of simulated trajectories and 29.2 % of those simulated uphill
(152 300). Such figures can be considered negligible. The from this portion of the road track. Furthermore, local values
plot in Fig. 3c also confirms that in most of the simulations, reaching 204 trajectories were identified downhill from S2.
the trajectories did not reach this tract of the SP18. Contrary, Finally, at the pixel scale, we computed the coefficient of
the portion of the SP18 downhill from S2, and which was variation (CV = σ/µ) of the number of trajectories computed
hit by the rockfall during the seismic sequence, is correctly in the 100 simulations. CV is a measure of the variability in
predicted by the model as subject to rockfall hazard. In de- a sample normalized by the average value of the distribution.
tail, the model output identifies a total of 12 123 trajectories The distribution of the CV values shows a standard deviation
crossing the road, accounting for 6.2 % of the total number of 0.17 and a mean of 0.20, which indicates that the model
www.nat-hazards-earth-syst-sci.net/19/325/2019/ Nat. Hazards Earth Syst. Sci., 19, 325–335, 2019332 M. Santangelo et al.: RPAS for rockfall modelling can be considered stable despite the errors introduced by the et al., 2012) has a relevant effect on model results. The rock- GNSS RTK topographic measurements. fall simulation prepared by STONE confirmed that the por- The workflow described in this paper for the assessment of tion of the SP18 road affected by the rockfall is rather limited the road exposure to rockfall hazard was carried out during a (Fig. 3c). During the emergency phase, this information was seismic emergency phase to support the Italian National De- provided to the National Department of Civil Protection to partment of Civil Protection in the decision whether or not to support the decision about the road reopening conditions. It safely reopen the SP18 road to traffic. The diffuse presence was advised that the road could be safely reopened to the of trees in the study area would have required an ALS sur- traffic, provided that (i) protection measures were installed vey to collect ground elevation data under the tree canopy. above the SP18 road where the model indicated the expo- However, since the seismic emergency framework imposed a sure of the road to rockfall trajectories and (ii) that the rock- strict time constraint, a lidar acquisition was ruled out since fall barriers installed should take into account the size of the it would have required a long planning, preparation, and boulders recognized in the field. post-processing time compared to other techniques. Among Modelling results show that outside the most hazardous the existing photogrammetric acquisition approaches, use of part of the SP18 (Fig. 3), only a few locations are poten- RPAS photogrammetry has a number of advantages in terms tially affected by rockfalls. Here, the pixels that could po- of feasibility, planning and management easiness, and good- tentially be reached by rockfalls along the road show count quality data acquisition, which also make it one of the most values of 1. It is worth noting that, over 100 trajectory sim- widespread and used approaches in the private professional ulations for each source pixel, a count value of 1 suggests sector. From the methodological point of view, the applica- a probability of occurrence that is equal to 1 × 10⁻² . It ac- tion described in this study can be considered a procedure, tually corresponds to probability values much smaller since applicable during emergencies, for the acquisition of all the most frequently a single pixel can be crossed by trajectories required elements that can support the implementation of nu- starting from different (even not so close) locations. In the merical models for rockfall hazard and risk assessment at a case of the tract of the road threatened by the site S1, the relatively low cost. For areas up to a few tens of square kilo- 957 trajectories that could reach the road represented 0.6 % metres, the use of RPASs is the cheapest and fastest method of the total number of simulated trajectories (152 300). This for the acquisition of orthophotos and DSMs but, conversely , estimate was obtained by counting the number of pixels used vegetation hampers the quality of the resulting DEMs, which as source area located uphill of the road in S1 and the total is fundamental to obtaining reliable numerical rockfall simu- number of trajectories that reached the road in the mode map lations. To overcome this limitation, integration of aerial im- (Fig. 3a). Such a method represents a semi-quantitative es- agery with GNSS RTK points measured in the field is manda- timate. Like other rockfall modelling software, STONE out- tory for accurate mapping applications, especially when the puts a frequency map, whereas the evaluation of the proba- accuracy required as input by the numerical model is not very bility of rockfall still represents an open problem due to the high. The availability of ultra-high-resolution images can be presence of the pixels where modelled trajectories overlap very useful for the delineation of rockfall source areas, one with others modelled from other source areas. Hence, a rig- of the inputs required by numerical modelling. orous probabilistic estimation would require that each trajec- The results of STONE are influenced by the values of the tory should be modelled keeping track of the source area. tangential and normal restitution and dynamical friction co- Possible future development of STONE or similar rockfall efficient, which are assigned based on the characterization of models should be able to define a probability value, which the land cover, in most cases accomplished by geomorpho- would allow better comparison of the rockfall hazard condi- logical mapping (Fig. 1b). In this case, the detailed geomor- tions in different areas. phological mapping was carried out based on a rigid set of STONE does not take into account the vegetation effect, rules and criteria that make it repeatable and less subjective although, in this case, the presence of a thick wooded area at (Santangelo et al., 2015a, b; Fiorucci et al., 2018). To prove the foot of the slope acts as a natural rockfall attenuator be- the influence of the detail of the geomorphological mapping tween the source areas and the road. As already pointed out on the results, we run STONE assigning the parameters by by Guzzetti et al. (2004), despite the rockfall modelling be- generalizing the initial geomorphological map, considering ing aimed at describing possible rockfall scenarios given the the entire scarp of the rockslide as a talus, instead of distin- current state of the places, it appears poorly precautionary to guishing the three smaller talus deposits in the same slope. consider the barrier effect of the trees in the final assessment. Results showed that assigning the parameters based on a gen- Future wildfires could leave the road unprotected, causing an eralized version of the geomorphological map results in tra- increase in the overall rockfall hazard. jectories that do not reproduce the location of the boulders A non-negligible point of discussion consists in the observed in the field. This is consistent with the relatively caveats that should be taken into account when using model larger value of the friction coefficient ascribed to talus than outputs that contain sources of uncertainty at some step of landslide scarp (Guzzetti et al., 2004). Such evidence shows the procedure to support decision-making. In this case, for that the quality of the geomorphological mapping (Guzzetti instance, a DSM at 20 cm GSD, which is inhomogeneous Nat. Hazards Earth Syst. Sci., 19, 325–335, 2019 www.nat-hazards-earth-syst-sci.net/19/325/2019/
M. Santangelo et al.: RPAS for rockfall modelling                                                                                    333

across the study area due to the presence of the tree canopy,      the road. The remaining portion of the studied tract of the
was acquired. The entire DSM was resampled at 1 m GSD,             SP18 was reached by 0.6 % of the modelled trajectories up-
which is the minimum working resolution of the model               hill from the tract of SP18, and hence its exposure to rockfall
STONE and a reasonable resolution able to capture micro-           was considered negligible. It is worth mentioning that results
morphological features and portray the general morphology          of this study were used to set up protection measures (i.e.
reconstructed under the tree canopy by the GNSS RTK sur-           elastic barriers) along the track of the road more exposed to
vey. Despite the average GNSS point density being one point        rockfall impacts.
per 100 m2 , the acquisition was planned to best represent            The described procedure is general and can be success-
the ground morphology, which is characterized by a series          fully applied during emergency phases and in mountainous
of two scarps and counter-escarpments probably built during        regions like the study area. The complete photogrammetry-
the quarry exploitation. In our case, it was not possible to       based procedure described in the paper was carried out in 4
obtain a better acquisition because of the following practical     working days by a multidisciplinary team, which correspond
limitations: (i) the GNSS signal under the tree canopy was         to a total of 15 working days for one person at an overall
unstable; hence almost every measure had to be repeated sev-       cost of EUR 23 000. Considering all the working phases, it
eral times to obtain the minimum required accuracy of 1 m,         is faster and cheaper than lidar surveys and has fewer logis-
and (ii) the GPRS signal was also poor, causing several inter-     tic constraints. Conversely, it is limited by high vegetation
ruptions in the RTK connection. For these reasons, when ac-        cover. The GNSS RTK survey can partially solve this limi-
quiring such data in the field, it is advised to collect as many   tation, but it is important to know that the final DEM has a
data points as possible. Moreover, in places where the en-         different quality under the tree canopies and on bare areas.
vironmental conditions are unfavourable, acquisition should           STONE fails to reproduce the position of the boulders ac-
be performed to catch the most representative morphological        tually fallen during the seismic sequence if parameters are as-
features.                                                          signed based on generalized geomorphological maps of the
   The overall cost of the materials (i.e. the RPAS, software      covers. Therefore, it is advised that the quality of the input
licenses, GNSS receiver) used in our test case totalled about      geomorphological mapping be as high as possible and com-
EUR 23 000, which is considerably less than lidar acquisition      patible with the resolution of the input DEM.
at a comparable resolution. The entire procedure was carried
out in 4 working days (estimated to be about 15 working days
for one person), including the initial survey, the RPAS and        Data availability. Data         are             available          at
the GNSS acquisitions, the photogrammetric processing and          https://doi.org/10.17605/OSF.IO/VKGW8         (Santangelo    et   al.,
the DSM filtering, and the integration of the RPAS DSM and         2019).
the GNSS data points. The application of the presented pro-
cedure based on a RPAS acquisition has an overall cost that
is lower compared to the same procedure involving an ALS           Author contributions. MS contributed to the field survey and the
                                                                   geomorphological mapping, acquired the GNSS RTK data, anal-
survey.
                                                                   ysed the results, and wrote the text. MA ran the model STONE and
                                                                   contributed to writing the paper. MB acquired and processed the
                                                                   RPAS data. MC contributed to the geomorphological mapping and
5   Conclusions                                                    reviewed the text. DG acquired and processed the RPAS data, anal-
                                                                   ysed the results, and contributed to writing the text. FG contributed
The study described in the article was conducted during the        to the field survey and reviewed the text. IM acquired the GNSS
seismic sequence that hit central Italy in the period between      RTK data, analysed the results, and contributed to writing the text.
24 August 2016 and January 2017 to support the National            PR reviewed the text.
Department of Civil Protection in identifying the conditions
to safely reopen the road exposed to rockfalls. The study
consisted in the application of a rockfall numerical model         Competing interests. The authors declare that they have no conflict
(STONE) prepared using a digital terrain model generated           of interest.
by the integration of a DEM obtained by photogrammetry
applied to remotely piloted aerial system (RPAS) acquisi-
tion and a GNSS RTK (Global Navigation Satellite System            Disclaimer. In this work, use of copyright, brand, trade names, and
                                                                   logos is for descriptive and identification purposes only, and does
in real-time kinematic mode) survey in densely vegetated
                                                                   not imply endorsement from the authors, or their institutions.
areas. The numerical model allowed us to perform a semi-
quantitative evaluation of the residual rockfall risk posed to
the road SP18. It was observed that the tract of the road that     Acknowledgements. The work was partly funded by the Italian
had been hit by a rockfall during the seismic emergency was        National Department of Civil Protection.
predicted as unsafe by the model since 29.2 % of the total
simulated trajectories uphill from the tract of SP18 reached

www.nat-hazards-earth-syst-sci.net/19/325/2019/                              Nat. Hazards Earth Syst. Sci., 19, 325–335, 2019
334 M. Santangelo et al.: RPAS for rockfall modelling
Edited by: Norman Kerle Syst. Sci., 18, 405–417, https://doi.org/10.5194/nhess-18-405-
Reviewed by: two anonymous referees 2018, 2018.
Giordan, D., Manconi, A., Facello, A., Baldo, M., dell’Anese,
F., Allasia, P., and Dutto, F.: Brief Communication: The
use of an unmanned aerial vehicle in a rockfall emer-
References gency scenario, Nat. Hazards Earth Syst. Sci., 15, 163–169,
https://doi.org/10.5194/nhess-15-163-2015, 2015a.
Agliardi, F. and Crosta, G. B.: High resolution three-dimensional Giordan, D., Manconi, A., Tannant, D. D., and Allasia, P.:
numerical modelling of rockfalls, Int. J. Rock Mech. Min., UAV: Low-cost remote sensing for high-resolution investiga-
40, 455–471, https://doi.org/10.1016/S1365-1609(03)00021-2, tion of landslides, IEEE Int. Geosci. Remote Se., 5344–5347,
2003. https://doi.org/10.1109/IGARSS.2015.7327042, 2015b.
Baldo, M., Bicocchi, C., Chiocchini, U., Giordan, D., and Lollino, Giordan, D., Hayakawa, Y., Nex, F., Remondino, F., and
G.: LIDAR monitoring of mass wasting processes: The Radico- Tarolli, P.: Review article: the use of remotely piloted air-
fani landslide, Province of Siena, Central Italy, Geomorphology, craft systems (RPASs) for natural hazards monitoring and
105, 193–201, https://doi.org/10.1016/j.geomorph.2008.09.015, management, Nat. Hazards Earth Syst. Sci., 18, 1079–1096,
2009. https://doi.org/10.5194/nhess-18-1079-2018, 2018.
Boccardo, P., Chiabrando, F., Dutto, F., Tonolo, F., and Lingua, A.: Gomez, C. and Purdie, H.: UAV- based Photogrammetry
UAV Deployment Exercise for Mapping Purposes: Evaluation of and Geocomputing for Hazards and Disaster Risk Mon-
Emergency Response Applications, Sensors, 15, 15717–15737, itoring – A Review, Geoenvironmental Disasters, 3, 23,
https://doi.org/10.3390/s150715717, 2015. https://doi.org/10.1186/s40677-016-0060-y, 2016.
Budetta, P.: Assessment of rockfall risk along roads, Nat. Hazards GRASS Development Team: Geographic Resources Analysis Sup-
Earth Syst. Sci., 4, 71–81, https://doi.org/10.5194/nhess-4-71- port System (GRASS GIS) Software, Version 7.2, Open Source
2004, 2004. Geospatial Foundation, available at: http://grass.osgeo.org (last
Cacciuni, A., Centamore, E., Di Stefano, R., and Dramis, F.: access: 25 January 2019), 2017.
Evoluzione morfotettonica della conca di Amatrice, Studi Ge- Guzzetti, F., Crosta, G., Detti, R., and Agliardi, F.: STONE:
ologici Camerti, spec 1995/2, 95–100, 1995. a computer program for the three-dimensional simu-
Chou, T.-Y., Yeh, M.-L., Chen, Y.-C., and Chen, Y.-H.: Disas- lation of rock-falls, Comput. Geosci., 28, 1079–1093,
ter monitoring and managemet by the unmanned aerial vehi- https://doi.org/10.1016/S0098-3004(02)00025-0, 2002.
cle technology, in: ISPRS TC VII Symposium – 100 Years IS- Guzzetti, F., Reichenbach, P., and Wieczorek, G. F.: Rock-
PRS, edited by: Wagner W. and Székely, B., 137–142, Vienna, fall hazard and risk assessment in the Yosemite Valley, Cal-
available at: http://www.isprs.org/proceedings/xxxviii/part7/b/ ifornia, USA, Nat. Hazards Earth Syst. Sci., 3, 491–503,
pdf/137_XXXVIII-part7B.pdf (last access: 25 January 2019), https://doi.org/10.5194/nhess-3-491-2003, 2003.
2010. Guzzetti, F., Reichenbach, P., and Ghigi, S.: Rockfall hazard
Corominas, J., Copons, R., Moya, J., Vilaplana, J. M., Al- and risk assessment along a transportation corridor in the
timir, J., and Amigó, J.: Quantitative assessment of the resid- Nera Valley, central Italy, Environ. Manage., 34, 191–208,
ual risk in a rockfall protected area, Landslides, 2, 343–357, https://doi.org/10.1007/s00267-003-0021-6, 2004.
https://doi.org/10.1007/s10346-005-0022-z, 2005. Guzzetti, F., Mondini, A. C., Cardinali, M., Fiorucci, F., San-
Evans, S. G.: Fatal landslides and landslide risk in Canada, in: Land- tangelo, M., and Chang, K.-T.: Landslide inventory maps:
slide Risk Assessment, edited by: Cruden, D. and Fell, R., 186– New tools for an old problem, Earth-Sci. Rev., 112, 42–66,
196, Balkema, Rotterdam, 1997. https://doi.org/10.1016/j.earscirev.2012.02.001, 2012.
Ezequiel, C. A. F., Cua, M., Libatique, N. C., Tangonan, G. L., Huang, H., Long, J., Lin, H., Zhang, L., Yi, W., and Lei,
Alampay, R., Labuguen, R. T., Favila, C. M., Honrado, J. B.: Unmanned aerial vehicle based remote sensing method
L. E., Canos, V., Devaney, C., Loreto, A. B., Bacusmo, J., for monitoring a steep mountainous slope in the Three
and Palma, B.: UAV aerial imaging applications for post- Gorges Reservoir, China, Earth Sci. Inform., 10, 287–301,
disaster assessment, environmental management and infras- https://doi.org/10.1007/s12145-017-0291-9, 2017.
tructure development, Int. Conf. Unman. Aircr., 274–283, Jaboyedoff, M. and Labiouse, V.: Technical Note: Preliminary es-
https://doi.org/10.1109/ICUAS.2014.6842266, 2014. timation of rockfall runout zones, Nat. Hazards Earth Syst. Sci.,
Farr, T. G., Rosen, P. A., Caro, E., Crippen, R., Duren, R., 11, 819–828, https://doi.org/10.5194/nhess-11-819-2011, 2011.
Hensley, S., Kobrick, M., Paller, M., Rodriguez, E., Roth, Jaboyedoff, M., Oppikofer, T., Abellán, A., Derron, M. H.,
L., Seal, D., Shaffer, S., Shimada, J., Umland, J., Werner, Loye, A., Metzger, R., and Pedrazzini, A.: Use of LIDAR
M., Oskin, M., Burbank, D., and Alsdorf, D.: The Shut- in landslide investigations: A review, Nat. Hazards, 61, 5–28,
tle Radar Topography Mission, Rev. Geophys., 45, RG2004, https://doi.org/10.1007/s11069-010-9634-2, 2012.
https://doi.org/10.1029/2005RG000183, 2007. Liu, C.-C., Chen, P.-L., Matsuo, T., and Chen, C.-Y.: Rapidly re-
Ferlisi, S., Cascini, L., Corominas, J., and Matano, F.: Rockfall risk sponding to landslides and debris flow events using a low-cost
assessment to persons travelling in vehicles along a road: the case unmanned aerial vehicle, J. Appl. Remote Sens., 9, 096016,
study of the Amalfi coastal road (southern Italy), Nat. Hazards, https://doi.org/10.1117/1.JRS.9.096016, 2015.
62, 691–721, https://doi.org/10.1007/s11069-012-0102-z, 2012. Luuk Dorren, A. K.: Rockyfor3D (v5.2) revealed – Transparent de-
Fiorucci, F., Giordan, D., Santangelo, M., Dutto, F., Rossi, M., and scription of the complete 3D rockfall model, ecorisQ papers, 1–
Guzzetti, F.: Criteria for the optimal selection of remote sens-
ing optical images to map event landslides, Nat. Hazards Earth
Nat. Hazards Earth Syst. Sci., 19, 325–335, 2019 www.nat-hazards-earth-syst-sci.net/19/325/2019/M. Santangelo et al.: RPAS for rockfall modelling 335 37, available at: https://www.ecorisq.org/docs/Rockyfor3D_v5_ Santangelo, M., Marchesini, I., Bucci, F., Cardinali, M., Fiorucci, 2_EN.pdf (last access: 25 January 2019), 2015. F., and Guzzetti, F.: An approach to reduce mapping errors Michoud, C., Derron, M.-H., Horton, P., Jaboyedoff, M., Bailli- in the production of landslide inventory maps, Nat. Hazards fard, F.-J., Loye, A., Nicolet, P., Pedrazzini, A., and Queyrel, A.: Earth Syst. Sci., 15, 2111–2126, https://doi.org/10.5194/nhess- Rockfall hazard and risk assessments along roads at a regional 15-2111-2015, 2015b. scale: example in Swiss Alps, Nat. Hazards Earth Syst. Sci., 12, Santangelo, M., Alvioli, M., Baldo, M., Cardinali, M., Gior- 615–629, https://doi.org/10.5194/nhess-12-615-2012, 2012. dan, D., Guzzetti, F., Marchesini, I., and Reichenbach, Nex, F. and Remondino, F.: UAV for 3D mapping ap- P.: Villanova di Accumoli – rockfall modeling input data, plications: a review, Applied Geomatics, 6, 1–15, https://doi.org/10.17605/OSF.IO/VKGW8, 2019. https://doi.org/10.1007/s12518-013-0120-x, 2014. Saroglou, C., Asteriou, P., Zekkos, D., Tsiambaos, G., Clark, Obanawa, H., Hayakawa, Y., and Gomez, C.: 3D Modelling of Inac- M., and Manousakis, J.: UAV-based mapping, back analysis cessible Areas using UAV-based Aerial Photography and Struc- and trajectory modeling of a coseismic rockfall in Lefkada ture from Motion, Transactions, Japanese Geomorphological island, Greece, Nat. Hazards Earth Syst. Sci., 18, 321–333, Union, 35, 283–294, https://www.researchgate.net/publication/ https://doi.org/10.5194/nhess-18-321-2018, 2018. 261724285 (last access: 25 January 2019), 2014. Török, Á., Barsi, Á., Bögöly, G., Lovas, T., Somogyi, Á., and Razak, K. A., Santangelo, M., Van Westen, C. J., Straatsma, Görög, P.: Slope stability and rockfall assessment of volcanic M. W., and de Jong, S. M.: Generating an optimal DTM tuffs using RPAS with 2-D FEM slope modelling, Nat. Hazards from airborne laser scanning data for landslide mapping in Earth Syst. Sci., 18, 583–597, https://doi.org/10.5194/nhess-18- a tropical forest environment, Geomorphology, 190, 112–125, 583-2018, 2018. https://doi.org/10.1016/j.geomorph.2013.02.021, 2013. Turner, D., Lucieer, A., and Watson, C.: An Automated Technique Salvini, R., Mastrorocco, G., Seddaiu, M., Rossi, D., and Van- for Generating Georectified Mosaics from Ultra-High Resolution neschi, C.: The use of an unmanned aerial vehicle for fracture Unmanned Aerial Vehicle (UAV) Imagery, Based on Structure mapping within a marble quarry (Carrara, Italy): photogram- from Motion (SfM) Point Clouds, Remote Sens., 4, 1392–1410, metry and discrete fracture network modelling The use of an https://doi.org/10.3390/rs4051392, 2012. unmanned aerial vehicle for fracture mapping within a mar- Westoby, M. J., Brasington, J., Glasser, N. F., Hambrey, ble quarry (Carrara, Italy): photogrammetry and discrete frac- M. J., and Reynolds, J. M.: “Structure-from-Motion” ture network modelling, Geomat. Nat. Haz. Risk, 8, 34–52, photogrammetry: A low-cost, effective tool for geo- https://doi.org/10.1080/19475705.2016.1199053, 2016. science applications, Geomorphology, 179, 300–314, Salvini, R., Mastrorocco, G., Esposito, G., Di Bartolo, S., Cog- https://doi.org/10.1016/J.GEOMORPH.2012.08.021, 2012. gan, J., and Vanneschi, C.: Use of a remotely piloted air- Whalley, W. B.: Rockfalls, in: Slope Stability, edited by: Cruden, D. craft system for hazard assessment in a rocky mining area and Fell, R., 217–256, Wiley, New York, 1984. (Lucca, Italy), Nat. Hazards Earth Syst. Sci., 18, 287–302, Xu, Z., Yang, J., Peng, C., Wu, Y., Jiang, X., Li, R., Zheng, Y., https://doi.org/10.5194/nhess-18-287-2018, 2018. Gao, Y., Liu, S., and Tian, B.: Development of an UAS for Santangelo, M., Gioia, D., Cardinali, M., Guzzetti, F., and post-earthquake disaster surveying and its application in Ms7.0 Schiattarella, M.: Landslide inventory map of the upper Lushan Earthquake, Sichuan, China, Comput. Geosci., 68, 22– Sinni River valley, Southern Italy, J. Maps, 11, 444–453, 30, https://doi.org/10.1016/j.cageo.2014.04.001, 2014. https://doi.org/10.1080/17445647.2014.949313, 2015a. www.nat-hazards-earth-syst-sci.net/19/325/2019/ Nat. Hazards Earth Syst. Sci., 19, 325–335, 2019
You can also read