People Analytics Tech 2020 - Authors: Stacia Garr & Priyanka Mehrotra - PAFOW
←
→
Page content transcription
If your browser does not render page correctly, please read the page content below

People Analytics Tech 2020
Authors: Stacia Garr & Priyanka Mehrotra

  RedThread Research. ©2020.               People Analytics Tech 2020   |   1

About                                                             This report is made
RedThread                                                         available to you by

Sure, we’re experts in performance, people analytics, learning,   The People Analytics & Future of Work Community &                Insight222 is an education, advisory, and consulting firm devoted
and D&I—and we’re well-versed in the technologies that            Conference Series is the world’s premier network of              to helping organizations put People Analytics & Insights at the
support them. But we’re also truth-seekers and storytellers in    professionals promoting the ethical and responsible use          center of their business strategies. Home of the People Analytics
an industry often short on substance, and too full of @#$%.       of people data and analytics. From GDPR to innovative            Program, Insight222 facilitates peer group meetings, co-creation
Our mission (indeed, our very reason for existing) is to cut      organizational, team, and individual insights, we’re dedicated   projects, content development and curation, training, and the
through the noise and amplify what’s good. We look for            to seeing people data used transparently, creatively, and        Global Executive Retreat (GER). The GER is a unique experience
the connections (or red threads) between people, data, and        with an unwavering commitment to protecting the rights           that helps People Analytics Leaders formulate and pressure test
ideas—even among seemingly unrelated concepts. The result         and well-being of individuals. We share insights, ideas, and     their strategies, budget, technology ecosystem, and innovative
is high-quality, unbiased, transformative foresight that helps    proven methods through a series of conferences, roadshows,       ideas in a confidential, high-trust environment. This experience,
you build a stronger business.                                    videos, podcasts, and other media. Ultimately, we’re about       along with ongoing advisory and facilitation, helps People
                                                                  People Data for Good. As such, it’s our mission to educate       Analytics Leaders and their teams create sustainable and scalable
To learn more, reach out to us at hello@redthreadresearch.
                                                                  business professionals, and people in general, on the risks,     solutions that are high-impact, ethically responsible, and that
com or visit www.redthreadresearch.com.
                                                                  opportunities, and responsibilities inherent in analyzing and    benefit both organizations and workers. Insight222 is also home
                                                                  acting upon people data. Learn more at pafow.net.                to myHRfuture, the online learning experience platform that
                                                                                                                                   provides timely, relevant, and actionable educational experiences
                                                                                                                                   at scale. From micro-learning to customized educational
                                                                                                                                   experiences for organizations, myHRfuture helps individuals
                                                                                                                                   and organizations build the skills of the future. Learn more at
                                                                                                                                   insight222.com and myHRfuture.com.

      RedThread Research. ©2020.                                                                                                                                             People Analytics Tech 2020   |   2
Table
of Contents

2020: People analytics' year to shine................................................................................................4
Key Findings ...........................................................................................................................................6
Market Changes .................................................................................................................................... 7
Vendor Capabilities.............................................................................................................................15
Considerations Before Making (or Expanding) Your Investment ............................................24
Looking to 2021 .................................................................................................................................. 30
Appendix ...............................................................................................................................................34

      RedThread Research. ©2020.                                                                                                                             People Analytics Tech 2020   |   3
2020: People analytics’
year to shine
When we published our 2019 People Analytics Tech1 study at       That’s where this research comes in. Our goal is to help
the very end of last year, we thought we had a strong sense      people analytics leaders—whether you are in the more
of what was coming in the next year. Like everyone else, we      prepared group or the heroic acts camp—prepare for next
were wrong.                                                      year. Specifically, we focus on 3 questions:

COVID-19 and the social justice movements of 2020                •   How did the vendor market change in 2020?
dramatically changed all of our lives. As a result, business
                                                                 •   What are the newest capabilities you need to know about?
leaders wanted to understand what was happening with their
people on a much deeper level. People analytics teams and        •   What should you be thinking about when making (or
their technology had an unexpected opportunity to shine.             expanding) a people analytics tech investment?

Some teams and technologies seized that opportunity. Those       If, after reading this study, you have further questions, please
who fared the best had already invested in regular employee      reach out to us at hello@redthreadresearch.com.
listening strategies, democratized data analytics products
for the broader organization, and created a flexible and
integrated tech stack.

Other teams had to perform heroic acts to get leaders
the information they needed. As the crisis of the moment
turned into the reality of the year, they began to explore new
approaches to deliver people insights at scale.

All of this brings us to now, when many people analytics
leaders are looking to 2021, beginning to contemplate new
investments, but have less time than ever to think about it.

      RedThread Research. ©2020.                                                                                                    People Analytics Tech 2020   |   4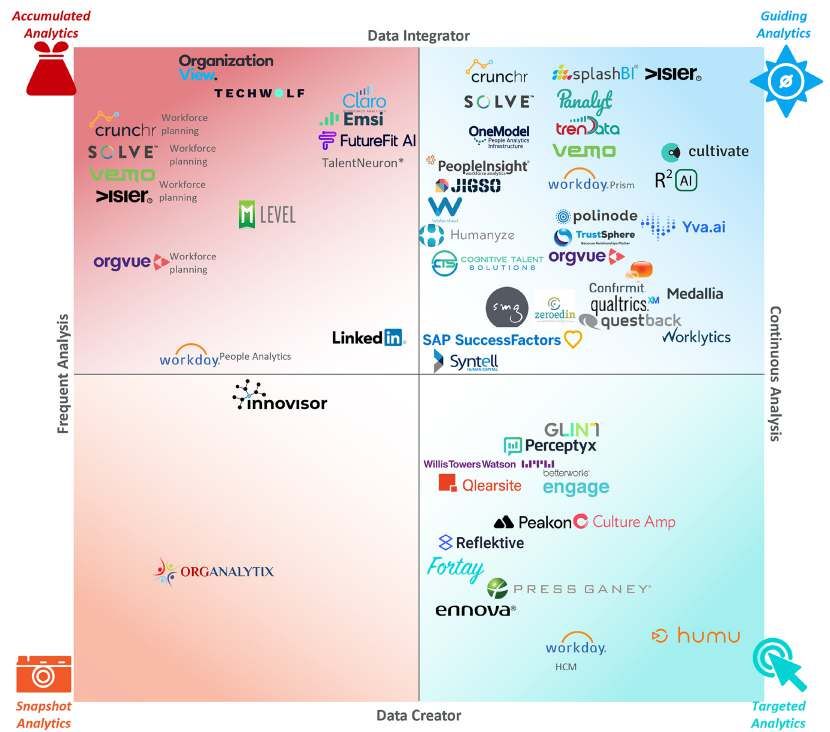
Study
overview
This study has the same overall goal as our 2019 study:           Similar to last year, we began this study with a survey of                           Figure 1: Methodology for People Analytics Tech Study 2020
To make the people analytics technology market more               both vendors and people analytics practitioners, to better
                                                                                                                                                                  Vendor survey &               PAFOW: Preview of
understandable for people analytics practitioners (PAPs) as       understand what you all most wanted us to focus on. As you                                       customer poll,                   findings,
well as vendors.                                                  can see in Figure 2, the primary areas of focus folks wanted                                          June                           Oct
                                                                  to know about are current and future capabilities. The biggest
Our overall methodology is very similar to last year, as shown
                                                                  difference between the two populations? Approaches to ethics
in Figure 1. We administered a robust vendor survey (May–
                                                                  and privacy. We cover these topics in the study.
August) and conducted 60-90-minute vendor briefings (July–
November). We made a few additions this year, too:                This study is a labor of love, in that it reflects a significant
                                                                  time investment from everyone who participated in its
1. We added a customer poll, so we could better understand
                                                                  development. Before we dive in, we want to thank all of the
   people analytics leaders’ perspectives on their vendors’
                                                                  vendors and customers who gave their time, energy, and                                  Online poll,         >40 Vendor briefings,            Publication of a
   offerings—this included a customer Net Promoter                                                                                                           May                     July-Sept                  detailed tool &
                                                                  expertise to make this such a robust study.
   Score® (NPS)                                                                                                                                                                                                   report, Dec
                                                                                                                                                                            Source: RedThread Research, 2020.
2. We asked each vendor for an opportunity to see their
   sandbox environment, so we could get a better sense                   Figure 2: Top 3 Things People Analytics Practitioners & Vendors Want to Know about the People Analytics Tech Market
   of their product
                                                                                               69%
                                                                                                        64%
We also created a robust evergreen tool, which serves as                                                                                61%
                                                                                                                                                                                                  57%
the repository of vendor-specific information. This new tool                                                                   48%
                                                                                                                                                            45%
includes an updated RedThread assessment on every vendor                                                                                                                                  40%
that participated in the research, customer NPS and other
customer insights (when we received enough responses),
screenshots, and case studies. That allows this report to focus                                                                                                     14%
just on the overall market.
                                                                                            Current capabilities            Future capabilities    Approach to ethics and privacy   Use cases / case studies

                                                                                                                   People analytics practitioner   People analytics technology provider

                                                                                                                                  Source: RedThread Research, 2020.

      RedThread Research. ©2020.                                                                                                                                                                        People Analytics Tech 2020   |   5
Key
findings
1. The people analytics tech market responded to                   4. Many solutions are not as easy to use or user-friendly
   customers’ 2020 needs. The events of 2020 required                 as vendors believe them to be. For customers, ease of
   companies to foster connectedness and keep their                   use and simplicity is a big differentiator. Given the high
   employees engaged, secure, and safe. The majority of               number of vendors who claim this is a differentiator—and
   solutions in our study reported employee engagement,               the number of customers who claim they're still seeking
   experience, and diversity, equity, inclusion, and belonging        it—we don’t think that most vendors actually differentiate
   (DEIB) as their primary areas of focus this year.                  on this capability.

2. Practitioners have more choices of technology than              5. New capabilities include advanced NLP, deep machine
   ever. We identified 121 people analytics technologies (PAT)        learning, and the use of new, unstructured data.
   on the market today. The market overall is growing quickly,        Some of the most interesting new capabilities include
   with a 35% growth rate between 2019 and 2020, and a 55%            context-configurable natural language processing (NLP),
   CAGR for the last 4 years. We estimate the overall market          use of deep machine learning to analyze unstructured
   value at $2 billion.                                               data (e.g., voice, images, video), and the collection of that
                                                                      unstructured data.
3. People analytics practitioners and HR teams are the
   key users today. This year, 96% of vendors said people
   analytics practitioners (PAPs) are their primary audience,
   as compared with 77% last year. HR business partners
   (HRBPs) are the next critical audience, cited as primary
   by 70% of vendors. Most solutions offer targeted insights
   and resources to help these 2 audiences use their solution
   effectively. However, the majority of vendors anticipate that
   HRBPs and people managers will be using their solutions
   more frequently in the next 3 years.

     RedThread Research. ©2020.                                                                                                       People Analytics Tech 2020   |   6
Market Changes RedThread Research. ©2020. People Analytics Tech 2020 | 7
Vendors responded to
COVID-19 & racial injustice
As we mentioned at the beginning, the twin pandemics of 2020                                                Figure 3: Primary Areas of Focus for Vendor Solutions
(COVID-19 and racial injustice) thrust people analytics onto
center stage, as business leaders attempted to understand—at
scale and with data—what was happening with their people.                                                          Employee engagement                                67%

Vendors responded quickly to this need. As shown in Figure 3,
the majority of vendors reported employee engagement and                                                             Employee experience                            58%
employee experience (response to COVID-19 and remote work),
and diversity and inclusion (D&I, response to racial injustice) as                D&I analysis & monitoring (including pay equity analysis)                     52%
their primary areas of focus in 2020.

While the focus on employee engagement and experience is to                                                    Performance management                          48%
be expected, we find the increased focus on D&I notable. When
we began our research on D&I technology in 2018, we had a                                                        Learning & development                       42%                  n=47
relatively small number of vendors focusing on D&I analytics.2
However, as the urgency around diversity, equity, inclusion, and
belonging (DEIB) has risen, so too have the number of analytics
                                                                                                                          Source: RedThread Research, 2020.
offerings targeting this space. This is to be celebrated.

But there’s a catch. Given the sensitivity of the topic, it’s extremely   “DEIB technology is enterprise software that provides insights or
difficult to get people analytics practitioners (and thus their
vendors) to talk about what they’re doing on DEIB. This means
                                                                           alters processes or practices, at the individual or organizational
there’s a slowing of the normalization of DEIB analytics and sharing
of insights on how to improve DEIB. This needs to change.
                                                                           level, in support of organizations’ efforts to become more diverse,
We strongly encourage practitioners and vendors to keep
focusing on how they can better provide insights to help                   equitable, inclusive, and fostering of belonging.”
organizations become more diverse, equitable, inclusive, and
fostering of belonging to improve their DEIB.                             Source: Diversity & Inclusion Technology: The Rise of a Transformative Market, RedThread Research 2019.

      RedThread Research. ©2020.                                                                                                                                            People Analytics Tech 2020   |   8
Vendors focused more on
people analytics practitioners
As we discuss later in this report, people analytics technologies
(PATs) can be used by many different audiences. However, Figure 4: Current & Future End-Users, 2019 vs 2020
during COVID-19, vendors focused much more specifically on
people analytics practitioners (PAPs).
Current end-users* Future end-users**
As you can see in Figure 4, in 2019, 77% of vendors reported People analytics practitioners (PAPs) 96% 64%
PAPs were using their solution to a very great extent—that 77% 78%
number shot up to 96% in 2020. We believe the pressure for
HR business partners (HRBPs) 70% 72%
greater data clarity also crystalized for vendors that PAPs
76% 89%
are their primary users—and thus almost all focused there
more heavily. Broader HR team 68% 73%
84% 86%
We also asked vendors the types of capabilities they offer
specifically for people analytics practitioners. Seventy-four percent Business & C-suite leaders 55% 80%
of vendors offer customized insights for PAPs, which can consist 58% 72%
of customized reports, analyses, etc. as either a core out-of-the-
box functionality or a competitive differentiator functionality. People managers 51% 79%
58% 81%
However, vendors aren’t as strong at enabling action, with only
48% saying they suggest personalized actions for PAPs. Further, Employees 30% 69%
28% 54% 2019 n = 37
just 41% of vendors offer PAP-specific collective / community
2020 2019 2020 n = 47
intelligence (e.g., access to forums, groups, or events). Both of
these areas present opportunity for vendors in the future. * Currently using the solution to a very great extent **Expect to use more frequently in 3 years
Source: RedThread Research, 2020.
RedThread Research. ©2020. People Analytics Tech 2020 | 9Customers satisfied
with PAT vendors
Vendors’ efforts seem to have paid off, as shown by the overall
strong customer NPS score (see Figure 5). Of our 45 solutions in
the study, 24 had enough customer responses to calculate
an NPS.
The average customer NPS score is 67, which is considered high, Figure 5: Average Customer NPS Score
3
generally speaking, for the SaaS industry. Nearly one-third of
solutions had scores higher than 70, which is exceptional.
Average NPS score
Some of the quotes from the most satisfied customers are
included below. 67
9 vendors scored >70
15 vendors scored > 30
“An innovative vendor, constantly improving -100 100
the product and providing excellent customer
support and flexibility.”
Needs improvement (-100 - 0) Good (0 - 30) Great (30 - 70) Excellent (70 - 100)
– Large healthcare company for an employee
experience / engagement analysis solution
Source: RedThread Research, 2020.
“Great team with a great product, [I] think
this solution is a valuable addition for any
business.”
– Midsize financial company for a multisource
analysis solution
RedThread Research. ©2020. People Analytics Tech 2020 | 10“The vendor has an excellent support team that is willing to go [the] extra mile to accommodate customers. It is a simple tool that does not require an IT or statistician background to use.” – Large healthcare company for a multisource analysis solution
The market grew quickly—but there are
fewer new vendors than before
The overall number of vendors in the market increased, but
                                                                               Figure 6: People Analytics Tech Market Growth for Last 5 Years
the growth rate has slowed. In 2018, we identified 89 vendors
                                                                                                                                           $2B
in the space. However, our review this year turned up even
more vendors that existed in 2018, so we have revised our 2018
number to 116. For this year, we have identified 121 vendors.                                                                   $1.5B
All of this shows that the number of players in the market is still                                             $1.3B

                                                                      Market size
growing, but not at the same rate as before.

Even though we're seeing fewer new vendors in the market,                                       $696M
                                                                                     $551M
we still saw very strong growth in the market overall. As you
can see in Figure 6, we're estimating strong market growth for
2020, with the overall PAT market size for the year 2020 to be
around $2 billion.                                                                   2016       2017            2018             2019      2020
                                                                                                                                        (estimate)
Overall, we estimate the following growth rates:
                                                                                                 Source: RedThread Research, 2020.

•   35% anticipated 2020 growth rate (2019-2020)

•   55% CAGR for last 4 years

For close readers of our research, you'll note that the 2019
number, $1.5 billion, is lower than what we projected last year.
                                                                                    Overall market size:    $2 billion
That's because last year’s numbers were estimates, whereas this
year we received actual 2019 numbers from vendors. The 2020
                                                                                    CAGR for last 4 years:  55%
numbers are based on vendors’ estimated revenue, taking into
account the COVID-19 pandemic.
                                                                                    2019-2020 growth rate:   35%

      RedThread Research. ©2020.                                                                                                                     People Analytics Tech 2020   |   12
Solution categories
fragmenting as offerings overlap
To understand the market, we compare 2 aspects of solutions’
Figure 7: People Analytics Tech Market Solution Matrix
capabilities: usage frequency and data sources. This approach
allows us to clarify if, on the X-axis, the analysis is primarily
used for strategic organizational decisions (frequent analysis)
or informing individuals about themselves / their teams
(continuous analysis). It also helps us see, on the Y-axis, the
number of data sources integrated, which can give us a sense of
the integration complexity (see Appendix 3 for more details).
Comparing last year's and this year's studies, we notice:
• Compressing toward the X-axis. More solutions than
before are both creating and integrating data—meaning we
have more solutions in the center of the matrix
• Moving to the right on the X-axis. More solutions are
making data continuously available and accessible to more
user types—meaning more solutions moved to the right side
of our matrix this year
• Fragmenting of solutions categories. Last year, we were
able to clearly group solutions categories (e.g., employee
engagement / experience or workforce planning platforms)
by their location on the matrix; this year, given some of
the shifts mentioned above, we find them somewhat more
fragmented—meaning there’s more differentiation between
the solutions within a given category
For more detailed information on individual vendors, Source: RedThread Research, 2020.
see our tool at www.redthreadresearch.com/pat-tool.
RedThread Research. ©2020. People Analytics Tech 2020 | 13What’s next:
Market changes
To help you get started on translating the information above
into actionable steps for your organization, we provide 2 sets of People Analytics Practitioners Vendors
questions—one for practitioners and one for
If you’re a PAP, here are some questions to ask your If you’re a vendor, in addition to being able to answer
vendors—for you to consider as you look to 2021. current or potential vendor: the practitioner questions, here are a few questions
to consider as you look at your product roadmap and
Audiences consider how you support customers:
• In what ways do you focus on other critical (non-PAP) Audiences
audiences? How does the solution enable this?
• How can you better provide insights that answer the
• How do you handle issues of scale, security, and questions of all audiences, not just provide data / the
customization for these different audiences? ability to drill into the data?
• How do you go beyond providing insights to enabling • How might you innovate on the current offerings for
or encouraging action for all audiences? the different audiences (especially consider taking a
page from B2C data products)?
• What types of communities can you connect me or
other audiences with to help us further our learning? • Is your solution the right one for the potential buyer,
given their people analytics maturity and user skill
Offerings
level?
• How did you evolve your product to respond to
Offerings
COVID-19 and the social justice pandemics this year?
• What new customer needs do you foresee as they
• How are you enabling my company to understand
relate to either COVID-19 or social justice? How can
diversity, as well as equity, inclusion, and belonging?
your product anticipate those needs and support
Growth & Customer Satisfaction customers more effectively?
• What is your organization’s NPS score? Growth & Customer Satisfaction
• How quickly did your organization grow last year? • In what ways can you enable thought partnership for
How much of that was new vs. old customers? your customer, not just basic support?
• What is your growth plan for the next few years? • How can you better adapt and configure to meet
different customer needs at scale?
RedThread Research. ©2020. People Analytics Tech 2020 | 14Vendor Capabilities RedThread Research. ©2020. People Analytics Tech 2020 | 15
Capability differentiators:
Customers’ perspectives
This year, we asked customers what they saw as their solution's      •   Visuals, storytelling, UI, and design. After sitting through           Figure 8: Top 5 Customer-Stated Differentiators
differentiators. Here are the top capabilities they mentioned:           more than 40 vendor briefings, we can tell you that there’s
                                                                         a LOT of similarity in dashboards. A few vendors are
•   Ease of use, user-friendly, simplicity, and flexibility.                                                                                    Ease of use, user friendly, simplicity & flexibility
                                                                         reimagining data display and storytelling, but most aren’t.
    Interestingly, while we highlighted these as “commodity”
                                                                         Compelling visuals, clear storytelling, easy UI, and strong
    differentiators or table stakes for vendors in last year’s                                                                                        Reporting and filtering capabilities
                                                                         design are definitely differentiating capabilities.
    research, ease of use, simplicity, and flexibility are the
    most frequently mentioned vendor differentiators among           •   Deep customer support. Lots of vendors offer SaaS, but                         Visuals, storytelling, UI & design
    customers. This implies that, despite their statements               not all people analytics or HR teams have the capability
                                                                                                                                               Deep customer support & professional services
    otherwise, most vendors’ solutions are not as easy to                to manage the technology deployment and ongoing
    use, simple, and flexible as customers want. While it                management without support. Clarity and deep support on
                                                                                                                                                                  Customizable
    might be easy to write this off as lack of end-user knowhow,         the level of service offered—and the amount needed—can
    we doubt this is the case as a large percentage (29%) of             be differentiating.
                                                                                                                                                          Source: RedThread Research, 2020.
    customer respondents are PAPs. This means that even the
    most sophisticated users are, broadly speaking, finding the
    solutions too complex or time-consuming.                                                                                            Some customer quotes on differentiators include:

•   Reporting. Another finding from the customer poll is that a                                                                         "Comprehensive surveying and reporting tool
                                                                                                                                         with good support."
    large number of customers listed their solution’s reporting
    and filtering capabilities as differentiators. A deeper dive
    into the responses revealed that a majority of these are                                                                            – Large retailer for an employee experience /
    for employee experience and engagement solutions for                                                                                 engagement solution
    which the ability to quickly filter and find the needed data
    and insights are essential for the broad range of users. We                                                                         "High flexibility can be used for multiple
    believe this desire for better reporting is proxy for improved
                                                                                                                                         purposes."
    ease of use, user experience, etc.
                                                                                                                                        – Large pharmaceutical company for an employee
                                                                                                                                         experience / engagement solution

      RedThread Research. ©2020.                                                                                                                                                  People Analytics Tech 2020   |   16
"Provides us the ability to review data and read
trends and tell a story with data."
– Large pharmaceutical company for a multisource analysis solution
RedThread Research. ©2020. People Analytics Tech 2020 | 17Capability differentiators:
Vendors’ perspectives
Our vendor survey revealed that most vendors think of the Figure 9: Top 5 Vendor-Stated Differentiators for Their Solutions
following capabilities as their strengths / differentiators:
Easy, simple, flexible, and comprehensive 17%
• Being flexible, comprehensive, easy, and simple to use.
As stated above, customers think this can be a differentiator. Machine learning, prescriptive and predictive
17%
modelling and insights
However, given the number of vendors who claim this is a
differentiator, we still don’t think that most vendors actually Expertise in methodology, industry, or domain 15%
differentiate on this capability.
Allows broader adoption through scalability,
14%
automation, and exploration
• Providing advanced analytics (e.g., machine learning,
prescriptive / predictive insights) and real-time updates. Integration with data from finance, ops, and
12%
business and passive data n = 47
On the first point, we suggest buyers ask questions to better
understand these technologies, as there are wide ranges
Source: RedThread Research, 2020.
in capabilities. On the last point, given that almost 40% of
solutions can update within the hour (see Figure 10), providing
real-time insights can be a true differentiator for them. Figure 10: Frequency of Solution Updates
• Offering specific expertise. Our briefings reveal that 7%
vendors particularly leveraged their expertise during the Instantly
16%
COVID-19 pandemic to help companies in specific industries 33%
Hourly
or in a specific market segment.
Daily
Weekly
18% Monthly
4%
Quarterly
22% n = 47
Source: RedThread Research, 2020.
RedThread Research. ©2020. People Analytics Tech 2020 | 18Capability differentiators:
Opportunities for vendors
From a features / functionality perspective, our survey
uncovered several functionalities that comparatively few Figure 11: Capabilities Currently Offered by Vendor Solutions
solutions currently offer as differentiators (see Figure 11 for
percentage that indicates they offer the capability):
Use of ML for deep learning 40%
• Machine learning (ML) for deep learning. While 40% of
vendors state that their solutions use machine learning
for deep learning, we think this will become a greater Use of digital exhaust 33%
requirement as more unstructured and unlabeled data from
different channels and sources (such as voice, image, video,
etc.) is used for analysis. Advanced NLP capabilities 26%
• Use of digital exhaust. Though more vendors are integrating
data from difference sources, they're not using digital exhaust Use of voice channels as a data source 7% n = 47
from employee activities (e.g., data created by email exchanges,
file transfers, log files, or cookies) any more now than last year.
Specifically, only 33% of the solutions currently use data from Source: RedThread Research, 2020.
digital exhaust for analysis, as compared with 32% last year.
Only 7% of solutions currently use voice channels (e.g., call
• Advanced natural language processing (NLP). Currently
almost 40% of solutions conduct sentiment analysis, but
and message recordings), but as more office interactions
that analysis is relatively rigid. By contrast, only 26% of
solutions offer advanced NLP, which allows for customizing
by context (e.g., by allowing customizing / refining of NLP
models based on business priorities or culture). It can also and meetings take place via digital tools, voice channels will
enable the identification of prescriptive comments (e.g., “the
management should.…,” “I would suggest making….”), not increasingly become an important data source.
just themes.
RedThread Research. ©2020. People Analytics Tech 2020 | 19Audiences
We also saw differences in terms of the different capabilities that
vendor solutions offer for different audiences. The audiences we Figure 12: Different Audiences for People Analytics Vendors
identified in our study are identified in Figure 12.
We see similar types of capabilities across each of these audience
PAPs
types, indicating there’s a real need for imagination when it
comes to capabilities. For example, based on both our survey and
our briefings, we saw that no real differentiating capabilities exist
for C-suite / senior leaders and people managers.
Employees HR / HRBPs
There are some feature differences, though, for 2 other
audiences:
• People analytics practitioners. Structural equation
modeling, network analysis, suggesting personalized actions
• HRBPs. Suggesting personalized actions
By personalized actions, we mean specific steps and
recommendations based on insights and analyses that are
critical for those roles. These can include suggestions such as
areas that users need to focus on to meet their workforce, DEIB,
or engagement goals. People C-Suite / Senior
Managers Leaders
There’s one area in which we saw an opportunity for all audience
types: Offering communities / collective intelligence remains
something that’s not done broadly, but can offer a meaningful
impact for users. Source: RedThread Research, 2020.
RedThread Research. ©2020. People Analytics Tech 2020 | 20Employee audience offers
an opportunity for differentiation
While we saw similar features / functionality for most user types,
there’s one for which lots of opportunity for differentiation exist: Figure 13: Differentiating Features PAT Vendors Can Offer for Employees
employees. Some of the differentiating features we saw include
the following:
• Enable individuals to participate in action-planning process 30% allow individuals to participate in action-planning process
(30% of solutions offer)
• Let employees share insights with others (28% of
solutions offer) 28% allow employees to share insights with others
• Allow employees to see all the information collected on them
(28% of solutions offer)
28% allow employees to see all the information collected on them
• Enable individuals to compare their data with organizational-
level data (27% of solutions offer)
• Recommend actions (26% of solutions offer)
27% allow individuals to compare their data against org level data
• Let employees correct data (23% of solutions offer)
• Allow employees to see insights based on passive data (15%
of solutions offer) 26% recommend actions
• Alert employees to types of analyses being run on them (8%
of solutions offer)
Source: RedThread Research, 2020.
RedThread Research. ©2020. People Analytics Tech 2020 | 21Tech
integrations
When asked about integrations, vendors, on average, selected
around 8 different types of technologies that their solutions Figure 14: Types of Technology PAT Solutions Integrate With
currently integrate with. The most common tech that almost
all solutions integrate with is the HRIS or similar core HR
HRIS / core HR 89%
technologies (see Figure 14). A large number of solutions (60%)
Cloud-based tech 60%
integrate with cloud-based technologies, such as Google cloud,
and employee surveys. Employee / candidate survey 60%
Sales / CRM 57%
It’s particularly interesting to see that more than one-half
of the vendors reported integrations with nontraditional HR Learning tech 55%
tech, such as sales / CRM, and work technologies like email, Work tech 55%
calendars, project management tools, Slack, and other tools. Talent management 51%
Given the recent shifts in work behaviors and patterns due to
Other people analytics tech 49%
the pandemic, we expect to see these integrations grow and
improve in the near future. Talent acquisition 47%
Other operational tech 47%
Similarly, it’s interesting to note almost 50% of vendors stated
that their solutions currently integrate with other people Compensation 43%
analytics technologies, suggesting that customers can develop Financial tech 38%
a people analytics ecosystem to meet their unique needs. External labor market 34%
Our recent conversations with vendors and collaboration
Recognition 32%
announcements made also suggest that they’re taking a
Social media 26% n = 47
thoughtful approach to bringing their capabilities together in
4
order to bring deeper, more valuable insights to customers.
Source: RedThread Research, 2020.
RedThread Research. ©2020. People Analytics Tech 2020 | 22What’s next:
Capabilities
To help you get started on translating the information above
into actionable steps for your organization, we provide 2 sets of People Analytics Practitioners Vendors
questions—one for practitioners and one for vendors—for you If you’re a vendor, here are a few questions to consider as
If you’re a PAP, here are some questions to ask yourself
to consider as you look to 2021. about your current or future people analytics technology: you look at your product roadmap and consider how you
support customers:
Differentiators
Differentiators
• What are the top functionalities or capabilities that
are essential for your organization’s needs? • To what extent do you really understand the
strengths or differentiators that set you apart from
Offerings your competitors? When you win a deal, why do you
win it? When you do not, why?
• Who is going to be the primary user of the
technology? How much vendor support is the user • What novel, untried approaches can you take to
going to need to use the solution? simplify your user experience? What other types of
software can you borrow approaches / insights from
• Who will be the secondary users of the solution? How and incorporate into yours?
much support will they need, from you or the vendor, to
use it effectively? Can those needs be met effectively? Offerings
• How does the technology differently serve each of the
• Which other roles or functions do you foresee using
different potential audiences and their specific needs?
this solution more frequently in the next few years?
Do these align with what the vendor can offer now or • What is the level of expertise or skill required to use this
in the future? solution effectively? How can you better support your
customers at their various points of need?
Integrations
Integrations
• Which existing technologies in your organization do
you need the solution to integrate with? • Given your areas of focus and customer needs, which
technologies should the solution integrate with?
• Which potential technologies do you think you may What level of integration is needed?
want the solution to integrate with in the future?
• What other types of data (e.g., digital exhaust,
• What do you want your people analytics technology unstructured data) could it make sense to integrate
ecosystem to look like? into your solution?
RedThread Research. ©2020. People Analytics Tech 2020 | 23Considerations Before Making
(or Expanding) Your Investment
RedThread Research. ©2020. People Analytics Tech 2020 | 24Challenges vendors
are helping solve
Before purchasing or expanding your people analytics tech
investment, it’s important to clarify the challenges that
you’re trying to solve—and your vendor's level of expertise in
addressing them.
The following are the most frequently mentioned challenges Figure 15: Top 5 Challenges Vendor Solutions Help Address
vendor solutions address:
• Issues around employee engagement / experience.
Helping customers solve for measuring and managing
employee experience and engagement by employee
listening, collecting feedback, linking employee experience
to business outcomes, measuring collaboration, and
understanding work-from-home engagement
• Action enablement. Providing targeted and actionable
insights across different data sources, providing self-service
for various users, and helping prioritize efforts Employee Enabling Insights Retention / Designing HR
engagement / action around critical attrition / strategy
• Providing insights around critical talent. Helping identify
HiPos, influencers, and hidden talent; identifying existing
experience talent, gaps, turnovers
talent gaps and employee skills, and labor market insights and skills
• Retention / attrition / turnover. Providing insights on
employee retention, attrition, and turnover
Source: RedThread Research, 2020.
• HR strategy design. Helping customers design an HR strategy
based on data, linking talent and HR decisions to business
outcomes, and identifying objective KPIs to track and measure
RedThread Research. ©2020. People Analytics Tech 2020 | 25Vendor
support & services
Building on the last point, it's important to understand the Figure 16: Frequency of Customer Check-ins by Vendors*
level of support you’ll receive or require from the vendor. For
example, some vendors really focus on customer service, while 2% 2%
4% Monthly
others focus more on the tech. The amount of support you need
Quarterly
will also depend on where you are on your people analytics 15%
Twice a year
journey and maturity, and the data literacy and skills levels of
Dependent on the contract level
the users. Additionally, it’s helpful to know whether the vendor
offers additional professional services like consulting. On an ad-hoc basis / as and when required by the customer
Weekly
For example, in our study, we found that approximately 60% of 17%
vendors conduct solution check-ins with their customers on a 59%
n = 47
monthly basis—but nearly 20% only check-in quarterly (see Figure * Percentages may not total 100% due to rounding.
16). Additionally, only 4% of vendors stated deep customer support
and professional services as a differentiator for their solution. Source: RedThread Research, 2020.
Additional costs may also be a determining factor in technology
selection. We asked vendors if the ongoing annual subscription Figure 17: Percentage of Vendor Solutions with Consulting Services as Part of Annual Subscription Cost
costs for their solution include consulting services—and less
than one-half (44%) of vendors stated that it does.
Determine what level of support your organization needs, and
ensure you state that clearly and are certain your needs can be
met before purchasing any technology. 44%
Yes
“Have seen some variation in the level of 56% No
support I have received"
n = 47
– Large healthcare company for an employee
engagement / experience solution
Source: RedThread Research, 2020.
RedThread Research. ©2020. People Analytics Tech 2020 | 26“A great platform, would be even better [if there
was] better communication before updates
are made (and why), asking for feedback
more regularly about upcoming updates, and
understanding of how clients use their platform.”
– Large entertainment / media company for an employee engagement / experience solution
RedThread Research. ©2020. People Analytics Tech 2020 | 27Ethics
As we mentioned at the beginning, ethics is one of the areas Figure 18: Roles Vendors Play in Data Ethics
PAPs really wanted to understand, but that vendors were less
71% 68% 66% 59%
interested in. Roughly two-thirds of vendors say they engage in
meaningful ways on ethics (see Figure 18). 43% 38% 36%
36%
This means it remains important for people
analytics practitioners to ask questions about 30% 30%
28%
their vendor’s approach to ethics. 23%
This is especially the case when it comes to multisource analytics
platforms (see Figure 19). These vendors have the lowest scores Design guidelines and policies Design guidelines and policies Design guidelines and policies Educate the broader organization and share
around data collection around sharing insights around data access knowledge around data ethics and privacy
on the data ethics questions we asked. This may be due to
To a very great extent To a significant extent
these solutions having traditionally focused on combining data
sources and not interacting directly with employees. Source: RedThread Research, 2020.
For all vendors, we suggest developing a standard set of ethical Figure 19: Roles Vendors Play in Data Ethics—Multisource Analytics Platforms
guidelines to follow, and use those as the baseline in their
57% 64% 50% 43%
implementations. Individual customers may desire something
different, and vendors may need to flex to meet customer 50%
needs. That said, by anchoring the conversation in an ethical 50%
43%
mindset, vendors should be able to positively influence their 29%
customers. After all, vendors are the ones who are doing these
implementations for tens if not hundreds of customers, whereas
customers are only doing it once (or a few times, if they have 14% 14%
moved between several companies). 7% 7%
Design guidelines and policies Design guidelines and policies Design guidelines and policies Educate the broader organization and share
around data collection around sharing insights around data access knowledge around data ethics and privacy
To a very great extent To a significant extent
Source: RedThread Research, 2020.
RedThread Research. ©2020. People Analytics Tech 2020 | 28What’s next:
Considerations before making or expanding your investment
To help you get started on translating the information above
into actionable steps for your organization, we provide 2 sets of Support & Services Vendors
questions—one for practitioners and one for vendors—for you
• How frequently will the vendor check-in with you? If you’re a vendor, in addition to being able to answer
to consider as you look to 2021. Can you request ad-hoc check-ins if you need the practitioner questions, here are a few questions
more support? to consider as you look at your product roadmap and
consider how you support customers:
• Will there be additional costs and charges if you
People Analytics Practitioners require greater technical support than anticipated at Challenges
the beginning of the contract?
If you’re a PAP, here are some questions to ask yourself • Do we clearly communicate to customers the
• Can the vendor provide a higher level of support challenges we excel at supporting and how we can
about the current or potential vendor:
than you anticipate you currently need, if your needs help with action-taking?"?
Challenges change? If so, what does that support look like and
what is the cost structure? • To what extent do we communicate our specialties in
• Does the vendor’s area of expertise match the a specific industry, geography, or organization size?
primary challenges you're trying to solve? To what Ethics
Support & Services
extent do they match the secondary challenges • What is the vendor’s approach on issues around data
you're trying to solve? security, privacy, and ownership? • Are we checking-in frequently enough with our
customers to understand their changing requirements
• To what extent does this vendor have expertise in your • Is there a standard set of ethical guidelines that and challenges to better serve their needs?
company’s industry, geography, or organization size? the vendor follows and uses as the baseline in
their implementations? • How often are we implementing updates and changes
• To what extent will you need support in redesigning to the solution based on the feedback we receive?
your HR strategy or people analytics strategy as you • To what extent will the vendor work with you to Does the frequency need to change?
go through this implementation? To what extent can design policies, practices, and processes that are
the vendor support those efforts? ethical, and ensure security and privacy? Ethics
• What is our current approach on issues around data
security, privacy, and ownership? Does it need to change?
• Is there a standard set of ethical guidelines that we follow
and currently use as the baseline in our implementations?
If not, what do we need to develop one?
RedThread Research. ©2020. People Analytics Tech 2020 | 29Looking to 2021 RedThread Research. ©2020. People Analytics Tech 2020 | 30
Capabilities & market changes
for 2021
As we look to next year, expect to see a number of changes      As far as the market, we foresee these changes:
when it comes to capabilities:
                                                                •   More partnerships across different types of vendors.
•   Moving toward more vendors using active and passive             We’re seeing vendors more actively collaborating with
    data together. As we mentioned above, more vendors              each other when they’re not able to offer the full people
    are using both types of data and we expect to see               analytics tech stack. For example, Visier and Medallia
    that continue.                                                  recently announced a partnership arrangement.

•   Greater use of unstructured data. As the use of passive     •   Greater market consolidation. Given the rising
    data becomes increasingly commoditized, we expect               awareness of the importance of people analytics and the
    vendors to seek out other data sources, such as voice,          large number of independent people analytics vendors,
    video, and images.                                              we expect that, in the coming year, we’ll see some of
                                                                    these vendors acquired by other types of human capital
•   Continued focus on sophisticated language analysis.
                                                                    technology providers or they’ll purchase each other to
    Basic NLP is increasingly a commodity capability. We
                                                                    increase market power.
    expect to see much more sophisticated NLP (and deep
    machine learning) to be a part of the analytics offering.

•   Focusing more on ethics. Ethics will be an even greater
    focus next year, given all the data sources mentioned
    above and the importance people analytics practitioners
    already place on it.

      RedThread Research. ©2020.                                                                                                People Analytics Tech 2020   |   31
What we’d like
to see in 2021
Here are some other changes that we don’t necessarily think be quitting because of too much overtime). However,
will happen next year, but which we sure would LIKE to see through machine learning, the tech could surface potential
happen: hypotheses about what’s happening if the technology
knows what users care about (e.g., that retail managers are
• Greater focus on enabling better decisions by business
important).
leaders, managers, and employees. We’ve been talking
for a while about the importance of democratizing • (Much) More work on DEIB. We see work being done
insights—making them more widely available. It’s not on DEIB—but it can’t be just providing representation
enough to just make data available and expect people to numbers. Instead, we encourage vendors (and
act on it: It must be offered in a productized manner, with a practitioners) to seek forward-looking drivers (e.g., level of
clear plan for the types of decisions that will be made with inclusion, number of diverse leaders in a succession plan or
those data. Right now, most of the solutions for these users candidate slate) of critical outcomes.
are just about providing data, but with no vision for what
those leaders will do with that information—and if those
decisions are important.
• People analytics insights to support development.
“Providing interesting data is the fastest way
As vendors integrate more passive data, they’ll have
even more opportunity to provide those insights back
to individual employees for the purposes of improving a people analytics team goes out of business.
awareness and eventually development. You have to provide insights that support
• Presenting potential hypotheses, not requiring leaders
decisions on critical business questions.”
to dig. We saw so many dashboards where leaders could
“dig” to test hypotheses they may have about what was – Marilyn Becker, Senior Director, People Analytics and HR
happening with the data (i.e., retail managers might Technology Strategy at Western Digital
RedThread Research. ©2020. People Analytics Tech 2020 | 32Wrapping Up
One thing that the current pandemic and events of 2020 have
made clear: Organizations and leaders need better insights into
their employees to enable them to work in and navigate the new
environment successfully. And for that, they need better data
and technology.
Our briefings reveal that once the pandemic began, vendors
saw their upcoming investments and contracts get put on-hold
by customers. However, by the last quarter of the year, vendors
began seeing those contracts convert and even turn into longer-
term engagements than previously anticipated.
In addition, as global focus on employee wellbeing and health
grows, organizational leaders will look toward HR to provide the
necessary awareness and insights into them.5 This is the time
for people analytics technology providers to step up and provide
customers with the much-needed support around these issues.
We believe the people analytics market will continue to grow and
mature over the next year. How quickly it grows may, to some
extent, depend on the ongoing pandemic and its economic
costs. That said, 2020 proved that people analytics—and the
data-driven insights it provides business leaders—are essential.
This shift in understanding will undoubtably fuel future growth,
regardless of the broader market (and health) forces.
RedThread Research. ©2020. People Analytics Tech 2020 | 33Appendix 1:
Demographics of vendors
There are a few changes between this year’s and last year’s Figure 21: Number of Employees for Vendors in People Analytics Tech Study, 2020
study participants.
15% 13%
• More solutions. This year, we have a total of 47 solutions as
part of our study, as compared with 37 in 2019. Nine solutions 4% 1-10 employees
from 2019 were unable to or did not participate this year. 11-50 employees
,
Twenty-one new solutions are included in our analysis this year.
51-100 employees
• Differences in solution types. While we have the same 101-500 employees
number of and solution type categories as last year, we don’t
21% 501-1,000 employees
have any solution that ONLY focuses on DEIB or workforce
1,001+ employees n = 47
planning, and, hence those 2 categories don’t show up in the
45%
graph (see Figure 22). 2%
• Vendor sizes. The majority of vendors (60%) are small with Source: RedThread Research, 2020.
less than 100 employees.
Figure 20: Number of Vendors in People Analytics Tech Study, 2020 Figure 22: Solution Types in People Analytics Tech Study, 2020*
50 45
Cumulative # of vendors*
2% 4%
40 4%
4% ONA
30
,
Multisource analysis platforms
6%
20 36% Employee engagement / experience
10 Employee coaching
0
13% HCM / integrated talent management analysis
1985
1987
1989
1991
1993
1995
1997
1999
2001
2003
2005
2007
2009
2011
2013
2015
2017
2019
Labor market analysis
*1 of the vendor in our study has 3 separate people analytics Text analysis
solutions, therefore, we have a total of 47 solutions in our study
and analyses, but 45 vendors in total. Learning analysis n = 47
Source: RedThread Research, 2020.
30% * Percentages may not total 100% due to rounding.
Source: RedThread Research, 2020.
RedThread Research. ©2020. People Analytics Tech 2020 | 34Appendix 2: PAT vendor
customer demographics
We received a total of 132 complete customer reviews. Of those, Figure 24: Months Since Solution Was Deployed for the Customer
almost 30% work in a people analytics function. The majority of 4%
them (64%) have been using the solution they reviewed for more
13%
than 12 months. 0-6 months
35% 6-12 months
Figure 23: Customer Respondent Industries* ,
1% 2% 2%
12-18 months
19%
19%
2%
3%
18-24 months
4%
24 months+
4%
4% Predeployment
11%
15%
6% 18% n
Source: RedThread Research, 2020.
7%
7% Figure 25: Role / Job Functions of Customer Respondents
15%
1% 1%
10%
Education People analytics
Entertainment / media 1%
3% Other HR / human capital mgmt
Real estate
7%
Transportation & aerospace Other
Government / military 29%
Energy / utilities 7% Talent management
Telecommunications
Agriculture / construction / mining HR business partner
Hospitality / food service 9% Operations
Manufacturing
Pharmaceutical / chemical / life sciences IT
Professional services
Financial / banking / insurance Finance
Healthcare
15% Business development
Technology
Talent acquisition n
* Percentages may not total 100% due to rounding. 27%
Source: RedThread Research, 2020. Source: RedThread Research, 2020.
RedThread Research. ©2020. People Analytics Tech 2020 | 35Appendix 3: Summary of methodology for
PAT Solution Matrix
This study is a culmination of nearly a year of qualitative and Hence, while we have 45 unique vendors which completed the
quantitative research. We kicked off our People Analytics participation process, a total of 47 solutions are included in the
Technology study in the spring 2020 by launching an online poll analysis.
for practitioners and vendors to find out what they want to know
On the practitioner side, we launched a short People Analytics
most about People Analytics Technology. We received more than
Technology Customer Poll in June 2020. Customers were
70 responses on the poll.
asked to share the challenges they’re using the solution to
The next step in the process was the launch of our People solve for, give feedback on the vendor’s strengths and areas of
Analytics Technology Vendor Survey in June 2020. In order improvement, as well as provide a Net Promoter Score and any
to participate in our study, vendors had to complete our other feedback. Each vendor was required to receive a minimum
317-question survey, which included questions on different user of 5 customer reviews to be included in our study. There was no
capabilities, talent areas of focus, and the range of solution limit on how many reviews they could receive. We received 5 or
capabilities. Each vendor could share details for up to 3 people more customer reviews for 24 vendors as of the end of October
analytics solutions. They were also asked to share case studies, 2020.
representative screen shots of their technology, logos, and
complete a 60-90-minute briefing and demo with us. The 2x2 matrix
vendors had the option of providing prerecorded briefing videos Once our qualitative and quantitative data collection and
if they preferred. The briefings took place during July-October analysis were complete, we went back to the 2x2 matrix that
2020. We also requested of vendors to share with us their login we developed and introduced in our 2019 report. Our matrix
to their demo environments, if possible. For those who could, we compares 2 aspects of vendors’ capabilities: usage frequency
were able to test out their solution and functionalities, and have and data sources. This approach allows us to identify some
included our reviews for them in the RedThread Assessment points of differentiation and categorize vendors in different,
section of the tool. meaningful segments.
A total of 45 vendors completed our survey. One of them offers
3 people analytics solutions, while the rest offer 1 solution each.
RedThread Research. ©2020. People Analytics Tech 2020 | 36Appendix 3: Summary of methodology for
PAT Solution Matrix
Understanding the X-axis
Starting with the X-axis, (see Figure 26), we range from solutions
that users tend to use / access on a frequent basis (e.g., Figure 26: Details of X Axis—People Analytics Technology Market Solution Matrix
quarterly, monthly, or bimonthly) on the left side of the matrix
to solutions that are used on a continuous / always-on basis
Users tend to use / access the Users tend to use / access
(e.g., weekly, biweekly, or daily) on the right. Please note: We are solution frequently (quarterly, the solution continuously / always
monthly, or bimonthly) on (weekly, biweekly, daily)
specifically thinking about how frequently users tend to use the
solution, not the frequency with which it’s updated or can give
insights. We focused on user frequency because it allows us to
Frequent Continuous
understand, from a practitioner’s perspective, how frequently a
Analysis Analysis
solution tends to be used—which can help us understand how
and by whom it’s used.
For example, the solutions on the left side of the model tend Strategic Strategic Informing
Primary
to be used to consistently check-in on specific areas of interest. use
organizational organizational individuals about
These are leveraged by HR, people analytics, and other business decisions decisions self / teams
leaders looking to make strategic talent decisions. Strategic
Secondary Informing individuals
organizational
As we move to the right, we see solutions that are trying to both
use about self / teams
decisions
provide analysis for strategic, organizational decision-making,
and inform users about themselves or their team. Many of these
Source: RedThread Research, 2020.
solutions’ typical primary users are people analytics or HR, but
the vendors have expanded or are in the process of expanding
their users to senior leaders, managers, and employees.
RedThread Research. ©2020. People Analytics Tech 2020 | 37You can also read