Performance of Daily Satellite-Based Rainfall in Groundwater Basin of Merapi Aquifer System, Yogyakarta
←
→
Page content transcription
If your browser does not render page correctly, please read the page content below
Performance of Daily Satellite-Based Rainfall in
Groundwater Basin of Merapi Aquifer System,
Yogyakarta
Novi Rahmawati ( novira.wati@gmail.com )
Universiteit Twente Faculteit Geo-Informatie Wetenschappen en Aardobservatie https://orcid.org/0000-
0003-2294-4507
Kisworo Rahayu
Serayu Opak River Basin Organization
Sukma Tri Yuliasari
Bureau of Geophysics, Meteorology and Climatology
Research Article
Keywords: satellite-based rainfall, Merapi Aquifer System Rainfall, CHIRPS, GPM IMERG, CMORPH,
TRMM
Posted Date: June 14th, 2021
DOI: https://doi.org/10.21203/rs.3.rs-490280/v1
License: This work is licensed under a Creative Commons Attribution 4.0 International License.
Read Full License
Version of Record: A version of this preprint was published at Theoretical and Applied Climatology on
July 23rd, 2021. See the published version at https://doi.org/10.1007/s00704-021-03731-9.
Page 1/26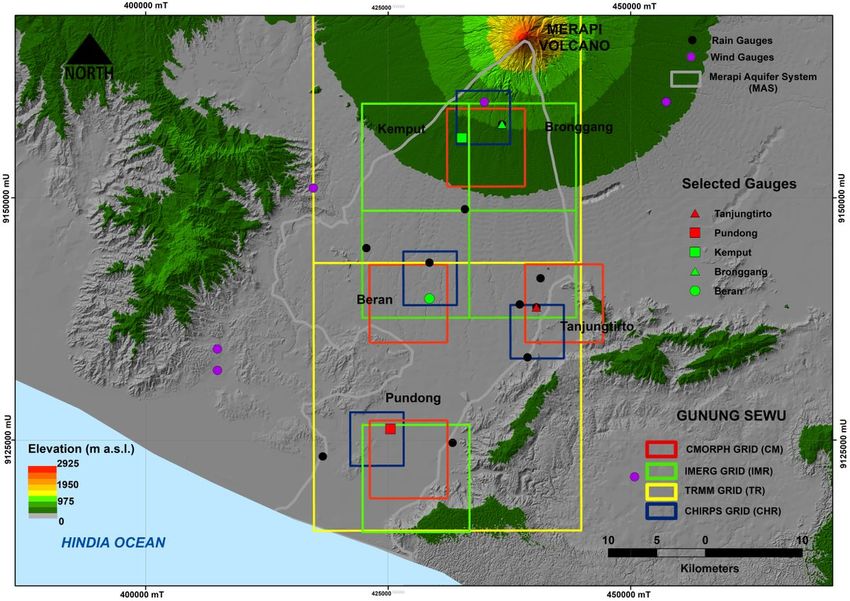
Abstract
Evaluation of the performance of daily satellite-based rainfall (CMORPH, CHIRPS, GPM IMERG, and
TRMM) was done to obtain applicable satellite rainfall estimates in groundwater basin of Merapi Aquifer
System (MAS). Performance of satellite data was assessed by applying descriptive statistics, categorical
statistics, and bias decomposition on the basis of daily rainfall intensity classification. This classification
is possible to measure the performance of daily satellite-based rainfall in much detail.

CM (CMORPH) has larger underestimation compared to other satellite-based rainfall. This satellite-based
rainfall also mostly has the largest RMSE, while CHR (CHIRPS) is the lowest. CM has a good performance
to detect no rain, while IMR (GPM-IMERG) has the worst performance. IMR and CHR have a good
performance to detect light and moderate rain. Both of them have larger H frequencies and lower MB
values compared to other satellite products. CHR mostly has a good performance compared to TR
(TRMM) especially on wet periods. CM, IMR, and TR mostly have a good performance on dry periods,
while CHR on wet periods. CM mostly has the largest MB and lowest AHB values. CM and CHR have
better accuracy to estimate rain amount compared to IMR and TR. All in all, all 4 satellite-based rainfall
has large discrepancy compared with rain gauge data along mountain range where orographic rainfall
usually occurs in wet periods. Hence, it is recommended to evaluate satellite-based rainfall with time
series of streamflow simulation in hydrological modeling framework by merging rain gauge data with
more than one satellite-based rainfall except to merge both IMR and TR together.

1. Introduction
Ground rainfall estimates using rain gauges is a traditional way of the most common methods (Brauer et
al. 2016) that is used to correct the bias of satellite rainfall estimates (Ma et al. 2019; Park et al. 2019) for
water resources application and related studies. For example, it is as the input for hydrological modeling
in basin scale (Andersen et al. 2001) and for modeling base flow (Becker and Braun 1999). Bias
correction requires ground rainfall estimates to correct satellite rainfall estimates because the finer
ground observation can reduce an error in spatial precipitation gradients of satellite rainfall
estimates (Zhang and Anagnostou 2019). The optimal and appropriate satellite rainfall estimates should
be selected before they are corrected with ground rainfall estimates.

It is necessary to evaluate the performance of satellite rainfall estimates to limit the error and uncertainty
of corrected gridded rainfall estimates when it is merged to the ground rainfall estimates. It is because
the successful of bias correction depends on understanding and quantification of systematic
uncertainties inherent to satellite-based rainfall and sensors (Sorooshian et al. 2011). The evaluation of
satellite-based rainfall performance will show the consistency and deficiencies of satellite rainfall
estimates (Pfeifroth et al. 2015) compares to ground observation (Sorooshian et al. 2011). Ground
observation of rain gauge measures rainfall directly, while satellite rainfall products estimate rainfall from
visible/infrared (VIS/IR), microwave MW), and/or radar sensors (Bai and Liu 2018). Satellite observing

                                                    Page 2/26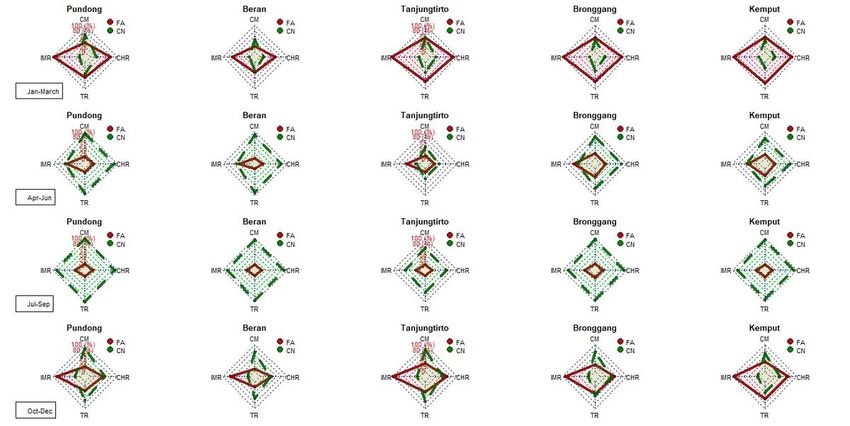
system also has a complex uncertainty and error because of precipitation estimates from cloud and
precipitation parameters (Stephens and Kummerow 2007).

Satellite rainfall estimates CMORPH (Climate Prediction Center Morphing Methods) is passive microwave
(PMW)-based rainfall estimates (Joyce et al. 2010) that accurately derives rainfall estimates compare to
infrared (IFR)-based algorithm (Ebert et al. 2007). CMORPH is applicable for diurnal cycle of
precipitation (Janowiak et al. 2005) in mountainous region in Bali compared to other satellite-rainfall
estimates (Rahmawati 2020), although CMORPH tends to underestimate heavy rain-rate in mountainous
area (Derin et al. 2016; Rahmawati 2020; Rahmawati and Lubczynski 2018). This satellite can be used to
evaluate its performance in groundwater basin in Merapi Aquifer System since it is more accurate in
tropics island of Bali compared to TRMM (The Tropical Rainfall Measuring Mission) and PERSIANN
(Precipitation Estimation from Remotely Sensed Information using Artificial Neural Networks). Satellite
rainfall estimates of CHIRPS (Climate Hazards group Infrared Precipitation with Stations) has a finer
spatial resolution that has probability to catch diurnal cycle of precipitation in tropics. Satellite Rainfall
estimates of IMERG (Integrated Multi-satellitE Retrieval for GPM or Global Precipitation Measurement) is
the latest replacement of TRMM mission. It considers to bring together existing satellite rainfall estimates
of CMORPH, TRMM and PERSIANN (Rozante et al. 2018). It is necessary to evaluate the performance of
both CHIRPS and GPM-IMERG in groundwater basin of Merapi Aquifer System. Moreover, the
performance of TRMM is also possible to be evaluated its performance in MAS as a control point to be
able to know the possible improvement of GPM-IMERG.

Merapi Aquifer System (MAS) is a groundwater basin in Yogyakarta that abundance with richness of
groundwater storage. This basin has physical border of mountain range that separates Java Island into
two parts, northern and southern. There is the line of water body of Hindia Ocean that borders
groundwater basin of MAS in the south part. The border in the east part is Gunung Sewu Mountain
Range, while ancient volcano of Kulon Progo in the west part. This physical border of MAS is leading to
the unique character of rainfall pattern and distribution in this area. The sufficient information of
precipitation from rain gauge and satellite-based rainfall is necessary to be able to describe this unique
character. Therefore, the objectives of the research is to evaluate the performance of daily satellite-based
rainfall on the basis of 13 rain gauges over 5 year periods (1 January 2008-31 December 2012) applying
descriptive statistics, categorical statistics, and bias decomposition at various class of rainfall intensity.

The novelty of the research is in the first time : (i) validation of satellite rainfall estimates over MAS using
4 satellite-based rainfall, i.e. CMORPH, CHIRPS, GPM IMERG, TRMM (ii) latest and long periods of
validation, i.e. recent year of 2008 to 2012 and over 5 years, (iii) different assessment of rainfall intensity
of satellite rainfall estimates applying descriptive statistics, categorical statistics, and bias
decomposition.

1.2 Study Area Description

Yogyakarta Special Region is located in the south of Central Java Province, Indonesia. In the north, it is
bordered with mountain range that separates Java Island into two parts, northern and southern.
                                                    Page 3/26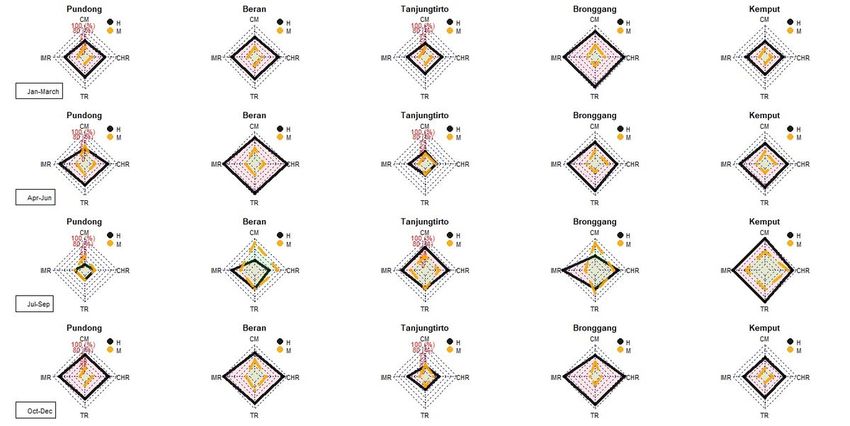
Yogyakarta Special Region is situated in the southern part of mountain range with Merapi Volcano as
part of this mountain range. Top of Merapi Volcano is the highest places in Yogyakarta Special Region
that is 2,925 m.asl based on topography map scale 1:25,000 in 1998 (Fig. 1). Only the south slope of
Merapi Volcano is as the part of Yogyakarta Special Province, others are under administrative of Central
Java Province. Most of Yogyakarta Special Province areas abundance with richness of groundwater
storage because it is included in Merapi Aquifer System.

Based on rainfall data on 1 January 2008 to 31 December 2012 within 13 rain gauges stations available
in MAS, the maximum daily rainfall is 188.0 mm·day-1. This rainy events is classified as extreme rain.
Most of rainfall occurs with the intensity ≤ 20 mm·day-1 and 20-50 mm·day-1 which are light to moderate
rain. Very heavy rainfall or rainfall with the intensity of 100 to 150 mm·day-1 occurs very rarely. Only
occurs in a certain day or some days for a year in certain station. This very heavy rainfall is not only
occurs in high land areas, but also in lowland areas. It is probably because the condition of MAS that is
surrounded and blocked by mountain range and sea. Extreme rain only occurs twice within 5 years.

2. Methods
The time span to evaluate satellite daily rainfall estimates in Merapi Aquifer System (MAS) is on 1
January 2008 until 31 December 2012 (1,826 days). The data collection is from Serayu Opak River Basin
Organization (locally called BBWS Serayu Opak), Yogyakarta. Rainfall data is measured with automatic
and non-automatic rain gauges station. The automatic rain gauge measurement is mostly used to
validate rainfall estimates. In case the automatic measurement is broken for several months or year the
manual rain data is used for validation. There are 13 daily gauge stations within Merapi Aquifer System
used to validate satellite rainfall estimates of CMORPH, CHIRPS, GPM IMERG and TRMM (Fig. 1). These
13 gauges is selected because they have complete data. The type of the gauge is tipping bucket rain
gauge that accumulates a volume in a small bucket corresponding to 0.1 mm (Michaelides et al. 2009).
There are also 6 climatology stations (wind gauges) used to analyze daily wind speed in MAS (Fig 1).
ArcGIS is used for processing, analyzing and finalization of MAS rainfall estimates with the support of
Python GUI (IDLE) and R Software.

Satellite data of 8-minutes CMORPH is resampled on daily basis for the same period with rain gauge
observation data in Yogyakarta Special Region. The 8-minutes CMORPH (CM) has 0.07⁰ spatial
resolution (roughly 8 km x 8 km at equator). This finer resolution can capture rainfall dynamic compared
to coarser resolution in diurnal cycle of tropical rainfall in Indonesia (Rahmawati and Lubczynski 2018).
CMORPH is merged of Infrared (IR) and microwave (MW) applying lagrangian equation to retrieve rainfall
estimates (Joyce et al. 2004). This rainfall product does not use rain gauge data for rainfall retrieval.
There is no adjustment with rain gauge data to obtain rainfall estimates of CMORPH. The version used in
this paper is purely from satellite sensors (Xie et al. 2017). It is not only because it is best performance in
Bali Island (Rahmawati 2020), but also it shows improvement performance of a satellite-only product.
The poor quality and the lack of spatial representative of that gauges that are used for bias correction are
probably the reason satellite-only product have a good performance in rainfall estimates compared to
                                                   Page 4/26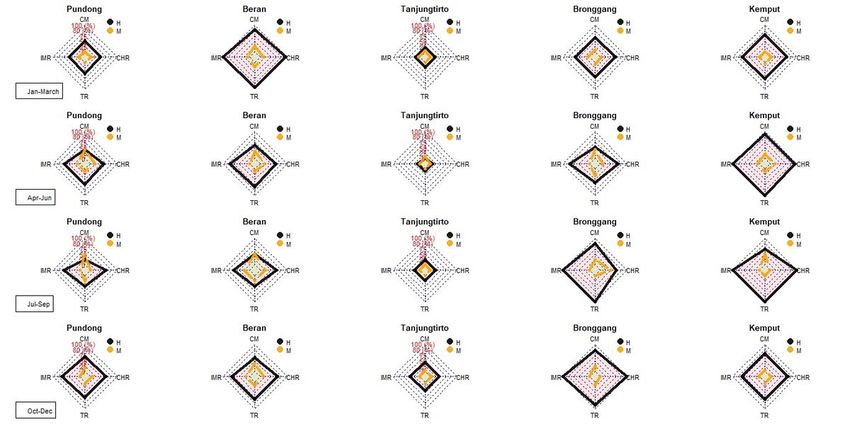
satellite-gauge bias corrected product (Habib et al. 2014). The data of CMORPH or CMORPH version 0.x
is downloaded with the support of ILWIS ISOD Toolbox (Maathuis et al. 2014).

The GPM IMERG satellite data is multi satellite algorithms from the component of TRMM TMPA,
CMORPH-KF, PERSIANN-CCS (Huffman et al. 2019). This is gridded rainfall estimates product that GPM-
CO (GPM Core Observatory) and its partners of satellite precipitation estimates along with geostationary
IR sensors to fill the gaps between MW sensors by lagrangian time interpolation or lagrangian morphing
and monthly precipitation data. GPM-CO uses the most advanced precipitation sensors in space
currently. It is the precipitation sensors successors of TRMM (Hou et al. 2014). GPM IMERG (IMR)
provides a quasi-global satellite rainfall estimates from 60⁰N to 60⁰S. It is available in gridded of 0.1⁰
spatial resolution (roughly 10 km x 10 km at equator) and 30 minutes temporal resolution (O and
Kirstetter 2018; Skofronick-Jackson et al. 2018). The datasets is downloaded on daily basis from 1
January 2008 to 31 December 2012 using this
link https://gpm1.gesdisc.eosdis.nasa.gov/data/GPM_L3/GPM_3IMERGDF.06. In this research, we use
the final run and current version of GPM IMERG that is the version 06. It is because this version has (i)
inclusion of additional sensors specifically of TRMM, (ii) parent GPM product improvement, and (iii) the
refinement of morphing components (Freitas et al. 2020).

TRMM TMPA 3B42 version 7 is bias-corrected satellite rainfall product of TMPA (Guo et al. 2015). It is the
merged product of Infrared from geosynchronous satellite and passive microwave from low orbit
satellite. It covers between coverage of 50⁰N to 50⁰S. It is available in gridded of 0.25⁰ spatial resolution
(about 27 km x 27 km at equator) and 3-hours temporal resolution. TRMM (TR) and GPM are used to
characterize the changes of earth water cycle, freshwater fluxes and reservoirs, and to advance the
prediction of natural disaster and extreme weather (Skofronick-Jackson et al. 2018). The webpage to
obtain daily temporal resolution of this data
is https://disc2.gesdisc.eosdis.nasa.gov/data/TRMM_L3/TRMM_3B42_Daily.7.

CHIRPS satellite data is a quasi-global rainfall data that is available from 50⁰N to 50⁰S and 180⁰E to
180⁰W coverages (Aksu and Akgül 2020). This datasets is available since 1981 to present (Sacré Regis
M. et al. 2020). CHIRPS (CHR) is high resolution of satellite observation and imagery that provides
shorted low latency, high resolution, low bias, and long period of precipitation gridded datasets for
drought monitoring and climate change analysis (Funk et al. 2015; Liu et al. 2019). The source of CHIRPS
satellite rainfall estimates is from monthly precipitation data, geostationary satellite thermal IR
observation, TRMM 3B42, and in-situ precipitation observation (Funk et al. 2014). CHIRPS is available for
0.05⁰ spatial resolution (about 5 km x 5 km at equator) and daily temporal resolution. The datasets are
available in this link https://data.chc.ucsb.edu/products/CHIRPS-2.0/global_daily/tifs. The datasets is
downloaded with the same period with ground rainfall estimates from rain gauge.

The performance of 4 satellite-based rainfall was assessed applying descriptive statistics, categorical
statistics and bias decomposition adapting Rahmawati and Lubczynski (2018). The modification is
performed by the assessment of satellite-based rainfall applying 4 rainfall intensity classification

                                                   Page 5/26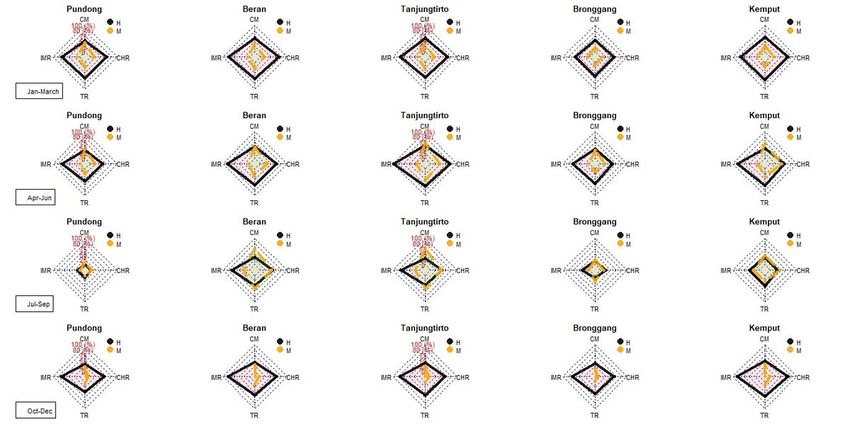
adapting from BMKG (2010). It is done so that it is to be able to evaluate the performance of satellite
rainfall estimates in much detail in each rainfall classification. Most of rainfall intensity occurs from light
to moderate rain so that rainfall intensity from heavy to extreme is categorized as one classification. The
modification of rainfall intensity classification is shown in Table 1. The formula for descriptive statistics
consists of mean error (ME), root mean square error (RMSE) as is shown in Equations 1 and 2. The
assessment was performed for each station in each season division separately. Since satellite-based
rainfall is not good performance in transition season in tropics climate of Bali (Rahmawati 2020) so that
the division of season were based on assumption: i). wettest months in wet period (January to March or
Jan-March), ii). wet months in wet period (October to December or Oct-Dec), iii). dry months in dry period
(April to June or Apr-Jun) and iv). driest months in dry period (July to September or Jul-Sep). The
representative and different location of stations will be assessed to evaluate the performance of satellite-
based rainfall in much detail. These selected rain gauges stations is shown in Fig. 1.

In Equations 1 to 2, T is total number of daily rainfall events in each rainfall intensity classification from
2008 to 2012 (i.e, T is number of days for 0 mm·day-1 (no rain) for January to March from 2008 to 2012),
Rst is the value of rainfall based on satellite-based rainfall at time series t, Rgt is the value of rainfall
based on rain gauge at time series t.

Categorical statistics and bias decomposition are also classified based on rain intensity. Categorical
statistics and bias decomposition were calculated for each 13 available rain gauges. Contingency table
for categorical statistics is expressed in Table 2, while the formula for bias decomposition is shown in
Equations 3-7 adapting from Rahmawati and Lubczynski (2018). The contingency table in Tables 2
shows the example of contingency table for zero rain (0 mm·day-1) and light rain (0 mm·day-1 < rain < 20
mm·day-1), others rainfall intensity class is following this example. The performance of satellite-based
rainfall for categorical statistics in detecting no rain is assessed from CN and FA, while for rainfall
intensity > 0 mm·day-1, i.e. light rain to extreme rain, is assessed from H and M. In bias decomposition,
the assessment of no rain detection is based on Rs (or it is equal to TB for no rain since only FB
available), while AHB and MB is for rainfall intensity > 0 mm·day-1 (light to extreme rain).

where FA is when satellite-based rainfall detects rainfall and rain gauge detects no rainfall, CN is when
both satellite-based rainfall and rain gauge detects no rainfall, H is the daily event when both satellite-

                                                   Page 6/26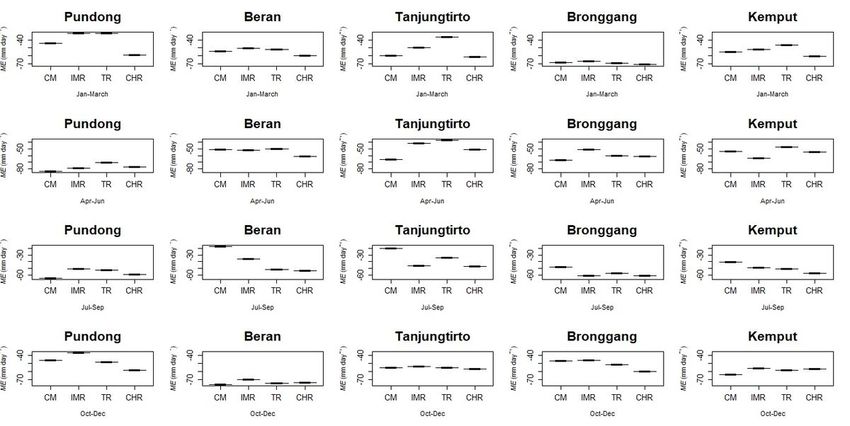
based rainfall and rain gauge detects rainfall, and M is when satellite-based rainfall detects no rainfall
and rain gauge detects rainfall

where HB is hits bias, AHB is absolute hits bias, MB is miss bias, FB is false bias and TB is total bias.

3. Result
The result of descriptive statistics applying mean error (ME) to validate 4 satellite-based rainfall for 4
intensity classification in MAS are presented in Fig. 2 to Fig. 5. The boxplots made for no rain detection
for different seasons shows in Figure 2. All 4 satellite-based rainfall generally overestimates no rain
events in dry and wet periods especially on driest months (Jul-Sep) and wettest months (Jan-March). CM
is mostly only slightly overestimates no rain, while CHR highly overestimates no rain compared to others.
TR and IMR have comparable performance in detecting no rain. The difference value of ME between
those two can be 0 mm·day-1 and mostly below 1.0 mm·day-1.

The boxplot of ME of 4 satellite-based rainfall against 5 rain gauges to detect light rain is presented on
Fig. 3 for 4 season separately. The performance of 4 satellite-based rainfall is inconsistent to detect light
rain. All 4 satellite-based rainfall can be overestimates and underestimates to detect light rain from gauge
observation. The performance of all satellite-based rainfall is generally similar which is no one is superior
to one another for all seasons. But, it can be noted that CHR often has lowest underestimation and
overestimation on driest months (Jul-Sep) compared to CM, IMR, and TR. Both IMR and TR performance
is mostly comparable compared to both CM and CHR.

The ME boxplot for 4 satellite-based rainfall against 5 rain gauges to detect moderate rain is presented
on Fig. 4 for 4 season division separately. The satellite products underestimates moderate rain from rain
gauges because rainfall amount from satellite products is lower compared to gauges rainfall amount.
CHR mostly has larger discrepancy compared to rain gauges on wet periods on Jan-March and Oct-Dec,
while TR has lower discrepancy on Jan-March and IMR on Oct-Dec. CHR consistently performs
underestimation on moderate rain on wet and wettest months. CHR has the largest underestimation of
moderate rain, while TR is the lowest.

                                                  Page 7/26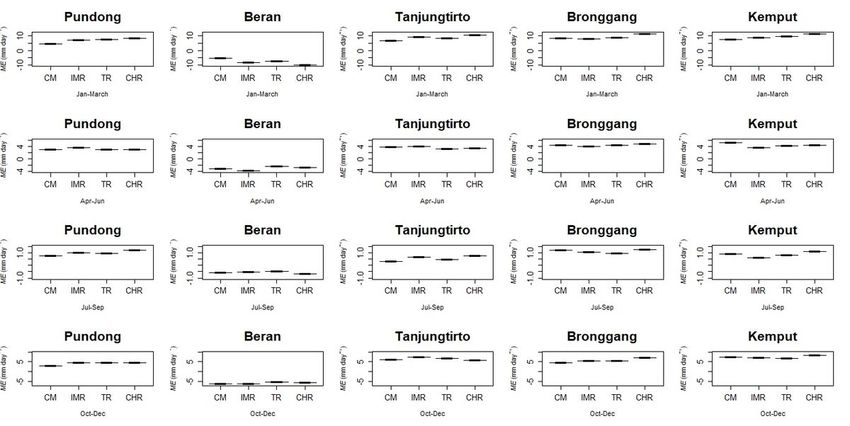
The boxplot made for daily ME of 4 satellite-based rainfall against 5 rain gauges to detect heavy to
extreme rain is presented in Fig. 5. CHR is the most underestimate rainfall on wettest months of Jan-
March and on driest months of Jul-Sep, while CM is mostly on Apr-Jun. IMR and TR mostly have
comparable performance.

The daily RMSE of 4 satellite-based rainfall against 5 rain gauges to detect no rain shows on Table 3.
From this table, it describes that CHR has superior performance compared to 3 other satellite products. It
mostly has the lowest RMSE in almost all 4 season from January to December. TR is the worst
performance to detect no rain on wettest months (Jan-March), while CM on dry (Apr-Jun) and driest
months (Jul-Sep). Both of them mostly have the largest value of RMSE. Only very few occasion on the
driest months (Jul-Sep), CM has lowest discrepancy with rain gauges compared to CHR.

The performance of CHR shows the lowest value of RMSE to detect light rain (Table 4) on wettest months
(Jan-March), dry months (Apr-Jun), driest months (Jul-Sep), and wet months (Oct-Dec). The degree of
discrepancy of CHR with rain gauge observation is much lower compared to other satellite-based rainfall.
The value of RMSE of CHR is very lower compared to 3 satellite products especially with CM on driest
months. CM has largest RMSE on dry and driest months of April to September. CM and TR has a good
performance compared to IMR on Oct-Dec. CM and TR have larger value of RMSE on wettest months.

The RMSE value of CHR is mostly the lowest to detect moderate rain on Jan-March (Table 5). The most
largest values of RMSE of CM occurs on Apr-Jun. CM is more frequent to have large RMSE value
compared to others on driest months of Jul-Sep. The value of CHR RMSE is the lowest on wet months of
Oct-Dec, while the largest is CM. It seem CHR is superior to detect moderate rain on wet and wettest
months. IMR and TR has comparable performance, the frequency of superiority performance to detect
moderate rain for one another is similar. IMR and TR have better performance on dry periods which are on
driest months or on dry months.

The performance of satellite-based rainfall is mostly comparable to detect heavy to extreme rain (Table
6). Mostly, IMR has low RMSE values. CM mostly has better performance on driest months on July to
September. CHR is often to have large RMSE values, followed by CM. It seem most of satellite products
has difficulty to estimate heavy to extreme rain because there is no clear indication which satellite
product inferior to one another in each season division.

The performance of satellite products in detecting no rain (0 mm·day-1) is assessed from the frequencies
of correct negatives (CN) and false alarm (FA) as in Fig. 6. CM is the best performance to detect no rain
on wettest months (Jan-March), followed by TR and CHR. Mostly more than 90% of no rain events can be
detected by CM. IMR is the worst to detect no rain in wettest months. The frequency of CN for IMR is the
lowest which also occurs on the wet months of October to December. CM is occasionally to have a good
performance to detect no rain on dry and driest months from April to September, followed by TR. IMR is
more often to have difficulty to detect no rain on April to September compared to CHR. The satellite

                                                  Page 8/26
products is more superior to detect no rain on wet periods (wet and wettest months) than on dry periods
(dry and driest months).
IMR mostly has the largest hits (H) frequencies to detect light rain on both wet and dry periods, followed
by CHR and TR (Fig. 7). More than 88% of light rain events can be detected by IMR on wettest months,
while CHR more than 81%. TR occasionally has a good performance compared to CHR on dry or driest
months so that TR sometime has larger H and lower M compared to CHR in these dry periods. CM has the
lowest frequency of H for light rain. As a result, CM has the largest number of M. The frequency of M for
CM is lower on dry and driest months compared to wet and wettest months especially on driest months.
More than 50% of light rain can be detected by CM on driest months of July to September.
The spider chart of H and M frequencies in detecting moderate rain for 4 satellite-based rainfall against 5
rain gauges from 1 January 2008 to 31 December 2012 shows in Fig. 8 for each season separately. The
performance of 4 satellite products to detect moderate rain almost similar with light rain. IMR is more
often to have the largest H frequency, followed by CHR and TR. More than 90% of light rain events can be
detected by IMR on wettest months, while CHR more than 84%. But occasionally the performance of IMR,
CHR, or TR is comparable on dry or driest months. The frequency of H for CM is mostly the lowest in all
season.
CM is not a good performance to detect heavy to extreme rain (Fig. 9). It has the lowest frequency of H
and largest frequency of M. IMR has the largest frequency number of H to detect heavy to extreme rain,
followed by CHR. TR is better performance than CM. It has lower frequency of M than CM.
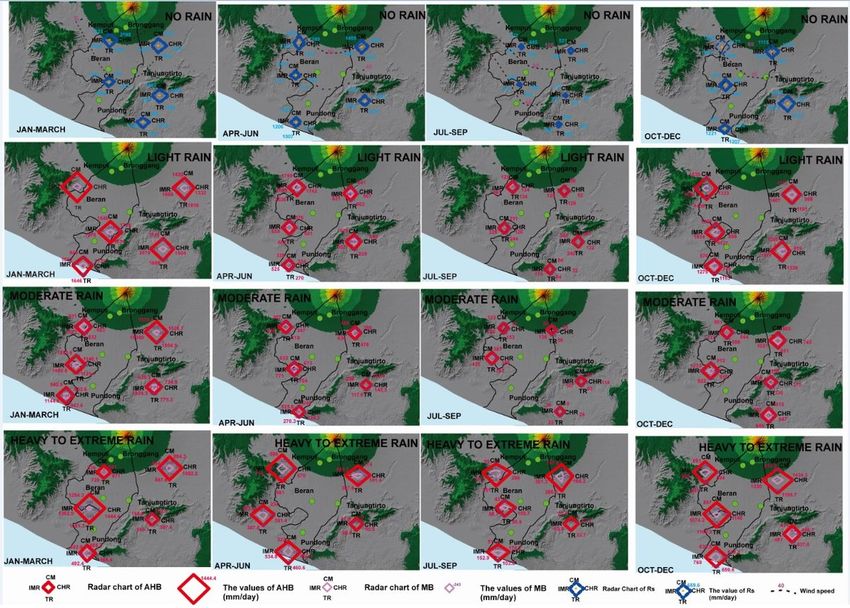
The spatial maps of Rs or TB in detecting no rain (0 mm·day-1) for 4 satellite-based rainfall against 5 rain
gauges from 1 January 2008 to 31 December 2012 is shown in Fig. 10. CM has the lowest Rs or TB on
the wettest months of January to March, while CHR is the largest. IMR has the better performance
compared to TR. CM mostly has the lowest TB on driest and wet months. It means CM has the largest
accuracy to detect no rain. IMR and CHR has the larger TB compared to TR on dry months of April to
June. Station located near mountain range or mountain rise, i.e. Tanjungtirto and Kemput, has larger TB
values compared to other stations. It is because satellite products falsely detect rainy events leading to
large value of TB. It is mostly only 10-20% of no rain can be detected by satellite products on wet periods,
exception for CM. It is probably the wind flow from south to north that make satellite products falsely
detect rainy events. The air mass flows from the sea sweep away to the direction of mountain peak of
volcano to create orographic precipitation. Particularly, the wind speed is mostly more slowly in wet
periods. The wind speed is approximately 80 km/day (~ 1.8 knots/day) near mountain rise in wet periods,
while in driest months of July to September 100 km/day (2.25 knots/day).
The spatial maps radar chart of bias decomposition component for MB and AHB in detecting light rain
for 4 satellite-based rainfall against 5 rain gauges from 1 January 2008 to 31 December 2012 is shown in
Fig. 10. IMR generally has lowest MB and CM the largest MB in detecting light rain on wet and dry
periods. The MB values of CM is much larger compared with MB values of CHR in wet periods and TR in
Page 9/26
dry periods. CHR has lower MB compared to TR on wet and wettest periods. It is an opposite condition on
dry and driest months, TR has lower MB compared to CHR. All satellite products has large values of AHB
on Jan-March (wettest months) and Oct-Dec (wet months). All of them has large values of AHB near the
mountain range. AHB of CHR has the lowest values on wet and wettest months indicating this satellite-
based rainfall a good performance to detect rain amount on wet periods. IMR mostly has the largest
values of AHB on all season on wet and dry periods. IMR is not a good performance to detect rain
amount of light rain.

IMR and CHR mostly has comparable performance to detect moderate rain compared to CM and TR on
wettest and dry months (Fig. 10). Both of them has low values of MB. CM is poor performance than TR.
IMR has a good performance on wet months of October to December, followed by CHR and TR. CM has
the largest MB values in these months. IMR has low values of MB because it has the lowest M frequency
to detect rainfall intensity more than 0 mm·day-1. But IMR has the largest value of AHB indicating this
satellite product is not a good performance to detect rain amount. CM generally has the lowest AHB in all
periods, followed by CHR. For example in Bronggang Station, the accuracy of IMR to detect rain amount
is 1/3 of CM, while 1/2 of CHR. However, all satellite-based rainfall has largest values of AHB in
Bronggang station near the top of Merapi Volcano. It is probably the orographic events surrounding this
mountain that make satellite products have difficulty to estimate rain amount.

CHR is not a good performance to estimate heavy to extreme rain (Fig 10). It mostly has the largest AHB
values. The second place that have large AHB values is IMR or TR. Usually, IMR is a good performance
compared to TR on driest months of Jul-Sep, while TR on dry months of Apr-Jun. On high altitude rain
gauges stations, such as Bronggang, Kemput and Tanjungtirto, CHR has better accuracy to detect heavy
to extreme rain on wet periods compared to IMR and TR. This satellite product has lower AHB values than
IMR and TR in wet periods. CM has the largest accuracy to detect rain amount of heavy to extreme rain.
The value of AHB for CM is the lowest. In contrast with AHB values, MB of CM is the largest. IMR is
mostly has the lowest MB values and CHR is better accuracy than TR to estimate heavy to extreme rain.
CM has the largest frequency of M so that the value of MB will be large although CM is a good accuracy
to estimate rain amount. The second place to have a good accuracy to estimate rain amount is CHR.

4. Discussion And Conclusion
A sparse density of rain gauge is a challenging task to estimate strong spatial-temporal variability of
precipitation in a tropics (Rahmawati and Lubczynski 2018). Accurate and reliable satellite-based rainfall
is necessary to be merged with gauge-based rainfall to catch diurnal cycle of precipitation in
tropics (Rahmawati 2020). Before satellite-based rainfall is merged to rain gauge observation, it is
important to evaluate the performance of satellite-based rainfall. One of the ways to evaluate the
performance of satellite-based rainfall is by the direct comparison of satellite-based rainfall against
gauge observations or point-to-point comparison as applied in MAS (Bai and Liu 2018; Belay et al. 2019;
Chen et al. 2016; Luo et al. 2019). There are several consideration to evaluate the performance of

                                                 Page 10/26
satellite-based rainfall: i) the detail knowledge of rainfall characteristics, ii) algorithm of satellite-based
rainfall, and iii) resolution of satellite-based rainfall.
The detail knowledge of rainfall characteristics, i.e. rainfall intensity, is essential to evaluate remotely
sensed rainfall estimates (Mandapaka and Qin 2013). It is important to provide nature and
characteristics of rainfall and better prediction of hydrologic response in watersheds and urban
areas (Chen et al. 2016) since rainfall exhibit different mean value and variability at daily time
series (Choubin et al. 2019). The error estimation of satellite-based rainfall in frequencies and intensities
of daily precipitation influences the simulation result of surface water, sub-surface water,
evapotranspiration and different amount and proportion of simulated water balance components (Luo et
al. 2019). The daily satellite-based rainfall (CM, IMR, TR, and CHR) mostly overestimates rainfall intensity
≤ 20 mm·day-1. It is because satellite estimation from infrared and microwave lead an overestimation of
rainfall amount due to ignorance of the surface altitude in the algorithm. Evaporation of rainfall below
the cloud base in complex terrain is not counted because rainfall retrieval is from brightness temperature
at cloud top (Scheel et al. 2011). The satellite-based rainfall overestimates rainfall in MAS because of the
possibility of cloud microphysical, rain processes and moisture distribution in the
environment (McCollum et al. 2000). The daily satellite-based rainfall underestimates rainfall intensity ≥
50 mm·day-1. The range of underestimation is much higher especially for extreme rainfall (≥ 150
mm·day-1). It is probably satellite-based rainfall has a tendency to underestimates convective rain
amounts (Bell and Kundu 2003). In convective system, infrared estimates rainfall from cirrus cloud that
do not produce any precipitation (Scheel et al. 2011).
A multitude of technique is developed and available for the estimation and retrieval of rainfall for satellite
sensors (Kidd and McGregor 2007). The algorithm of satellite-based rainfall is mainly based on
microwave and infrared sensors together with ground-based data (radar or rain gauge) or multiple
sensors (Freitas et al. 2020; Kidd and Levizzani 2011; Tapiador et al. 2012). The nature of error can
change with the update of retrieval algorithm and the change of data source leading to different
performance of satellite-based rainfall for different region, season and precipitation type, i.e., rainfall
intensity (Ebert et al. 2007; Guo et al. 2015). CHIRPS (CHR) is best performed compared to others
satellite-based rainfall. This satellite product mostly shows lowest RMSE especially in rainfall intensity <
50 mm·day-1. CHR is best performance because it apparently the infrared precipitation determine to
effectively represent some of the systematic climate effects of complex terrain (Funk et al. 2014). TR and
IMR have almost similar performances. The value of rainfall amount occasionally is similar or
comparable. It is because the new satellite sensors and algorithmic from TR to IMR leads to mixed
performance regarding various rainfall intensities (He et al. 2017).
The different performances observed for different rainfall intensities could be attributed to the intrinsic
features of satellite-based rainfall, i.e. TR and IMR, produced by algorithmic and sensors discrepancy (He
et al. 2017). CM is best performance to detect no rain. CM has the most frequent hits (H) for no rain that
is why this satellite product has the lowest overestimation toward rain gauge data. Mostly, all satellite-
Page 11/26based rainfall performs worse in estimating rainfall intensity ≥ 50 mm·day-1. CHR also performs worse in
detecting heavy to extreme rain. It can be seen from the larger values of RMSE compared to others. It is in
agreement with Funk et al. (2015). IMR generally has a good performance compared with TR. IMR
advanced satellite sensors leading the IMR detects the occurrences of light-rain and extreme heavy-rain
ranks better than TR does, although IMR tends to produce significant overestimation of the amounts of
extreme rain events (He et al. 2017).
The performance of satellite products is different for dry and wet periods. The performance of satellite-
based rainfall is good in wet periods (wet and wettest months) and worse in dry periods (dry and driest
months) such as CHR. It is probably the rain-rate variability especially during dry seasons is likely to be
much stronger and tend to have strong diurnal modulations for satellite algorithm (Bell and Kundu 2003).
It is also because limited ability to differentiate drizzle or frozen rainfall during the later period (Wu et al.
2019). CM and TR mostly has a good performance in dry periods. It is because the inability of the
technique to retrieve precipitation during wet season, either through a greater low-intensities precipitation
or because of cold surface background affecting PMW retrievals (Kidd et al. 2012).
Satellite-based rainfall is able to detect spatial and temporal variability of rainfall at finer resolution (Chen
et al. 2016; Rahmawati 2020). The resolution and time step of spatial satellite-based rainfall influence the
accuracy and outcome of precipitation-based analysis (Gupta et al. 2020), i.e. the lowest RMSE values of
CHR. However, it is not fully in agreement based on this research in MAS. The advanced algorithm of
satellite-based rainfall also give an effect on the accuracy to estimate rainfall, i.e. lowest MB values of
IMR. CHR mostly be in the second place to have low values of MB. The traditional algorithm of satellite-
based rainfall that also does not use rain gauge data to estimate rainfall influences accuracy of rainfall
estimates, i.e. the largest H frequency of CM for no rain detection and lowest values of AHB of CM. It is
because rain gauge data that is used for bias correction or bias adjustment for satellite rainfall estimates
does not represent study area.
Eastern and western MAS is generally treated as climatically separate units that influences modulation
precipitation in the groundwater basin of MAS. It is perhaps one of the reason satellite-based rainfall is
not a good performance to detect certain rainfall amount in MAS. All 4 satellite-based rainfall also poor in
estimating moderate to extreme rain, although CHR mostly show better performance compared to others.
All satellite products mostly has large values of AHB along mountain range. The rain may not fall with
equal possibilities at different time of the day at different points such as near coast and near mountain
range (Bell and Kundu 2003). PMW sounding instruments are relatively insensitive to surface emissions
and therefore are essentially immune to cold background issues (Kidd et al. 2012) such as along
mountain range or hills. Therefore, satellite-based rainfall has lower accuracy to detect rainy events along
mountain range or hills in MAS. It shows from large values of MB and AHB along hills and mountain
range.
It is recommended to validate 4 satellite-based rainfall based on streamflow simulation in hydrological
modeling framework before it applies for water resources application and related studies. It is because
Page 12/26point-to-point comparison or simple interpolation can create bias (Chen et al. 2016) and the error of
satellite-based rainfall can show in time series streamflow simulation (Bai and Liu 2018). The satellite
product can be corrected with rain gauge data and/or merged with other satellite products to obtain
advantages of each satellite product. It is better not to merge IMR and TR because both of them often
have comparable performance and IMR is an improvement algorithm of TR. It is also possible to use
certain satellite product that good performance to detect no rain so that it is good for drought application
such as CM in dry periods and CHR in wet periods or combine both of them. It is because CM has a good
performance to detect no rain and mostly has lowest values of AHB from light to extreme rain, while CHR
has a good performance to estimate light to moderate rain. CHR mostly has the lowest RMSE values, low
values of AHB (after CM), low values of MB (after IMR). CHR mostly has better performance compared to
others.
Declarations
Conflict of Interest
The authors declare that they have no known competing financial interests or personal relationships that
could have appeared to influence the work reported in this paper.
Funding Statement
This research did not receive any specific grant from funding agencies in the public, commercial, or not-
for-profit sectors.
Author Affiliation
Department of Water Resources, Faculty of Geo-Information Science and Earth Observation (ITC),
University of Twente, Enschede, The Netherlands
Novi Rahmawati
Serayu Opak River Basin Organization (BBWS Serayu Opak), Ministry of Public Works and Housing,
Yogyakarta, Indonesia
Kisworo Rahayu
Bureau of Geophysics, Meteorology and Climatology (BMKG), Makassar, Sulawesi, Indonesia
Sukma Tri Yuliasari
Corresponding Author
Correspondence to Novi Rahmawati (novira.wati@gmail.com)
Author’s Contribution
Page 13/26Novi Rahmawati is Conceptualization, Methodology, Software, Validation, Formal Analysis, Investigation
including data collection, data curation including software code, visualization, writing-original draft.
Kisworo Rahayu is Investigation-data collection and writing-reviewing and editing. Sukma Tri Yuliasari is
writing-reviewing and editing
Availability of Data and Material
All data published in this article are available upon request except the raw data of daily rainfall and wind
speed from gauge stations. The rain gauge and wind speed data have to be requested from Serayu Opak
River Basin Organization (BBWS Serayu Opak), Ministry of Public Works and Housing in Yogyakarta
Special Province, Indonesia (http://sda.pu.go.id/balai/bbwsserayuopak/).
Code Availability
Code is available from the author upon request.
Consent to Participate
The manuscript has been read and approved by all named authors and that there are no other persons
who satisfied the criteria for authorship but are not listed. The order of authors listed in the manuscript
has been approved by all of the authors.
Consent for Publication
The authors transfer to Springer the non-exclusive publication rights. The transfer of publication rights
covers the non-exclusive rights to reproduce and distribute the article including re-prints, translations,
photographic reproductions, electric forms (online, offline), or any other reproductions of similar nature.
Additional Information
Publisher’s note
Springer Nature remains neutral with regard to jurisdictional claims in published maps and institutional
affiliations.
Acknowledgement
The authors would like to thank to Department of Water Resources, Faculty of Geo-Information Science
and Earth Observation (ITC), University of Twente, The Netherlands for software licenses and library
access. The authors thanks to Serayu Opak River Basin Organization (BBWS Serayu Opak), Ministry of
Public Works and Housing in Yogyakarta Special Province, Indonesia to measure and provide the data of
daily rainfall from rain gauge stations and wind speed data from climatology stations. The authors
thanks to Climate Prediction Center, NOAA/ National Weather Service to provide the CMORPH data that
can be accessed by ITC ILWIS Toolbox. The author thank to NASA/Goddard Space Flight Center’s and
Page 14/26PPS to develop, compute and provide the dataset of TRMM and GPM-IMERG and it is archived at the
NASA GES DISC. The authors thank to Climate Hazard Center, University of California to provide the data
of CHIRPS. The authors would like to thank to anonymous reviewers for the help to improve this
manuscript.
References
Aksu, H., & Akgül, M.A. (2020). Performance evaluation of CHIRPS satellite precipitation estimates over
Turkey. Theoretical and Applied Climatology, 142, 71-84
Andersen, J., Refsgaard, J.C., & Jensen, K.H. (2001). Distributed hydrological modelling of the Senegal
River Basin — model construction and validation. Journal of Hydrology, 247, 200-214
Bai, P., & Liu, X. (2018). Evaluation of Five Satellite-Based Precipitation Products in Two Gauge-Scarce
Basins on the Tibetan Plateau. Remote Sensing, 10, 1316
Becker, A., & Braun, P. (1999). Disaggregation, aggregation and spatial scaling in hydrological modelling.
Journal of Hydrology, 217, 239-252
Belay, A.S., Fenta, A.A., Yenehun, A., Nigate, F., Tilahun, S.A., Moges, M.M., Dessie, M., Adgo, E., Nyssen, J.,
Chen, M., Griensven, A.V., & Walraevens, K. (2019). Evaluation and Application of Multi-Source Satellite
Rainfall Product CHIRPS to Assess Spatio-Temporal Rainfall Variability on Data-Sparse Western Margins
of Ethiopian Highlands. Remote Sensing, 11, 2688
Bell, T.L., & Kundu, P.K. (2003). Comparing satellite rainfall estimates with rain gauge data: Optimal
strategies suggested by a spectral model. Journal of Geophysical Research: Atmospheres, 108
BMKG (2010). Kondisi Cuaca Ekstrem dan Iklim Tahun 2010-2011. In. Jakarta: BMKG (Indonesia Agency
for Meteorology, Climatology, and Geophysics
Brauer, C.C., Overeem, A., Leijnse, H., & Uijlenhoet, R. (2016). The effect of differences between rainfall
measurement techniques on groundwater and discharge simulations in a lowland catchment.
Hydrological Processes, 30, 3885-3900
Chen, H., Yu, R., & Shen, Y. (2016). A new method to compare hourly rainfall between station observations
and satellite products over central-eastern China. Journal of Meteorological Research, 30, 737-757
Choubin, B., Khalighi-Sigaroodi, S., Mishra, A., Goodarzi, M., Shamshirband, S., Ghaljaee, E., & Zhang, F.
(2019). A novel bias correction framework of TMPA 3B42 daily precipitation data using similarity
matrix/homogeneous conditions. Science of The Total Environment, 694, 133680
Derin, Y., Anagnostou, E., Berne, A., Borga, M., Boudevillain, B., Buytaert, W., Chang, C.-H., Delrieu, G., Hong,
Y., Hsu, Y.C., Lavado-Casimiro, W., Manz, B., Moges, S., Nikolopoulos, E.I., Sahlu, D., Salerno, F., Rodríguez-
Page 15/26Sánchez, J.-P., Vergara, H.J., & Yilmaz, K.K. (2016). Multiregional Satellite Precipitation Products
Evaluation over Complex Terrain. Journal of Hydrometeorology, 17, 1817-1836
Ebert, E.E., Janowiak, J.E., & Kidd, C. (2007). Comparison of Near-Real-Time Precipitation Estimates from
Satellite Observations and Numerical Models. Bulletin of the American Meteorological Society, 88, 47-64
Freitas, E.d.S., Coelho, V.H.R., Xuan, Y., Melo, D.d.C.D., Gadelha, A.N., Santos, E.A., Galvão, C.d.O., Ramos
Filho, G.M., Barbosa, L.R., Huffman, G.J., Petersen, W.A., & Almeida, C.d.N. (2020). The performance of the
IMERG satellite-based product in identifying sub-daily rainfall events and their properties. Journal of
Hydrology, 589, 125128
Funk, C., Peterson, P., Landsfeld, M., Pedreros, D., Verdin, J., Shukla, S., Husak, G., Rowland, J., Harrison, L.,
Hoell, A., & Michaelsen, J. (2015). The climate hazards infrared precipitation with stations—a new
environmental record for monitoring extremes. Scientific Data, 2, 150066
Funk, C.C., Peterson, P.J., Landsfeld, M.F., Pedreros, D.H., Verdin, J.P., Rowland, J.D., Romero, B.E., Husak,
G.J., Michaelsen, J.C., & Verdin, A.P. (2014). A quasi-global precipitation time series for drought
monitoring. In, Data Series (p. 12). Reston, VA
Guo, H., Chen, S., Bao, A., Hu, J., Gebregiorgis, A.S., Xue, X., & Zhang, X. (2015). Inter-Comparison of High-
Resolution Satellite Precipitation Products over Central Asia. Remote Sensing, 7, 7181-7211
Gupta, V., Jain, M.K., Singh, P.K., & Singh, V. (2020). An assessment of global satellite-based precipitation
datasets in capturing precipitation extremes: A comparison with observed precipitation dataset in India.
International Journal of Climatology, 40, 3667-3688
Habib, E., Haile, A.T., Sazib, N., Zhang, Y., & Rientjes, T. (2014). Effect of Bias Correction of Satellite-
Rainfall Estimates on Runoff Simulations at the Source of the Upper Blue Nile. Remote Sensing, 6, 6688-
6708
He, Z., Yang, L., Tian, F., Ni, G., Hou, A., & Lu, H. (2017). Intercomparisons of Rainfall Estimates from
TRMM and GPM Multisatellite Products over the Upper Mekong River Basin. Journal of
Hydrometeorology, 18, 413-430
Hou, A.Y., Kakar, R.K., Neeck, S., Azarbarzin, A.A., Kummerow, C.D., Kojima, M., Oki, R., Nakamura, K., &
Iguchi, T. (2014). The Global Precipitation Measurement Mission. Bulletin of the American Meteorological
Society, 95, 701-722
Huffman, G.J., E.F., S., D.T., B., E.J., N., & Jackson, T. (2019). GPM IMERG Final Precipitation L3 1 day 0.1
degree x 0.1 degree V06. In A. Savtchenko, Greenbelt, MD, & G.E.S.D.a.I.S.C.G. DISC) (Eds.)
Janowiak, J.E., Kousky, V.E., & Joyce, R.J. (2005). Diurnal cycle of precipitation determined from the
CMORPH high spatial and temporal resolution global precipitation analyses. Journal of Geophysical
Research: Atmospheres, 110
Page 16/26Joyce, R., Janowiak, J., Arkin, P., & Xie, P. (2004). CMORPH: A Method That Produces Global Precipitation
Estimates From Passive Microwave and Infrared Data at High Spatial and Temporal Resolution. Journal
of Hydrometeorology - J HYDROMETEOROL, 5
Joyce, R.J., Xie, P., Yarosh, Y., Janowiak, J.E., & Arkin, P.A. (2010). CMORPH: A “Morphing” Approach for
High Resolution Precipitation Product Generation. In M. Gebremichael, & F. Hossain (Eds.), Satellite
Rainfall Applications for Surface Hydrology (pp. 23-37). Dordrecht: Springer Netherlands
Kidd, C., Bauer, P., Turk, J., Huffman, G.J., Joyce, R., Hsu, K.-L., & Braithwaite, D. (2012). Intercomparison of
High-Resolution Precipitation Products over Northwest Europe. Journal of Hydrometeorology, 13, 67-83
Kidd, C., & Levizzani, V. (2011). Status of satellite precipitation retrievals. Hydrol. Earth Syst. Sci., 15, 1109-
1116
Kidd, C., & McGregor, G. (2007). Observation and characterisation of rainfall over Hawaii and surrounding
region from the Tropical Rainfall Measuring Mission. International Journal of Climatology, 27, 541-553
Liu, J., Shangguan, D., Liu, S., Ding, Y., Wang, S., & Wang, X. (2019). Evaluation and comparison of
CHIRPS and MSWEP daily-precipitation products in the Qinghai-Tibet Plateau during the period of 1981–
2015. Atmospheric Research, 230, 104634
Luo, X., Wu, W., He, D., Li, Y., & Ji, X. (2019). Hydrological Simulation Using TRMM and CHIRPS
Precipitation Estimates in the Lower Lancang-Mekong River Basin. Chinese Geographical Science, 29, 13-
25
Ma, Q., Xiong, L., Xia, J., Xiong, B., Yang, H., & Xu, C.-Y. (2019). A Censored Shifted Mixture Distribution
Mapping Method to Correct the Bias of Daily IMERG Satellite Precipitation Estimates. Remote Sensing,
11, 1345
Maathuis, B., Mannaerts, C., Schouwenburg, M., Retsios, B., Lemmens, R., & Nkepu, M.R. (2014). In Situ
and Online Data Toolbox Installation, Configuration and User Guide. In. Enschede: Faculty of Geo-
Information Science and Earth Observation, University of Twente
Mandapaka, P.V., & Qin, X. (2013). Analysis and Characterization of Probability Distribution and Small-
Scale Spatial Variability of Rainfall in Singapore Using a Dense Gauge Network. Journal of Applied
Meteorology and Climatology, 52, 2781-2796
McCollum, J.R., Gruber, A., & Ba, M.B. (2000). Discrepancy between Gauges and Satellite Estimates of
Rainfall in Equatorial Africa. Journal of Applied Meteorology, 39, 666-679
Michaelides, S., Levizzani, V., Anagnostou, E., Bauer, P., Kasparis, T., & Lane, J.E. (2009). Precipitation:
Measurement, remote sensing, climatology and modeling. Atmospheric Research, 94, 512-533
Page 17/26O, S., & Kirstetter, P.-E. (2018). Evaluation of diurnal variation of GPM IMERG-derived summer precipitation
over the contiguous US using MRMS data. Quarterly Journal of the Royal Meteorological Society, 144,
270-281
Park, S., Berenguer, M., & Sempere-Torres, D. (2019). Long-term analysis of gauge-adjusted radar rainfall
accumulations at European scale. Journal of Hydrology, 573, 768-777
Pfeifroth, U., Trentmann, J., Fink, A.H., & Ahrens, B. (2015). Evaluating Satellite-Based Diurnal Cycles of
Precipitation in the African Tropics. Journal of Applied Meteorology and Climatology, 55, 23-39
Rahmawati, N. (2020). Space-time variogram for daily rainfall estimates using rain gauges and satellite
data in mountainous tropical Island of Bali, Indonesia (Preliminary Study). Journal of Hydrology, 590,
125177
Rahmawati, N., & Lubczynski, M.W. (2018). Validation of satellite daily rainfall estimates in complex
terrain of Bali Island, Indonesia. Theoretical and Applied Climatology, 134, 513-532
Rozante, J.R., Vila, D.A., Barboza Chiquetto, J., Fernandes, A.D.A., & Souza Alvim, D. (2018). Evaluation of
TRMM/GPM Blended Daily Products over Brazil. Remote Sensing, 10, 882
Sacré Regis M., D., Mouhamed, L., Kouakou, K., Adeline, B., Arona, D., Houebagnon Saint. J., C., Koffi
Claude A., K., Talnan Jean H., C., Salomon, O., & Issiaka, S. (2020). Using the CHIRPS Dataset to
Investigate Historical Changes in Precipitation Extremes in West Africa. Climate, 8, 84
Scheel, M.L.M., Rohrer, M., Huggel, C., Santos Villar, D., Silvestre, E., & Huffman, G.J. (2011). Evaluation of
TRMM Multi-satellite Precipitation Analysis (TMPA) performance in the Central Andes region and its
dependency on spatial and temporal resolution. Hydrol. Earth Syst. Sci., 15, 2649-2663
Skofronick-Jackson, G., Kirschbaum, D., Petersen, W., Huffman, G., Kidd, C., Stocker, E., & Kakar, R. (2018).
The Global Precipitation Measurement (GPM) mission's scientific achievements and societal
contributions: reviewing four years of advanced rain and snow observations. Quarterly Journal of the
Royal Meteorological Society, 144, 27-48
Sorooshian, S., AghaKouchak, A., Arkin, P., Eylander, J., Foufoula-Georgiou, E., Harmon, R., Hendrickx,
J.M.H., Imam, B., Kuligowski, R., Skahill, B., & Skofronick-Jackson, G. (2011). Advanced Concepts on
Remote Sensing of Precipitation at Multiple Scales. Bulletin of the American Meteorological Society, 92,
1353-1357
Stephens, G.L., & Kummerow, C.D. (2007). The Remote Sensing of Clouds and Precipitation from Space: A
Review. Journal of the Atmospheric Sciences, 64, 3742-3765
Tapiador, F.J., Turk, F.J., Petersen, W., Hou, A.Y., García-Ortega, E., Machado, L.A.T., Angelis, C.F., Salio, P.,
Kidd, C., Huffman, G.J., & de Castro, M. (2012). Global precipitation measurement: Methods, datasets and
applications. Atmospheric Research, 104-105, 70-97
Page 18/26Wu, W., Li, Y., Luo, X., Zhang, Y., Ji, X., & Li, X. (2019). Performance evaluation of the CHIRPS precipitation
dataset and its utility in drought monitoring over Yunnan Province, China. Geomatics, Natural Hazards
and Risk, 10, 2145-2162
Xie, P., Joyce, R., Wu, S., Yoo, S.-H., Yarosh, Y., Sun, F., & Lin, R. (2017). Reprocessed, Bias-Corrected
CMORPH Global High-Resolution Precipitation Estimates from 1998. Journal of Hydrometeorology, 18,
1617-1641
Zhang, X., & Anagnostou, E.N. (2019). Evaluation of Numerical Weather Model–Based Satellite
Precipitation Adjustment in Tropical Mountainous Regions. Journal of Hydrometeorology, 20, 431-445
Tables
Due to technical limitations the Tables are available as downloads in the Supplementary Files.
Figures
Figure 1
Page 19/26The boundaries and the location of 13 rain gauges for validation of satellite-based rainfall in Merapi
Aquifer System (MAS)
Figure 2
The boxplot of daily Mean Error (ME) of 4 satellite-based rainfall against 5 selected rain gauges for
rainfall intensity 0 mm·day-1 (no rain) from 1 January 2008 to December 2012
Figure 3
Page 20/26The boxplot of daily Mean Error (ME) of 4 satellite-based rainfall against 5 selected rain gauges for light
rain from 1 January 2008 to December 2012
Figure 4
The boxplot of daily Mean Error (ME) of 4 satellite-based rainfall against 5 selected rain gauges for
moderate rain from 1 January 2008 to December 2012
Figure 5
Page 21/26The boxplot of daily Mean Error (ME) of 4 satellite-based rainfall against 5 selected rain gauges for heavy
to extreme rain from 1 January 2008 to December 2012
Figure 6
The radar chart of (FA and CN) of 4 satellite-based rainfall against 5 selected rain gauges for rainfall
intensity 0 mm·day-1 (no rain) from 1 January 2008 to December 2012. The scale of radar chart is similar
only for each season depending on minimum and maximum frequency values in each season
Page 22/26Figure 7
The radar chart of (H and M) of 4 satellite-based rainfall against 5 selected rain gauges for light rain from
1 January 2008 to December 2012. The scale of radar chart is similar only for each season depending on
minimum and maximum frequency values in each season
Figure 8
The radar chart of (H and M) of 4 satellite-based rainfall against 5 selected rain gauges for moderate rain
from 1 January 2008 to December 2012. The scale of radar chart is similar only for each season
depending on minimum and maximum frequency values in each season
Page 23/26Figure 9
The radar chart of (H and M) of 4 satellite-based rainfall against 5 selected rain gauges for heavy to
extreme rain from 1 January 2008 to December 2012. The scale of radar chart is similar only for each
season depending on minimum and maximum frequency values in each season
Page 24/26Figure 10
The spatial maps of radar chart of (Rs or TB) of 4 satellite-based rainfall for no rain and the spatial maps
of radar chart of (MB and AHB) of 4 satellite-based rainfall for light to extreme rain against 5 selected
rain gauges from 1 January 2008 to December 2012
Supplementary Files
This is a list of supplementary files associated with this preprint. Click to download.
Table1.xlsx
Table2.xlsx
Table3.xlsx
Table4.xlsx
Table5.xlsx
Table6.xlsx
Page 25/26suplementarymaterial.docx
Page 26/26You can also read