Performance update - ICICI Prudential Life Insurance

Page created by Stacy Brown
 
CONTINUE READING
Performance update - ICICI Prudential Life Insurance
Performance update

May 07, 2021
Performance update - ICICI Prudential Life Insurance
April 2021 update
Performance update - ICICI Prudential Life Insurance
Premium growth

 ` billion                                    Q4-FY2021                          FY2021     April 2021

 New business premium                                  51.33                      130.32         6.43
 YoY growth                                          22.9%                          5.5%      151.1%

 New business sum assured                         2,051.84                     6,166.84        707.59
 YoY growth                                          22.1%                          8.0%      101.1%

 APE1                                                  25.09                        64.62        3.57
 YoY growth                                          27.1%                      (12.5%)        87.9%

 RWRP2                                                 21.49                        54.54        2.56
 YoY growth                                          27.3%                      (17.9%)        65.0%

                            1. Annualized premium equivalent
                            2. Retail weighted received premium
                            Components may not add up to the totals due to rounding off                  3
Performance update - ICICI Prudential Life Insurance
Agenda

• Company strategy and performance
• Opportunity
• Industry overview
Performance update - ICICI Prudential Life Insurance
Agenda

• Company strategy and performance
• Opportunity
• Industry overview
Performance update - ICICI Prudential Life Insurance
Year at a glance
              Mar 2020               May 2020                           Sep 2020                      Dec 2020               Mar 2021
               Lockdown due to Covid-19         First phase of unlock                     Recovering to pre Covid levels

              • Economic activities      • Gradual recovery in               • GDP growth of 0.4% (Q3) • GDP growth expected to
Environment

                disrupted; GDP             economic activities; GDP          • Stock market crossed all   be better than Q3
                contracted by 24.4% (Q1)   contracted by 7.3% (Q2)             time high in Nov 2020    • Vaccination drive initiated
              • Stock market declined    • ~100% branches open                                          • Rise in new Covid-19
                23% in March                                                                              infections seen recently

              • Shift from ULIPs to traditional • Reluctance for longer      • Renewed interest in ULIP • Capital gains tax on
Customer

              • Demand for protection             term savings                 in Dec 2020                higher ticket ULIPs

              • Greater digital adoption   • Increased branch walk-ins
              • APE declined 44% (Q1)      • APE declined 23% (Q2)      • 83 new partners in 9M     • Deferred annuity &
Outcome

                                           • Supply side constraints in • 13,179 new agents in 9M     product with income
                                             protection due to          • Channels other than ICICI   benefit option introduced
                                             pandemic                     Bank grew 8.7% YoY (Q3) • APE grew by 27% in Q4
                                 Focus on resilience                               Build for growth              Take momentum ahead

                                                                                                                                   6
Performance update - ICICI Prudential Life Insurance
Key strategic elements

                               Protection

    Customer                                                Aspiration to
     centricity     Premium                                  double the
                              VNB Growth     Persistency
  continues to be    Growth                                FY2019 VNB in
    at the core                                              3 - 4 years

                              Productivity

                                                                            7
Performance update - ICICI Prudential Life Insurance
Customer centricity

       94.0%   13th month persistency1 for non-linked savings

        46     Number of grievances per 10,000 new business policies (retail)

       97.9%   Claim settlement ratio2

       100%    Eligible claims3 settled within the one day promise

        1.4    Average claims settlement time4

                         Figures are for financial year ended March 2021
                         1. As per IRDAI circular dated January 23, 2014; including SP
                         2. Individual death claims
                         3. Claims with prescribed criteria                                                        8
                         4. Average turnaround time for non-investigated claims from receipt of last requirement
Performance update - ICICI Prudential Life Insurance
• Deepen penetration in under-served
Premium: Back to growth                                        customer segments
                                            Premium          • Enhance current distribution
                                             growth          • Create new distribution
                                                             • Augment capability in Health and Protection
                                                             • Increase focus on Pension and Annuity

  ` billion                                   FY2020 9M-FY2021                 Q4-FY2021         FY2021

  New business premium (NBP)1                  123.48                 78.99        51.33          130.32
  YoY growth                                    20.4%               (3.3%)        22.9%             5.5%
  APE2                                           73.81                39.54        25.09            64.62
  YoY growth                                                      (26.9%)         27.1%          (12.5%)

                          27% growth in APE for Q4-FY2021

                            1.   New business premium (As reported to IRDAI)
                            2.   Annualized premium equivalent
                                                                                                             9
Performance update - ICICI Prudential Life Insurance
Premium diversification: Product and Distribution
                Product mix APE                                             Distribution mix APE

       FY2018                          FY2021                      FY2018                              FY2021

                                                                       5%                                  11%

                                                31%
                                                                               25%              31%
                11%                                                                                               24%
 82%                                                        47%
                               48%
                6%
                     1%                                                       14%
                                                16%
                                                                                                 12%            13%
                                                                      3% 6%
                                           5%                                                           9%

                                                                     Banca-ICICI Bank                  Banca-Other Banks
            Linked        Non-linked   Protection   Group            Agency                            Direct
                                                                     Partnership Distribution          Group

            Diversified product mix                               Distribution mix diversified further

                                                                                                                      10
Protection: Increasing mix                       Protection         Continue to grow both retail and group lines of
                                                   focus            business

                                                                                          Protection APE
 ` billion                   FY2020          FY2021             ` billion
                                                                                                                   3.44
                                                                                          2.33        2.56
                                                                            2.14
 Protection APE               11.16             10.46
                                                                     Q1-FY2021          Q2-FY2021   Q3-FY2021   Q4-FY2021

 Protection mix              15.1%             16.2%                               Sum assured market share1 (%)
                                                                                         12.5%       13.0%       13.0%
                                                                       10.7%

 Sum assured market share1   11.8%            13.0%2

                                                                       Jun-20            Sep-20      Dec-20      Feb-21

 • Despite supply side challenges, protection mix increased further
 • Continued private market leadership based on new business sum assured
    • Market share increased from 11.8% in FY2020 to 13.0% in FY2021
                               1.   New business sum assured market share for the period ending
                               2.   11M-FY2021
                                                                                                                            11
Persistency improvement                            Persistency          Improve persistency across all cohorts

  Persistency1                             11M-FY2020                      11M-FY2021               Y-o-Y

  13th month                                       83.2%                             84.8%         160 bps
  61st month                                       56.0%                             58.3%         230 bps
                                                     11M-FY2021                 94.0%

                                                                                               86.6%
                 13thmonth  persistency2                 84.4%
                 across product categories

                                                         Linked              Non- linked     Protection

          Continued improvement in persistency; substantial progress year on year

                                  Computed as per IRDAI circular dated January 23, 2014
                                  1. Retail excluding SP
                                  2. Retail including SP
                                                                                                                 12
Productivity improvement                     Productivity
                                                                  Continue to leverage technology for process re-
                                                                  engineering and to drive productivity

  ` billion                                                                    FY2020                     FY2021

  Cost/TWRP1                                                                     15.9%                    14.8%

  Cost/TWRP (savings LOB)                                                        10.4%                     9.6%

                            Improvement in cost ratios

                            1.   Total cost including commission/(Total premium- 90% of single premium)

                                                                                                                    13
Value of New Business (VNB)
                                                                                 VNB contribution*

                                                                      FY2019                          FY2021

` billion              FY2020         FY2021
                                                                                                   3.62
                                                                4.17                             (22.3%)
Value of New
                         16.05           16.21                (31.4%)
Business (VNB)
                                                                                 7.89                           8.66
                                                                               (59.4%)           3.93         (53.4%)
                                                                 1.22
VNB margin              21.7%           25.1%                                                  (24.2%)
                                                                (9.2%)

                                                              Protection        Savings: Non-linked      Savings: Linked

Diversification of sources of profit; non-linked savings contribution increased to 24% in FY2021

                                 *Figures in brackets represent share of VNB
                                 Total may not add up due to rounding off                                               14
Resilient Balance Sheet
              High quality assets                                                   Liability profile
                                                           •    83% of liabilities largely pass on the market
 •   96.8% of fixed income in sovereign or
                                                                performance to customers
     AAA; 0.5% of fixed income below AA
                                                           •    Non par guaranteed return book: 1.1% of
 •   Zero NPA since inception
                                                                liabilities

                Insurance risks                                                Strong solvency ratio
 •   Mortality experience: Additional reserve of
     ` 3.33 billion held for potential Covid-19
     claims                                                •    Solvency ratio of 216.8% at March 31, 2021
 •   Operating variances on other parameters
     continue to be positive

                                             Figures are for financial year ended March 2021
                                                                                                            15
Way forward
                       Aspire to double the FY2019 VNB by FY2023
                                                                             VNB ` billion                                       26.50
                                9M-          Q4-
` billion         FY2020                                    FY2021
                             FY2021       FY2021
                                                                                                         16.21
Value of New                                                                                 16.05
                    16.05      10.30           5.91            16.21             13.28
Business (VNB)1

VNB growth         20.9%      (9.3%)        25.7%              1.0%

                                                                                FY2019      FY2020      FY2021      FY2022      FY2023

•   Premium growth: Diversified product & distribution mix to aid higher growth
•   Protection: Short term headwinds on retail, expect to maintain the sequential momentum and
    increase attachment of riders
•   Persistency: Continued improvement to aid product margins
•   Productivity: Target operating leverage with growth in premium

                                   1.   For full year, based on actual cost; during the year, based on management forecast of full year
                                        cost
                                                                                                                                          16
Distribution approach
  Objective                 Long term sustainable growth

  Approach                 Broadening our customer reach
                          Product proposition

                              Position
              Customer       for growth             Distribution
              retention                              build-up

                                                                   17
Distribution approach
  Objective                 Long term sustainable growth

  Approach                 Broadening our customer reach
                          Product proposition

                              Position
              Customer       for growth             Distribution
              retention                              build-up

                                                                   18
Products available across all categories

                       Non-linked                              Savings                          Linked

       Savings with           Guaranteed savings;                            ULIP: Suite of funds        ULIP: with capital
   guarantee and equity       Immediate/ Deferred                            for Equity and Debt            guarantee
       participation               Annuity

                         Retail                              Protection                         Group

      Pure term with               Critical illness,                         Pure term, Micro insurance, Credit insurance,
      accident cover              Disease specific                                          Critical illness

                                                       Products introduced
                                                       in FY2021
                                                                                                                              19
Performance across segments: Savings
                Savings segment APE                                                      Linked (y-o-y growth)

` billion             FY2020         Q4-FY2021       FY2021                                                         11.0%

Linked                  47.72              11.85        30.90
                                                                             Q1-FY2021   Q2-FY2021    Q3-FY2021    Q4-FY2021
                                                                                                                    Q4-FY2021
Non-linked              11.41               7.74        17.79
                                                                                                      -38.8%
Annuity                     1.05            1.07           2.29                           -45.0%
                                                                                -65.7%
Group                       2.47            1.00           3.18
Total savings APE       62.65              21.65        54.16

               Non-linked (y-o-y growth)                                                 Annuity (y-o-y growth)
                                                                                                                    214.7%
                                                   105.9%
                                                                                                          126.1%
                    42.9%                                                                  71.4%
      14.7%                        30.0%
                                                                              10.0%

   Q1-FY2021   Q2-FY2021       Q3-FY2021       Q4-FY2021                     Q1-FY2021   Q2-FY2021    Q3-FY2021    Q4-FY2021
                                                                                                                   Q4-FY2021

• Q4-FY2021: Strong growth across product segments; linked turned positive year on year
• FY2021: Annuity and non-linked savings grew by 120% and 56% respectively
                                              Total may not add up due to rounding off

                                                                                                                                20
Pension and Annuity
                                             A comprehensive pension provider

                           Annuity                                                         Pension fund management (AUM)
                                                                               ` billion
Annuity mix1 3.4%          6.6%          8.4%           17.3%                                                          75.59
            Annuity new business received premium (` billion)
                                                        22.92
                                                                                                              43.53
                                                                                                      34.76
                                         10.43                                        23.26
                           6.85
             3.11

           FY2018        FY2019         FY2020         FY2021                        FY2018          FY2019   FY2020   FY2021

   • 120% growth in FY2021                                                      • 74% growth in AUM during FY2021
   • Premium over 7x in three years                                             • AUM over 3x in three years

                Significant focus on driving synergy between ICICI Pru Life and ICICI Pru PFM

                                                 1.   % of new business received premium as per financials
                                                                                                                                21
Protection business
   Retail and Group Protection APE (FY2021)                          Protection split based on APE* (FY2021)
` billion                                                        ` billion
                                          3.44
                                                                                              1.80
                                                                                            (17.2%)
                             2.56
                   2.33                   1.83                                        0.61
            2.14
                                                                                     (5.8%)
                   0.95      1.22                                                                                5.72
            0.75
                                                                                       2.34                    (54.6%)
                                                                                     (22.3%)

            1.39                          1.61
                   1.38      1.34

            Q1     Q2         Q3           Q4
                                                                             Retail protection          Group Term
                   Retail   Group                                            Credit life – ICICI Bank   Credit life - Other
   Steady growth Q-o-Q despite supply side
                                                                    Diversified mix within protection segment
                 challenges
                                    * Figures in brackets represent mix of protection APE
                                    Total may not add up due to rounding off
                                                                                                                              22
Distribution approach
  Objective               Long term sustainable growth

  Approach                Broadening our customer reach

                            Position
              Customer     for growth              Distribution
              retention                             build-up

                                                                  23
Enhancing distribution
                                                Strategy: Create depth and add width
                                                • ~600 partnerships
           Strategy: Build profitability                                                                Strategy: Digital focused upsell
                                                • Protection 14% and non-linked savings
           • 23 bank partnerships                 71% in FY2021                                         campaigns
           • Protection and Annuity mix                                                                 • Analytics driven upsell channel
             further increased from 4.3% in                                                             • Diversified product mix with 10%
             FY2020 to 15% in FY2021                           Partnership                                protection and 21% non-linked
                                                               Distribution                               savings

Strategy: Invest and grow
 • 20,298 agents recruited                                                                                          Strategy: Partner with non-
   during FY2021                                                                                                    traditional distributors

                                                                                                     Emerging eco
 • Diversified product mix:                                                                                         • Tie-up with small finance

                                                                                                       systems
                                    Agency

   Linked 33%; Non-linked                                                                                             banks, wallets, payment
   67%                                                                                                                banks, aggregators etc.
                                                            Distribution                                            • Product customization

                              ~600 partnerships including 23 banks; > 185,000 advisors

                                              Figures mentioned are for FY2021
                                              * Direct comprises sales through own website and employees on roll                                  24
Performance across distribution channels (1/2)
                                                                                  Bancassurance-ICICI Bank (y-o-y growth)
` billion                  Q4-FY2021          FY2021
                                                                                                                                                50.4%

Bancassurance                  10.68             27.34

Agency                          5.86             15.39                Q1-FY2021 Q2-FY2021 Q3-FY2021             Jan-21          Feb-21          Mar-21
                                                                                                                -33.5%          -16.2%
                                                                                         -43.0%
                                                                             -59.4%                  -45.5%
Direct                          3.11               8.10
                                                                                         Bancassurance-Other Banks APE
Partnership distribution        2.62               5.87
                                                                      ` billion                        FY2020   FY2021
                                                                                                                                                4.11
Group                           2.83               7.93
                                                                                                                         1.38            1.43
                                                                                                  0.90 1.17
Total APE                      25.09             64.62                     0.80
                                                                                  0.46                           0.66

                                                                              Q1                    Q2              Q3                      Q4

                              New bank partnerships gaining momentum

                                       Total may not add up due to rounding off

                                                                                                                                                        25
Performance across distribution channels (2/2)
      Agency (y-o-y growth)                                                          Partnership distribution (y-o-y growth)

                                                                                                                     62.7%
                                36.9%

 Q1-FY2021 Q2-FY2021 Q3-FY2021 Q4-FY2021
                               Q4-FY2021           Direct (y-o-y growth)
                                                                                      Q1-FY2021 Q2-FY2021 Q3-FY2021 Q4-FY2021
                         -6.5%
     -34.7%    -11.7%                                                      21.0%                  -9.4%    -12.3%
                                                                                         -29.0%

                                           Q1-FY2021 Q2-FY2021 Q3-FY2021 Q4-FY2021
                                                                   -7.5%

                                                        -27.9%

                                              -46.3%

  Sequential momentum across channels                              Strong year on year growth in Q4-FY2021

                                                                                                                        26
Distribution approach
  Objective               Long term sustainable growth

  Approach                Broadening our customer reach

                            Position
              Customer     for growth
              retention

                                                          27
Persistency
             Retail excluding single premium                                    Retail including single premium
  Month                   11M-FY2020            11M-FY2021          Month                      11M-FY2020        11M-FY2021
  13th month                  83.2%                  84.8%          13th month                          85.3%              86.9%
  25th month                  75.1%                  73.6%          25th month                          77.4%              76.8%
  37th month                  66.7%                  66.3%          37th month                          69.0%              69.3%
  49th month                  64.6%                  63.0%          49th month                          66.4%              65.5%
  61st month                  56.0%                  58.3%          61st month                          57.4%           60.2%

  13th month persistency1                                            13th month persistency2 across product categories
                                                                                                     94.0%
                                                                        11M-FY2021
                                                    84.8%                                                          86.6%
                                                                             84.4%
     83.2%
                                       82.7%
                 81.8%       82.1%

    Mar-20       Jun-20      Sep-20    Dec-20      Mar-21                   Linked                 Non- linked   Protection
                              Stable persistency across cohorts and product segments
                                           Computed as per IRDAI circular dated January 23, 2014
                                           1. Retail excluding SP
                                           2. Retail including SP                                                                  28
Distribution approach
  Objective             Long term sustainable growth

  Approach              Broadening our customer reach

                           Position
                          for growth

                                                        29
Position for growth
                    RWRP1 (y-o-y growth)                                                    Retail NBP3 (y-o-y growth)
                                                                                                                                   121.0%
                                                         98.1%

                                                                                                                         37.0%
                                                                                                            18.4%
                                          6.3%

 Q1-FY2021 Q2-FY2021 Q3-FY2021   Jan-21     Feb-21      Mar-21              Q1-FY2021 Q2-FY2021 Q3-FY2021    Jan-21       Feb-21   Mar-21
                        -25.5%   -7.3%
               -29.9%                                                        -40.5% -15.5%       -10.3%
     -49.4%

                   RWRP market share (%)                                                          APE2 (y-o-y growth)
                                                                                                                                     108.1%
                                                       8.3%
                        6.9%        7.3%
     6.2%

                                                                                                                 -3.0%   -2.1%

                                                                            Q1-FY2021 Q2-FY2021 Q3-FY2021    Jan-21       Feb-21   Mar-21

                                                                                          -22.9%        -18.3%
   Q1-FY2021        Q2-FY2021    Q3-FY2021          Q4-FY2021*                  -44.0%

                                                                               Strong sequential momentum; APE grew
     Significant recovery in market share
                                                                                   108% year on year in March 2021
                                                 * For January-February 2021
                                                 1. Retail weighted received premium
                                                 2. Annualized premium equivalent                                                           30
                                                 3. New business premium (As reported to IRDAI)
Financial update
Value of New Business (VNB)
                       VNB contribution*                                                    VNB margin movement

            FY2020                           FY2021                                         3.9%     (0.7%)     0.2%     25.1%
VNB                                                                            21.7%
               16.05                             16.21
` billion

                                          3.62
       4.20
                                        (22.3%)
     (26.2%)

       2.27          9.58                                  8.66
     (14.1%)       (59.7%)               3.93            (53.4%)
                                       (24.2%)

                                                                               FY2020      Business Assumption Expense   FY2021
                                                                                             mix      change   change
     Protection        Savings: Non-linked        Savings: Linked

    Non-linked savings contribution to VNB increased to 24%; also helped in expansion of VNB margin

                                             *Figures in brackets represent share of VNB
                                             Total may not add up due to rounding off                                             32
Impact of COVID-19 on mortality
                                             Covid-19 claims pattern

                                                                                            Based on Date of Death
                                                                                            Based on Date of Intimation

• Total claims on account of Covid-19 for FY2021 was ` 4.59 billion1
   • Claims net of reinsurance was ` 2.64 billion2
• Additional provision of ` 3.33 billion3 towards Covid-19, not utilised so far

                                   1.   Includes an estimate of ` 0.76 billion for micro insurance claims
                                   2.   Includes an estimate of ` 0.49 billion for micro insurance claims
                                   3.   Includes ` 0.34 billion towards claims incurred but not reported
                                                                                                                          33
Embedded Value growth1
  ` billion
                                                                                291.06

                             230.30                                              95.22

                              78.43

                                                                                195.84
                             151.87

                             Mar-20                                             Mar-21
                          Value of Inforce (VIF)             Adjusted net worth (ANW)

              VIF grew by 29% to ` 195.84 billion and EV grew by 26% to ` 291.06 billion

                                      1.   As per Indian Embedded value (IEV) method

                                                                                           34
Analysis of movement in Embedded Value (EV)
                                                                                                              25.67                    291.06
` billion                                                                                                                  0.04
                                                16.21       1.10       (2.37) 3        0.01       0.41
                          16.61      3.09
            230.30                                                                                                                      ANW
                                                                                     EVOP1 = 35.05                                      95.22
                                                                                     ROEV2 = 15.2%
             ANW
             78.43

                                                                                                                                        VIF
                                                                                                                                       195.84
             VIF
            151.87

            EV (Mar 31,   Unwind    Operating    VNB     Persistency Mortality and    Expense     Other      Economic    Net Capital   EV (Mar 31,
              2020)                Assumption             variance    morbidity       variance   variance   Assumption    Injection      2021)
                                    Changes                           variance                              Change and
                                                                                                            Investment
                                                                                                              Variance
                                                  1: EVOP is the embedded value operating profit net of tax
                                                  2: ROEV is the return on embedded value net of tax
                                                  3: Mortality variance includes the negative impact of COVID claims of ` 2.64 billion net of reinsurance
                                                  EV results prepared as per APS 10 and reviewed by Milliman Advisors LLP
                                                  Components may not add up to the total due to rounding off                                              35
Sensitivity analysis
 Scenario                                     % change in VNB           % change in EV
                                              FY2020       FY2021       FY2020      FY2021
 Increase in 100 bps in the reference rates     (2.4)            0.7      (2.5)          (2.8)
 Decrease in 100 bps in the reference rates       2.2           (1.7)      2.6            3.0
 10% increase in the discontinuance rates       (5.0)           (3.1)     (1.1)          (0.9)
 10% decrease in the discontinuance rates         5.1            3.2       1.1            1.0
 10% increase in mortality/morbidity rates      (9.5)       (10.2)        (1.6)          (1.6)
 10% decrease in mortality/morbidity rates        9.6           10.4       1.7            1.6
 10% increase in acquisition expenses          (11.6)       (10.5)         Nil            Nil
 10% decrease in acquisition expenses            11.6           10.4       Nil            Nil
 10% increase in maintenance expenses           (3.0)           (2.5)     (0.8)          (0.6)
 10% decrease in maintenance expenses             3.0            2.5       0.9            0.6
 Tax rates increased to 25%                    (11.4)       (11.1)        (5.8)          (6.2)
 10% increase in equity values                    0.7            1.3       1.8            2.9
 10% decrease in equity values                  (0.7)           (1.6)     (1.8)          (2.9)

                                                                                                 36
Financial metrics

  ` billion                                                               FY2020      FY2021

  Profit before Tax                                                          10.69      10.81

  Profit after Tax                                                           10.69       9.60

  Solvency ratio                                                            194%      216.8%

  AUM                                                                  1,529.681     2,142.181

                      40% growth in AUM during FY2021

                       1. At March 31 of respective financial years
                       Components may not add up to the totals due to rounding off
                                                                                             37
VNB growth levers update (4P’s)
  ` billion                                                FY2020                        FY2021              Growth
  Value of New Business (VNB)1                                 16.05                         16.21             1.0%
  VNB margin                                                 21.7%                          25.1%

  ` billion                                                FY2020                         FY2021             Growth
  Premium growth (APE)                                         73.81                          64.62          (12.5%)
  Protection growth (APE)                                      11.16                          10.46           (6.3%)
  Persistency (13th month)2                                 83.2%3                         84.8%3
  Persistency (61st month)2                                 56.0%3                         58.3%3
  Productivity (Cost/TWRP: Savings)4                         10.4%                            9.6%
                              1. For full year, based on actual cost
                              2. Retail excluding SP computed as per IRDA circular dated January 23, 2014
                              3. As of March of respective financial years
                              4. Total Cost including commission / (Total premium – 90% of single premium)             38
Awards and accolades: FY2021
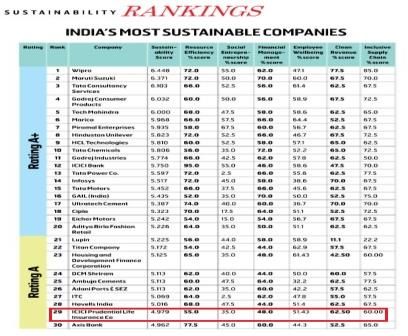
Only insurance Company to be ranked in the Top
                                                 ICICI Pru Signature - Best ULIP policy of the year        Excellence in Claims and Customer Service
  30 of India’s ‘Most Sustainable Companies’

   Sustain Labs Paris in association with BW     Business Today – Money Today Financial Awards
                Businessworld                                                                                FICCI Insurance Industry Awards 2020
                                                                     2020

                                                 Gold Award – Excellence in Financial Reporting:
Adjudged one of the Most Valuable Indian Brand                                                                        Best Contact Centre
                                                              FY20 Annual Report

     ‘BrandZ Top 75 Most Valuable Indian           Ranked at #52 worldwide by LACP* Annual
                                                                                                            Customer Fest Leadership Awards 2021
                Brands 2020’                                   Spotlight Awards

                                                  *League   of American Communications Professionals LLC
                                                                                                                                                    39
Technology @ICICI Prulife
Our digital enablers
       Marketing                            Data & Analytics                                          Pre-sales
  Hyper personalization –                 Nudge engine/ Actionable                                Collaboration platform –
  Personalized messages to handhold       insights - Data analytics based                         Online meetings, joint sales calls,
  customers throughout journey            system which suggests the best                          invite experts, share content
                                          suited action for you to achieve
  Segmented targeting –                   next goal                                               24x7 cognitive bots –
  Reaching the customer by mapping                                                                24x7 query resolution using chat bots
  their interests/affinities              Smart solutions –                                       viz. Chat Buddy, PSF Guru, Tara
                                          Pre-approved personalized best
  Interactive banners –                   offers to customer for instant                          Lead Management System –
  Banners with built-in calculators for   issuance and persistency backed by                      Robust LMS enhanced with voice
  instant and customized quotes           data                                                    capability and geographical tagging

  Search engine optimization –            Modular data integration approach                       Knowledge repository –
  Use of Machine learning to rank ICICI   – to meet partner requirements                          On-the-go e-learning modules via
  Pru higher on customers search                                                                  exclusive Learners’ Box app
                                          On premise data lake
  Mobile first –                                                                                  My Coach –
  All our content and journeys are        Use of AI & ML to analyze                               AI based platform for video based
  designed for mobile devices             structured & unstructured data                          library creation for sales pitches

                                           AI : Artificial Intelligence | ML : Machine Learning

                                             Being future ready                                                                           41
Our digital enablers
       Onboarding &
       issuance                          Customer service                                 Partner integration
  Term by invite - Pre approved      24x7 chat/voice assistants                       Partner integration portal
  offerings for partners with zero              LiGo chat bot                        Easy UI – pre-coded premium
  documents or medical                          WhatsApp bot                            quotation pages
                                                Voice bot on IVR                     Data pre population
  Digital journey                               E-mail bot                           No KYC document, digital payment
  End to end digital onboarding                Humanoid bot                          with SI and digital consent
  3-click PASA onboarding
  Smart doc upload
                                     Digital customer service                        Video based Pre -issuance
  Instant OCR                       Omni-channel experience                        verification on WhatsApp
  Video risk verification           Mobile application for customer service
  Tele & video underwriting         Digital life verification
                                                                                       Instant Certificate of
  RPA enabled issuance                                                                  issuance
                                     Flexible premium payment
  Leveraging third party                                                               Instant refund into customer
                                     options                                              account, in case of cancellation
  Data points & data pre-pop
  ICICI Bank                        Artificial intelligence for pre claim
                        CRIF
  Experian                          assessment and claims processing
                        CIBIL

                                     PASA : Pre Approved Sum Assured | OCR: Optical Character Recognition | KYC : Know Your Customer
                                     RPA : Robotic processing automation | IVR : Interactive Voice Response

                                         Being future ready                                                                       42
Empowering stakeholders
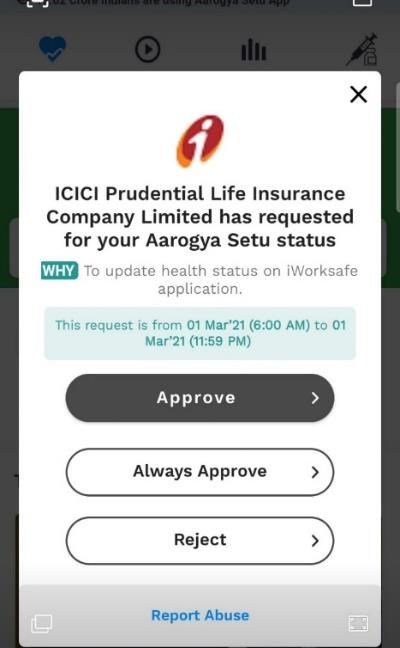
Contactless interactions, interfaces
    Covid companion app                            Collaboration platforms
    Fetches health status from Arogya setu

                                               Share                                    Payment
                                              screen                                    options

                                                                                        Share
                                                 Add                                    documents
                                               experts

                                              Online meetings (upto 300 users) | Video/Audio call
                                                   | Joint sales call | Share content Chat |
                                               Invite external guests, experts | Access previous
                                                       meeting notes | Record sessions

                                                                                              43
ESG
         Environmental
         Environmental

Social
Social

          Governance
           Governance
COVID-19 response: Employee well-being is foremost priority
         Health, Safety and Well-being                                                            Enabling work from home
 Workplace safety                                                                       Accessibility
 •     Sanitization, UV air purifiers, HEPA filters,                                    •       Migration of applications to internet
       rostered attendance, masking & social
       distancing protocols, Plexiglass shields
   ·
 Health tracking & contact tracing                                                          Tech support
 •    IWorkSafe App, daily health update,                                                   •    Remote support
      buzzer for social distancing                                                          •    Reimbursement of Wi-Fi charges

 Employee Assistance                                                                        Virtual collaboration
 •     Doctor tele-consultation                                                             •    Virtual meeting and collaboration
 •     Testing, Home Care                                                                        tools
 •     COVID-19 leave
                                                                                        Office equipment support
 •     Vaccination facilitation
                                                                                        •       Tabs, laptops, dongles
 •     Mental health tele-counselling
                                                                                        •       Provision of ergonomic chairs
     Voice of Employee score1
     • Adequate measures to ensure safety & well being of employees during COVID-19: 93%
     • Keeping employees informed & connected through learning initiatives and engagement activities: 94%

                                                1. 95% response rate, top 2 box score
                                                                                                                                        45
Environmental initiatives
                                Preserving ‘Mother Earth’ for future generations

            Replace                                  Reduce                                        Reuse & Recycle

• End to end digital solutions for     • Move towards 5 star rated ACs                      • Sewage treatment plant and
  our business activities              • VRF/Inverter AC (27% of usage)                       wet waste conversion into
• 86% shareholders                     • LED technology: 77% of branch                        manure at head office
  communicated digitally                 lighting, 76% of backlit signage                   • No single use plastic
• Video conferencing facility at 94    • Managed print services &                           • E-waste disposal through
  locations                              stationery tracking                                  government certified vendors
• Live plants to improve air           • Employee awareness drive                           • Reusable glasses & plates
  quality: ~42% office space           • Sensor based taps & urinals
                                       • Periodic office equipment
                                         maintenance

                                               VRF: Variable Refrigerant Flow
                                               Figures are for financial year ended March 2021                             46
Social initiatives
                                    Building communities and giving back to society

      Business itself is social in nature: Serving long term financial and protection needs of the society

        Customer centricity                          Commitment to employees                             Commitment to Community

•   Products across life stage needs;        •    One million digital learning hours;                •   46 mn lives covered through micro
    multi- channel reach                          13,000+ employee certified; 85% of                     insurance and PMJJBY
•   Continued focus on right selling,             SMT served >10 yrs                                 •   ICICI Academy for Skills: Trained
    product suitability & digital adoption   •    Robust policy & framework for                          159,000 till date
                                                  grievance redressal
•   COVID-19: Un-interrupted 24x7                                                                    •   Responsible investing: ESG
    service through digital enablers,        •    Policies on equal opportunity, D&I and
                                                                                                         framework and Stewardship policy
    >90% self-help usage                          POSH
                                             •    Employee health & safety and                       •   COVID-19: Provision of ventilators &
•   Consistent risk-adjusted returns                                                                     consumables
                                                  psychological well-being
•   Robust policy & framework for
                                             •    Enabling WFH, flexible policies                    •   PM CARES fund: Contribution of `
    grievance redressal
                                             •    Multi-pronged employee engagement                      126.5 mn, includes one month salary
•   13th month persistency: 86.9%                                                                        contribution by management
                                             •    VoE survey; 90%+ score on
•   Claim settlement ratio: 97.9%                 alignment, morale & support                            committee members
                                                 Figures are for financial year ended March 2021
                                                 SMT: Senior Management Team; D&I: Diversity & Inclusion; POSH: Prevention Of Sexual Harassment of
                                                 women at workplace; WFH: Work From Home; VoE: Voice of Employee
                                                 PMJJBY: Pradhan Mantri Jeevan Jyoti Beema Yojana                                                    47
                                                 1. 95% response rate, top 2 box score is 90%+
Governance
     Transparency in functioning with separation of supervision from execution

     Awarded for Corporate Governance; scorecard by IFC, BSE limited and IiAS

01      Supervisory structure          02 Compliance, Risk & IA                             03          Ethical practices
 •    Diverse Board composition          •   Compliance policy: Quarterly                     •   Code of Conduct
 •    50% IDs including Chairman             certificate to the Board
                                                                                              •   Framework for managing
                                         •   Risk policy: Investment,                             Conflict of Interest
 •    Board committees comprise              Insurance & Operational risk
      majority of IDs/ NEDs; and                                                              •   Guidelines for Acceptance of
                                         •   Risk-based IA framework
      chaired by IDs                                                                              Gifts, Entertainment and
                                         •   WTDs’ compensation aligned to                        Sponsored travels
 •    Evaluation framework for               KPI; incl. malus & claw-back
      Directors, Chairman, Board and                                                          •   Policies on Anti-Money
                                         •   Information/cyber security policy
      its Committees                                                                              Laundering, Anti Bribery/
                                         •   ISO 22301: BCM certification
 •    Policy on Board diversity &                                                                 Corruption, Privacy policy,
      criteria on appointment of         •   ISO 27001: ISMS certification                        Whistleblowing
      Directors; regulatory norms on     •   Investment policy for
                                             governance & operations                          •   Stewardship Code
      “Fit and proper”

                                       IDs: Independent Directors, NEDs: Non- executive Directors, WTD: Whole time Directors
                                       IA: Internal Audit; BCM: Business continuity management; ISMS (Information Security Management
                                       Systems)                                                                                         48
                                       IFC: International Finance Corporation, IiAS: Institutional Investor Advisory Services
Agenda

• Company strategy and performance
• Opportunity
• Industry overview
Favorable demography
                 Large and growing population base1                                                                          High share of working population1
  2020 Population (mn)                                                                                         Population of age 25-59 years (in mn)
                                                                                      1,380       1,439
                                                                                                                                                                               727

                                                              274          331                                                   631
                             127         146        213
    51          59

                                                                                                   China
                                                     Brazil
               S Africa

                                         Russia

                                                                           USA
                              Japan

                                                               Indonesia

                                                                                       India
    S Korea

                                                                                                                                2020                                           2030

                                      Driving GDP growth2                                                                                 Rising affluence2
                                                                                               12.5%           GDP per capita CAGR
                                                                                                                (FY2010-FY2020)
                                                        8.2%
          7.7% 7.9%                           7.4% 8.0%      7.2%                                       6.9%                                                                                  10.4%
                                       6.4%                  6.1%
  4.8% 4.2%               5.2% 5.5%                                                                                                                                                  6.7%
                                                        3.8% 3.5% 4.2%                                                                                  5.2%       6.2%
                          3.1% 2.5% 2.7% 2.8% 2.9% 2.6%              2.8%                        6.0% 4.2%
  1.9%                                                                                                                                 3.1%     3.3%
                                                                                                 3.3%              -0.1%     0.1%
  FY02 FY08 FY10 FY12 FY13 FY14 FY15 FY16 FY17 FY18 FY19 FY20E FY21E FY22E FY23E

                                                                                                                                                                                      India
                                                                                                                              Brazil

                                                                                                                                       Russia

                                                                                                                                                        S. Korea
                                                                                                                     Japan

                                                                                                                                                                   Indonesia

                                                                                                                                                                                               China
                                                                                                                                                U.S.A
              -1.7%

                                                                            -8.0%
                                                  India       World

                                                                                 1.    Source: UN population division
                                                                                 2.    Source: WEO Update, April 2021
                                                                                                                                                                                                       50
Financialisation of savings: Opportunity for insurance
                            Household savings1                                                  Distribution of financial savings (including currency) 2
                                                                                    70%
   85                             61%                 63%
                                                                         57%        60%
` tn

               52%
   65                                                                                                  17%
                                45%                                                 50%                                     18%
                                                     40%                41%                                                                     17%                   17%
   45         36%                                                                   40%
                                                                        23.70
                                                  19.54                             30%
   25                         13.64
             14.53                                                                  20%
                              14.96               20.61                 22.84
       5     11.91
             -3.59             -3.91                                    -6.64       10%
                                                   -7.38
   -15                                                                              0%
             FY2014           FY2016             FY2018                FY2020                         FY2014              FY2016              FY2018              FY2020

                      Physical savings                                                                       Provident and Pension Funds (Incl. PPF)+ Small savings
                      Gross financial savings                                                                Investments
                      Household borrowings                                                                   Life insurance funds
                      Gross Financial savings as a % of Household Savings                                    Currency & deposits
                      Net Financial savings as a % of Household Savings

                                                   FY2002              FY2008       FY2010        FY2012           FY2014          FY2018             FY2019           FY2020
       Life insurance premium3 as %
                                                       2.1%              4.0%            4.1%        3.3%             2.8%             2.7%             2.7%                2.8%
       of GDP

                                                                  1.     Source: RBI and CSO
                                                                  2.     Source: RBI
                                                                  3.     Total life insurance industry premium including renewal; Source: IRDAI                                    51
Protection opportunity: Low penetration
    Sum Assured as a % of GDP1,2                            Addressable population#
                                                                                                                                                Protection gap(%) 4,5
                                                                coverage3 (%)
  273%
         252%   251%                                                                                                             83      61      55     54     76     71    74     55

                                                                                             10%                                 16.50
                       142%   131%
                                     113%

                                                                                                                  USD trillion
                                                                                                                                         8.40

                                                                                                                                                3.90
                                             19%                                                                                                       2.80   2.00   0.90   0.70   0.60

                                                                     Covered by retail
                                                                    protection policies

* Total sum assured                                             # Based on Income Tax Department
** Retail protection sum assured (company estimates)            data for individuals (annual income >
                                                                ` 250,000) and company estimates

                                                       1.   As of FY2020 for India (GDP Source: National Statistics Office, protection sum assured source: company estimates)
                                                       2.   As of FY2018 for US, Japan, South Korea. Others as of FY2017 (Source: McKinsey estimates)
                                                       3.   Addressable population coverage= Inforce no. of lives for retail protection/ No. of returns with income > ` 250,000
                                                       4.   Protection gap (%): Ratio of protection lacking/protection needed
                                                       5.   Source: Swiss Re, Closing Asia’s mortality protection gap, 2020                                                   52
Protection opportunity: Sum assured as a % of GDP
              Sum Assured (SA) as a % of GDP:
    A        Assuming SA growth @ 20% CAGR
                                                 75%
                                                                                                    Sum Assured as a % of GDP1,2

                                  45%
                                                                       273%
                                                                                  252%     251%                      India: FY2035
                    30%                                                                                B
     19%
                                                                                                     145%      142%
                                                                                                                         131%                    A
                                                                                                                                    113%
    FY2020         FY2025        FY2030         FY2035                                                                                           75%

                                                                                                                                                       19%
              Sum Assured (SA) as a % of GDP:
    B        Assuming SA growth @ 25% CAGR
                                                145%

                                 70%

                   35%
    19%

                                                                   * For retail protection sum assured (company estimates)
   FY2020         FY2025        FY2030          FY2035

                                           1.    FY2020 GDP data for India (Source: National Statistics Office, protection sum assured source:
                                                 company estimates)
                                           2.    As of FY2018 for US, Japan, South Korea. Others as of FY2017 (Source: McKinsey estimates)             53
Protection opportunity: Addressable population coverage (%)
With 15% CAGR in new policy count from FY2020 to FY2035         With 20% CAGR in new policy count from FY2020 to FY2035
                                              250.8                                                                250.8
    In million                                                    In million                           46%

                                 170.7                                                                   170.7

                                                          28%
                    106.0                                                                    106.0

                                                                                                                   115.7
       57.5                                     69.9                      57.5
                                  34.1                                                                   46.1
        6           15.8                                                    6                 17.8

      FY2020       FY2025       FY2030        FY2035                     FY2020             FY2025      FY2030    FY2035
                  Insured    Uninsured                                                     Insured    Uninsured

     Even at accelerated policy growth rates, at best ~50% of India’s addressable population
     can be expected to be covered in 15 years

                                           Assumed 10% lapse rate for inforce policies at each year                        54
Indicators of protection opportunity
                   Retail Credit1                                                          Health & Motor2

  ` billion
                                                                  Gross direct premium                FY2009   FY2020   CAGR
                                                25,537            (` billion)
                                                                  Health                               66.23   516.38   20.5%
                               19,085
                                               12,147
               13,922
                               9,339                              Motor                               138.21   692.08   15.8%
   10,097
               6,454
   4,711
                               9,746
                                               13,390             - Motor Own Damage (OD)              87.56   265.52   10.6%
   5,386       7,468

   Mar-14      Mar-16         Mar-18           Mar-20             - Motor Third Party (TP)             50.65   426.56   21.4%
                 Home Loans   Others

• Healthy growth in retail credit                                 • Protection premium ~ ` 235 billion for life
• Credit life is voluntary                                          insurance industry in FY2021

                                        1. Source: RBI
                                        2. Source: General Insurance Council and company estimate
                                        Components may not add up to the totals due to rounding off                        55
Agenda

• Company strategy and performance
• Opportunity
• Industry overview
Evolution of life insurance industry in India
                                        FY2002                  FY2010                   FY2015           FY2020

 New business premium1 (` bn)              116         21.5%       550         -5.8%
                                                                                            408   12.5%    735

 Total premium (` bn)                      501        23.2%       2,654         4.3%      3,281   11.6%    5,683

 Penetration (as a % to GDP)              2.1%                    4.1%                    2.6%             2.8%

 Assets under management (` bn)          2,304         24.0%
                                                                 12,899        12.6%     23,361   10.1%   37,757

 In-force sum assured2 (` bn)          11,812*         15.5%     37,505        15.8%     78,091   17.3%   173,077

 In-force sum assured (as % to GDP)     50.1%                    57.9%                   62.7%            85.1%

                                1. Retail weighted received premium (RWRP)
                                2. Individual and Group in-force sum assured
                                Source: IRDAI, CSO, Life Insurance Council, *Company estimate                       57
Industry overview
                          Industry                                                          Private Sector

                  26%       18%             18%
  Product mix1

                                                                                                  44%          37%
                                                                                    51%
                                                              Linked

                  74%       82%             82%               Non-linked
                                                                                                  56%          63%
                                                                                    49%

                 FY2019   FY2020          9M-FY2021                                FY2019        FY2020      9M-FY2021

                  11%      12%              12%
  Channel mix2

                                                                                    21%           22%           23%
                  27%      28%              27%               Others
                                                              Bancassurance         54%           53%           54%
                  62%      60%              60%               Agency

                                                                                    25%           25%           23%

                 FY2019   FY2020          9M-FY2021                                FY2019        FY2020       9M-FY2021

• Given a well developed banking sector, bancassurance continues to be the largest channel
  for private players
                                     1.    New business weighted premium basis
                                     2.    Individual new business premium basis
                                           Source: Life Insurance Council                                                58
Annexures
Cost efficiency
                                                                                           FY2020                              FY2021
  Expense ratio (excl. commission)1                                                           10.3%                                 9.5%
  Commission ratio2                                                                             5.7%                                5.3%
  Cost/TWRP3                                                                                  15.9%                               14.8%
  Cost/Average AUM4                                                                             2.9%                                2.3%
  Cost/TWRP (Savings LOB)                                                                     10.4%                                9.6%

                       ` billion                                            44.71                                     42.20

                      Commission                                            28.85                                     27.20
                      Non Commission
                                                                            15.86                                     15.00

                                                                          FY2020                                    FY2021

                                   1.   Expense ratio: All insurance expenses (excl. commission)/(Total premium- 90% of single premium)
                                   2.   Commission ratio: Commission/(Total premium- 90% of single premium)
                                   3.   Cost/(Total premium- 90% of single premium)
                                   4.   Annualized cost/Average assets under management during the period                                 60
                                   Total may not add up due to rounding off
Risk management: Non-participating business
   Guaranteed return savings product
   • Expanded product tenure from a maximum                                                 Lump sum   Income
     of 15 years to ~20 years

                                                                              > 15 years
   • Interest risk hedged through a combination

                                                                Policy term
     of cash market instruments and derivatives
      • Hedge program designed for each
Average APE by product categories
                                                          Average policy term* (years)
                                                                                       36          34
 Segment (`)          FY2020    FY2021

                                                       14         15
 ULIP                 183,109   154,702

                                                         Savings                           Protection
 Non-linked savings    72,000    85,654
                                                             Average customer age* (years)
                                                        43         43
 Protection            23,115    25,149                                                    36      35

 Total                 88,648    85,701

                                                            Savings                        Protection
                                                                         FY2020   FY2021

                                          * Protection excludes credit life

                                                                                                        62
Channel wise product mix1
  Channel category           Product category                            FY2019               FY2020   FY2021
                             ULIP                                          93.4%               86.8%    73.3%
                             Non-linked savings                             2.3%                3.3%    11.6%
  Bancassurance              Annuity                                        0.5%                0.7%     4.3%
                             Protection                                     3.9%                9.3%    10.9%
                             Total                                        100.0%              100.0%   100.0%
                             ULIP                                          75.3%               49.9%    33.3%
                             Non-linked savings                            18.4%               39.2%    57.0%
  Agency                     Annuity                                        0.1%                0.6%     2.1%
                             Protection                                     6.2%               10.3%     7.7%
                             Total                                        100.0%              100.0%   100.0%
                             ULIP                                          79.3%               66.7%    61.4%
                             Non-linked savings                             6.7%               14.4%    21.2%
  Direct                     Annuity                                        4.9%                7.2%     7.8%
                             Protection                                     9.0%               11.6%     9.6%
                             Total                                        100.0%              100.0%   100.0%
                             ULIP                                          28.3%               21.8%    13.1%
                             Non-linked savings                            49.9%               49.6%    70.5%
  Partnership distribution   Annuity                                        0.0%                0.5%     2.9%
                             Protection                                    21.9%               27.8%    13.5%
                             Total                                        100.0%              100.0%   100.0%

                                1. Retail Annualized Premium Equivalent (APE)
                                Components may not add up to the totals due to rounding off
                                                                                                                63
Product wise channel mix1
  Product category     Channel category                                       FY2019               FY2020   FY2021
                       Bancassurance                                            65.5%               68.2%    64.9%
                       Agency                                                   20.5%               16.3%    16.6%
  ULIP                 Direct                                                   12.0%               13.0%    16.1%
                       Partnership distribution                                  2.1%                2.5%     2.5%
                       Total                                                   100.0%              100.0%   100.0%
                       Bancassurance                                            14.2%               10.8%    17.8%
                       Agency                                                   44.5%               53.6%    49.3%
  Non-linked savings   Direct                                                    9.0%               11.7%     9.7%
                       Partnership distribution                                 32.3%               23.8%    23.3%
                       Total                                                   100.0%              100.0%   100.0%
                       Bancassurance                                            29.0%               29.4%    51.1%
                       Agency                                                    2.9%               11.8%    14.0%
  Annuity              Direct                                                   66.7%               55.3%    27.5%
                       Partnership distribution                                  0.0%                3.5%     7.4%
                       Total                                                   100.0%              100.0%   100.0%
                       Bancassurance                                            36.9%               45.2%    51.9%
                       Agency                                                   22.8%               20.9%    20.6%
  Protection           Direct                                                   18.7%               14.0%    13.6%
                       Partnership distribution                                 21.7%               19.8%    13.8%
                       Total                                                   100.0%              100.0%   100.0%

                                     1. Retail Annualized Premium Equivalent (APE)
                                     Components may not add up to the totals due to rounding off
                                                                                                                     64
Retail persistency
  Persistency1 across product categories
                      Excluding single premium                                                        Including single premium

     83.5%                   89.5%                    86.6%                          84.4%                    94.0%                   86.6%
                                     70.5%                                                                            74.5%                   78.4%
             62.0%                                            63.3%                          63.0%

        Linked                 Non linked              Protection                       Linked                 Non linked              Protection

  Persistency1 across channel categories

                      Excluding single premium                                                        Including single premium

                     89.0%            84.4%             86.9%                                         90.1%             91.1%            88.1%
    82.7%                                                                            84.0%
                                                            75.6%                                                                             75.9%
                         65.5%                                                            62.8%            67.3%              68.5%
        60.7%                                61.1%
                                                                       13th month
                                                                       49th month

  Bancassurance       Agency            Direct         Partnership                  Bancassurance      Agency               Direct      Partnership
                                                       distribution                                                                     distribution

                                                     1. 11M-FY2021 persistency
                                                     As per IRDA circular dated January 23,2014; excluding group                                       65
Embedded value
Analysis of movement in EV1
` billion                                                            FY2017            FY2018            FY2019           FY2020           FY2021
Opening EV                                                            139.39            161.84            187.88           216.23            230.30
      Unwind                                                           12.21             13.72             15.84            17.25              16.61
      Value of New Business (VNB)                                       6.66             12.86             13.28            16.05              16.21
      Operating assumption changes + Operating variance                 4.08             10.22               8.89           (0.42)              2.24
            Operating assumption changes                                 1.00             7.64               4.20          (2.25)2              3.09
            Operating variance                                           3.08             2.58               4.69             1.83             (0.85)
             Persistency variance                                        0.99             1.53               2.66             0.85              1.10
             Mortality and morbidity variance                            0.98             0.78               1.97             0.42            (2.37)3
             Expense variance                                            0.35             0.27               0.04             0.01              0.01
             Other variance                                              0.76             0.00               0.02             0.56              0.41
EVOP                                                                   22.95             36.80             38.01            32.88              35.05
Return on embedded value (ROEV)                                       16.5%             22.7%             20.2%            15.2%              15.2%
      Economic assumption change and investment variance                 5.82             1.13             (1.22)          (14.76)             25.67
      Net capital injection                                            (6.32)          (11.88)             (8.43)           (4.05)              0.04
Closing EV                                                            161.84            187.88            216.23           230.30            291.06
                                                1. As per Indian Embedded Value (IEV) method
                                                2. Negative impact of ` 5.49 billion due to change in effective tax rate
                                                3. Mortality variance includes the negative impact of COVID claims of ` 2.64 billion net of reinsurance
                                                Components may not add up to the totals due to rounding off                                             67
Embedded value growth
  ` billion                                                          FY2019                   FY2020   FY2021

  Value of In force (VIF)                                             142.69                  151.87    195.84

  Adjusted Net worth                                                    73.54                  78.43     95.22

  Embedded value1                                                     216.23                  230.30    291.06

  Return on Embedded Value (ROEV)                                     20.2%                   15.2%     15.2%

  EV growth-pre dividend                                              19.6%                    8.4%     26.4%

  EV growth-post dividend                                             15.1%                    6.5%     26.4%

  VNB as % of opening EV                                                7.1%                   7.4%      7.0%

  Operating assumption changes and variance as
                                                                        4.7%                  (0.2%)     1.0%
  % of opening EV

                                1. As per Indian Embedded Value (IEV) method
                                Components may not add up to the totals due to rounding off
                                                                                                                 68
Economic assumptions underlying VNB and EV
        Tenor (years)           References Rates
                        March 31, 2020             March 31, 2021
             1                  4.83%                      3.91%
             5                  7.43%                      7.38%
             10                 7.32%                      7.93%
             15                 7.17%                      7.48%
             20                 7.14%                      7.02%
             25                 7.14%                      6.72%
             30                 7.14%                      6.55%

                                                                    69
Glossary
•   Annualized Premium Equivalent (APE) – Annualized Premium Equivalent (APE) is the sum of the annualized first year
    premiums on regular premium policies, and ten percent of single premiums, from both individual and group
    customers
•   Assets under management (AUM) - AUM refers to the carrying value of investments managed by the company and
    includes loans against policies and net current assets pertaining to investments
•   Embedded Value (EV) - Embedded Value (EV) represents the present value of shareholders’ interests in the earnings
    distributable from the assets allocated to the business after sufficient allowance for the aggregate risks in the
    business
•   Embedded Value Operating Profit (EVOP) - Embedded Value Operating Profit (EVOP) is a measure of the increase in
    the EV during any given period due to matters that can be influenced by management
•   Retail Weighted Received Premium (RWRP) - Premiums actually received by the insurers under individual products
    and weighted at the rate of ten percent for single premiums
•   Total weighted received premium (TWRP) - Measure of premiums received on both retail and group products and is
    the sum of first year and renewal premiums on regular premium policies and ten percent of single premiums
    received during any given period
•   Persistency Ratio - Persistency ratio is the percentage of policies that have not lapsed and is expressed as 13th
    month, 49th month persistency etc. depicting the persistency level at 13th month (2nd year) and 49th month (5th
    year) respectively, after issuance of contract

                                                                                                                  70
•
Safe harbor
Except for the historical information contained herein, statements in this release which
contain words or phrases such as 'will', 'would', ‘indicating’, ‘expected to’ etc., and similar
expressions or variations of such expressions may constitute 'forward-looking statements'.
These forward-looking statements involve a number of risks, uncertainties and other factors
that could cause actual results to differ materially from those suggested by the forward-
looking statements. These risks and uncertainties include, but are not limited to our ability to
successfully implement our strategy, our growth and expansion in business, the impact of
any acquisitions, technological implementation and changes, the actual growth in demand for
insurance products and services, investment income, cash flow projections, our exposure to
market risks, policies and actions of regulatory authorities; impact of competition; experience
with regard to mortality and morbidity trends, lapse rates and policy renewal rates; the
impact of changes in capital, solvency or accounting standards, tax and other legislations and
regulations in the jurisdictions as well as other risks detailed in the reports filed by ICICI Bank
Limited, our holding company, with the United States Securities and Exchange Commission.
ICICI Prudential Life Insurance undertakes no obligation to update forward-looking statements
to reflect events or circumstances after the date thereof.

                                                                                                      71
Thank You
You can also read