Personal Heating in Dwellings as an Innovative, Energy-Sufficient Heating Practice: A Case Study Research - MDPI
←
→
Page content transcription
If your browser does not render page correctly, please read the page content below
sustainability

Article
Personal Heating in Dwellings as an Innovative,
Energy-Sufficient Heating Practice: A Case Study Research
Nick Van Loy * , Griet Verbeeck                    and Elke Knapen

                                          Sustainability Group, ArcK Research Group, Faculty of Architecture and Arts, Hasselt University, Agoralaan
                                          Building E, 3590 Diepenbeek, Belgium; griet.verbeeck@uhasselt.be (G.V.); elke.knapen@uhasselt.be (E.K.)
                                          * Correspondence: nick.vanloy@uhasselt.be

                                          Abstract: Despite the efforts to improve the energy efficiency of buildings, the actual energy con-
                                          sumption decreased much less than expected in recent years. Therefore, energy sufficiency is gaining
                                          attention as a complementary approach to energy efficiency. It aims to reduce the actual energy con-
                                          sumption of buildings by providing thermal comfort to residents in a sufficient way. This demands
                                          for alternative heating practices, such as the application of personal heating systems. Although
                                          a review of past studies shows that, in office buildings, thermal comfort can be provided with less
                                          energy by using personal heating systems, the application in a residential context is much less
                                          explored. Our hypothesis is that an innovative, energy-sufficient personal heating practice also has
                                          potential to reduce the overall energy consumption in dwellings. Therefore, this paper presents the
                                          results of a one-week case study on personal heating as an energy-sufficient heating practice in three
                                          dwellings. During the case study, the ambient temperature was reduced to 18 ◦ C, and residents
                                          were allowed to use active and passive personal heating systems to make themselves as comfortable
                                as possible. They were also asked to evaluate their thermal sensation and thermal comfort. The

                                          results show that, despite a lower indoor temperature, residents are able to achieve thermal comfort
Citation: Van Loy, N.; Verbeeck, G.;
                                          by using personal heating at the locations where they effectively reside. Additionally, a significant
Knapen, E. Personal Heating in
                                          energy saving potential was found. The case study proved our hypothesis, leading to the conclusion
Dwellings as an Innovative,
                                          that an innovative, sufficient personal heating practice in dwellings can be a supplementary step to
Energy-Sufficient Heating Practice: A
                                          reduce the energy consumption to meet the global challenges.
Case Study Research. Sustainability
2021, 13, 7257. https://doi.org/
10.3390/su13137257
                                          Keywords: personal heating; personal conditioning system; residential context; energy sufficiency;
                                          thermal comfort; energy savings
Academic Editor: Antonio Caggiano

Received: 1 June 2021
Accepted: 25 June 2021                    1. Introduction
Published: 29 June 2021                   1.1. Background
                                               Climate change is one of the most critical problems the world is facing today [1],
Publisher’s Note: MDPI stays neutral
                                          mainly driven by carbon and other greenhouse gas emissions [2]. To meet the global
with regard to jurisdictional claims in
                                          climate ambitions of the Paris agreement, the greenhouse gas emissions should be reduced
published maps and institutional affil-
                                          from 1990 levels by at least 55% by 2030 [3]. Since the built environment is responsible
iations.
                                          for 39% of all carbon emissions and operational emissions account for 28% of all carbon
                                          emissions [4], reducing the emissions of buildings is essential to achieve future climate
                                          goals. In 2017, the residential sector represented almost 20% of the total Belgian energy
                                          consumption, of which, on average, 74% was used for heating dwellings [5,6]. Reducing
Copyright: © 2021 by the authors.         the energy consumption for heating in dwellings is thus an essential part of mitigation of
Licensee MDPI, Basel, Switzerland.
                                          climate change.
This article is an open access article
                                               The common approach to reduce heating energy consumption is to promote or impose
distributed under the terms and
                                          energy efficiency measures, such as high insulation levels, air-tightness requirements, the
conditions of the Creative Commons
                                          use of energy-efficient appliances, and energy-efficient all-air heating systems. This object-
Attribution (CC BY) license (https://
                                          centered approach aims to optimize the dwellings’ skin and the efficiency of the installations
creativecommons.org/licenses/by/
4.0/).
                                          but often neglects the residents’ behavior or practices. As a result, despite stricter energy

Sustainability 2021, 13, 7257. https://doi.org/10.3390/su13137257                                      https://www.mdpi.com/journal/sustainability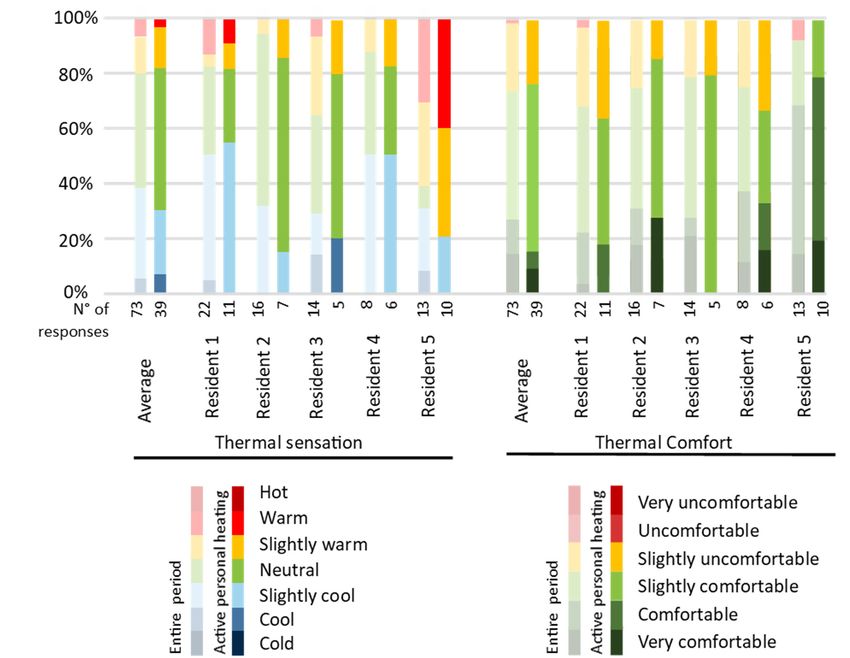
Sustainability 2021, 13, 7257                                                                                            2 of 27

                                performance regulations, the actual energy consumption decreased only in recent years,
                                and less than estimations of the energy efficiency potential suggested [7]. Energy savings
                                by energy efficiency measures are partially nullified by the rebound and cohort effect,
                                such as increasing the heating setpoint [8,9] or the construction of larger dwellings [10,11].
                                Additionally, the current efficiency strategy is implemented rather slowly. Only around 1%
                                of the European building stock is renovated each year, while almost 75% of the building
                                stock in Europe is energy-inefficient [3]. Moreover, the current energy efficiency strategies
                                result in an increasing demand for building materials [12,13].
                                      In the current common heating practice, dwellings are often heated by single-zone
                                central heating systems controlled by a single central thermostat [14], which is developed
                                for heating several rooms simultaneously and completely to a uniform indoor climate. As
                                residents do not use rooms entirely and simultaneously and only stay at specific spots
                                within a room [15,16], there is a mismatch between the effective spatial use and the common
                                heating practice. However, the current object-centered energy efficiency approach focuses
                                on improving the energy efficiency of the building or the heating system but does not
                                question this current heating practice or current lifestyle.
                                      To tackle this, in recent years, energy sufficiency has gained increasing attention as
                                a complementary approach to reduce the absolute energy consumption of a household. On
                                the one hand, energy sufficiency aims for living well by starting from the effective needs of
                                the occupant (i.c., thermal comfort). On the other hand, it aims for a reduction of the overall
                                energy consumption by questioning the provided service (i.c., the heating practice). In
                                contrast to the object-centered energy efficiency approach, the energy sufficiency approach
                                is resident-oriented, since it starts from the residents’ needs. As such, energy sufficiency
                                can be defined as a state where the basic needs for energy services are met, while the
                                ecological limits are respected [17], i.e., the provided services are reduced or substituted
                                to fulfil the needs of the people without delivering too much. Shifting the focus from
                                an object-centered energy efficiency approach, that is, focusing on the building skin and
                                the heating system, toward a resident-oriented energy sufficiency approach that questions
                                the current heating practice is essential to find opportunities to simultaneously provide
                                thermal comfort to the residents and reduce the heating energy consumption significantly.
                                      The limitations of traditional all-air heating systems have led to the development of
                                personal heating appliances, such as heated chairs and hand and foot warmers. Whereas
                                in a conventional heating practice, a uniform temperature is provided continuously in
                                all rooms, a personal heating practice aims to provide thermal comfort to the individual
                                resident by heating people when and where needed according to their needs. As such,
                                personal heating can be considered as an energy sufficient heating practice by adjusting the
                                energy service (only heating persons, not spaces, and only when and where needed). At the
                                same time, the overall indoor temperature can be reduced, which has been proven to cause
                                significant energy savings [18,19]. A personal heating practice can be relatively simple and
                                quickly implemented and can be a low-cost energy-saving alternative to traditional cost-
                                and material-intensive energy efficiency renovations.

                                1.2. Review of Personal Heating Studies
                                     Many researchers have investigated personal heating, as is shown in Table 1. In
                                these studies, different types of personal heating systems can be distinguished: chair
                                heaters, foot and hand warmers, combinations of these appliances, radiant heating panels
                                and other systems such as heated clothing. Most of the studies made use of climate
                                chambers at several ambient temperatures. In studies with human test persons, the human
                                subjects mainly were asked to sit first in an acclimatization room with a reference (comfort)
                                temperature without making use of any personal heating. Subsequently, the human subjects
                                had to sit in another room with an ambient temperature below the standardized comfort
                                temperature while making use of a personal heating system. In some experiments, the test
                                persons could control the system’s temperature; in other experiments, they had no control.
                                During the experiment, people were asked to vote on their thermal sensation and thermal
Sustainability 2021, 13, 7257                                                                                                       3 of 27

                                      comfort. Other studies made use of a thermal manikin (study 8, 12, 14, 16) or simulations
                                      (study 6, 8, 17, 19) such as CFD (computer fluid dynamics). The different studies are
                                      briefly presented in the following subparagraphs according to the type of personal heating
                                      system, type of experiment, presence/absence of individual control, ambient temperatures,
                                      whether the study had a focus on thermal comfort or energy savings and whether a system
                                      was investigated or a heating practice.

                                   Table 1. Overview of previous studies on personalized heating systems.

                                                Type of Experiment      Individual      Ambient
     N◦        Ref.       Type of System                                                                 Comfort/Energy    System/Practice
                                                  (N◦ Subjects)          Control     Temperature [◦ C]
  Study 1      [20]        Heated chair         Climate chamber (32)       No               16           Thermal comfort      System
  Study 2      [21]        Heated chair         Climate chamber (13)       Yes           14, 16, 18      Thermal comfort      System
  Study 3      [22]        Heated chair         Climate chamber (23)       Yes            18, 16         Thermal comfort      System
  Study 4      [23]        Heated chair         Climate chamber (30)       Yes            18, 16         Thermal comfort      System
  Study 5      [24]        Heated chair         Climate chamber (24)       No            22, 18, 15      Thermal comfort      System
                                                                                                            Thermal
  Study 6      [25]        Heated chair             Simulations             -                -                             System/practice
                                                                                                         comfort/energy
                                                                                                            Thermal
  Study 7      [26]   Foot warmers (radiant)     Office building (16)      Yes         20, 19.4, 18.9                         System
                                                                                                         comfort/energy
                                                     Thermal
  Study 8      [27]        Foot warmer                                      -                -           Thermal comfort      System
                                                manikin/simulations
                           Palm warmer                                                                      Thermal
  Study 9      [28]                             Climate chamber (18)     No/Yes           18, 20                              System
                           Foot warmer                                                                   comfort/energy
                           Heated chair                                                                     Thermal
  Study 10     [29]                             Climate chamber (16)       Yes         14, 16, 18, 22                         System
                           Leg-warmer                                                                    comfort/energy
                          Heated seat
                          Foot warmer
  Study 11     [30]                             Climate chamber (8)         -             20, 10         Thermal comfort      System
                        Heated seat + foot
                            warmer
                          Heated chair
                                                  Climate chamber                                           Thermal
  Study 12     [31]      Heated wrist pad                                   -               18                                System
                                                (20)/thermal manikin                                     comfort/energy
                          Heated insole
                          Heated chair
                                                                                                            Thermal
  Study 13     [32]      Heated desk mat        Climate chamber (13)       Yes              18                                System
                                                                                                         comfort/energy
                         Heated floor mat
                          Heated chair
                        Under-desk radiant
  Study 14     [33]       heating panel           Thermal manikin           -               20           Thermal comfort      System
                          Floor radiant
                          heating panel
                        Radiant panel with
                         heated table pad
  Study 15     [34]     Heated chair with       Climate chamber (14)       Yes            15, 18         Thermal comfort      System
                          floor mattress
                         Heated clothing
  Study 16     [35]   Localized floor heating     Thermal manikin           -                -           Thermal comfort      System
  Study 17     [36]   Electric radiant panels        Simulation             -               18           Thermal comfort      System
  Study 18     [37]   Electric radiant panels   Climate chamber (18)        -            20, 17, 14      Thermal comfort      System
  Study 19     [38]   Electric radiant panels        Simulation             -                -           Thermal comfort      System
  Study 20     [39]         Wrist heater        Climate chamber (49)     No/Yes          20, 23, 26      Thermal comfort      System
  Study 21     [40]         Heated seat            Office building         Yes               -           Thermal comfort      System
  Study 22     [41]         Floor heater        Residential buildings                      8–14          Thermal comfort      System
                          Radiant heater,
  Study 23     [42]                             Climate chamber (20)                      13–15          Thermal comfort      System
                          heated clothing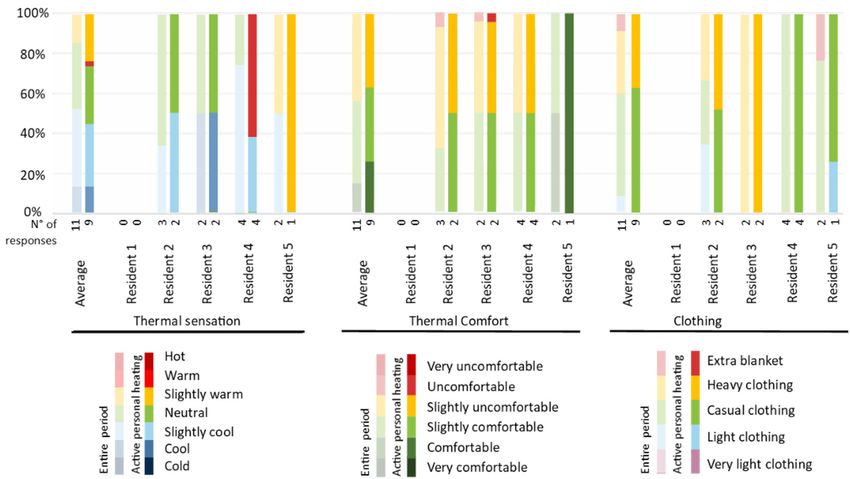
Sustainability 2021, 13, 7257                                                                                             4 of 27

                                1.2.1. Chair Heaters
                                      Study 1 [20] used a reference ambient temperature of 18 ◦ C and showed that a heated
                                chair in a room of 16 ◦ C could improve the thermal sensation from slightly cool to neu-
                                tral and could also improve the thermal comfort from slightly uncomfortable to slightly
                                comfortable. Heating the seat cushion was also found to improve the thermal sensation in
                                unheated body parts such as hand and foot, while the back of the seat only has an effect
                                on the thermal sensation in the back. Study 2 [21] evaluated the thermal sensation and
                                thermal comfort when applying chair heating at three different ambient temperatures and
                                compared it with the comfort and sensation at the same ambient temperature but with-
                                out personalized heating. A distinction is made between thermal sensation and thermal
                                comfort, as a person’s neutral thermal sensation does not always result in a comfortable
                                environment or vice versa, especially in nonuniform environments [43]. Thermal sensation
                                describes a conscious feeling that grades the thermal environment (commonly expressed by
                                the 7-point ASHRAE scale ranging from cold to hot), while thermal comfort describes the
                                satisfaction of this feeling (commonly expressed by a Likert scale ranging from very uncom-
                                fortable to very comfortable). Chair heating was found to improving the overall thermal
                                sensation at ambient temperatures of 14 ◦ C and 16 ◦ C. At 18 ◦ C, the thermal sensation was
                                already voted as neutral without personal heating, and no significant further improvements
                                were found when using the heated chair. When considering thermal comfort instead of
                                thermal sensation, only substantial improvements were found at 14 ◦ C. With personalized
                                heating at an ambient temperature of 14 ◦ C and 16 ◦ C, the thermal comfort was voted
                                slightly uncomfortable, and at 18 ◦ C, it was voted comfortable. Study 3 [22] showed that
                                using a heated chair can increase both thermal sensation and thermal comfort at ambient
                                temperatures of 16 ◦ C and 18 ◦ C. In the coldest situation of 16 ◦ C, in addition to the heated
                                chair, test subjects were allowed to increase their clothing insulation. In study 4 [23], three
                                types of office chairs were compared: two ordinary chairs and one active (heating and
                                cooling) chair. The experiments show that the active chair could thermally satisfy the test
                                subjects the most. In study 5 [24], a water-fed seat for vehicles was tested. During the
                                experiment, different water temperatures were applied. They found that, in the optimal test
                                situation (ambient temperature and water temperature), the ambient temperature could
                                be reduced by 5.5 ◦ C while maintaining a percentage of thermal comfort satisfaction of
                                90%, and even reduced by 9.3 ◦ C with a percentage of satisfaction of 80%. In study 21 [40],
                                a high occupancy satisfaction rate was found while using a heated chair during a 6-month
                                field study in an office building. They also found that fast-acting heating has the potential
                                to address the comfort needs of the occupants with minimal energy consumption.

                                1.2.2. Foot and Hand Warmers
                                      As hands and feet are the most sensitive for cold environments, heating these body
                                parts can have a positive spatial alliesthesia effect (Spatial alliesthesia means that a nonuni-
                                form environment, where different body parts experience different temperatures, will be
                                experienced more pleasant than a uniform environment) on human subjects. In study 9 [28],
                                conductive palm warmers and convective foot warmers were tested at several ambient
                                temperatures and at a reference temperature of 24.5 ◦ C, which was voted as slightly cool to
                                neutral. During the tests, the test persons had to perform several tasks such as filling in
                                a sudoku, solving math problems and typing. The systems were able to bring the thermal
                                sensation of the subjects close to neutral at a temperature of 20 ◦ C and to slightly cool
                                at a temperature of 18 ◦ C. When the user had control over the system, they were able
                                to bring their comfort closer to neutral than when they had no control over the system.
                                Zhang et al. (2015) (study 7) studied a foot warmer by using radiant lamps, discussed in
                                Section 1.2.4. In study 22 [41], the use of an electric personal heating device (Huo xiang
                                which is a traditional heating device in China) was investigated in natural-ventilated build-
                                ings at a temperature far below the standardized comfort temperature. A high comfort
                                acceptability rate was found at temperatures between 8–14 ◦ C.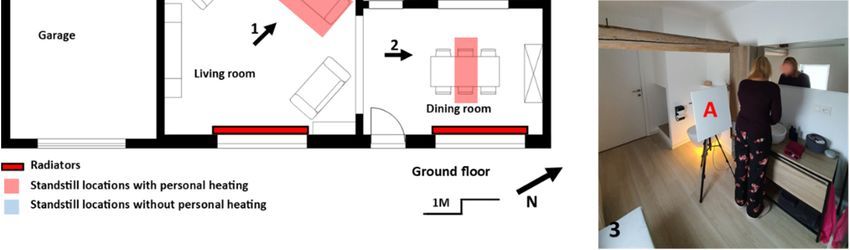
Sustainability 2021, 13, 7257                                                                                           5 of 27

                                1.2.3. Combination of Techniques (Chairs, Foot and Wrist Warmers)
                                      In study 10 [29], a heated chair and a heated chair in combination with a leg warmer
                                were tested at ambient temperatures of 14 ◦ C, 16 ◦ C and 18 ◦ C. Results show that the
                                combination of both had the most positive effect on the thermal sensation, although the
                                difference between the chair alone and the combination of both was minor at a temperature
                                of 18 ◦ C. At all temperatures, the systems were able to bring the thermal sensation to
                                slightly cool or neutral. Study 12 [31] tested insole heating, wrist heating, the combination
                                of both and the combination with a heated chair. They showed that these systems could
                                bring the whole-body thermal sensation at 18 ◦ C from cool to neutral when using insole
                                and wrist heating or even to slightly warm when combining these systems with a heated
                                chair. When using these systems separately, the improvements of the thermal sensation
                                of the locally heated body parts are generally better than the whole-body improvements.
                                A thermal acceptance rate of even 97.5% was reached when using the combinations of
                                wrist heating, insole heating and chair heating. In study 13 [32], a heated chair, heated desk
                                mat and heated floor mat and the combination of these were tested. Results show that the
                                effect of the heated floor mat is less than that of the other systems, and the combination of
                                all three techniques is most effective. In contrast to some other studies, this study did not
                                find a significant difference between an automatic and a fixed control.

                                1.2.4. Infrared Heaters
                                      Several types of radiant heating, such as a complete radiant ceiling, local radiant
                                heating panels and infrared lamps and localized floor heating, have already been studied
                                in literature, although many more studies are focusing on radiative cooling. When using
                                radiant heating sources, thermal discomfort can arise from radiant asymmetry. In general,
                                people are more sensitive to asymmetric radiation caused by a warm ceiling than caused
                                by vertical surfaces [36]. In study 18 [37], local radiant panels at a desk were tested at
                                different ambient temperatures. Results show that, despite the radiant panels, subjects felt
                                cooler when the ambient temperature was decreased to 17 ◦ C and 14 ◦ C in comparison
                                with the thermal sensation at a reference temperature of 23 ◦ C. In addition, the percentage
                                of dissatisfaction due to local discomfort increased when the temperature was lowered.
                                In combination with a heated chair, Watanabe et al. (2010) (study 14) [33] also studied
                                a radiant heating panel placed under the desk and a radiant floor panel at an ambient
                                room temperature of 20 ◦ C and showed that the use of these systems corresponds to
                                the effect of an increase of the ambient temperature of, respectively, 2.8 ◦ C and 2.1 ◦ C.
                                Udayraj et al. (2018) (study 15) [34] tested a radiant heating panel in combination with
                                a heated table pad at an ambient temperature of 15 ◦ C and 18 ◦ C. Results show that,
                                when using these techniques at 15 ◦ C, the thermal sensation was voted between slightly
                                cool and neutral, while at 18 ◦ C, it ranged between neutral and slightly warm. These
                                techniques’ energy consumption was significantly higher than the other techniques they
                                tested (heated chair with heated floor mat and the heated clothing). Study 7 [26] studied
                                a foot warmer at several ambient temperatures, and they found that a foot warmer could
                                improve the thermal sensation of the test subjects at lower ambient temperatures. Because
                                the personal heating system was applied in a real office building, the heating energy
                                savings are calculated and found to be in the range of 38% to 75%, depending on the
                                heating setpoint and outdoor temperature.

                                1.2.5. Other Techniques
                                      In study 15 [34], electrically heated clothing was tested, among other things, at
                                an ambient temperature of 15 ◦ C and 18 ◦ C. It was found that heated clothing has a better
                                effect on the whole body’s thermal sensation than a heated radiant panel with a heated table
                                pad or a heated chair with a heated floor mattress. Comparing the energy consumption of
                                the used techniques showed that the heated clothing consumes significantly less than the
                                other strategies. Study 19 [39] on the recently developed Embr Wave wristband showed
                                that this low-power device can improve the whole body thermal sensation, thermal comfort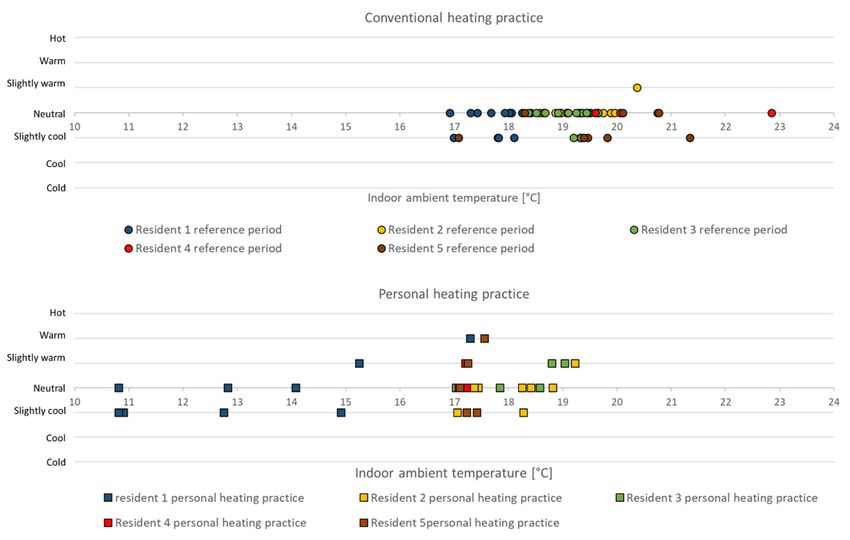
Sustainability 2021, 13, 7257                                                                                            6 of 27

                                and pleasantness with 0.5 to 1 scale unit, which corresponds with an ambient temperature
                                increase of 2–3 ◦ C. In study 23 [42], different combinations of radiant heating and heated
                                clothing were tested at 13 ◦ C and 15 ◦ C. It was found that personal heating can effectively
                                provide thermal comfort to the occupants and that direct clothing heating is much more
                                efficient in providing comfort.

                                1.3. Research Gap and Hypothesis
                                      As Table 1 shows, many studies demonstrated the potential of personal heating sys-
                                tems to increase the occupants’ thermal comfort. However, only a few studies investigated
                                personal heating as energy-saving solution, as confirmed by Veselý and Zeiler [44] and
                                Rawal et al. [45], who stated that there is—up to now—little focus on the power use of
                                personal heating, cooling or ventilation.
                                      Even more importantly, from the point of view of energy sufficiency, these studies
                                focus mostly on evaluating a specific personal heating system (e.g., a heated chair) rather
                                than investigating the personal heating practice itself. For the latter, including the environ-
                                ment where the occupant performs the heating practice is essential. It can be found that
                                most of the studies are focusing on office environments where the activities are mostly
                                static and human positions are mostly limited to sitting at a desk. Therefore, the findings
                                of these studies cannot be extrapolated to residential buildings due to the more dynamic
                                behavior in a residential context. Additionally, most experiments are done in a steady-state
                                lab environment, where the test subjects are removed from the real world and are only
                                involved in the experiment for a maximum of a few hours. Real-life studies on personal
                                heating systems and/or practices are limited, and real-life studies on personal heating
                                practices in a residential environment where residents change location, activities and cloth-
                                ing (including additional blankets) rapidly, are missing. Our hypothesis is that personal
                                heating has potential as an innovative energy sufficient heating practice in dwellings to
                                provide thermal comfort with less energy than the traditional heating practice. Therefore,
                                the following sections of this paper present a real-life case study in three dwellings in
                                which the potential of personal heating practice has been investigated in a residential
                                context from the point of view of both thermal comfort and energy savings. Demonstrating
                                the potential of a personal heating practice in dwellings can stimulate the heating sector
                                and governments to rethink the current energy efficiency approach by adding energy
                                sufficiency as an additional approach to reduce the global energy demand.

                                2. Materials and Methods
                                2.1. Experiment Description
                                     Between December 2019 and February 2020, an in-depth case study research was
                                conducted on the implementation of a personal heating practice in three different dwellings
                                for at least one week (Table 2). The involved dwellings are weakly or only partially
                                insulated. Five residents participated in the experiment, three men and two women
                                between 25 and 30 years old. The residents were asked to lower the indoor temperature
                                to 18 ◦ C. Simultaneously, they were provided with a range of personal heating systems
                                to improve their thermal comfort at locations where they effectively stay and perform
                                activities, also called standstill locations. The standstill locations in these dwellings with
                                the same residents were analyzed in a previous study in which the exact location of the
                                resident was monitored during one week [10,11]. Five generic standstill locations were
                                defined: an area in the bathroom, the bed, the dining/kitchen table, the kitchen worktop
                                and the couch in the living room. Additionally, in this previous study, the common heating
                                practice of the residents, the indoor temperature in the dwellings and the residents’ thermal
                                sensation were measured, and they are used as a reference in this study on personal heating
                                practice. Furthermore, the overall heating energy consumption for heating was measured
                                in dwelling 3 during the case study with a lower ambient temperature.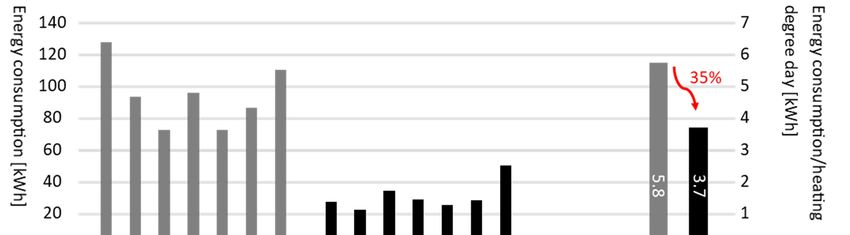
Sustainability 2021, 13, 7257                                                                                                                     7 of 27

                                                    Table 2. Overview of involved dwellings.

                                  Dwelling 1                                      Dwelling 2                                   Dwelling 3
                                                               Couple, 25–35 years old, man (n◦ 2) and woman          Couple, 25–35 years old, man
    Residents          Single, 25–35 years old, man (n◦ 1)
                                                                                    (n◦ 3)                              (n◦ 4) and woman (n◦ 5)
  Dwelling size                      162 m2                                         215 m2                                        148 m2
                                                                                                                     Before 1945 (partially renovated
  Building year                       1990                             Before 1945 (renovated in 1972)
                                                                                                                                 in 2019)
      EPC 1                     496 kWh/m2 year                                  370 kWh/m2                                   283 kWh/m2
                      Electric accumulation heaters (living,    Central heating on fuel oil with radiators and      Energy-efficient central heating on
 Heating system
                          veranda) and electric heaters          floor heating (dining room and bathrooms)                 gas with radiators
      1The energy performance certificate (EPC) gives the theoretical energy consumption for standard indoor and outdoor climatic conditions
      and a standard occupant and takes into account the insulation level and installations but not the actual occupant behavior or actual climate.
      So, this score only represents the energy performance quality of the building and its systems, not the real energy consumption.

                                      2.2. Implemented Personal Heating Systems
                                           At the start of the experiment, four different low-cost, off-the-shelf personal heating
                                      elements were installed at different locations in the dwelling (Figure 1). The residents were
                                      allowed to control and move the elements during the experiment to improve their thermal
                                      comfort. Firstly, three infrared heating panels of 350 W (Redwell WE-Line) were installed,
                                      of which two panels were placed on a large tripod in the living room and one panel on
                                      a small tripod in the bathroom. A power switch for the power plug of the infrared panels
                                      was installed to turn them on and off, but their power could not be controlled. Secondly,
                                      the residents in the living room were provided with two heated blankets (130 cm × 180 cm)
                                      with a maximum power of 120 W (Medisana HDW) controlled by a remote controller
                                      with four heating levels. Thirdly, four heated cushions (30 cm × 40 cm) with a maximum
                                      power of 100 W (beurer HK-35) were provided in several locations, i.e., the dining table,
                                      the kitchen table and the desk. Similar to the blankets, the cushions can be controlled by
                                      a remote with three heating levels. Finally, two heated floor mats (40 cm × 50 cm) with
                                      a maximum power of 20 W were added to the heated cushions to ensure thermal comfort
                                      at the residents’ feet. Table 3 shows an overview of the maximum power of the different
                                      personal heating systems.

                                      2.3. Evaluation Methods
                                      2.3.1. Survey
                                           During the experiment, the residents were asked to evaluate their thermal sensa-
                                      tion and thermal comfort through a two-minute, “right-here-right-now” smartphone
                                      survey [46]. They were asked to fill in the survey when staying at one of the standstill
                                      locations for a longer time and performing an activity, with a minimum of one response
                                      per day, e.g., when they watched television or while cooking. Consequently, the number
                                      of responses depends on the number and the type of activities the residents performed
                                      during the experimental period.
                                           The survey asked about the thermal sensation as well as the thermal comfort of the
                                      residents. For the thermal sensation, the commonly used 7-point ASHRAE scale from cold
                                      to hot was used, and the thermal comfort was asked by a 6-point Likert scale from very
                                      uncomfortable to very comfortable.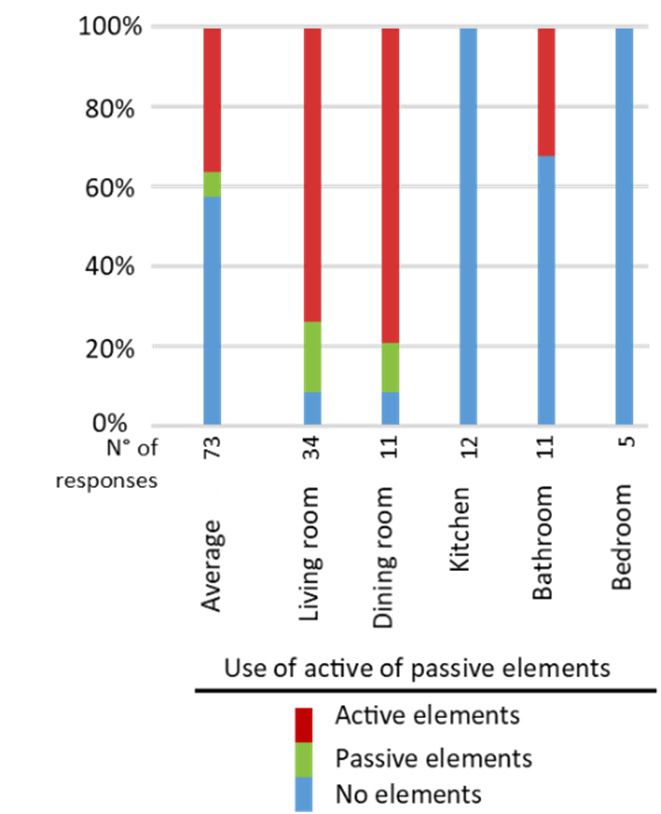
Sustainability 2021, 13, 7257 8 of 27
Sustainability 2021, 13, x FOR PEER REVIEW 8 of 28
Figure 1. Standstill locations in dwelling 3 with personal heating (red) and without personal heating
Figure 1. Standstill locations in dwelling 3 with personal heating (red) and without personal heating
(blue). Personal heating elements implemented at the standstill locations where additional heating
(blue). Personal heating elements implemented at the standstill locations where additional heating is
is required (red) in, respectively, the living room (1), dining room (2) and bathroom (3) in dwelling
required (red) in, respectively,
3. (A) Radiation the living
panels, (B) heated room
blanket, (C)(1), dining
heated room (2)(D)
cushions, and bathroom
heated floor (3)
mat.in dwelling 3.
(A) Radiation panels, (B) heated blanket, (C) heated cushions, (D) heated floor mat.
2.3. Evaluation Methods
Table 3. Overview of the maximum power of the different personal heating systems.
2.3.1. Survey
Infrared Panel Heated Blanket Heated Cushions Floor Mat
During the experiment, the residents were asked to evaluate their thermal sensation
and thermal comfort350
Maximum power W
through 120 W
a two-minute, “right-here-right-now”100 W
smartphone 20 W
survey
[46].Controls
They were asked ON–OFF 4 heating
to fill in the levels
survey whenand OFF
staying3 heating
at onelevels andstandstill
of the OFF ON–OFF
locations
for a longer time and performing an activity, with a minimum of one response per day,
e.g.,Awhen
total of eight
they questions
watched was asked
television each time
or while in theConsequently,
cooking. following order the(Table
number4): of re-
sponses depends on the number and the type of activities the residents performed during
Table 4. Questions of the thermal comfort survey including the question type.
the experimental period.
The survey asked about the thermal sensation as well as the thermal
Question Question comfort
Type of the
residents.
1
For the thermal sensation, the commonly used
Where are you exactly? (position within the room)
7-point ASHRAE scale
Single option
from cold
to2hot was used, and the thermal comfort was asked
In which pose are you? (standing, sitting, lying) by a 6-point Likert
Single option very
scale from
uncomfortable
3 to very comfortable.
Which activity are you performing? Multiple options
4
A total
Howofdo eight questions
you experience was
the asked
indoor each time
temperature in the
right following
now? order (Table 4):
Likert scale
(thermal sensation)
5 What is your thermal
Table 4. Questions of the thermalcomfort right
comfort now?including
survey (thermal comfort)
the question type. Likert scale
6 Which clothing type are you wearing? Multiple options
7
Question
How did you come to this comfort state? (e.g., just performed Question Type
Open questions
1 an activity
Where or used
are you a personal
exactly? heating
(position element)
within the room) Single option
8 Do you experience any local discomfort? Where and how? Open question
2 In which pose are you? (standing, sitting, lying) Single option
3 Which activity are you performing? Multiple options
The How
clothing levelexperience
do you was defined asindoor
the very light clothing (t-shirt
temperature and shorts), light clothing
right now?
4 and trousers), casual clothing (light sweater and trousers), heavy clothing
(t-shirt Likert scale
(thick
(thermal sensation)Sustainability 2021, 13, 7257 9 of 27
sweater and trousers) and an additional blanket. In addition to the questions of the survey,
the time of response was automatically registered.
2.3.2. Diary
Because the resident only evaluates his/her thermal comfort at certain times (“right-
here-right-now” survey when staying at a standstill location for a longer period of time),
the survey data do not provide any insight into the residents’ thermal comfort while
circulating in the building, other inconveniences or the reason behind a particular behavior
that could not be noted in the survey. Therefore, in addition, the residents were asked to
write their general experiences and comments in a diary at the end of each day.
2.3.3. Energy and Temperature Loggers
The indoor temperature of each room of the three dwellings was measured every
15 min with a hobo u12-012 data logger. The dataloggers were placed close to the standstill
locations at the height of the residents, e.g., on the coffee table in the living room. For
the outdoor temperature, monthly average temperature values, measured by the Royal
Meteorological Institute of Belgium measured in the city of Ukkel [47], are used, because
measurements with data loggers are less accurate.
Multiple energy loggers (Profile 194670369) were installed to measure the energy
consumption of the different personal heating systems during the experiment. When
multiple personal heating elements were used simultaneously in one place, such as a heated
cushion in combination with a heated floor mat at the desk, the total energy consumption
of the combination of elements was measured. The energy consumption of the radiation
panels was measured separately.
Additionally, the total gas consumption for heating in dwelling 3 was measured
by making use of the installed gas meter. It was not possible to measure the energy
consumption of the traditional heating system to a sufficiently detailed level for dwelling 1
and dwelling 2.
2.4. Statistical Data Analysis
In this research, several parameters are evaluated. For the outdoor temperature,
monthly average values are used as provided by the Royal Meteorological Institute
of Belgium [47].
For the indoor ambient temperature, average values are calculated for the main
rooms of the three dwellings for the reference period (Ref.) and for the period of the
experiment with personal heating systems (Exp.). For each period, distinction is made
between the average temperature for the entire period, including measured temperatures
during inoccupancy and night setback, and the average temperature during occupation.
The average temperature for the entire period is used for calculations of the energy-saving
potential. The average temperature during occupation is used to interpret the “right-here-
right-now” thermal comfort survey results. Results can be found in Section 3.1.
The thermal sensation and thermal comfort votes were analyzed based on the number
of votes. For each point of the Likert scale, the percentage of votes is calculated compared
to the total number of votes. Both the results per individual resident as well as the average
results for all residents are given. To avoid a dominant effect of the votes of residents
who voted more often than others, the average thermal sensation and thermal comfort is
calculated as a weighted average of all residents. Results are presented in Section 3.3. No
further statistical analysis was done on the data since the limited number of participants
and the limited dataset does not allow for statistical significance estimations.
The energy-saving potential is calculated by normalizing the measured actual heating
energy consumption in dwelling 3 by the method of heating degree days [48]. Based on
the average number of heating degree days from the last ten years in Belgium, the yearly
energy consumption can be calculated. The energy savings are quantified by subtracting
the energy consumption of the personal heating systems from the energy savings obtainedSustainability 2021, 13, 7257 10 of 27
by lowering the ambient temperature. The yearly consumption of the personal heating
systems is calculated by the measured energy consumption during an average heating
period in Belgium.
2.5. Limitations of This Research
Limitations of this first investigation of personal heating practices in a residential
context show challenges for future research. As in this study, only a small number of
Flemish residents between 25 and 30 years old were involved; additional research for
other age groups and in other climatic or cultural contexts is needed since perceptions
and preferences are age-dependent and diverse for every climate and culture [49]. The
experiment only lasted for a relatively short period during winter due to the need for
heating, and so long-term experiments should be considered in the future. Additionally, all
dwellings involved in this research did not comply with the current building standards.
Investigating the application of personal heating in new high-performance buildings as
a complementary heating practice might show additional benefits.
3. Results
3.1. Environment
3.1.1. Outdoor Temperature
The outdoor temperature in the winter period of 2019–2020 was higher than in
an average Belgian winter. Table 5 shows the monthly average and the monthly maximum
and minimum outdoor temperature. The monthly mean temperature varied between
5.9 ◦ C in January and 7 ◦ C in February.
Table 5. Monthly mean, monthly average maximum and minimum outdoor air temperatures [47].
December 2019 January 2020 February 2020
Average outdoor temperature 5.9 ◦C 5.9 ◦C 7.0 ◦ C
Minimum outdoor temperature −2.5 ◦C −2.4 ◦C −0.9 ◦ C
Maximum outdoor temperature 15.4 ◦ C 12.4 ◦ C 16.6 ◦ C
Days minimum outdoor temperature < 0 ◦C 6 6 2
Days maximum outdoor temperature < 0 ◦C 0 0 0
Average winter outdoor temperature 3.9 ◦ C 3.3 ◦ C 3.7 ◦ C
3.1.2. Indoor Temperature
Although residents were asked to lower the indoor temperature to 18 ◦ C, Figure 2
shows that the actual temperature varied over time and across different dwellings. In
dwelling 1 (blue bars in Figure 2), the temperature during the experiment was very low
due to the limitations of the installed electric accumulation and electric convection heaters,
but it appeared that the temperature during the reference period was also lower than in
an average dwelling. At the moment of responding to the survey questions (Occupation),
the average temperature in dwelling 1 was 15.8 ◦ C during the reference period with the
common heating practice and 12.7 ◦ C during the experiment with the personal heating
systems. The resident of dwelling 1 did not use the dining room during the experiment,
causing a no information on the temperature during occupation in the dining room. In
dwelling 2 (yellow bars in Figure 2), the average occupancy temperature was 19.4 ◦ C
during the reference period and ±18.6 ◦ C during the experiment. In dwelling 3 (green bars
in Figure 2), the average occupancy temperature during the reference period was 20.8 ◦ C
and 17.4 ◦ C during the experiment. The residents of dwelling 3 did not evaluate their
thermal comfort in the kitchen, causing no information on the temperature in this room
during occupation.causing a no information on the temperature during occupation in the dining room. In
dwelling 2 (yellow bars in Figure 2), the average occupancy temperature was 19.4 °C dur-
ing the reference period and ±18.6 °C during the experiment. In dwelling 3 (green bars in
Figure 2), the average occupancy temperature during the reference period was 20.8 °C
and 17.4 °C during the experiment. The residents of dwelling 3 did not evaluate their ther-
Sustainability 2021, 13, 7257 11 of 27
mal comfort in the kitchen, causing no information on the temperature in this room during
occupation.
30
Indoor temperature [°C]
25
20
15
10
5
0
Ref. Exp. Ref. Exp. Ref. Exp. Ref. Exp. Ref. Exp.
Bathroom Bedroom Dining room Kitchen Living room
Case 1 Entire period Case 1 Occupation Case 2 Entire period
Case 2 Occupation Case 3 Entire period Case 3 Occupation
Figure
Figure 2. Mean
2. Mean indoor
indoor ambient
ambient temperature
temperature in different
in different roomsrooms
of the of thedwellings
three three dwellings
with thewith
com-the
moncommon
heatingheating
practicepractice (ref.)
(ref.) and and the
during during the experimental
experimental set-up
set-up with with personal
personal heating
heating (exp.). A (exp.).
dis-
A distinction
tinction is made is made between
between the temperatures
the temperatures during theduring
entirethe entire measurement
measurement period andperiod and the
the temper-
atures at the moment
temperatures at the of responding
moment to the survey
of responding to thequestions (Occupation).
survey questions The temperatures
(Occupation). in the
The temperatures
kitchen
in theof case 2 of
kitchen contain
case 2presumably measuring
contain presumably errors due
measuring to the
errors due location of the data
to the location logger.
of the data logger.
3.2.
3.2. Diaries
Diaries ononthethe Personal
Personal Heating
Heating Practice
Practice
During the experiment, the residents
During the experiment, the residents noted noted their
their experience
experience toward
toward thermal
thermal comfort
comfort
with
with thethe personal
personal heatingpractice
heating practiceinina adiary
diaryon ona adaily
dailybasis.
basis.Overall,
Overall,the theresidents
residentsexpe-
experi-
enced the personal heating practice as comfortable despite the
rienced the personal heating practice as comfortable despite the lower indoor tempera- lower indoor temperature.
However,
ture. However, the the
residents diddid
residents notnot
always
always useuse
thethepersonal
personalheating
heatingsystem
systemsince, sometimes,
since, some-
they only stayed for a short period of time, especially in the morning,
times, they only stayed for a short period of time, especially in the morning, at specific at specific locations,
such as the
locations, such bathroom or the kitchen
as the bathroom or thetable.
kitchen Most of the
table. Mostresidents noted thatnoted
of the residents they did
thatnottheyuse
personal heating in the bathrooms, because it required a certain period
did not use personal heating in the bathrooms, because it required a certain period of time of time to achieve
to the maximum
achieve radiation temperature.
the maximum Resident 5Resident
radiation temperature. did use personal
5 did use heating in the
personal bathroom,
heating in
but she stated that she turned it on before entering the bathroom in order to experience the
the bathroom, but she stated that she turned it on before entering the bathroom in order
maximum temperature when entering the room.
to experience the maximum temperature when entering the room.
Some residents also noted that they were uncomfortable due to cold hands while
Some residents also noted that they were uncomfortable due to cold hands while
working at their computer.
working at their computer.
In the evening, the residents used the personal heating systems more often. During
In the evening, the residents used the personal heating systems more often. During
these moments, the residents were mostly comfortable with the personal heating practice.
these moments, the residents were mostly comfortable with the personal heating practice.
Despite the lower temperature, the residents did not experience discomfort while circu-
Despite the lower temperature, the residents did not experience discomfort while circu-
lating through their dwellings. However, one resident noted that she experienced a cold
lating through their dwellings. However, one resident noted that she experienced a cold
and uncomfortable feeling when she entered a cold house. The different residents also
and uncomfortable feeling when she entered a cold house. The different residents also
noted that they preferred one system above the other. The analysis of the diaries shows
noted
that that they preferred
residents 1, 4, and 5one systemthe
preferred above
heatedtheblanket
other. The
aboveanalysis of the diaries
the radiation shows
panel, whereas
that residents 1, 4, and 5 preferred the heated blanket above the radiation
residents 2 and 3 preferred to use the radiation panel instead of the heated blanket. panel, whereas
residents 2 and
Since this3 research
preferredmade
to use the
use ofradiation
off-the-shelfpanel insteadbecause
systems, of the heated blanket.
its focus was on evalu-
Since this research made use of off-the-shelf systems, because
ating the heating practice and not on the evaluation of the systems themselves, its focus was on eval-
residents
uating the heating practice and not on the evaluation of the systems
experienced some issues with the systems, themselves. A first comment was the required themselves, residents
experienced
power cables some issues
to feed thewith the systems,
elements, which werethemselves.
perceived A first commentin
as disturbing was the required
everyday life and
not practical to use. With regard to the heated blanket, the heating wires were noticeable
and disturbed one of the residents. Additionally, the control of the heated blanket was not
precise enough to provide the desired amount of heat for thermal comfort. Some residents,
especially resident 2, mentioned that level 1 was already too warm, while others used
the maximum level during some moments. In real-life applications, the personal heating
systems themselves can be further developed, but this is outside the scope of this research.Sustainability 2021, 13, 7257 12 of 27
3.3. Thermal Comfort Results Collected by the “Right Here Right Now” Survey
Sustainability 2021, 13, x FOR PEER REVIEW 13 of 28
During the experimental period, residents were asked to evaluate the personal heating
practice by a “right-here-right-now” survey. A total of 73 answers was collected by the
five residents involved in this experiment. In Figure 3, the reported thermal sensation and
thermal sensation of each individual resident while making use of active personal heating
thermal comfort are presented during the periods when the residents made use of active
is compared with the thermal sensation reported during the reference period. Addition-
personal heating systems (dark bars) as well as during the entire experiment when they
ally, the underlying reason why residents did not use the active personal heating elements
stayed at a specific location for a longer period of time (making use of a personal heating
is discussed based on the data from their diaries.
system or not, light bars).
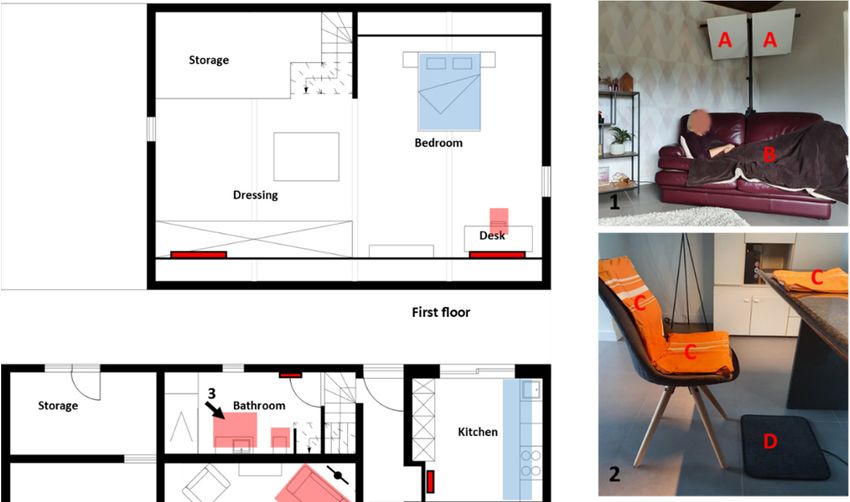
Figure 3. Thermal sensation and thermal comfort in the different rooms during the entire experi-
Figure 3. Thermal sensation and thermal comfort in the different rooms during the entire experimen-
mental period while using active, passive or no personal heating.
tal period while using active, passive or no personal heating.
With regard to thermal sensation during the entire period (Figure 3, left, light bars),
despite the lower indoor temperature in the dwellings, residents felt, on average 63%
of the time, “neutral” (43%) or “warmer than neutral” (20%). In 36% of the answers,
residents reported feeling “cooler than neutral”, of which only four times did they report
feeling “cool” (6%). With regard to thermal comfort (Figure 3, right, light bars), it appears
that, on average in 74% of their answers, the residents felt “slightly comfortable” or even
“very comfortable”. More specifically, the residents felt “slightly comfortable” (46%),
“comfortable” (13%) or “very comfortable” (15%). For 25% of the answers, residents
felt “slightly uncomfortable”, and only in 3% (two times in total) of the answers did the
residents evaluate the indoor environment as “uncomfortable”. A lower thermal sensation
was mainly found in the dining room and the bathroom, whereas a lower thermal comfort
was mainly found in the dining room and the bedroom.
However, the residents did not always make use of the personal heating systems,
depending on the location and due to several reasons, such as slow response, no need
during the short occupation time or because they were comfortable without active personal
heating systems. Active personal heating systems were primarily used in the living (75%)
Figure 4. Use of active personal heating elements, passive personal elements (such as a blanket) or
and dining room (79%). In the kitchen and the bedroom, no elements were used, and in the
no elements.
bathroom, only resident 5 made extensively use of the active personal heating (Figure 4).
3.3.1. Living Room
Thermal Sensation and Thermal Comfort in the Living Room during the Entire Experi-
mental PeriodSustainability 2021, 13, 7257 13 of 27
Figure 3. Thermal sensation and thermal comfort in the different rooms during the entire experi-
mental period while using active, passive or no personal heating.
Figure 4. Use of active personal heating elements, passive personal elements (such as a blanket) or
Figure 4. Use of active personal heating elements, passive personal elements (such as a blanket) or
no elements.
no elements.
3.3.1. Living Room sensation and thermal comfort when the residents made use of the active
The thermal
personal heating systems are also presented in Figure 3 (dark bars). While using active
Thermal Sensation
personal heatingand Thermal
systems, Comfort inwere
39 responses the Living Room
collected. during
The the thermal
average Entire Experi-
sensation
mental Period
while using active personal heating systems slightly increased (Figure 3, left, dark bars). At
70% of the answers, residents felt “neutral” (53%) or “warmer than neutral” (27%), and in
30%, the residents felt “slightly cool” (23%) or “cool” (7%). With regard to thermal comfort
(Figure 3, right, dark bars), the residents reported at 76% of the answers to be “slightly
comfortable” or higher, and 24% of the answers, “slightly uncomfortable”. More specifically,
residents reported 61% of the answers as “slightly comfortable”, 6% as “comfortable” and
even 10% as “very comfortable”.
In general, it can be found that residents were (slightly) comfortable with the indoor
climate during most of the situations and that the active personal heating systems had
a positive effect on their thermal sensation and thermal comfort. However, differences
can be found between the different residents and different rooms. Therefore, the results
of the individual rooms are discussed more in detail in the following subsections. First,
the thermal sensation and thermal comfort of the room during the whole experiment are
discussed, followed by the discussion of the thermal sensation and thermal comfort while
making use of the provided active personal heating elements. Subsequently, the reported
thermal sensation of each individual resident while making use of active personal heating
is compared with the thermal sensation reported during the reference period. Additionally,
the underlying reason why residents did not use the active personal heating elements is
discussed based on the data from their diaries.
3.3.1. Living Room
Thermal Sensation and Thermal Comfort in the Living Room during the Entire
Experimental Period
In the living room, residents generally spent their time on the couch for activities such
as watching television or eating. During the entire experiment in the living room, resident 1
wore very light clothing in 40% of the answers and casual clothing in 60% of the answers.
The clothing level of resident 2 varied between light clothing (25%), casual clothing (25%),
heavy clothing (25%) and clothing with an additional blanket (25%). Resident 3 wore
light clothing (20%), casual clothing (20%), 20% heavy clothing and 40% clothing with
an additional blanket. Resident 4 wore 66% very light clothing and one of the three times
an additional blanket in the living room. The clothing level of resident 5 varied between
light clothing (15%), casual clothing (50%) and clothing with an additional blanket 30%.resident 1 wore very light clothing in 40% of the answers and casual clothing in 60%
the answers. The clothing level of resident 2 varied between light clothing (25%), casu
clothing (25%), heavy clothing (25%) and clothing with an additional blanket (25%). Re
ident 3 wore light clothing (20%), casual clothing (20%), 20% heavy clothing and 40
Sustainability 2021, 13, 7257 clothing with an additional blanket. Resident 4 wore 66% very light clothing 14 of 27 and one
the three times an additional blanket in the living room. The clothing level of residen
varied between light clothing (15%), casual clothing (50%) and clothing with an addition
blanket 30%.
During the experiment,
During thethe residents the
experiment, quoted their quoted
residents thermaltheir sensation
thermalinsensation
the living in the livi
room most timesroomas most
“neutral”
times(48%) or “higher
as “neutral” (48%)than neutral”than
or “higher (27%), and 25%
neutral” found
(27%), and 25%it found
“cooler than neutral”
“cooler(voted as “slightly
than neutral” cool”
(voted and once
as “slightly as “cool”)
cool” and once (Figure 5). The
as “cool”) residents
(Figure 5). The residen
experienced theexperienced
indoor climate mostly as “slightly comfortable” (43%) or “comfortable
the indoor climate mostly as “slightly comfortable” (43%) or “comfortable or
higher” (42%). Only 15% of the time, the residents experienced it “slightly uncomfortable”
higher” (42%). Only 15% of the time, the residents experienced it “slightly uncomfortabl
(12%) or “uncomfortable” (3%). The lower
(12%) or “uncomfortable” (3%).thermal
The lower sensation
thermaland lower comfort
sensation and lowercancomfort c
mainly be assigned
mainlyto be
three residents:
assigned resident
to three 1, living
residents: in dwelling
resident 1, living 1inwith a much
dwelling lower
1 with a much low
ambient
ambient temperature temperature
(Figure (Figure
2), resident 2),resident
5, and resident2,5,whoanddidresident 2, whouse
not always did
annot always use
active
active
personal heating personal heating element.
element.
Figure 5. Figure
Thermal5.sensation
Thermal and thermal
sensation andcomfort in the
thermal livinginroom
comfort duringroom
the living the entire
duringexperiment
the entire(while using active,
experiment
passive or no personal heating) and while making use of active personal heating.
(while using active, passive or no personal heating) and while making use of active personal heating.
Thermal Sensation and Thermal Comfort in the Living Room While Making Use of Ac-
Thermal Sensation and Thermal Comfort in the Living Room While Making Use of Active
tive Personal Heating Elements
Personal Heating Elements
In the living room, during 68% of the answers, the residents used the heated bla
In the living room, during 68% of the answers, the residents used the heated blanket(s),
ket(s), the infrared panels or a combination of them. No large differences were found b
the infrared panels or a combination of them. No large differences were found between
tween the residents, except resident 1, who used it more often (90%). Resident 1 mos
the residents, except resident 1, who used it more often (90%). Resident 1 mostly used
used a combination of the radiation panel (80% of the time) and the heated blanket (90%
a combination of the radiation panel (80% of the time) and the heated blanket (90%), while
while residents 2 and 3 used the radiation panel more often (40% and 66%) than the heat
residents 2 andblanket
3 used(20%
the and
radiation panel more often (40% and 66%) than the heated
33%). Residents 4 and 5 only evaluated their thermal comfort while u
blanket (20% and ing the heated blanket. 5 only evaluated their thermal comfort while using
33%). Residents 4 and
the heated blanket. According to the diary of the residents, the main reason for not using the heati
Accordingelement
to the diary
is thatof thedid
they residents, the main
not experience reason
a cold for due
feeling not using the heating
to a previous activity, such
element is thatcooking,
they didshowering
not experience a cold feeling due to a previous activity, such aaspassive e
or entering the dwelling from outside, or were using
cooking, showeringmentor entering
such the dwelling
as an additional from outside, or were using a passive element
blanket.
such as an additional blanket.
When residents used the heating elements, they wore mostly light or casual clothing,
except resident 4, who wore very light clothing. During the active personal heating,
they quoted their thermal sensation in 45% of the time as “neutral”, 35% “warmer than
neutral” and, in 20%, “cooler than neutral” (Figure 5). Similar to the thermal sensation, the
thermal comfort was quoted higher when using a personal heating element: 52% “slightly
comfortable”, 42% “comfortable or higher” and only 6% “slightly uncomfortable”, which
is related to a cooler thermal sensation. The lower thermal sensation and thermal comfort
while using personal heating are only experienced by resident 1, living in the dwelling
with a low ambient temperature.
Figure 6 compares the reported thermal sensation during the common heating practice
without personal heating and during the experiment when the temperature is reduced, andYou can also read