Phase-field modelling for fatigue crack growth under laser-shock-peening-induced residual stresses - export ...
←
→
Page content transcription
If your browser does not render page correctly, please read the page content below
Noname manuscript No.
                                                    (will be inserted by the editor)

                                                    Phase-field modelling for fatigue crack growth under
                                                    laser-shock-peening-induced residual stresses
                                                    Martha Seiler · Sören Keller · Nikolai Kashaev · Benjamin Klusemann ·
                                                    Markus Kästner
arXiv:2011.13400v2 [cond-mat.mtrl-sci] 6 Apr 2021

                                                    Received: date / Accepted: date

                                                    Abstract For the fatigue life of thin-walled compo-          1 Introduction
                                                    nents, not only fatigue crack initiation, but also crack
                                                    growth is decisive. The phase-field method for fracture
                                                                                                                 Fatigue fracture is one of the most common causes of
                                                    is a powerful tool to simulate arbitrary crack phenom-
                                                                                                                 component failure. Still, the underlying physical phe-
                                                    ena. Recently, it has been applied to fatigue fracture.
                                                                                                                 nomena, especially on the microscale [2], are not fully
                                                    Those models pose an alternative to classical fracture-
                                                                                                                 understood. Simulating fatigue fracture, e. g. via the
                                                    mechanical approaches for fatigue life estimation. In
                                                                                                                 Finite Element Method (FEM), is often very time-con-
                                                    the first part of this paper, the parameters of a phase-
                                                                                                                 suming, as several hundred to millions of load cycles
                                                    field fatigue model are calibrated and its predictions
                                                                                                                 have to be simulated. Generally, the fatigue life of a
                                                    are compared to results of fatigue crack growth experi-
                                                                                                                 component until fracture can be divided into the crack
                                                    ments of aluminium sheet material. In the second part,
                                                                                                                 initiation and the crack propagation stage. While crack
                                                    compressive residual stresses are introduced into the
                                                                                                                 initiation often takes the major part, in thin-walled
                                                    components with the help of laser shock peening. It is
                                                                                                                 specimen like fuselage shells, crack growth is crucial for
                                                    shown that those residual stresses influence the crack
                                                                                                                 the design process. The growth rate of the long, visible
                                                    growth rate by retarding and accelerating the crack. In
                                                                                                                 cracks determines the maintenance interval.
                                                    order to study these fatigue mechanisms numerically, a
                                                    simple strategy to incorporate residual stresses in the          Particularly, residual stresses created by the process
                                                    phase-field fatigue model is presented and tested with       of laser shock peening (LSP) can be used to deliber-
                                                    experiments. The study shows that the approach can re-       ately influence the fatigue crack growth (FCG) rate of
                                                    produce the effects of the residual stresses on the crack    long cracks, as demonstrated for the aluminium alloy
                                                    growth rate.                                                 AA2024 [12, 37]. The application of laser shock peening
                                                                                                                 aims at the introduction of compressive residual stresses
                                                                                                                 in regions susceptible to fatigue, where the process pro-
                                                    Keywords Laser shock peening · Fatigue crack                 vides a relatively high penetration depth as well as sur-
                                                    growth · Phase-field modelling · Residual stresses           face quality [27]. These compressive residual stresses in-
                                                                                                                 teract with the applied stresses of the fatigue load cycles
                                                                                                                 and reduce the fatigue crack driving quantity. However,
                                                    M. Seiler and M. Kästner                                    compressive residual stresses are always accompanied
                                                    Chair of Computational and Experimental Solid Mechanics,
                                                    TU Dresden, Germany
                                                                                                                 by tensile residual stresses to meet stress equilibrium.
                                                    E-mail: markus.kaestner@tu-dresden.de                        While compressive residual stresses are expected to re-
                                                    S. Keller and N. Kashaev and B. Klusemann
                                                                                                                 tard the fatigue crack growth, tensile residual stresses
                                                    Institute of Materials Research, Materials     Mechanics,    may lead to increased fatigue crack growth rates reduc-
                                                    Helmholtz-Zentrum Geesthacht, Germany                        ing the fatigue life of the component, as shown by [17].
                                                    B. Klusemann                                                 Thus, the efficient application of residual stress modi-
                                                    Institute of Product and Process Innovation, Leuphana Uni-   fication techniques needs the precise prediction of the
                                                    versity of Lüneburg, Germany                                residual stress field to determine the FCG rate.
2 Martha Seiler et al.
In order to estimate the fatigue life of residual stress
affected components, mainly two types of models are Ω Ω
used. Empirical concepts based on Wöhler curves mostly
d=0
evaluate the fatigue life until crack initiation and often
treat residual stresses as mean stresses [18]. For the re- d=1
Γ Γ`
maining fatigue life during crack growth, models based 2`
on fracture mechanics are often used. In this context,
residual stresses can be applied with the eigenstrain
approach. The residual stress field is applied with the a) b)
help of a fictitious temperature field [3, 17] and consid-
Fig. 1 Fractured domain Ω with crack surface Γ . (a) Sharp
ered with effective stress intensity factors in the fatigue representation of crack topology. (b) Regularised representa-
crack growth computations. In contrast to the previ- tion: The crack is described by the phase-field variable d = 1,
ously mentioned approaches, in this contribution, an while d = 0 represents undamaged material. The crack is
regularised over the length scale `.
FEM framework is applied which covers both crack ini-
tiation and growth – the phase-field method. However,
the focus of this paper lies on the fatigue crack growth. ual stresses is explained. Section 3 deals with the LSP
The phase-field method has become a popular tool experiments for the creation of residual stresses, the ex-
to simulate fracture phenomena because of its capabil- perimental determination of the resulting residual stress
ity to treat arbitrary crack paths in a straight-forward state, as well as the FCG experiments. Section 4 con-
way. This is possible due to a second field variable which tains the numerical predictions of the proposed model
describes the crack topology, making mesh alterations including the model parameter calibration and the com-
due to crack growth redundant. Originally formulated parison to experimental results. The conclusion follows
for static brittle fracture [25] by simply regularising the in Section 5.
Griffith criterion [9] for crack growth, the phase-field
method has now been applied to a large variety of ma-
terials and phenomena like e. g. ductile fracture [23, 1]. 2 Model framework
However, the phase-field modelling of fatigue frac-
The model used in this publication is extensively de-
ture has been addressed only recently. While some mod-
scribed and qualitatively studied in [34]. Therefore, the
els reduce the crack resistance of the material as a result
model formulation is only outlined briefly here, starting
of its cyclic degradation [6, 34, 22], others increase the
with the basis of the framework, the phase-field method
crack driving force [32, 10]. There are first approaches to
for brittle fracture, as well as its extension to fatigue.
cover plastic [38] and viscous [20] materials. To tackle
Then, going one step further, the incorporation of resid-
the crucial problem of computational time when simu-
ual stresses in the model is described in detail.
lating repetitive loading, Loew et al. [21] and Schreiber
et al. [32] use cycle jump techniques. Seiler et al. [34]
approached the problem by incorporating a classic fa- 2.1 Phase-field method for fracture
tigue concept – the local strain approach (LSA) – into
the model, enabling the simulation of several load cy- The phase-field method for brittle fracture is based on
cles within only one increment. However, this model has the Griffith criterion [9] for crack growth, which re-
been studied only qualitatively. quires the energy release rate to be equal to the crit-
In this contribution, the phase-field fatigue model ical energy release rate or fracture toughness Gc . This
of [34] is calibrated and validated using FCG experi- criterion was brought to a variational form in [8] and
ments of aluminium AA2024. Moreover, a straightfor- regularised for convenient numerical implementation in
ward strategy to include residual stresses in the model is [5]. During the regularisation, an additional field vari-
presented. Additional FCG experiments are conducted able d ∈ [0, 1] is introduced. The diffuse description of
with specimen in which residual stresses are introduced the crack smoothly bridges the entirely intact (d = 0)
deliberately with LSP. Those residual stresses are anal- and totally broken (d = 1) state. In this way, the crack
ysed with the incremental hole drilling method and topology can be described without any mesh modifica-
serve as an initial state for the fatigue simulation. tions, allowing for a straightforward modelling of arbi-
The paper is structured as follows: In Section 2, the trary crack paths. See Fig. 1 for a graphical explanation
model formulation is recapitulated, including the un- of the regularisation.
derlying phase-field equations for brittle fracture and Using the regularisation length scale `, the regu-
its extension to fatigue, and the incorporation of resid- larised energy functional Π` in the domain Ω can bePhase-field modelling for fatigue crack growth under laser-shock-peening-induced residual stresses 3
Linear elastic Neuber’s Stress-strain Damage Wöhler Damage
simulation rule path parameter curves accumulation
σ∗ PSWT
σ∗ PSWT ∆D = 1/N
σ, ε
∗
σ ,ε ∗
∗
σa∗ D=
P
∆D
σm
CSSC ε∗
ε∗ N
ε∗
a
Fig. 2 Scheme of local strain approach (LSA), with which the fatigue life variable D is determined at every material point.
written as This process is described by introducing a local life-
Z Z
1 time variable D. An additional scalar fatigue degrada-
Π` = g(d) ψ e (ε) dV + Gc (d2 + `2 |∇d|2 ) dV. (1) tion function α(D) : [0, 1] → [α0 , 1] with α0 > 0 is intro-
Ω Ω 2`
duced, which lowers the fracture toughness Gc locally.
In the small strain linear elastic setting. The elastic The energy functional then reads
strain energy density is Z
1 1 Π` = g(d) ψ e (ε) dV
ψe = λ tr2 (ε) + µ tr(ε2 ) = ε : C : ε (2) Ω
2 2 Z (7)
1
with the Lamé constants λ and µ, the elasticity tensor + α(D) Gc (d2 + `2 |∇d|2 ) dV,
Ω 2`
C and the strain
1 which leads to the modified phase-field evolution equa-
∇u + (∇u)> .
ε= (3) tion
2
The degradation function g(d) = (1 − d)2 models the Gc α d − ∇α · `2 ∇d − α `2 ∆d = (1 − d) H 2`
(8)
loss of stiffness due to the developing crack, coupling
displacement field u and phase-field d. Consequently, with the dependency α(D) dropped for brevity.
the stress is given by The lifetime variable D ∈ [0, 1] is a history variable
that is accumulated strictly locally. For D = 0, the
∂ψ e
σ = g(d) = g(d) C : ε. (4) material has experienced no cyclic loads and therefore
∂ε offers full fracture toughness. Consequently, α(0) = 1
The governing equations of the coupled problem ob- must hold. For D = 1, the fracture toughness is re-
tained from the variation δΠ` = 0 duced to a threshold value α0 . Therefore, the fatigue
degradation function
Gc d − `2 ∆d = (1 − d)2` ψ e (ε) (5)
0 = div σ
| {z }
H α(D) = (1 − α0 )(1 − D)ξ + α0 (9)
are subject to the boundary conditions n·σ = t̃, u = ũ with the parameters α0 and ξ is used. For a study of the
and n · ∇d = 0 with t̄ and ū being the prescribed trac- influence of the model parameters α0 and ξ, see Sec. 4.1
tions and displacements on the corresponding bound- and [34].
aries, respectively.
To ensure crack irreversibility, in Eq. (5), the crack
driving force H in each point x is set to its temporal Local strain approach
maximum [23]
The computation of the lifetime variable D follows the
e LSA [33]. This method is generally used for fatigue life
H(x, t) = max ψ (ε(x, s)). (6)
s∈[t0 ;t]
calculations of components, but is implemented here in
the material routine of the FEM framework and there-
2.2 Extension to fatigue fore executed at each integration point.
The computation scheme is illustrated in Fig. 2. At
Fatigue degradation first, the stresses and strains from a linear elastic sim-
ulation are revaluated using the Neuber rule [26]. The
In order to incorporate fatigue into the phase-field frame- von Mises equivalent stress σ is projected to the cyclic
work, the fracture toughness Gc is reduced when the ma- stress-strain curve (CSSC) yielding a virtual, revalu-
terial degradation due to repetitive stressing precedes. ated stress-strain pair (σ ∗ , ε∗ ) by assuming a constant4 Martha Seiler et al.
strain energy 21 σε = 21 σ ∗ ε∗ . The CSSC is thereby de-
scribed by the Ramberg-Osgood equation [30] Process
σ
σc
∗ 1/n0 Cyclic
∗ σ∗ σ
ε = + (10) loading σ0 εc
E K0 σ0 unloaded H
with the cyclic parameters K 0 and n0 and Young’s mod-
ulus E. It can be determined from standardised cyclic εp ε0 ε0,el ε
experiments such as the incremental step test. In this (a) ε0,el (b)
way, the complete virtual stress-strain path can be de-
rived from the loading sequence. This stress-strain path Fig. 3 (a) Formation of residual stresses σ0 through plas-
tic deformation. Remaining strain after unloading is ε0 =
is divided into hysteresis loops. For each loop i, the εp + ε0,el . (b) Material law for cyclic simulation. Initial state
damage parameter by Smith, Watson and Topper [35] (σ0 , ε0,el ) undergoes cyclic load with (σc , εc ). Crack driving
q force H is strain energy density of total stress-strain state
PSWT,i = (σa,i ∗ + σ ∗ )ε∗ E (11) (σ, ε). Schemes of 1D, undamaged (d = 0) case.
m,i a,i
can be determined from the stress and strain ampli-
tudes σa∗ and ε∗a and the mean stress σm∗
. It quantifies consists of an elastic part ε0,el and a plastic part εp , see
the damaging effect of the loop. Only the tensile range Fig. 3(a). While the total residual strain ε0 is geometri-
contributes to PSWT , see Fig. 2. From strain Wöhler cally compatible, this does not apply to its components
curves (SWC) – also generated with standardised ex- εp and ε0,el .
periments – the matching virtual load cycle number Ni Only the elastic part ε0,el of the residual strain ε0 is
for PSWT,i can be read. Finally, the fatigue life contri- relevant for the fatigue life simulation. The plastic form-
bution of the single hysteresis loop ∆Di and the full ing process is treated as completed and is not modelled.
loading path is The plastic part εp is not of further interest in the fa-
∆Di = 1/Ni and D = Σi ∆Di . (12) tigue crack simulation, because it is assumed that the
yielding process does not change the crack resistance
∗
Note, that the revaluated stresses and strains σ and properties of the material [39]. All material points are
ε∗ are solely used for the damage calculation and are assigned the same material parameters initially, regard-
not used in the coupled problem in any other way. less of their (plastic) history. Therefore the total stress-
In conclusion, the integration of fatigue in the phase- strain state (σ, ε) in the model is the sum of the initial
field model with the LSA is beneficial for the computa- state (σ 0 , ε0,el ) and the stress-strain state caused by
tional cost in three ways: the cyclic loading (σ c , εc ). Hence, the total strain is
1. Local cyclic plasticity is covered by the Neuber rule,
so no elastic-plastic material model is needed. ε = ε0,e + εc (14)
2. Since only amplitude and mean values of stress and
strain enter the calculation of D, the loading path as displayed in Fig. 3(b). Thereby, the strain εc is
does not have to be resolved in the simulation, in-
1
stead the reversal points are sufficient. ∇u + (∇u)> .
εc = (15)
3. In case of constant load amplitudes and small crack 2
growth rates, several load cycles can be simulated The regularised energy functional is, analogously to
with only one increment, since the lifetime contribu- Eq. (7),
tions are accumulated linearly according to Eq. 12.
Especially for high cycle fatigue, this can save im-
Z
Π` = g(d) ψ e (ε0,e + εc ) dV +
mense computational time. Ω
Z (16)
1
+ α(D) Gc (d2 + `2 |∇d|2 ) dV.
2.3 Incorporation of residual stresses Ω 2`
Consequentially, the stress is
Residual stresses result from plastic deformations which
occur during the production process, e. g. due to form-
σ = g(d) (σ 0 + σ c ) = g(d) (σ 0 + C : εc ) . (17)
ing, tempering or surface treatment. The stress remain-
ing after unloading is the residual stress σ 0 . The asso-
and the evolution equation remains
ciated strain
Gc α d − ∇α · `2 ∇d − α `2 ∆d = (1 − d) H 2`.
ε0 = ε0,el + εp (13) (18)Phase-field modelling for fatigue crack growth under laser-shock-peening-induced residual stresses 5
No Tensile Compressive crack driving force H which depends on the strain
residual stress residual stress residual stress energy density ψ e (ε).
2. They shift the virtual stress-strain path and there-
(σ, ε)
(σ, ε) fore influence the damaging effect and with that the
(σ ∗ , ε∗ ) (σ, ε)
(σ ∗ , ε∗ ) lifetime variable D. Compressive residual stresses
(σ ∗ , ε∗ )
∗
∗
σm reduce D, while tensile residual stresses increase it.
σm σ0 ∗
ε0,el σm
The initial residual stress tensor σ 0 remains un-
ε0,el
PSWT PSWT PSWT changed throughout the simulation. Residual stress re-
σ0
distribution due to wide-ranging plasticising is therefore
Fig. 4 Comparison of virtual stress-strain path with and not covered in the model, since this is only relevant for
without residual stress σ0 . Constitutive stress-strain be- very low cycle fatigue with macroscopic plastic defor-
haviour ( ) for 1D, undamaged (d = 0) case. For the com- mations [3]. However, as cracks propagate, the stress
putation of the lifetime variable D, the virtual stress-strain
path ( ) is used, which is determined from the CSSC ( ). state is rearranged due to degradation of the total stress
∗
Mainly, the residual stress shifts the virtual mean stress σm , (Eq. 17) which also affects the residual stresses. In this
which controls the damage parameter PSWT (schematically). way, the residual stress state redistributes compared to
the initial state σ 0 due to FCG.
The crack driving force is the temporal maximum of
the strain energy density of the total stress strain state
3 Experiments
H(t) = max (ψ e (ε0,el + εc (s))) (19)
s∈[t0 ,t]
The fatigue crack growth influenced by residual stresses
1 is investigated with compact tension (C(T)) specimens,
= max (ε0,el + εc (s)) : C : (ε0,el + εc (s)) .
s∈[t0 ,t] 2 where significant residual stresses are introduced by
(20) LSP. The material under investigation is the aluminium
alloy AA2024 in T3 heat treatment condition with 2 mm
The initial state at the time t0 is hereby ε = ε0,el ,
and 4.8 mm thickness, which is a representative alu-
σ = g(d) σ 0 .
minium alloy used in the aircraft industry for fuse-
The superposition of residual stress state and the
lage structures [7]. The previous investigation [17] in-
stress state caused by external loading is actually also
dicates that LSP allows the introduction of relatively
common in fracture-mechanical fatigue computations
high and deep residual stresses, where the microstruc-
based on stress intensity factors [19]. Note that since
tural changes in AA2024 does not influence the FCG
ε0,el is not necessarily geometrically compatible, the to-
behaviour significantly. Thus, differences in the FCG
tal strain ε is not, either.
rates between untreated and laser peened material are
It is assumed that the plastic strains do not enter the
mainly linked to the effect of residual stresses. In the
crack driving force. Instead the crack is driven by the
following the LSP treatment, the experimental resid-
elastic strain energy density, which again only depends
ual stress determination and the determination of the
on the total elastic strain. This assumption is appro-
fatigue crack growth rate are described. The experi-
priate for typical HCF and higher LCF loads which do
mental data for specimens with thickness of 4.8 mm are
not exceed the static yield limit.
taken from [13] and [17].
Fig. 4 depicts how the residual stresses affect the
LSA procedure: Due to the initial state, the Neuber
rule yields a shifted stress-strain path. Although the
3.1 Laser shock peening
stress and strain amplitude stay the same, the dam-
age parameter PSWT is affected by the altered mean
∗ LSP uses short-time high-energy laser pulses to gen-
stress σm according to Eq. 11. In this way, tensile resid-
erate plasma consisting of near-surface material, see
ual stresses increase the damage parameter PSWT while
Fig. 5. The extension of the plasma generates mechan-
compressive residual lead to a decrease.
ical shock waves, which cause local plastic deformation
In summary, residual stresses influence the crack de-
of the subsurface material, see Fig. 5(b). After relax-
velopment in two ways:
ation of the high dynamic process, these local plastic
1. They change the peak stress-strain state of a load deformation lead to a residual stress distribution, where
cycle which is decisive for the crack development in compressive residual stresses remain in the subsurface
a cyclic load. In this way, tensile residual stresses region surrounded by balancing tensile residual stresses,
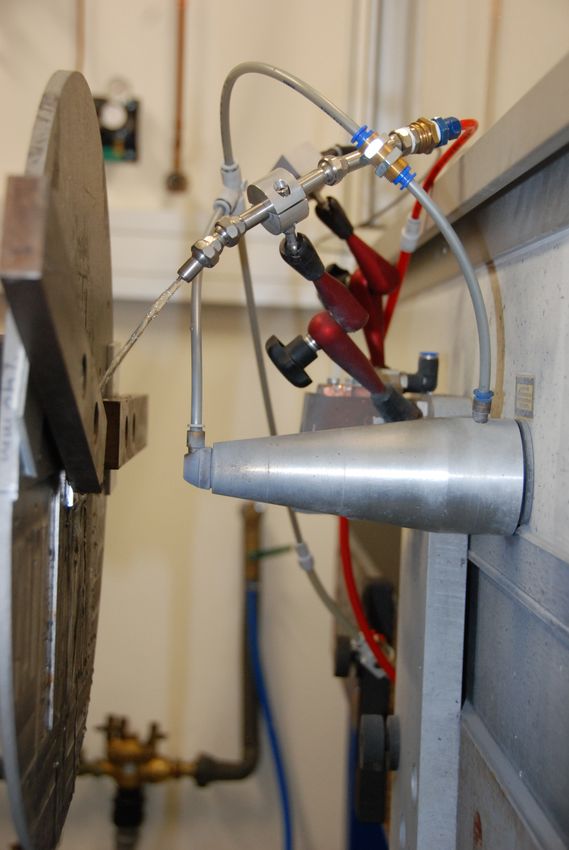
increase, compressive residual stresses decrease the Fig. 5(c). The penetration depth of these compressive6 Martha Seiler et al.
(a) (b) target material (a) 40 mm (b)
water layer
12.5 mm 15 mm peening patch
Nd:YAG laser clamping system 3 mm
laser pulse
3 mm
plasma formation
water beam
mechanical shock wave
(c)
plastically elongated material
rolling direction
(compressed area)
rolling direction
positions of
120 mm
80 mm
y residual stress
plastically undeformed determinations
laser pulse
material (partially
z tensioned area)
Fig. 5 LSP laser system containing the pulsed Nd:YAG laser
and clamping system fixing the specimen. Laser pulses are
used to vaporize near-surface material to initiate mechanical
shock waves (b). These shock waves cause local plastic de- y 1. 2. 3. 4. 5. y
20 mm
formations, which lead to a residual stress distribution after advancing
the process (c). A water layer increases the efficiency of the direction
process by confining the plasma.
x x
Fig. 6 Schematic of the specimens used to evaluate the
residual stresses is in millimeter range. The efficiency LSP-induced residual stress state (a). 5 J laser pulses with
a 3 mm × 3 mm square laser focus are used to treat a region
of the process can be increased by the use of a confine- with size 15 mm×80 mm. The laser pulse sequence consists of
ment layer. A laminar water layer is used during the five columns in which the laser pulses are shot without over-
LSP process in this study as confinement medium. The lap. The advancing direction of each column is kept constant.
LSP treatment is conducted with an Nd:YAG laser. 5 J The sequence is applied twice at both sides of the sheet ma-
terial. Residual stresses were experimentally determined by
laser pulses with the duration of 20 ns (full width at incremental hole drilling (b), where the same depth profile
half maximum) and a 3 mm × 3 mm square focus are of residual stresses is assumed below the peening patch.
used. The LSP treatment is performed without pulse
overlap in five columns on the sheet material, as shown
in Fig. 6(a). The laser pulse sequence of a rectangular determined from both material sides. As it is recom-
peening patch with 15 mm × 80 mm is applied twice at mended that the material thickness is four times larger
both sides of the sheet material. The sequence is shot than the hole diameter [29], the residual stress deter-
at the first side twice before the second side was treated minations of AA2024 with 2 mm thickness where re-
twice as well. peated with a hole diameter of 0.5 mm as well. The
determined residual stresses with the hole diameter of
0.5 mm and 2 mm match. Therefore, we focus on the
determined residual stresses with the hole diameter of
3.2 Experimental residual stress determination 2 mm in the following. A relative small increment size
is used near the material surface, where relatively large
The incremental hole drilling system PRISM from residual stress gradients are expected. Residual stresses
Stresstech is used to determine the depth profile of were determined within the area of the peening patch,
the residual stresses. The hole drilling system uses elec- see Fig. 6(b). The depth profile of residual stresses is
tronic speckle pattern interferometry to determine ma- assumed to be the same below the whole peening patch.
terial surface deformation after each increment of an Thus, the average value and the standard deviation of
incrementally drilled hole. These surface deformations at least eight experimentally determined residual stress
are correlated with the residual stress at the respective profiles for both material sides are depicted in the fol-
increment depth via the integral method [31]. The in- lowing.
terested reader is referred to [28, 29, 36] for a detailed
explanation of the incremental hole drilling method us-
ing electronic speckle pattern interferometry. A driller 3.3 Fatigue crack growth
with 2 mm diameter is used to determine the residual
stresses up to the depth of 1 mm. This hole depth al- C(T) specimens with a width of 100 mm are used to de-
lows for the experimental determination of the through termine the FCG rate according to ASTM E647 stan-
thickness residual stress profile within the specimens dard. The FCG tests were performed with the servo
with 2 mm thickness, when the residual stresses are hydraulically testing machine from Schenk/Instron andPhase-field modelling for fatigue crack growth under laser-shock-peening-induced residual stresses 7
125 mm The residual stress components σxx and σyy in sur-
face plane direction differ, whereby the magnitude of
the component perpendicular to the crack growth di-
15 mm
10 mm rection, σyy , is more pronounced. This difference of
the residual stress components might be attributed to
peening patch geometrical effects, such that the rectangular peening
patch geometry, as experiments with a square peening
patch do not indicate this significant difference of σxx
20 mm and σyy in aluminium alloy AA2024 [17].
rolling direction
120 mm
The residual stress magnitude and gradient differ
5 mm (pre crack) significantly depending on the material thickness. The
LSP-treated aluminium alloy with 2 mm thickness con-
tains a lower maximum compressive residual stress of
y approximately 160 MPa compared to the compressive
maximum of approximately 280 MPa in the 4.8 mm thick
material. While tensile residual stresses occur at mid-
dominated by tensile dominated by compressive
residual stresses σyy residual stresses σyy thickness for the thicker material, the residual stress
component σyy is completely compressive along the z
x direction for the 2 mm thick material.
Fig. 7 C(T) specimen with 100 mm width according to The resulting residual stress field depends on the
ASTM-E647 standard. The specimen is pre-cracked by 5 mm order of the applied pulse sequences on the two sides.
and subsequently peened with 10 mm distance to the crack
These differences are more pronounced for the thinner
front of the pre-crack. C(T) specimens are treated twice from
both surfaces of the sheet material. The introduction of com- material. The non-symmetric residual stress profile is
pressive residual stresses below the peening patch lead to bal- assumed to result from the interaction of mechanical
ancing tensile stresses in the surrounding material. shock waves initiated at the secondly peened side at z =
2 mm and already existing residual stresses introduced
by the LSP treatment of the first side at z = 0 mm.
a 25 kN load cell. The specimen geometry is displayed
These interactions result in increased residual stresses
in Fig. 7. A pre-crack of 5 mm is introduced extend-
between 0.4 – 0.9 mm depth.
ing the initial crack length to 25 mm (20 mm notch and
5 mm pre-crack). Afterwards, the peening patch, as de- It has to be noted, that the peening patch surround-
scribed in Sec. 3.1, is applied 10 mm in front of the ing material in x-y direction contains balancing tensile
initial crack front to the LSP treated specimens. The residual stresses. A detailed analysis about the overall
applied load ratio R = 0.1 is kept constant during the residual stress field of the C(T) specimen after the LSP
FCG test. The maximum applied force of the fatigue treatment in AA2024 for 4.8 mm thickness can be found
load load cycles is 1.65 kN and 4.0 kN for specimens in [17].
with 2 mm and 4.8 mm thickness, respectively. All FCG
experiments are repeated at least twice. Fatigue crack growth
Experimentally determined FCG rates of the untreated
3.4 Experimental results material show the typical exponential correlation be-
tween FCG rate da/dN and stress intensity factor range
Residual stresses ∆K known for the Paris regime, see Fig. 10. This char-
acteristic FCG behaviour is significantly affected by the
The LSP treatment leads to the introduction of signifi- introduced residual stresses for both investigated mate-
cant compressive residual stresses over the thickness for rial thicknesses. For the LSP-treated samples, the FCG
the investigated AA2024, see Fig. 8 for 2 mm thickness rate increases between the initial crack front and the
and Fig. 9 for 4.8 mm thickness, respectively. peening patch. This increased FCG rate is attributed
Since the residual stresses are only determined up to balancing tensile residual stresses, as indicated in
to a depth of 1 mm from each side with the incremental Fig. 7. Thereafter, the FCG rate decreases up to a min-
hole drilling technique, numerical simulations via a LSP imum at a ≈ 49 mm, when the crack front is located
process simulation, as described elsewhere [16, 17] are within the area of the peening patch. After the crack
used to estimate the residual stress profile along the front has passed the peening patch, the FCG rate ac-
entire material cross-section in z direction. celerates, but stays below the FCG rate of specimens8 Martha Seiler et al.
peened area
10−2
100
Residual stress / MPa
2 mm
0 10−3
dN cycle
da mm
/
-100
10−4
BM
-200
LSP
0.0 0.5 1.0 1.5 2.0 10−5
Depth / mm 20 30 40 50 60
a/mm
σBM,xx σLSP,xx
σBM,yy σLSP,yy
peened area
10−2
Fig. 8 Residual stress profile of the base material (BM) and
after LSP in AA2024 with 2 mm thickness. The average value 4.8 mm
and standard deviation are depicted. At least seven depth
profiles were experimentally investigated. At first, LSP was 10−3
dN cycle
da mm
applied at 0 mm and secondly from the other side of the spec-
imen at 2 mm. The LSP treatment leads to compressive resid-
/
ual stresses along the entire material thickness.
10−4
BM
LSP
100
Residual stress / MPa
−5
10
20 30 40 50 60
0
a/mm
-100 Fig. 10 FCG rate in AA2024 with 2 mm and 4.8 mm thick-
ness in BM and LSP-treated material. The introduced resid-
-200 ual stress field leads to an accelerated FCG in front of the
peened area and a FCG retardation when the crack front is
located within the peening patch. The different curves, rep-
-300 resent the repeated experiments. The data for the 4.8 mm
specimen are taken from [17]
0 1 2 3 4 5
Depth / mm
σBM,xx σLSP,xx σLSP,xx (Sim.) the material thickness of 2 mm allows the experimen-
σBM,yy σLSP,yy σLSP,yy (Sim.) tal determination of residual stresses over entire ma-
terial thickness, the relatively thin material may lead
Fig. 9 Experimentally determined and numerically calcu-
lated (Sim.) residual stresses after LSP treatment in AA2024 to buckling during the fatigue testing at larger crack
with 4.8 mm thickness. The firstly treated side is at 0 mm. The length. These buckling phenomena are indicated from
numerically determined residual stress profile shows tensile a > 50 mm and may cause the increased scatter of the
residual stresses at mid-thickness (1.8-3.0 mm). The residual experimentally determined FCG rate for the material
stress profiles are taken from [13] (BM) and [17] (LSP).
thickness 2 mm.
without LSP treatment. This characteristic FCG be-
haviour is observed for both material thicknesses. 4 Simulation of fatigue crack growth
The observation of the increased FCG rate high-
lights the importance of the overall residual stress field In the following, the phase-field model described in Sec. 2
for an efficient application of residual stress modifica- is used to simulate the fatigue crack growth experiments
tion techniques, such as LSP. Furthermore, tools for described in Sec. 3.3. Starting with an unpeened spec-
FCG rate calculation need to contain the prediction of imen, model parameters are studied and the model is
this possible increase of the FCG rate as well. While calibrated to one fatigue crack growth curve. With thePhase-field modelling for fatigue crack growth under laser-shock-peening-induced residual stresses 9
Table 1 Material parameters of aluminium AA2024-T3 used
in phase-field simulations. 10−1
Elastic constants [4] E = 74.6 GPa ν = 0.33
CSSC [4] K 0 = 0.453 GPa n0 = 0.201 10−2
dN cycle
SWC [4] σf0 = 0.314 GPa ε0f = 0.162
da mm
b = −0.091 c = −0.452
10−3
/
Fracture toughness [14] Gc = 0.165 MPa m
ξ = 500
10−4
calibrated model parameters, the other unpeened and ξ = 1000
ξ = 1500
peened specimens are simulated.
10−5
For all simulations, a staggered solution scheme [11] 101
√
is applied to solve the coupled problem with mechanical ∆K/GPa mm
field and phase-field. A structured, locally refined mesh
with a minimum mesh size of hmin = 0.33 mm is used. 10−1
Due to the thin specimens, a plane stress state is as-
sumed. The plane stress assumption is supported by the
experimental determination of the residual stress com- 10−2
ponent perpendicular to the material surface (σzz ≈ dN cycle
da mm
0 mm) after LSP application via synchrotron radiation 10−3
/
in [15]. As comparative computations showed, a tension-
compression split, see [24], is not necessary for the sim-
α0 = 0.0002
ulations due to the simple stress state of the specimen. 10−4
α0 = 0.001
The characteristic length is set to ` = 1 mm as a com- α0 = 0.002
promise between mesh refinement and accuracy. The 10−5
elastic, cyclic and fracture-mechanical parameters for 101
√
the AA2024-T3 material taken from literature are spec- ∆K/GPa mm
ified in Tab. 1. Fig. 11 FCG rate for range of stress intensity factor ∆K
The specimen are loaded by cyclic loading with force (Paris curves). Study of the exponent ξ and the threshold α0
ratio F̃min /F̃max = 0.1. The force boundary condition of the fatigue degradation function.
was kept to F̃max throughout the simulation. This is
possible due to the model formulation with the LSA.
The damage parameter PSWT only needs amplitude and over the range of the stress intensity factor. The varia-
mean stress values as an input, see Sec. 2.2. Therefore, tion of the threshold value α0 while keeping ξ = 1000
a simulation of the full loading path is not necessary for shows its influence on the inclination and curvature of
the damage calculation. Due to the constant amplitude the Paris curve. For α0 = 0.002, the graph is a straight
loading, several load cycles ∆N can be simulated within line in the double logarithmic plot, which is typical for
one increment. ∆N is reduced adaptively depending most crack growth experiments. Varying the exponent ξ
on the number of Newton iterations required to in the while keeping α0 = 0.002 shifts the Paris curve in verti-
staggered loop, starting with ∆N = 3000. cal direction. For a study of the influence of the model
parameters on crack initiation, the reader is referred to
[34].
4.1 Unpeened specimens
Model parameters Model calibration
The parameters of the fatigue degradation function (9), The different effects of the two parameters allow for
α0 and ξ, are the only model parameters that have to a convenient calibration of the model. Here, a fatigue
be calibrated apart from the characteristic length `. crack growth experiment with the 2 mm thick specimen
All other parameters – listed in Tab. 1 – are drawn loaded with F̃max = 1.65 kN, which was repeated three
from standardised experiments. The influence of the times, is used for calibration. The fit of the Paris curve
fatigue degradation function is studied on the 4.8 mm yielded the model parameters α0 = 0.0015 and ξ = 500
thick specimen loaded with F̃max = 4 kN. Fig. 11 shows as displayed in Fig. 12. The figure also shows the dis-
the results as a Paris plot, i. e. the crack growth rate tribution of the fatigue degradation α and the crack10 Martha Seiler et al.
1
10−2
dN cycle
da mm
10−3
/
0
α d 10−4
a) b)
Simulation
Experiments
10−5
10−2 101
√
∆K/GPa mm
dN cycle
da mm
Fig. 13 Fatigue crack growth in a 4.8 mm thick specimen
10−3 loaded with F̃max = 4 kN. Test loading case with calibrated
/
model parameters α0 = 0.0015 and ξ = 500.
10−4
Simulation to fit the 2D plane stress simulation. The integrated
Experiments shear stress as well as the stress in thickness direction
10−5 is close to zero. With a preliminary, load-free simula-
101
√ tion, an equilibrium stress state is found which serves
∆K/GPa mm
c) as the initial residual stress σ 0 in the actual simulation.
Fig. 12 Fatigue crack growth of a 2 mm thick specimen For both, the 2 mm and the 4.8 mm thick specimen, the
loaded with F̃max = 1.65 kN. Model parameters are fitted employed residual stress component σ0,yy is depicted in
to experimental results yielding α0 = 0.0015 and ξ = 500. Fig. 14a) exemplarily.
a) Fatigue degradation α and b) phase-field variable d after
≈ 251 500 load cycles. c) Paris curve. Both peened specimens are now simulated with the
parameters fitted in the previous section. Please note
that no additional parameters are modified for the sim-
indicating phase-field variable d after 251 500 load cy- ulations including the residual stresses. The initial load
cles. cycle increments are ∆N = 300 and ∆N = 1000, re-
spectively. Fig. 14 shows the FCG rates. The peened
Test loading case area is shaded. Within this area, there are dominantly
compressive residual stresses, while before and after it
The calibrated parameters are tested with a different the residual stresses are primarily in the tensile range.
a fatigue crack growth experiment with a 4.8 mm thick Both simulations reproduce the effect of the peening
specimen loaded with F̃max = 4 kN, also repeated three very well qualitatively: The crack is accelerated in front
times. As displayed in Fig. 13, the simulation meets the and after the peened area while within the peened area
experiments quite well, yet underestimates the crack it is inhibited.
growth rate slightly. This could be due to the fact that
The model overestimates the influence of the resid-
the assumption of a plane stress state as it was used in
ual stresses. This is true for both crack accelerating and
the simulation is less accurate for a thicker (albeit still
inhibiting effects. One reason for the quantitative gap
thin) specimen.
between experiment and simulation is that crack closure
is not considered in the model. Another reason could
4.2 Peened specimens be the simplification to a 2D stress state. The residual
stresses introduced through LSP have a distinct profile
Before the crack growth simulation, the initial resid- over the thickness which influence the FCG rate.
ual stress state has to be established. For this pur- The oscillations at the end of the peened area result
pose, the experimentally determined residual stresses from the fact that the very low FCG rates in this area
are mapped to the used mesh. In this context, the in- lead to almost zero crack growth in some increments.
tegral mean of the depth profile of the experimentally The jump at the end of the peened area presumeably
determined residual stresses σ0,xx and σ0,yy is taken stems from the high residual stress gradient applied inPhase-field modelling for fatigue crack growth under laser-shock-peening-induced residual stresses 11
2 mm 4.8 mm the simulation due to the fact that measurements of
residual stresses are only pointwise.
y
x 5 Conclusion
This paper revisits a phase-field model for the com-
putationally effective simulation of fatigue cracks [34].
The model is calibrated and validated with FCG ex-
periments in aluminium metal sheets. It is able to re-
σ0,yy /MPa -110 200
produce different FCG experiments fairly well. In the
a) second part, residual stresses are introduced into the
metal sheets through LSP. A method for the incorpo-
10−1 ration of residual stresses into the model is presented.
peened area
The model is able to reproduce the crack inhibiting ef-
2 mm fect of the compressive residual stresses qualitatively.
−2
10 Future works will now focus on low and very low cy-
cle fatigue where the elastic approximation is not valid
anymore. Moreover the degradation of residual stresses
dN cycle
da mm
10−3
due to cyclic plasticity deserves closer attention. A 3D
/
simulation which considers the distinct crack closure ef-
fects over the thickness of the specimen could also yield
10−4
more realistic results.
10−5 Acknowledgements The group of M. Kästner thanks the
20 30 40 50 60 German Research Foundation DFG which supported this work
within the Priority Programme 2013 ”Targeted Use of Form-
b) a/mm
ing Induced Residual Stresses in Metal Components” with
BM (Sim.) LSP (Sim.) grant number KA 3309/7-1. The authors would like to thank
BM (Exp.) LSP (Exp.) M. Horstmann and H. Tek for the specimen preparation and
performing the fatigue tests.
10−1
peened area Conflict of interest On behalf of all authors, the
4.8 mm corresponding author states that there is no conflict of
10−2 interest.
This is a preprint of an article published in Archive
dN cycle
da mm
10−3 of Applied Mechanics. The final authenticated version
is available online at: https://doi.org/10.1007/s00419-
/
021-01897-2.
10−4
10−5
References
20 30 40 50 60
1. Ambati, M., Gerasimov, T., De Lorenzis, L.: Phase-field
c) a/mm
modeling of ductile fracture. Computational Mechanics
55(5), 1017–1040 (2015). DOI 10.1007/s00466-015-1151-
Fig. 14 Fatigue crack growth in 2 mm and 4.8 mm thick
4
peened and unpeened specimen loaded with F̃max = 1.65 kN
and F̃max = 4 kN. Model parameters α0 = 0.0015 and ξ = 2. Bathias, C., Pineau, A. (eds.): Fatigue of materials and
500. a) Imposed residual stress component σ0,yy from resid- structures. 1: Fundamentals. ISTE, London (2010).
ual stress measurements after LSP. The component σ0,xx is OCLC: 837322449
not shown here. b) and c) Crack growth rate. 3. Benedetti, M., Fontanari, V., Monelli, B.D.: Numerical
Simulation of Residual Stress Relaxation in Shot Peened
High-Strength Aluminum Alloys Under Reverse Bending
Fatigue. Journal of Engineering Materials and Technol-
ogy 132(1), 011012 (2010). DOI 10.1115/1.318408312 Martha Seiler et al.
4. Boller, C., Seeger, T.: Materials data for cyclic loading. Werkstofftechnik 40(9), 663–675 (2009). DOI
Pt. D: Aluminium and titanium alloys. No. 42 in Ma- 10.1002/mawe.200900520
terials science monographs. Elsevier, Amsterdam (1987). 19. Larue, J., Daniewicz, S.: Predicting the effect of resid-
OCLC: 256452120 ual stress on fatigue crack growth. International
5. Bourdin, B., Francfort, G.A., Marigo, J.J.: The Varia- Journal of Fatigue 29(3), 508–515 (2007). DOI
tional Approach to Fracture. Journal of Elasticity 91(1- 10.1016/j.ijfatigue.2006.05.008
3), 5–148 (2008). DOI 10.1007/s10659-007-9107-3 20. Loew, P.J., Peters, B., Beex, L.A.: Fatigue phase-
6. Carrara, P., Ambati, M., Alessi, R., De Lorenzis, L.: A field damage modeling of rubber using viscous dis-
framework to model the fatigue behavior of brittle mate- sipation: Crack nucleation and propagation. Me-
rials based on a variational phase-field approach. Com- chanics of Materials 142, 103282 (2020). DOI
puter Methods in Applied Mechanics and Engineering p. 10.1016/j.mechmat.2019.103282
112731 (2019). DOI 10.1016/j.cma.2019.112731 21. Loew, P.J., Poh, L.H., Peters, B., Beex, L.A.: Ac-
7. Dursun, T., Soutis, C.: Recent developments in advanced celerating fatigue simulations of a phase-field damage
aircraft aluminium alloys. Materials & Design (1980- model for rubber. Computer Methods in Applied Me-
2015) 56, 862–871 (2014) chanics and Engineering 370, 113247 (2020). DOI
8. Francfort, G.A., Marigo, J.J.: Revisiting brittle fracture 10.1016/j.cma.2020.113247
as an energy minimization problem. Journal of the Me- 22. Mesgarnejad, A., Imanian, A., Karma, A.:
chanics and Physics of Solids 46(8), 1319 – 1342 (1998). Phase-Field Models for Fatigue Crack Growth.
DOI https://doi.org/10.1016/S0022-5096(98)00034-9 arXiv:1901.00757 [cond-mat] (2018). URL
9. Griffith, A.A.: The Phenomena of Rupture and Flow in http://arxiv.org/abs/1901.00757. ArXiv: 1901.00757
Solids. Philosophical Transactions of the Royal Society 23. Miehe, C., Aldakheel, F., Raina, A.: Phase field mod-
of London. Series A, Containing Papers of a Mathemat- eling of ductile fracture at finite strains: A variational
ical or Physical Character 221, 163–198 (1921). URL gradient-extended plasticity-damage theory. Interna-
http://www.jstor.org/stable/91192 tional Journal of Plasticity 84, 1–32 (2016). DOI
10. Haveroth, G., Vale, M., Bittencourt, M., Boldrini, J.: A 10.1016/j.ijplas.2016.04.011
non-isothermal thermodynamically consistent phase field 24. Miehe, C., Hofacker, M., Welschinger, F.: A phase
model for damage, fracture and fatigue evolutions in field model for rate-independent crack propagation:
elasto-plastic materials. Computer Methods in Applied Robust algorithmic implementation based on opera-
Mechanics and Engineering 364, 112962 (2020). DOI tor splits. Computer Methods in Applied Mechanics
10.1016/j.cma.2020.112962 and Engineering 199(45), 2765 – 2778 (2010). DOI
https://doi.org/10.1016/j.cma.2010.04.011
11. Hofacker, M., Miehe, C.: Continuum phase field modeling
25. Miehe, C., Welschinger, F., Hofacker, M.: Thermodynam-
of dynamic fracture: variational principles and staggered
ically consistent phase-field models of fracture: Varia-
FE implementation. International Journal of Fracture
tional principles and multi-field FE implementations. In-
178(1), 113–129 (2012). DOI 10.1007/s10704-012-9753-8
ternational Journal for Numerical Methods in Engineer-
12. Hombergsmeier, E., Holzinger, V., Heckenberger, U.C.:
ing 83(10), 1273–1311 (2010). DOI 10.1002/nme.2861
Fatigue crack retardation in LSP and SP treated alu-
26. Neuber, H.: Theory of Stress Concentration for
minium specimens. In: Advanced Materials Research,
Shear-Strained Prismatical Bodies With Arbi-
vol. 891, pp. 986–991 (2014)
trary Nonlinear Stress-Strain Law. Journal of
13. Kallien, Z., Keller, S., Ventzke, V., Kashaev, N., Kluse- Applied Mechanics 28(4), 544 – 550 (1961). DOI
mann, B.: Effect of laser peening process parameters and http://dx.doi.org/10.1115/1.3641780
sequences on residual stress profiles. Metals 9(6), 655 27. Peyre, P., Fabbro, R., Merrien, P., Lieurade, H.: Laser
(2019) shock processing of aluminium alloys. Application to high
14. Kaufman, J.G.: Fracture resistance of aluminum alloys. cycle fatigue behaviour. Materials Science and Engineer-
ASM International [u.a.], Materials Park, Ohio (2001). ing: A 210(1-2), 102–113 (1996)
OCLC: 248395923 28. Ponslet, E., Steinzig, M.: Residual stress measurement
15. Keller, S., Chupakhin, S., Staron, P., Maawad, E., using the hole drilling method and laser speckle interfer-
Kashaev, N., Klusemann, B.: Experimental and numeri- ometry. part ii: Analysis technique. Experimental Tech-
cal investigation of residual stresses in laser shock peened niques 27(4), 17–21 (2003)
AA2198. Journal of Materials Processing Technology 29. Ponslet, E., Steinzig, M.: Residual stress measurement
16. Keller, S., Horstmann, M., Kashaev, N., Kluse- using the hole drilling method and laser speckle interfer-
mann, B.: Crack closure mechanisms in residual stress ometry part iii: analysis technique. Experimental tech-
fields generated by laser shock peening: A com- niques 27(5), 45–48 (2003)
bined experimental-numerical approach. Engineer- 30. Ramberg, W., Osgood, W.: Description of stress-strain
ing Fracture Mechanics 221, 106630 (2019). DOI curves by three parameters. NACA Technical Note 902
10.1016/j.engfracmech.2019.106630 (1943)
17. Keller, S., Horstmann, M., Kashaev, N., Klusemann, B.: 31. Schajer, G.S., Steinzig, M.: Full-field calculation of hole
Experimentally validated multi-step simulation strategy drilling residual stresses from electronic speckle pattern
to predict the fatigue crack propagation rate in resid- interferometry data. Experimental Mechanics 45(6), 526
ual stress fields after laser shock peening. Interna- (2005)
tional Journal of Fatigue 124, 265–276 (2019). DOI 32. Schreiber, C., Kuhn, C., Müller, R., Zohdi, T.: A phase
10.1016/j.ijfatigue.2018.12.014 field modeling approach of cyclic fatigue crack growth
18. Landersheim, V., Eigenmann, B., el Dsoki, C., Bruder, (2020). DOI https://doi.org/10.1007/s10704-020-00468-
T., Sonsino, C.M., Hanselka, H.: Analyse der Wirkung w
von Kerben, Mittel- und Eigenspannungen auf die 33. Seeger, T.: Grundlagen für Betriebsfestigkeitsnach-
Schwingfestigkeit des hochumgeformten Werkstoffbere- weise. Fundamentals for Service Fatigue-Strength Assess-
ichs von Spaltprofilen. Materialwissenschaft und ments),” Stahlbau Handbuch (Handbook of StructuralPhase-field modelling for fatigue crack growth under laser-shock-peening-induced residual stresses 13
Engineering), Stahlbau-Verlags-gesellschaft, Cologne 1,
5–123 (1996)
34. Seiler, M., Linse, T., Hantschke, P., Kästner, M.: An ef-
ficient phase-field model for fatigue fracture in ductile
materials. Engineering Fracture Mechanics 224, 106807
(2020). DOI 10.1016/j.engfracmech.2019.106807
35. Smith, K.N., Topper, T., Watson, P.: A stress-strain func-
tion for the fatigue of metals. Journal of Materials 5,
767–778 (1970)
36. Steinzig, M., Ponslet, E.: Residual stress measurement
using the hole drilling method and laser speckle interfer-
ometry: part 1. Experimental Techniques 27(3), 43–46
(2003)
37. Tan, Y., Wu, G., Yang, J.M., Pan, T.: Laser shock peen-
ing on fatigue crack growth behaviour of aluminium alloy.
Fatigue & Fracture of Engineering Materials & Structures
27(8), 649–656 (2004)
38. Ulloa, J., Wambacq, J., Alessi, R., Degrande, G.,
François, S.: Phase-field modeling of fatigue cou-
pled to cyclic plasticity in an energetic formula-
tion. arXiv:1910.10007 [cond-mat] (2019). URL
http://arxiv.org/abs/1910.10007. ArXiv: 1910.10007
39. Zerbst, U., Vormwald, M., Pippan, R., Gänser, H.P.,
Sarrazin-Baudoux, C., Madia, M.: About the fatigue
crack propagation threshold of metals as a design
criterion–a review. Engineering Fracture MechanicsYou can also read