Photochemical degradation of iron(III) citrate/citric acid aerosol quantified with the combination of three complementary experimental techniques ...
←
→
Page content transcription
If your browser does not render page correctly, please read the page content below
Atmos. Chem. Phys., 21, 315–338, 2021
https://doi.org/10.5194/acp-21-315-2021
© Author(s) 2021. This work is distributed under
the Creative Commons Attribution 4.0 License.

Photochemical degradation of iron(III) citrate/citric acid aerosol
quantified with the combination of three complementary
experimental techniques and a kinetic process model
Jing Dou1 , Peter A. Alpert2 , Pablo Corral Arroyo2,a , Beiping Luo1 , Frederic Schneider2 , Jacinta Xto3 ,
Thomas Huthwelker3 , Camelia N. Borca3 , Katja D. Henzler3 , Jörg Raabe4 , Benjamin Watts4 , Hartmut Herrmann5 ,
Thomas Peter1 , Markus Ammann2 , and Ulrich K. Krieger1
1 Institutefor Atmospheric and Climate Science, ETH Zürich, 8092 Zurich, Switzerland
2 Laboratory  of Environmental Chemistry, Paul Scherrer Institute, 5232 Villigen, Switzerland
3 Laboratory for Synchrotron Radiation and Femtochemistry, Paul Scherrer Institute, 5232 Villigen, Switzerland
4 Laboratory for Synchrotron Radiation-Condensed Matter, Paul Scherrer Institute, 5232 Villigen, Switzerland
5 Atmospheric Chemistry Department (ACD), Leibniz Institute for Tropospheric Research (TROPOS),

04318 Leipzig, Germany
a now at: Department of Chemistry and Applied Biosciences, ETH Zürich, 8093 Zurich, Switzerland

Correspondence: Jing Dou (jing.dou@env.ethz.ch) and Ulrich K. Krieger (ulrich.krieger@env.ethz.ch)

Received: 29 July 2020 – Discussion started: 10 August 2020
Revised: 3 November 2020 – Accepted: 9 November 2020 – Published: 13 January 2021

Abstract. Iron(III) carboxylate photochemistry plays an im-         trodynamic balance, the oxidation state of deposited particles
portant role in aerosol aging, especially in the lower tropo-       was measured with X-ray spectromicroscopy, and HO.2 rad-
sphere. These complexes can absorb light over a broad wave-         ical production and release into the gas phase was observed
length range, inducing the reduction of iron(III) and the ox-       in coated-wall flow-tube experiments. We observed signifi-
idation of carboxylate ligands. In the presence of O2 , the         cant photochemical degradation with up to 80 % mass loss
ensuing radical chemistry leads to further decarboxylation,         within 24 h of light exposure. Interestingly, we also observed
and the production of . OH, HO.2 , peroxides, and oxygenated        that mass loss always accelerated during irradiation, result-
volatile organic compounds, contributing to particle mass           ing in an increase of the mass loss rate by about a factor of
loss. The . OH, HO.2 , and peroxides in turn reoxidize iron(II)     10. When we increased relative humidity (RH), the observed
back to iron(III), closing a photocatalytic cycle. This cycle is    particle mass loss rate also increased. This is consistent with
repeated, resulting in continual mass loss due to the release       strong kinetic transport limitations for highly viscous parti-
of CO2 and other volatile compounds. In a cold and/or dry at-       cles. To quantitatively compare these experiments and de-
mosphere, organic aerosol particles tend to attain highly vis-      termine important physical and chemical parameters, a nu-
cous states. While the impact of reduced mobility of aerosol        merical multilayered photochemical reaction and diffusion
constituents on dark chemical reactions has received substan-       (PRAD) model was developed that treats chemical reactions
tial attention, studies on the effect of high viscosity on photo-   and the transport of various species. The PRAD model was
chemical processes are scarce. Here, we choose iron(III) cit-       tuned to simultaneously reproduce all experimental results
rate (FeIII (Cit)) as a model light-absorbing iron carboxylate      as closely as possible and captured the essential chemistry
complex that induces citric acid (CA) degradation to investi-       and transport during irradiation. In particular, the photolysis
gate how transport limitations influence photochemical pro-         rate of FeIII , the reoxidation rate of FeII , HO.2 production,
cesses. Three complementary experimental approaches were            and the diffusivity of O2 in aqueous FeIII (Cit) / CA system
used to investigate kinetic transport limitations. The mass         as function of RH and FeIII (Cit) / CA molar ratio could be
loss of single, levitated particles was measured with an elec-      constrained. This led to satisfactory agreement within model

Published by Copernicus Publications on behalf of the European Geosciences Union.
316                                          J. Dou et al.: Photochemical degradation of iron(III) citrate/citric acid aerosol

uncertainty for most but not all experiments performed. Pho-       ganic compounds (Weller et al., 2014, 2013; Herrmann et al.,
tochemical degradation under atmospheric conditions pre-           2015). Organic compounds are a major component in atmo-
dicted by the PRAD model shows that release of CO2 and             spheric aerosol particles and have received more and more
repartitioning of organic compounds to the gas phase may be        attention as potential ligands for iron(III) complexation. For
very important when attempting to accurately predict organic       instance, humic-like substances derived from water-soluble
aerosol aging processes.                                           organic compounds have been reported to be strong chelating
                                                                   ligands with iron(III) (Dou et al., 2015; Kieber et al., 2003;
                                                                   Okochi and Brimblecombe, 2002; Willey et al., 2000). Ox-
                                                                   alate and other carboxylates have been identified to be impor-
1   Introduction                                                   tant ligands for iron(III) because they are available in suffi-
                                                                   cient amounts (Chebbi and Carlier, 1996; Kahnt et al., 2014;
Photochemistry in the atmosphere (either in the gas phase or       Kawamura et al., 1985) and the carboxylate groups are acidic
in the particle phase) plays an important role in aerosol ag-      enough to dissociate and chelate with iron(III) at atmospheric
ing processes. Photochemically produced free radicals in the       pH values (Okochi and Brimblecombe, 2002). Field studies
gas phase (mainly . OH) can be taken up by aerosol particles,      have confirmed that soluble iron is mostly in complexes with
inducing multiphase chemistry. However, uptake is limited          carboxylate functions (Tapparo et al., 2020; Tao and Murphy,
by the collision rate and condensed phase molecular trans-         2019).
port when diffusion coefficients are sufficiently low, which          In atmospheric aqueous phases, iron normally exists in
restricts chemical reactions to the near-surface region of the     oxidation states (II) and (III) and they can convert into
particle. In contrast, photochemically generated radicals in       each other via redox cycling. The ratio between iron(II) and
aerosol particles can be present throughout their bulk due to      iron(III) in aerosol particles is quite variable and depends
light penetrating their whole volume. Radical production in-       on several factors such as the presence of light, oxidizing
duced by a direct photochemical reaction occurs when the           compounds, and ligands. For example, Grgić et al. (1999)
energy of light quanta is high enough (mostly the UV part of       reported that the concentration ratio of iron(II) to iron(III)
the solar spectrum) to cause bond cleavage or rearrangement        varied between 0.9 and 3.1 in urban aerosol particles with
in a molecule. In the lower troposphere where UV light inten-      a size range of 0.4–1.6 µm. Iron(III) carboxylate complexes
sity is low, indirect photochemistry initiated by near UV and      [FeIII (OOC−R)]2+ are well-known photoactive compounds
visible radiation may become significant. Important indirect       (Wang et al., 2012; Weller et al., 2013, 2014). They can easily
photochemical processes are transition metal complex pho-          get excited by light in the UV–VIS range, inducing ligand-to-
tochemistry and photosensitized processes (Corral Arroyo           metal charge transfer (LMCT) (Cieśla et al., 2004), which is
et al., 2018; George et al., 2015). This work focuses on iron      an inner-sphere electron transfer (i.e., the electron transfer
carboxylate-catalyzed photochemistry due to its abundance          occurs via a covalently bound bridging ligand) from the car-
and reactivity in the atmosphere.                                  boxylate group to the iron. Investigations using time-resolved
   Iron is the most abundant transition metal in the earth’s       transient spectroscopy reported the formation of long-lived
crust. Wind erosion is the main source of iron in the atmo-        radical complexes, [FeII (. OOC−R)]2+ , with lifetimes on the
sphere, but anthropogenic activities such as industrial pro-       order of a millisecond, followed by the dissociation to the
cesses, traffic, and combustion processes can also potentially     organic radical R−COO. and an FeII aqua complex (Feng
release iron in particulate form (Deguillaume et al., 2005).       et al., 2007; Glebov et al., 2011; Pozdnyakov et al., 2009;
Depending on parameters such as temperature, pH value,             Zhang et al., 2009):
ionic strength, and the concentration of involved substances,
iron can combine with inorganic or organic ligands to form         [FeIII (OOC−R)]2+ + hν → [FeIII (OOC−R)]2+∗               (R1)
complexes (Deguillaume et al., 2005; Faust and Hoigné,                III
                                                                   [Fe (OOC−R)]     2+∗         II .
                                                                                          → [Fe ( OOC−R)]       2+
                                                                                                                             (R2)
1990; Kieber et al., 2005). Iron can be found complexed with          II .          2+       2+             .
low molecular weight inorganic species such as the hydrox-         [Fe ( OOC−R)]         → Fe     + R−COO .                  (R3)
ide anion (OH− ), sulfate (SO2−                      2−
                                 4 ), and sulfite (SO3 ) (Brandt   R−COO. will decarboxylate almost instantaneously (kR3 ≈
and van Eldik, 1995; Hofmann et al., 1991; Weschler et al.,
                                                                   109 –1012 s−1 ) (Abel et al., 2003; Bockman et al., 1997;
1986). Quantifying iron atmospheric processing and solu-
                                                                   Hilborn and Pincock, 1991):
bility is of global importance, especially for nutrient input
into the world’s oceans (Hamilton et al., 2019; Kanakidou          R−COO. → R. + CO2 .                                       (R4)
et al., 2018). Heterogeneous chemistry involving particulate
iron and SO2 can result in sulfate formation and increase          The alkyl radical R. will react rapidly with dissolved O2 ,
aerosol loading (Grgić et al., 1998, 1999; Grgić, 2009). Addi-   producing a peroxy radical with kR4 ≈ 2 × 10⁹ M−1 s−1 (von
tionally, iron photochemical processing in aerosol particles,      Sonntag and Schuchmann, 1991):
fog droplets, and cloud water is an important radical source
(Bianco et al., 2020; Abida et al., 2012) and sink for or-         R. + O2 → RO.2 .                                          (R5)

Atmos. Chem. Phys., 21, 315–338, 2021                                                 https://doi.org/10.5194/acp-21-315-2021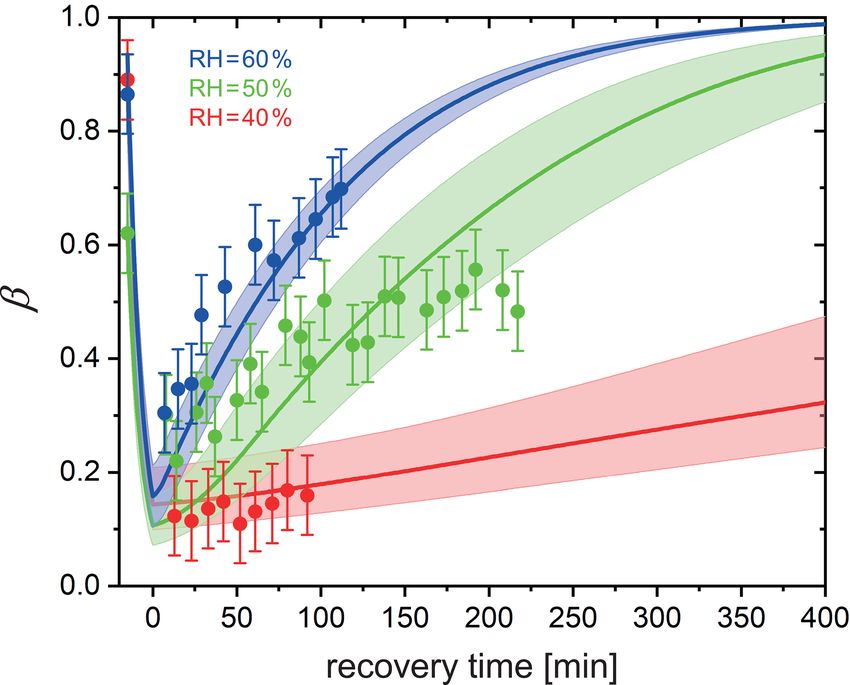
J. Dou et al.: Photochemical degradation of iron(III) citrate/citric acid aerosol                                              317

Subsequent reactions of R. and RO.2 are specific depending
on the type of ligand and its substitution.
   In this work we investigated iron(III) citrate
([FeIII (OOCCH2 )2 C(OH)(COO)], in short FeIII (Cit)),
as a model species to better understand iron carboxylate
photochemistry in atmospheric aerosol particles. Our
FeIII (Cit) system undergoes LMCT reactions in the same
way as countless other iron(III) carboxylate compounds
(Cieśla et al., 2004; Weller et al., 2013, 2014). Its photo-
chemical reaction scheme is well established in both solution
(Abida et al., 2012; Faust and Zepp, 1993; Pozdnyakov et al.,
2012) and solid states (Abrahamson et al., 1994). Citric acid
(CA) is an established proxy for oxygenated atmospheric
organic matter with its thermodynamic properties, water
diffusivity, and viscosity having been well studied (Lienhard
et al., 2012, 2014; Song et al., 2016). For these reasons, it is
a valid and reliable proxy for atmospheric iron carboxylate
photochemical processes.
   As schematically described in Fig. 1, FeIII (Cit) absorbs
light up to 500 nm, inducing LMCT, followed by immedi-
                                                                   Figure 1. Photocatalytic cycle of FeIII (Cit) complex in an aque-
ate decarboxylation of the central carboxyl group since the
                                                                   ous particle containing CA with explicit charge balance given in
hydroxyl group adjacent to a carboxyl group facilitates de-
                                                                   Table 2. R corresponds to the carboxylate side chain −CH2 COO− .
carboxylation (Weller et al., 2013). In the presence of O2 ,
oxidants such as HO.2 and H2 O2 will be produced, which
can oxidize FeII back to FeIII via Fenton reactions (Fenton,       to investigate how particle size, mass, and indicators of
1894) with additional oxidant production. FeIII then com-          chemical composition change during photochemical pro-
bines with another CA molecule in this aqueous system, clos-       cesses. In this work we mostly focus on the humidity depen-
ing the photocatalytic cycle, in which iron acts as a catalyst     dence of this photochemical degradation, while Alpert et al.
for CA degradation. In addition, the generation of reactive        (2021) focus on the impacts on ROS and the fate of free rad-
oxygen species (ROS) and peroxy radicals leads to further          icals during this photochemical degradation.
decarboxylation and more production of oxygenated volatile            To perform a quantitative comparison of these experiments
organic compounds (OVOCs) (e.g., acetone) (Pozdnyakov              and determine their relevant properties, a numerical multi-
et al., 2008; Wang et al., 2012). Therefore, this photodegra-      layered photochemical reaction and diffusion (PRAD) model
dation process is potentially an important sink of carboxylate     was developed that treats chemical reactions and the trans-
groups in the troposphere.                                         port of various species. In addition, we will use the PRAD
   We expect that the chemistry subsequent to the initial pho-     model to simulate photochemical aging processes under at-
tochemical reaction steps in the aerosol phase will be signif-     mospheric conditions. In the following we briefly discuss our
icantly altered by diffusion limitations when FeIII (Cit) par-     experimental approaches in Sect. 2 and include a detailed ex-
ticles mixed with CA attain a high viscosity. As viscosity         planation of the PRAD model in Sect. 2.5. A comparison be-
increases, molecular diffusion coefficients tend to decrease       tween the experimental results and the PRAD model is pre-
(Koop et al., 2011) and therefore photochemical cycling will       sented in Sect. 3. Finally, we discuss the impact and atmo-
also be slow. Increasing water content is expected when the        spheric importance of kinetic limitations to photochemical
relative humidity (RH) increases and will effectively plasti-      degradation in Sect. 4.
cize particles (Koop et al., 2011) leading to better mixing of
all compounds within the particles and faster photochemi-
cal cycling when compared with lower RH. However, these            2     Methods
effects have been investigated in dark systems but not in pho-
tochemical systems (Berkemeier et al., 2016; Shiraiwa et al.,      2.1    Solution preparation
2011; Shiraiwa and Seinfeld, 2012; Steimer et al., 2015a).
In order to better understand this system and how it reacts        CA (≥ 99.5 %) and iron(III) citrate tribasic monohy-
to RH, we used a triad of photochemical experiments in-            drate (18 %–20 % Fe basis) were purchased from Sigma-
cluding electrodynamic balance (EDB) measurements, scan-           Aldrich. Iron(II) citrate (FeII (HCit)) was purchased from
ning transmission X-ray microscopy coupled with near-edge          Dr. Paul Lohmann GmbH KG. Dilute aqueous solutions
X-ray absorption fine structure (STXM/NEXAFS) spec-                of FeIII (Cit) / CA and FeII (HCit) / CA were made in ultra-
troscopy, and a coated-wall flow-tube (CWFT) experiments           pure water (18 M  cm−1 , Milli-Q). Since FeIII (Cit) only

https://doi.org/10.5194/acp-21-315-2021                                                Atmos. Chem. Phys., 21, 315–338, 2021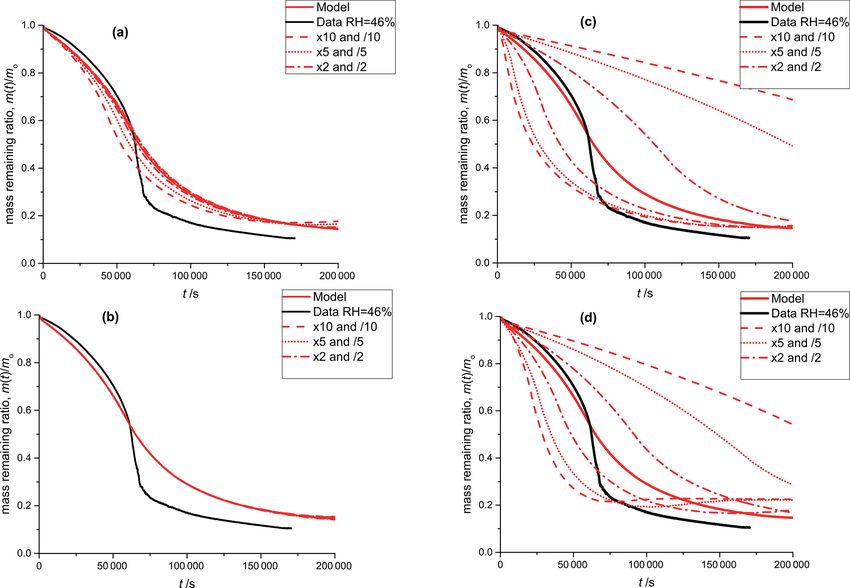
318 J. Dou et al.: Photochemical degradation of iron(III) citrate/citric acid aerosol
dissolves slowly in water, CA solutions with suspended
FeIII (Cit) crystals were sonicated for at least 24 h. The same
dissolving procedure was also applied to the FeII (HCit) pow-
ders. Note that all procedures were done under red light illu-
mination because FeIII (Cit) is light sensitive. The molar ratio
between FeIII (Cit) and CA was different for each experimen-
tal method used in this study. For EDB, STXM/NEXAFS,
and CWFT experiments, stock solutions were prepared with
molar ratios of 0.05, 1.0, and 0.07, respectively.
2.2 Bulk property measurements by EDB
We used an EDB to measure the mass loss in single, levi-
tated particles under irradiation. The experimental setup has
been described previously (Steimer et al., 2015b). In short,
an electrically charged aqueous particle (radius ∼ 10 µm) is
injected into an EDB. The balance is of the double ring de-
sign (Davis et al., 1990) with a high AC voltage applied to
the two parallel electrode rings and a DC voltage across the
hyperbolic endcaps. The DC field compensates the gravita-
tional force of the particle and is used as a measure for the
mass of the particle. The EDB is placed in a three-wall glass
chamber with a cooling liquid (ethanol) pumped through the
two inner walls and an insulation vacuum between two outer
walls to control the temperature (T ) at the location where the
particle levitates. The RH within the chamber is regulated by
adjusting the ratio of a dry and a humidified gas flow through
the chamber. In the experiments described in this work, we
used a typical total flow of 40 sccm and set the total pressure
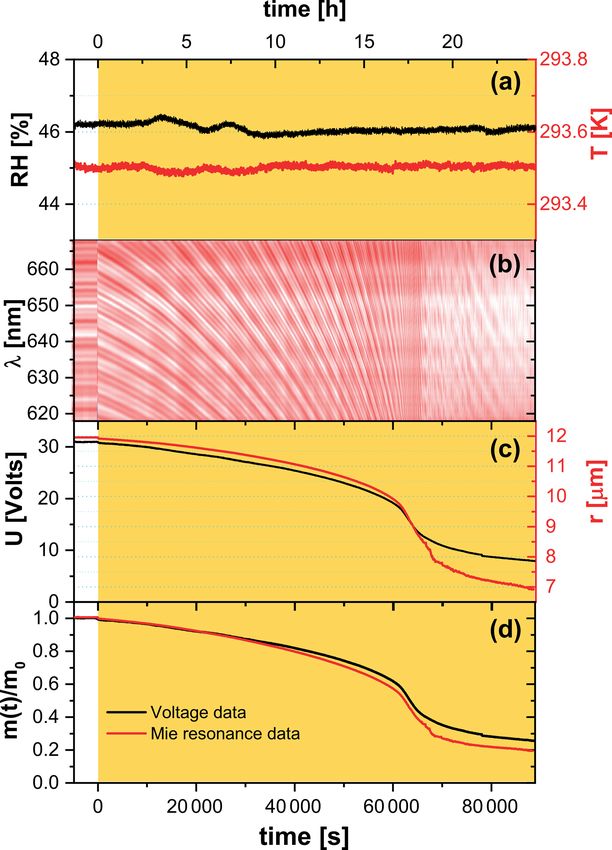
inside the cell at 8 × 10⁴ Pa. Figure 2. Raw EDB experimental data for a FeIII (Cit)/CA (molar
The spherical particles were characterized by two meth- ratio of 0.05) particle. (a) Relative humidity (left axis, black) and
ods based on Mie-resonance spectroscopy: (i) a narrow band- temperature (right axis, red) of the droplet. (b) Intensity map of
width tunable diode laser (TDL, tuning range 765–781 nm) low-resolution Mie-resonance spectra. (c) Black line: DC voltage
was used to determine the refractive index and radius si- that compensates gravitational force; red line: radius of the droplet,
with the initial value of the particle radius determined using high-
multaneously with high-precision (Steimer et al., 2015b);
resolution Mie-resonance spectroscopy (not shown), and the change
and (ii) simultaneously, a broad-band LED centered around
in radius determined from low-resolution Mie-resonance data given
640 nm was used to illuminate the particle. The backscatter in (b). (d) Normalized mass remaining ratio deduced from DC volt-
signal from the LED was recorded using a spectrograph with age (black), and from Mie-resonance shift (red) – assuming constant
a slow-scan back-illuminated charge-coupled device (CCD) density. Yellow shaded region in panels (a), (c), and (d) indicate the
array detector to follow the resonance wavelength shift of the time of laser irradiation with 0.25 W cm−2 at 375 nm.
particle (Zardini et al., 2006). If we assume the refractive in-
dex stays constant during the experiment, the radius change
of a particle is easily calculated from this resonance wave- In a typical EDB experiment, we let the particle equilibrate
length shift: to RH and T in a pure O2 gas phase for up to 10 h in the dark
before irradiation. Exemplary raw data of an experiment at
r(t) λ0 + 1λ(t) 1λ(t) 46 % RH and 293.5 K are shown in Fig. 2. The measured DC
= = 1+ . (1)
r0 λ0 λ0 voltage compensating for the gravitational force, as well as
the radius of the particle deduced from Mie-resonance spec-
We illuminated particles to induce a photochemical reaction troscopy, decreased dramatically during illumination in the
with either a CW diode laser emitting at 375 nm (LuxX 375- first 18 h, with more than half of the initial mass lost to the
20, Omicron Laserage) or a frequency-doubled diode laser gas phase. Note that the radius and mass loss rates increased
emitting at 473 nm (gem 473, Laser Quantum). At wave- as seen in Fig. 2c. We assumed the refractive index and den-
lengths of 375 and 473 nm, FeIII (Cit) is reported to have a sity of the particle did not change upon photochemistry and
molar absorptivity of 796 and 60.7 M−1 cm−1 , respectively therefore the mass loss calculated from the DC voltage could
(Pozdnyakov et al., 2008). be directly compared with size change by calculating the par-
Atmos. Chem. Phys., 21, 315–338, 2021 https://doi.org/10.5194/acp-21-315-2021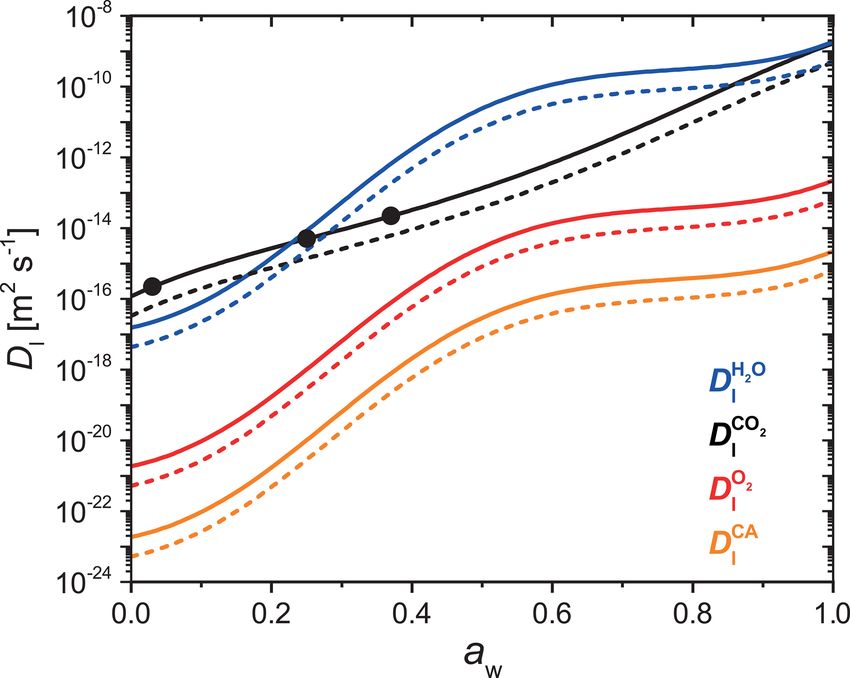
J. Dou et al.: Photochemical degradation of iron(III) citrate/citric acid aerosol 319
ticle mass remaining ratio,
r(t) 3
m(t)
= , (2)
m0 r0
where m0 is the particle mass prior to irradiation. Mass loss
derived from both ways independently is shown in Fig. 2d
and reveal that there is a little difference between the mass
loss up to t ≈ 65 000 s, corresponding to when m(t) m0 < 0.4.
Therefore, the refractive index and density are mostly gov-
erned by those of aqueous CA up until half the particle mass
is lost. The total mass loss over 24 h irradiation is more
significant and drops by 80 % for the particular experiment
shown in Fig. 2. In addition, we observed the mass loss rate
was initially ∼ 1.3 % h−1 and increased to ∼ 14 % h−1 when
40 % to 60 % of the initial mass was lost. This mass loss ac-
celeration is discussed in further detail with the help of the
PRAD model simulations in the Sect. 3.1. At t ≈ 65 000 s,
the mass loss slowed down considerably when we observed
a distortion in the Mie-resonance pattern (Fig. 2b and video
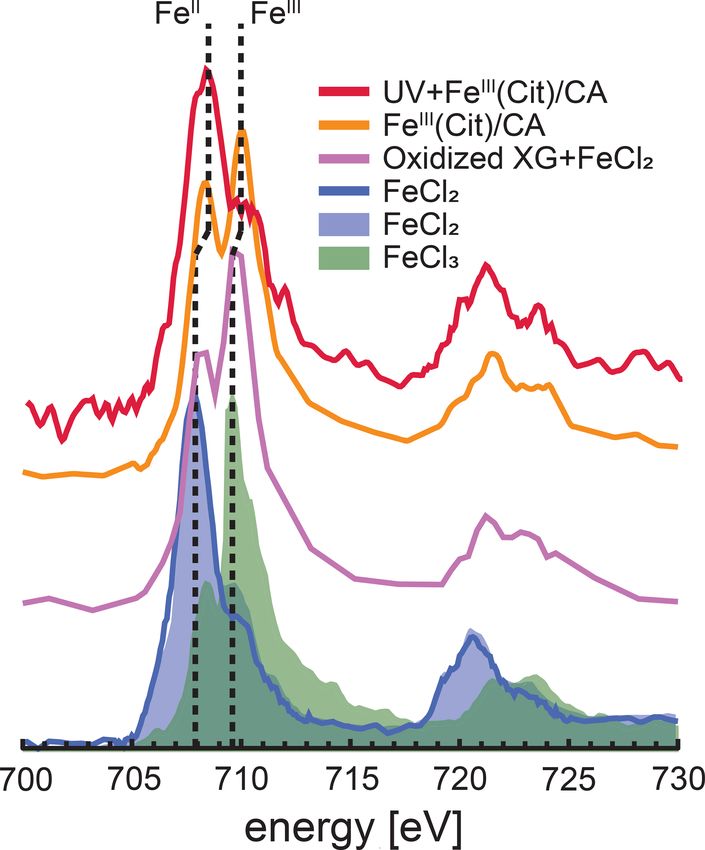
in the Supplement). The distortion may be attributable to par- Figure 3. Iron L-edge NEXAFS spectra of FeIII (Cit) / CA particles
tial crystallization of iron citrate in the particle, which would before and after irradiation with UV light shown as orange and red,
explain the slowing photochemical degradation. respectively. The previously recorded spectrum from mixed xanthan
gum (XG) and FeCl2 particles exposed to ozone is shown as the pur-
2.3 Chemical characterization by STXM/NEXAFS ple line, and a spectrum from FeCl2 particles is shown as the blue
line (Alpert et al., 2019). FeCl2 and FeCl3 spectra from Moffet et al.
STXM/NEXAFS measurements were performed at the Pol- (2012) are shown as the blue and green shading, respectively. The
Lux endstation located at the Swiss Light Source (SLS) vertical dashed lines indicate that peak X-ray absorption at 707.9 eV
to obtain the Fe oxidation state of particles between 0.2 shifted to 708.3 eV for FeII and 709.6 eV shifted to 710.0 eV for
and 2 µm in diameter (Flechsig et al., 2007; Frommherz FeIII .
et al., 2010; Raabe et al., 2008). Particles containing
FeIII (Cit) / CA were nebulized from aqueous solution with
xanthan gum and FeCl2 oxidized by O3 (Alpert et al., 2019).
a mole ratio between FeIII (Cit) : CA of 1 : 1. They were
The peak absorption for iron(II) and iron(III) are at X-ray
dried in air at RH < 30 % and impacted onto silicon nitride
energies of 708.3 and 710.0 eV. We were capable of resolv-
membranes mounted in portable sample holders. The sam-
ing peaks separated by 0.4 eV at the Fe L-edge. Ferrous and
ple holders were transported to the endstation in an evac-
ferric iron peaks are separated by 1.7 eV and thus clearly dis-
uated container and shielded against ambient light. Once
tinguishable. Following a previous procedure (Alpert et al.,
there, they were mounted in the PolLux environmental mi-
2019), we imaged particles at these two energies to deter-
croreactor (Huthwelker et al., 2010) and kept under a to-
mine the OD ratio between them. The fraction of FeIII out of
tal pressure of 1.5 × 10⁴ Pa, T = 293.5 K, RH = 40, 50 or
total Fe, β, was then determined using the parameterization
60 %, with a controlled gas flow. Further details of sam-
from Moffet et al. (2012). It is important to note that the X-
ple preparation have been previously reported (Alpert et al.,
ray energy absorption peaks observed for FeCl2 and FeCl3
2019; Huthwelker et al., 2010; Steimer et al., 2014). The
were identical for FeCl2 mixed with xanthan gum either un-
microreactor was mounted in a vacuum chamber for in situ
exposed or exposed to O3 (Alpert et al., 2019). However, we
STXM/NEXAFS analysis. When desired, the microreactor
have found that these peaks shifted by about +0.4 eV, pos-
could operate in vacuum conditions without a gas flow. The
sibly due to the strong complexation with CA. Small shifts
transmission of X-ray photons through the particles was mea-
in energy can occur depending on the chemical environment
sured and converted to optical density, OD = − ln(I /I0 ),
surrounding Fe atoms (Garvie et al., 1994; Moffet et al.,
where I and I0 are the transmitted and incident photon flux
2012). In agreement with Alpert et al. (2019), the peak ab-
as a function of X-ray energy. The Fe L-edge absorption was
sorption energies for our particles were independent of RH
probed over the X-ray energy range of 700–735 eV. Figure 3
from 0 % to 60 % within ±0.2 eV. When calculating β, we
shows an example of NEXAFS spectra of FeIII (Cit) / CA
always imaged particles at 708.3 and 710.0 eV.
particles before (orange) and after (red) irradiation with UV
light. X-ray energy calibration was consistently performed
using FeCl2 and compared with the existing literature for
FeCl2 and FeCl3 salts (Moffet et al., 2012) and a mixture of
https://doi.org/10.5194/acp-21-315-2021 Atmos. Chem. Phys., 21, 315–338, 2021
320                                         J. Dou et al.: Photochemical degradation of iron(III) citrate/citric acid aerosol

2.4   HO.2 production determined by CWFT

The HO.2 release upon irradiation of a FeIII (Cit) / CA thin
film was measured by scavenging HO.2 with an excess of
NO in a CWFT reactor (Duran glass, inside diameter 1.2 cm,
length 50 cm). The film was composed of FeIII (Cit) / CA,
and deposited inside the tubular glass flow tube with a thick-
ness between 0.15 and 0.2 µm and an error of about 20 %.
Details of the film preparation have been described previ-
ously (Corral Arroyo et al., 2018; González Palacios et al.,
2016). Seven UV lamps (UV-A range, Philips Cleo Ef-
fect) were mounted surrounding the glass reactor held at
298.15 K. The total light output between 300 and 590 nm
was 210 W m−2 . The flows of N2 , O2 , and NO passing
through the reactor were controlled. The NO concentra-
tion during CWFT photochemical experiments was in ex-            Figure 4. NO concentration raw data from a CWFT film containing
cess (> 1013 molecules cm−3 ) to efficiently scavenge 99 %       FeIII (Cit) / CA (molar ratio of 0.07) with lamps on (yellow shaded
of HO.2 produced by the film. The concentration of NO was        region) and off at 29.3 % RH and 298.15 K.
tracked by a chemiluminescence detector (Ecophysics CLD
77 AM). In an example CWFT experiment at RH = 29.3 %,            there are alternative approaches; for example, Kinetiscope
a clear NO loss was observed when the UV lights were             (Houle et al., 2015) does not integrate sets of coupled dif-
switched on as shown in Fig. 4, which was due to the re-         ferential equations to predict the time history of a chemi-
lease of HO.2 radicals into the gas phase and reaction of NO     cal system. Instead, it uses a general stochastic algorithm to
with HO.2 forming NO2 and OH. . OH. is then scavenged            propagate a reaction.
by NO producing HONO. The production of HONO was                    As illustrated in Fig. 5, the PRAD model divides a spher-
routinely checked as described in González Palacios et al.       ical droplet into a number of shells, n, which exchange
(2016). Therefore, the production rate of HO.2 , PHO.2 , was     molecules after each chemical time step. Shell thickness and
calculated from the loss rate of NO assuming a 2 : 1 ratio to    the number of shells were adjusted to enable the resolution
HO.2 conversion:                                                 of steep concentration gradients within a reasonable compu-
          [NO] × flow                                            tation time. The volume of each shell was constant instead of
PHO.2 =               ,                                    (3)   the thickness and the shells become thinner and thinner from
            2Sfilm
                                                                 the center to the surface of the particle. For each shell and
where [NO] is the loss of gas-phase concentration of NO          at each time step, we first calculated the composition using
in molecules cm−3 , flow is the volumetric gas flow in the       the thermodynamic equilibria of the FeIII (Cit) / CA system,
CWFT in cm3 s−1 , and Sfilm is the surface area of the film      as listed in Table 2. The Newton–Raphson method (Burden
in cm2 .                                                         and Faires, 2011) was then used to calculate the turnover and
                                                                 the concentration of products and reactants over time for the
2.5   Development of the photochemical reaction and              chemical reactions also listed in Table 2 with a fixed time
      diffusion (PRAD) model                                     step of 0.2 s. After each time step, diffusion of all species
                                                                 between the shells and the evaporation of products (or con-
We developed a PRAD model to interpret our experiments           densation of the reactant O2 ) were computed. The time step,
and to understand any feedback between transport limitations     1t, for physical transport processes was determined dynam-
and photochemistry, especially under low RH conditions,          ically to ensure both numerical stability and computational
corresponding to high viscosity of the particle phase. The       efficiency.
PRAD model consists of two modules: a detailed chemical             For each species, the molar flux from shell i to the next
process module, treating equilibria and chemical reactions,      shell i + 1 was calculated as
and a transport module handling the physical transport of
all species (including diffusion in the aqueous phase as well                      dc                            ci+1 − ci
                                                                 fi = −4π ri2 Dl               = −4π ri2 Dl                     ;
as gas–particle phase partitioning). Conceptually, the PRAD                        dr   r=ri                  0.5(ri+1 − ri−1 )
model relies on the kinetic model framework for aerosol sur-     ∀i ∈ {1, 2, . . ., n − 1},                                         (4)
face chemistry and gas–particle interactions (Pöschl et al.,
2007), which is similar, for example, to the KM-GAP model        where Dl is the liquid phase diffusion coefficient of the corre-
(Shiraiwa et al., 2012). Numerically, the PRAD model uses a      sponding species. Shell i extends from ri−1 to ri , while shell
Euler forward step method as explained in detail below, while    i + 1 extends from ri to ri+1 , with r being the distance from
KM-GAP solves coupled differential equations. In passing,        the particle center. In Eq. (4), c is the molar concentration in

Atmos. Chem. Phys., 21, 315–338, 2021                                                   https://doi.org/10.5194/acp-21-315-2021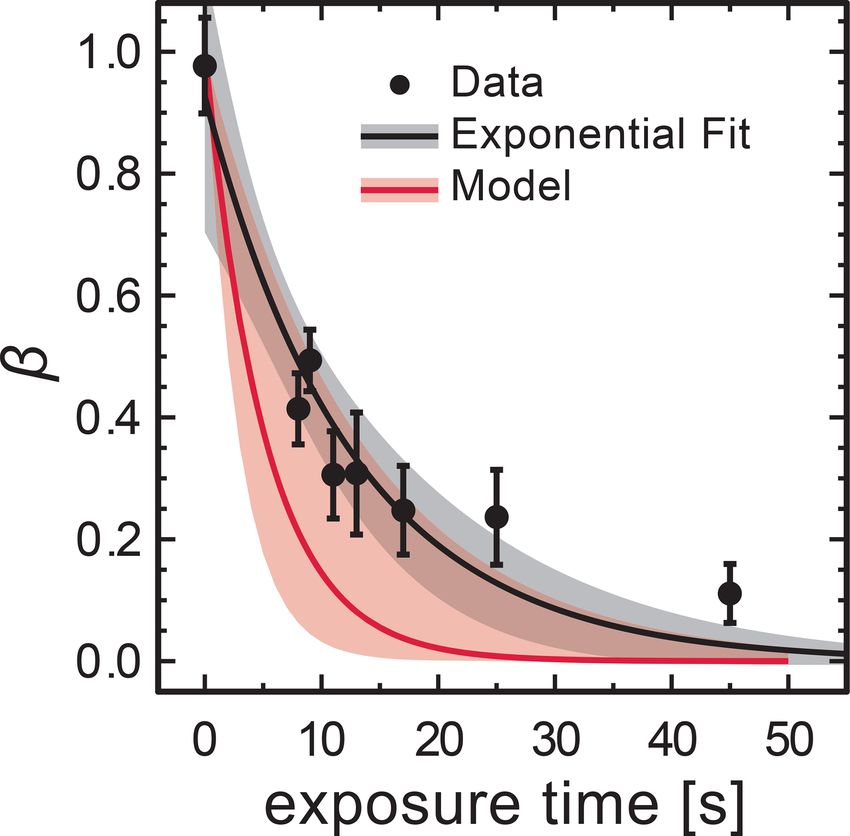
J. Dou et al.: Photochemical degradation of iron(III) citrate/citric acid aerosol                                                 321

                                                                       from which the concentration and corresponding shell thick-
                                                                       ness using the molar volume of each species were recalcu-
                                                                       lated for the next time step.
                                                                          The chemical loss rate of O2 was treated in the liquid
                                                                       phase diffusion module instead of in the chemical module,
                                                                       since the loss can be very fast and its lifetime can be smaller
                                                                       than 10−6 s. If O2 loss due to reaction was determined in the
                                                                       chemical module, a chemical time step of 10−6 s would result
                                                                       in extensive computational time beyond what is reasonable
                                                                       for this study. Therefore, within each liquid phase diffusion
Figure 5. Schematic illustration of the PRAD model showing the         time step, in addition to the physical transport, the chemical
shells, transport fluxes (green arrows), and chemical processes (red   loss of O2 molecules was calculated in each shell:
arrows) of each species. The particle is radially symmetric with the
surface of the particle marked as rn .
                                                                       dNi
                                                                           = −kO2 Ni ; ∀i ∈ {1, 2, . . ., n}.                    (11)
                                                                        dt

each shell of the aqueous particle, defined as                         Integration yields

       Ni                                                              Ni = Ni e−kO2 1t ; ∀i ∈ {1, 2, . . ., n − 1},             (12)
ci =      ; ∀i ∈ {1, 2, . . ., n},                              (5)
       Vi
                                                                       where kO2 is the total chemical reaction rate of O2 . In the
where Ni is moles of a particular species in shell i, and Vi is        outermost shell n, O2 molar concentration is assumed to be
the total volume of shell i.                                           at steady state all times, meaning that the chemical loss of O2
   At the outermost shell n, the gas–particle phase partition-         is always compensated by the condensation of O2 from the
ing of each species was determined by the modified Raoult’s            gas phase:
law. The flux from shell n into the gas phase, fn , was calcu-

lated to be                                                                                         ppartial,O2     cn
                                                                       −kO2 Nn,O2 = −4π rn Dg                   −          .      (13)
                 dc                     cg − cg∗                                                      RT          HO2 RT
fn = −4π rn2 Dg            = −4π rn2 Dg
                 dr r=rn                   rn                          Substituting Eq. (5) in Eq. (13), we calculate the moles of O2
                 ppartial − pvapor                                     in this shell, Nn,O2 , as
    = −4π rn Dg                    ,                          (6)
                        RT                                                                   ppartial,O2
where Dg is the gas phase diffusion coefficient of the cor-            Nn,O2 =                                      .            (14)
                                                                                  kO2 RT /(4π rn Dg ) + 1/(HO2 Vn )
responding species, and R is the gas constant. ppartial is the
partial pressure of the species in the gas phase at infinite dis-      where HO2 is Henry’s law coefficient of O2 .
tance from the particle. Based on Henry’s law, vapor pressure             All iron-containing compounds and all free ions are as-
of the species pvapor is defined as                                    sumed not to evaporate from the particle phase. All other
          cn                                                           species have Henry’s law coefficients given in Table 1. If the
pvapor =     ,                                              (7)        evaporation rate of some species is fast enough, then their
          H
                                                                       concentration in the outermost shell n can always be at steady
where cn is the molar concentration in the outermost shell
                                                                       state, which means
n, and H is the Henry’s law coefficient. Substituting Eq. (7)
into Eq. (6) leads to                                                  fn−1 = fn ,                                               (15)
                  p             cn
                      partial
fn = −4π rn Dg                −        .                    (8)        that is,
                      RT        H RT
We calculated the partial pressure of H2 O from RH, and took                2           cn − cn−1                  cn
                                                                       −4π rn−1 Dl                     = 4π rn Dg      .         (16)
the partial pressure of O2 based on the total pressure and                            0.5 (rn − rn−2 )            H RT
the fraction of O2 gas flow used in experiments. For other
species, ppartial is negligible and assumed to be zero. So, for        From Eq. (16), cn can be deduced to be
all species other than H2 O and O2 , fn simplifies to                                                    1
                           cn               cn                       cn = cn−1                                      2 D
                                                                                                                            .   (17)
fn = −4π rn Dg 0 −                = 4π rn Dg      .         (9)                    1 + 0.5 (rn − rn−2 ) rn Dg / H RT rn−1 l
                         H RT                H RT
Based on the calculated fluxes, the change in moles, 1Ni , of          And the number of moles of the volatile species in the outer-
each species in 1t was given by                                        most shell Nn as

1Ni = (fi−1 − fi )1t; ∀i ∈ {1, 2, . . ., n},                   (10)    Nn = cn Vn .                                              (18)

https://doi.org/10.5194/acp-21-315-2021                                                     Atmos. Chem. Phys., 21, 315–338, 2021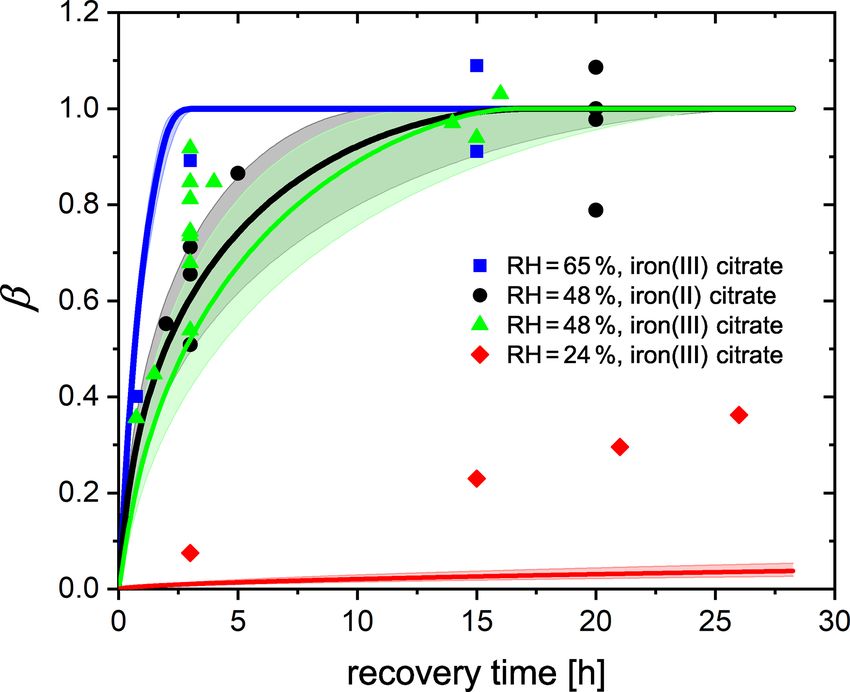
322                                            J. Dou et al.: Photochemical degradation of iron(III) citrate/citric acid aerosol

   We have parameterized aqueous and gas phase diffusion              4. FeIII (Cit) photolysis, decarboxylation, and oxidation
                j       j
coefficients, Dl and Dg , respectively, for all species j given          of the alcohol group in presence of O2 yields the
in Appendix A1 and A2. There are several other assumptions               compounds O=C(CH2 COO)2−     2 or O=C(CH2 COOH)2 ,
and approximations made to adapt this model to the aqueous               which are C5 species. We assumed that half of the
FeIII (Cit) / CA system:                                                 C5 species undergo photochemical reactions to produce
                                                                         CO2 and compounds with 2–4 carbon atoms, C4 , C3 and
 1. We always set water activity in the particle phase in
                                                                         C2 (see Reactions R10–R14 shown in Table 2), all of
    equilibrium with the gas phase, since the RH of the gas
                                                                         which are capable of being released to the gas phase de-
    phase did not change during each experiment.
                                                                         pending on their solubility.
 2. The bulk accommodation coefficients of all species
    were assumed to be 1.                                             5. We estimated the quantum yield in Reactions (R1) and
                                                                         (R2) in Table 2, as 8 = 1.0 at λ = 375 nm and 8 =
 3. Neglecting the influence of FeIII (Cit), the water activity          0.002 at λ = 473 nm (Dou et al., 2019), and we param-
    was taken from that of CA (awCA ), which was determined
                                                                         eterized 8 as a function of wavelength, λ:
    from the mass fraction of CA, WCA , by Lienhard et al.
    (2012):                                                                     e−0.145(λ−430)
                                                                         8=                      .                             (26)
       CA             1 − WCA                                                 1 + e−0.145(λ−430)
      aw  =                       2
                                     ,                      (19)
               1 + q · WCA + r · WCA
                                                                       In total, the PRAD model includes 13 equilibria and
      with                                                          17 chemical reactions among 32 species, as well as their
      q = −3.16761 + 0.01939T − 4.02725 × 10⁻⁵ T 2 , (20)           condensed phase diffusivities and Henry’s law coefficients.
                                                                    Some of these parameters are known from previous stud-
      and                                                           ies (see Tables 1 and 2 for references), while others are not
      r = 6.59108 − 0.05294T + 1.06028 × 10⁻⁴ T 2 .         (21)    known and difficult to estimate. For instance, even though
                                                                    absorption spectra of FeIII (Cit) have been measured in aque-
                                      Cit ) was calculated using
      The water activity of citrate (aw                             ous solution (Pozdnyakov et al., 2012), the corresponding
      the same equation                                             quantum yield has not, which leaves the photolysis rate of
                                                                    FeIII (Cit), j , unknown. Also, there are no data reported on
       Cit            1 − WCit
      aw   =                           ,                    (22)    the diffusivity of O2 in aqueous CA solutions, and the chem-
                                   2
               1 + q · WCit + r · WCit                              ical reaction rate of the oxidation of the FeII citrate complex
      where the mass fraction of citrate WCit was treated in        by O2 is quite uncertain (Gonzalez et al., 2017). In order to
      two fractions: citrate without Fe and citrate contain-        find the optimal parameter set, we compared the experimen-
      ing Fe. The water activity of an aqueous 1 M FeIII (Cit)      tal data of the three setups taken under well-controlled condi-
      solution was determined using a water activity meter          tions with model predictions and tuned the unknown param-
      (AquaLab water, Model 3B, Decagon Devices, USA) at            eters manually.
      room temperature. We found this water activity corre-            We restricted our tuning of the parameters to reach sat-
      sponds to that of a 0.81 M aqueous CA solution. There-        isfactory agreement with all experimental data simultane-
      fore, for calculating water activity, all iron-containing     ously. The equilibrium constants and rate coefficients that
      citrate complexes (either FeII or FeIII ) were treated with   were tuned are indicated in Table 2 (the sensitivity of the
      a reduced concentration: namely with a factor of 0.81         PRAD model results to a few of its parameters is shown
      of the corresponding citrate molarity. Hence, the overall     in Appendix A5). The parameters were adjusted in a wide
      amount of citrate was calculated as                           and acceptable range until a good representation of our data
                                                                    could be obtained. For example, the fraction of iron(III) in a
       ∗
      NCit = NCit + 0.81NFeCit ,                            (23)    photoactive complex (equilibrium E5 in Table 2) must have
      accordingly and WCit was determined using                     been high enough to reproduce STXM/NEXAFS observa-
                                                                    tions that iron could be reduced to low levels as seen in Fig. 7
                               ∗
                       MCit · NCit
      WCit =                               ,                (24)    described below. In comparison, equilibrium constant of E7
                       ∗
               MCit · NCit + MH2 O · NH2 O                          must have been much lower than equilibrium constant of E5
                                                                    so that the amount of iron(III) in a nonphotoactive complex
      where MCit and MH2 O are the molar mass of CA and
                                                                    was small compared to being in complex with citrate. As an-
      water, respectively. For other species j , the contribution
                                                                    other example, oxidation of Fe2+ (Reactions R5–R8 in Ta-
      to the water activity is proportional to their molar vol-
                                                                    ble 2) is fairly well referenced, and therefore we adjusted
      ume (MVj ), so that in total,
                                                                    the rate of Reaction (R9) until the model reoxidation rates
            CA                  MVH2 O                              matched those observed. Tuning of individual bulk diffusion
      aw = aw  × a Cit
                   w ×              P      .                (25)
                            MVH2 O + j MVj                          coefficients for all species was not attempted. Instead, we

Atmos. Chem. Phys., 21, 315–338, 2021                                                  https://doi.org/10.5194/acp-21-315-2021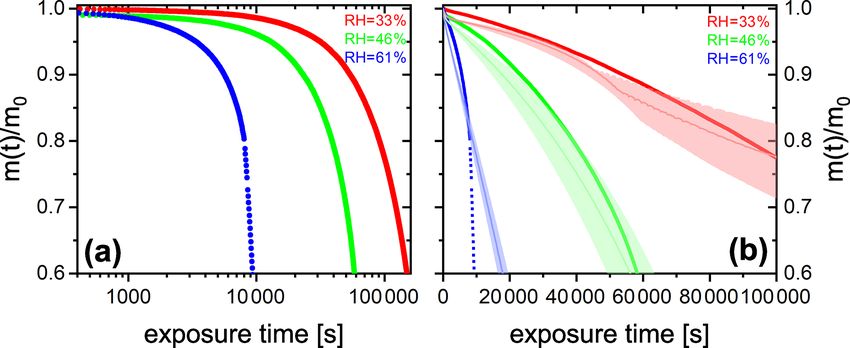
J. Dou et al.: Photochemical degradation of iron(III) citrate/citric acid aerosol                                                                                           323

Table 1. Liquid phase diffusivity factors (normalized to water) and Henry’s law coefficients (Sander, 2015) of major species in the FeIII (Cit)
photochemistry system.

                                                                                                                                   ja
         Number         Name                            Formula                                                                   lf       H0 (M atm−1 )b             Qb
         1              water                           H2 O                                                                           1   1                           1
         2              cit total                       –                                                                              –   –                           –
         3              ferric (FeIII ) total           –                                                                              –   –                           –
         4              ferrous (FeII ) total           –                                                                              –   –                           –
         5              citric acid (CA)                (CH2 COOH)2 C(OH)(COOH)/H3 Cit                               1.20 × 10⁻⁶           infinite                10 000
         6              dihydrogen citrate              (CH2 COOH)2 C(OH)(COO)− /H2 Cit−                             1.20 × 10⁻⁶           infinite                10 000
         7              hydrogen citrate                (CH2 COOH)C(OH)(CH2 COO)                                     1.20 × 10⁻⁶           infinite                10 000
                                                        (COO)2− /HCit2−
         8              citrate                         C(OH)(CH2 COO)2 (COO)3− /Cit3−                               1.20 × 10⁻⁶           infinite                10 000
         9                                              FeIII (Cit)(OH)−                                             3.92 × 10⁻⁷           infinite                10 000
         10                                             FeIII (HCit)+                                                5.04 × 10⁻⁷           infinite                10 000
         11             ferrous citrate                 FeII (HCit)                                                  5.04 × 10⁻⁷           infinite                10 000
         12             ferric citrate                  FeIII (Cit)                                                  5.04 × 10⁻⁷           infinite                10 000
         13             ferric ion                      Fe3+                                                         3.78 × 10⁻⁵           infinite                10 000
         14                                             FeIII (OH)2+                                                 1.18 × 10⁻⁵           infinite                10 000
         15             ferrous ion                     Fe2+                                                         3.78 × 10⁻⁵           infinite                10 000
         16             hydrogen ion                    H+                                                                             –   –                           –
         17             hydroxide ion                   OH−                                                                            –   –                           –
         18             hydroperoxy radical             HO.2                                                         1.13 × 10⁻⁴           4 × 10⁴                  5900
         19             superoxide radical              O.−
                                                         2                                                                             –   –                           –

         20                                             OH−. C(CH2 COO)2−
                        radicals                                       2                                             2.69 × 10⁻⁶           infinite                10 000
         21                                             +OH−. C(CH2 COOH)2
         22             hydroxyl radical                . OH                                                                           –   –                           –
         23             hydrogen peroxide               H2 O2                                                        1.07 × 10⁻⁴           8.3 × 10⁵                7400
         24             oxygen                          O2                                                           1.20 × 10⁻⁴           3.5 × 10⁻²               1500
         25             carbon dioxide                  CO2                                                            depends on          3.4 × 10⁻¹               2400
                                                                                                                        aw and T
         26             acetone                         CH3 COCH3                                                    1.18 × 10⁻⁵           30                       4600
         27             unkn. prod C4                   C4                                                           5.30 × 10⁻⁶           1 × 10⁵                  6000

         28                                             O=C(CH2 COO)2−
                                                                    2 + O=C(CH2 COOH)2                               1.95 × 10⁻⁶           infinite                 8000

         29             acetic acid                     CH3 COOH                                                     3.23 × 10⁻⁵           4.1 × 10³                6300
         30                                             FeII [O=C(CH2 COO)2 ]                                        7.22 × 10⁻⁷           infinite                10 000
         31             unkn. prod C5                   C5                                                           2.69 × 10⁻⁶           1 × 10⁷                  8000
         32             unkn. prod C5                   C5 _stable                                                   2.69 × 10⁻⁶           5 × 10⁸                  8000
       a l j is a factor of the diffusion coefficient of each species j normalized to that of water. b Henry’s law is described as a function of temperature T :
          f
                   Q− Q
       H = H 0 e T T0 .

https://doi.org/10.5194/acp-21-315-2021                                                                                    Atmos. Chem. Phys., 21, 315–338, 2021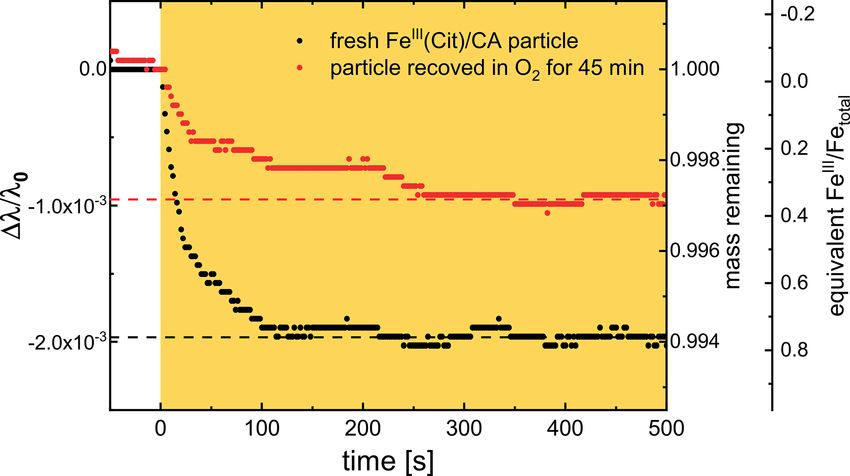
324                                         J. Dou et al.: Photochemical degradation of iron(III) citrate/citric acid aerosol

simplified the representation of diffusion coefficients using    data with a very similar trend and magnitude over all, which
a parameterization as a function of molar mass, as described     gives us confidence that the PRAD model captures the essen-
in Appendix A1. The two constants in Eq. (A8) and the two        tial chemistry and transport during irradiation. (How particle
constants in Eq. (A3) were tuned, resulting in the absolute      mass evolves subsequently until 80 % mass loss in both ex-
diffusion coefficients shown in Fig. A1. Henry’s law coef-       periments and models is shown in Fig. A4.) However, the
ficients for gasses were tuned, however purposefully set at      model is not able to capture the full degree of acceleration
values higher than expected for pure water or highly dilute      of the degradation rate, as it does not attempt to include the
aqueous solution. This was inspired by previous studies reg-     complete multigenerational oxidation chemistry at the level
ularly reporting solubility of, e.g., O2 and CO2 higher in a     of individual components after initial radical production.
variety of organic liquids than water (Fogg, 1992; Battino          The degradation processes were faster at higher RH. At
et al., 1983). It is important to note that the result of this   lower RH, the particle was expected to be more viscous,
tuning does not mean that we found the global minimum in         diffusion coefficients were expected to be lower, products
the parameter space (see, e.g., (Berkemeier et al., 2017)). A    were generated at a lower rate, and volatile products moved
thorough search for a global minimum for our model with          more slowly to the surface to evaporate. More importantly,
16 tuning parameters for chemistry, four tuning parameters       O2 taken up by the particle from the gas phase diffused more
(and our parameterization) for diffusion, and nine tuning pa-    slowly into the bulk of the particle at lower RH. Thus, less
rameters for solubility is computationally very expensive and    HO.2 and H2 O2 formed and less FeII could be reoxidized
beyond the scope of this paper. However, for our purpose         from the surface to the center of the particle. The observed
here, namely modeling typical timescales of photochemical        gradient in the FeIII fraction, β, and the modeled gradients
degradation of organic aerosol under atmospheric conditions      in O2 and ROS in the particle have been shown with ra-
(see Sect. 3.5), the PRAD model framework should allow           dial profiles in Alpert et al. (2021). This resulted in fewer
sufficiently accurate predictions. In other words, we expect     photochemically active FeIII complexes available for pho-
similar mass degradation in atmospheric particles due to the     tocatalytic degradation. The characteristic degradation time
fact that many other relevant iron carboxylate compounds un-     shortened by a factor of 5.5 when RH increased from 46 %
dergo LMCT similarly as to our model system (Weller et al.,      and 61 %, which demonstrates that photochemical cycling
2013, 2014). Additionally, if a particular system requires pa-   is highly sensitive to the microphysical conditions. The dif-
rameter values that significantly differ from ours, the PRAD     fusivity of O2 must have significantly impacted reoxidation
model framework itself should still be valid. Note that care-    rates. In addition, the diffusion coefficients of both FeII and
ful evaluation is needed when picking a single parameter of      FeIII species increases with RH. Therefore, the molecular
the PRAD model for use in another context. Comparisons of        transport between both iron and oxygen reactants increases
the refined model with our experimental data are shown in        causing a highly nonlinear trend in increasing mass loss with
the next section.                                                increasing RH.

                                                                 3.2   Determination of iron(III) reduction rate and
3     Comparisons between experimental measurements                    iron(II) reoxidation rate by STXM/NEXAFS
      and model simulations
                                                                 In STXM/NEXAFS experiments, the freshly prepared
3.1    The effect of RH on photocatalytic degradation            FeIII (Cit) mixed with CA at x = 1.0 particles were irradi-
       efficiency                                                ated to determine the FeIII (Cit) photolysis rate, as shown in
                                                                 Fig. 7. Each experimental data point is the average FeIII frac-
We performed experiments with single, levitated particles        tion from 16–36 individual particles. Fitting an exponential
under continuous UV irradiation (375 nm) in pure O2 at dif-      function, β = β0 ejobs t , yields β0 = 0.93 ± 0.09 and a first-
ferent RH to assess the effects of RH on the photocatalytic      order decay rate of jobs = 0.08 ± 0.01 s−1 . The LED power
cycle shown in Fig. 1 and tested the model performance un-       at the sample was measured to be 5.9 ± 0.6 mW in total and
der these conditions. Qualitatively, a continuous decrease of    had a Gaussian spectral profile between 361 and 374 nm at
particle mass and size is expected to occur due to evapora-      full width half maximum. When mounting the UV fiber op-
tion of volatile products, as shown in Fig. 2. Figure 6 shows    tics and collimator lens for multiple samples, the illuminated
the fraction of particle mass remaining with the irradiation     area had a circle equivalent diameter of 5±1.5 mm. Using the
time at three different RH calculated from resonance wave-       absorption cross section calculated from the molar attenua-
length shifts (Eqs. 1 and 2). Clearly, particle mass was lost    tion coefficient (Pozdnyakov et al., 2008), 8 = 1.0 and prop-
to the gas phase with time due to the evaporation of pho-        agating all uncertainties yields a photochemical reaction rate
tochemical products and, similarly to Fig. 2, all data show      of jcalc = 0.20 ± 0.12 s−1 , which is in agreement with jobs .
a very significant acceleration of mass loss with time. After    This implies that assuming a quantum yield of 1 at these UV
tuning some of the parameters of the model as further dis-       wavelengths is reasonable. This calculated value for the pho-
cussed below, the PRAD model simulations reproduces our          tochemical reaction rate was used in the PRAD model for

Atmos. Chem. Phys., 21, 315–338, 2021                                               https://doi.org/10.5194/acp-21-315-2021
J. Dou et al.: Photochemical degradation of iron(III) citrate/citric acid aerosol 325
Table 2. Compilation of equilibria, chemical reactions, and corresponding rate constants in FeIII (Cit) photochemistry system.
Number Reactions Keq /kr /σ Sources
E1 H2 O OH− + H+ 1 × 10⁻¹⁴ M
E2 H3 Cit H2 Cit− + H+ 7.5 × 10⁻⁴ M Martell and Smith (1982)
E3 H2 Cit− HCit2− + H+ 1.7 × 10⁻⁵ M Martell and Smith (1982)
E4 HCit2− Cit3− + H+ 4.0 × 10⁻⁷ M Martell and Smith (1982)
E5 Fe3+ + Cit3− FeIII (Cit) 1.58 × 10¹³ M−1 tuning parameter
E6 Fe3+ + Cit3− + H2 O 8.35 × 10⁷ M−1 tuning parameter
FeIII (Cit)(OH)− + H+
E7 Fe3+ + HCit2− FeIII (HCit)+ 2.51 × 10⁷ M−1 tuning parameter
E8 Fe2+ + HCit2− FeII (HCit) 1.935 × 10¹⁰ M−1 tuning parameter
E9 Fe3+ + H2 O FeIII (OH)2+ + H+ 4.57 × 10⁻³ M Smith and Martell (1976)
E10 O.−
2 +H
+ HO.2 6.3 × 10⁴ M−1 Bielski et al. (1985)
E11 Fe2+ + O=C(CH2 COO)2− 2 2 × 10³ M−1 tuning parameter
FeII [O=C(CH2 COO)2 ]
E12 2H+ + OH−. C(CH2 COO)2−
2 1.5 × 10⁶ M−2 tuning parameter
OH−. C(CH2 COOH)2
E13 2H+ + O=C(CH2 COO)2−
2 1.5 × 10⁶ M−2 tuning parameter
O=C(CH2 COOH)2
R1 FeIII (Cit) + hν →
Fe2+ + OH−. C(CH2 COO)2− 3.0 × 10⁻¹⁸ (at 375 nm) or 2.3 × 10⁻¹⁹
2 + CO2 Pozdnyakov et al. (2012)
(at 473 nm) cm2
R2 FeIII (Cit)(OH)− + hν →
Fe2+ + OH−. C(CH2 COO)2− −
2 + OH + CO2
R3 OH−. C(CH2 COO)2−
2 + O2 → 1 × 10⁶ M−1 s−1 Hug et al. (2001)
O=C(CH2 COO)2− .−
2 + O2 + H
+
R4 HO.2 + HO.2 → H2 O2 + O2 depends on aw tuning parameter
R5 Fe2+ + O.− +
2 (+2H ) → Fe
3+ + H O
2 2 1 × 10⁷ M−1 s−1 Rush and Bielski (1985)
R6 2+ . + 3+
Fe + HO2 (+H ) → Fe + H2 O2 1.2 × 10⁶ M−1 s−1 Rush and Bielski (1985)
R7 Fe2+ + H2 O2 → Fe3+ +. OH + OH− 76 M−1 s−1 Walling (1975)
R8 Fe2+ +. OH → FeIII (OH)2+ 4.3 × 10⁸ M−1 s−1 Christensen and Sehested (1981)
R9 FeII (HCit) + O2 → FeIII (Cit) + HO.2 0.05 M−1 s−1 tuning parameter
R10 C5 + hν → C3 + 2CO2 1 × 10⁻²¹ cm2 tuning parameter
R11 C4 + hν → C3 + CO2 1 × 10⁻²⁰ cm2 tuning parameter
R12 C5 + hν → C2 + C3 1 × 10⁻²² cm2 tuning parameter
R13 C4 + hν → C2 + C2 1 × 10⁻²¹ cm2 tuning parameter
R14 C5 + hν → C4 + CO2 1 × 10⁻²⁰ cm2 tuning parameter
R15 C5 _stable fraction 0.5 tuning parameter
R16 radical self-reaction 0 tuning parameter
https://doi.org/10.5194/acp-21-315-2021 Atmos. Chem. Phys., 21, 315–338, 2021326 J. Dou et al.: Photochemical degradation of iron(III) citrate/citric acid aerosol
Figure 6. (a) FeIII (Cit) / CA (molar ratio 0.05) particle mass change with irradiation time (log scale) at different RH: 33 % (red), 46 %
(green), and 61 % (blue). The irradiation wavelength was 375 nm, its intensity was 0.25 W cm−2 , and the experimental temperature was
293.5 K. (b) EDB experimental data in (a) with PRAD outputs at corresponding RH (with ±2 % RH uncertainty shown as shaded area) as a
function of irradiation time (linear scale).
analyzing the STXM/NEXAFS experiments shown in Fig. 7.
We note that our estimate of the photochemical reduction
rate and agreement with data is based on the reproducibil-
ity of setting up our optical system in the X-ray vacuum
chamber. In Fig. 8 (discussed below), this setup procedure
was performed for RH = 40 % and RH = 50–60 % indepen-
dently, and still, iron reduction was in agreement with model
predictions in the first minutes after UV light was switched
off. The width of the red shading in Fig. 7 is large and the
UV-fiber setup was likely the largest source of error for j .
A better estimate would require repeat measurements as a
function of RH, e.g., to elucidate any systematic uncertainty
on iron reduction reactions due to viscosity changes. How-
ever, this was not possible as usage of the X-ray beam for Figure 7. Loss of FeIII in FeIII (Cit) / CA (molar ratio of 1)
particles as a function of light exposure time determined using
STXM/NEXAFS experiments was limited to a few days to
STXM/NEXAFS at 293.5 K. Each data point is the average FeIII
complete all experiments. fraction over about 16–36 individual particles. An exponential fit,
In a different set of experiments, we irradiated particles β = β0 ejobs t , yields for the initial condition β0 = 0.93 ± 0.09 and
using a much lower power setting with j = 2.2×10⁻³ s−1 in a first-order decay rate of jobs = 0.08 ± 0.01 s−1 . The black shad-
a mixed He and O2 atmosphere and at a fixed RH for 15 min ing indicates 95 % confidence on the exponential fit. The PRAD
to reduce FeIII to FeII . The UV light was then switched off to model prediction and uncertainty are given as red solid line and
allow reoxidation in the dark while measuring β over time. shading, respectively, and use a calculated decay rate of jcalc =
Figure 8 shows β as a function of time at RH = 40 %, 50 %, 0.20 ± 0.12 s−1 .
and 60 %. Clearly, the FeIII fraction increased more signifi-
cantly more slowly with time at drier conditions. While parti-
cles were observed to reoxidize to β = 0.7 within 2 h at 60 % 3.3 Determination of iron(II) reoxidation rate with
RH and expected to be completely reoxidized within about single, levitated particles using EDB
6 h according to the PRAD model simulations, no significant
reoxidation occurred on this timescale for the particles ex- As the experiments with single, levitated particles yield only
posed to only 40 % RH. Modeling the reoxidation with the bulk properties and not the oxidation state of iron citrate di-
PRAD model yields very satisfactory agreement indicating rectly, we designed a dedicated experimental procedure to
that the diffusivity parameterizations of the model are cap- indirectly determine the reoxidation rate of FeII . We used
turing the RH dependence of the molecular transport in the multiple irradiation and reoxidation repetitions as shown
viscous matrix. schematically in Fig. 9. Initially, we exposed a newly in-
jected FeIII (Cit) / CA aqueous particle to blue laser irradi-
ation (473 nm, 4 W cm−2 ) in pure N2 for 500 s to ensure all
FeIII was reduced through photolysis (Reactions R1 and R2
listed in Table 2). As previously described, these reactions
Atmos. Chem. Phys., 21, 315–338, 2021 https://doi.org/10.5194/acp-21-315-2021J. Dou et al.: Photochemical degradation of iron(III) citrate/citric acid aerosol 327
Figure 9. Schematic of the experimental procedure to investigate
the reoxidation rate of FeII . Orange columns represent laser irradi-
ation (473 nm, 4 W cm−2 ). Each irradiation takes place in pure N2
for a period of 500 s. Grey columns mark the recovery process in
pure O2 in the dark; here the time interval is varied. For details, see
text.
Figure 8. Reoxidation of FeIII as a function of exposure time in
O2 from STXM observations. Time before 0 represents the initial
15 min irradiation procedure under He. FeIII (Cit) / CA (molar ratio
of 1) particles at 293.5 K with 40 % RH (red dots), 50 % RH (green
dots), and 60 % RH (blue dots). Lines: red (40 % RH), green (50 %
RH), and blue (60 % RH) are the FeIII fractions predicted using
the PRAD model, the shaded areas indicate model output assuming
±2 % RH, ±0.07 initial FeIII fraction, and ±1.8 % light intensity
uncertainty in the STXM experimental conditions.
Figure 10. Temporal evolution of two Mie-resonance wavelength
led to CO2 production with subsequent loss of CO2 to the gas shifts and particle mass changes normalized to the wavelength and
phase, which was observed as a shift in the Mie-resonance mass prior to irradiation; the experiment was done at 48 % RH and
293.5 K. The orange area marks the time with irradiation (473 nm,
wavelength. This shift is shown in Fig. 2b and on an enlarged
4 W cm−2 ). Black: first irradiation with a fresh FeIII (Cit) / CA par-
scale in Fig. 10. After irradiation, we switched the gas flow ticle in N2 , red: irradiation in N2 right after the particle recovered in
from N2 to O2 in the dark, and FeII was oxidized back to FeIII O2 for 45 min in the dark. Two horizontal dashed lines are indicat-
over time in this period, either by ROS (Reactions R5–R8) or ing the final mass remaining after CO2 loss to the gas phase. For an
directly by O2 (Reaction R9). After a defined time spent in explanation of the scaling of the third axis, indicating the equivalent
O2 , the gas flow was switched back to N2 followed by irra- FeIII /Fetot ratio, see text.
diation to repeat the photolysis step done initially. The ratio
of the Mie-resonance wavelength shift of the two photoly-
sis steps was set to be proportional to the ratio of reoxidized yielded larger Mie-resonance shifts than those of the initial
FeIII /Fetot . These two steps (i.e., photolysis in N2 and reoxi- photolysis of the freshly prepared particle. This indicated that
dation in O2 ) were repeated several times, but between each the initial FeIII fraction was less than 1.0. Hence, we accord-
irradiation the particle was exposed to O2 for different time ingly normalized the FeIII fraction to the data at long (> 15 h)
periods. Following this procedure we intended to map out the exposure times. For the experiment included in Fig. 10, for
characteristic time for reoxidation at various RH. example, the initial FeIII fraction of the particle was 0.76, in-
An example of the corresponding raw data (293.5 K and dicating that the particle was partially reduced during sample
48 % RH) and retrieved oxidation state is shown Fig. 10. preparation. After the particle was totally photoreduced, ex-
Black circles indicate the first irradiation step with a fresh posure to O2 for 45 min did not reoxidize all reduced FeII to
FeIII (Cit) / CA particle, and red circles indicate the irradi- FeIII ; only 0.36 FeIII was recovered (as shown by two hori-
ation step that followed the particle after exposure to O2 zontal dashed lines in Fig. 10).
for 45 min in the dark. Clearly, the resonance wavelength Another set of experiments was done by starting
decreased more during the first irradiation than the sec- with freshly injected FeII (HCit) / CA particles instead of
ond. Therefore, we can conclude unambiguously that the FeIII (Cit) / CA. The only difference in experimental proce-
FeIII (Cit) / CA particle initially had more FeIII than what dure, compared to what is described above, is that there is
could be reoxidized in O2 for 45 min. Quantitative scaling, no first irradiation step. Instead, the particle is initially ex-
however, requires knowledge of the initial FeIII fraction. Our posed to O2 in the dark for a certain time interval, during
experiments showed that long exposure (tens of hours) to O2 which FeII is oxidized only directly by O2 (Reaction R9).
https://doi.org/10.5194/acp-21-315-2021 Atmos. Chem. Phys., 21, 315–338, 2021You can also read