Phylogeographic and phenotypic outcomes of brown anole colonization across the Caribbean provide insight into the beginning stages of an adaptive ...
←
→
Page content transcription
If your browser does not render page correctly, please read the page content below
Received: 7 September 2019 | Accepted: 18 December 2019
DOI: 10.1111/jeb.13581
RE SE ARCH PAPER
Phylogeographic and phenotypic outcomes of brown anole
colonization across the Caribbean provide insight into the
beginning stages of an adaptive radiation
R. Graham Reynolds1 | Jason J. Kolbe2 | Richard E. Glor3 | Marta López-Darias4 |
C. Verónica Gómez Pourroy5 | Alexis S. Harrison5 | Kevin de Queiroz6 | Liam J. Revell7,8 |
Jonathan B. Losos9
1
Department of Biology, University of North Carolina Asheville, Asheville, NC, USA
2
Department of Biological Sciences, University of Rhode Island, Kingston, RI, USA
3
Herpetology Division, Biodiversity Institute and Department of Ecology and Evolutionary Biology, University of Kansas, Lawrence, KA, USA
4
Island Ecology and Evolution Research Group, IPNA-CSIC, Tenerife, Spain
5
Department of Organismic and Evolutionary Biology, Harvard University, Cambridge, MA, USA
6
Department of Vertebrate Zoology, National Museum of Natural History, Smithsonian Institution, Washington, DC, USA
7
Department of Biology, University of Massachusetts Boston, Boston, MA, USA
8
Departamento de Ecología, Facultad de Ciencias, Universidad Católica de la Santísima Concepción, Concepción, Chile
9
Department of Biology, Washington University in Saint Louis, Saint Louis, MO, USA
Correspondence
R. Graham Reynolds, Department of Biology, Abstract
University of North Carolina Asheville, One Some of the most important insights into the ecological and evolutionary processes
University Heights, Asheville, NC 28804,
USA. of diversification and speciation have come from studies of island adaptive radiations,
Email: greynold@unca.edu yet relatively little research has examined how these radiations initiate. We suggest
Funding information that Anolis sagrei is a candidate for understanding the origins of the Caribbean Anolis
John Templeton Foundation; Museum of adaptive radiation and how a colonizing anole species begins to undergo allopatric
Comparative Zoology, Harvard University,
Putnam Fund for Research and Exploration; diversification, phenotypic divergence and, potentially, speciation. We undertook a
National Museum of Natural History; genomic and morphological analysis of representative populations across the entire
Directorate for Biological Sciences, Grant/
Award Number: 9318642; University native range of A. sagrei, finding that the species originated in the early Pliocene,
of Massachusetts Boston; European with the deepest divergence occurring between western and eastern Cuba. Lineages
Commission; University of California Davis
from these two regions subsequently colonized the northern Caribbean. We find
that at the broadest scale, populations colonizing areas with fewer closely related
competitors tend to evolve larger body size and more lamellae on their toepads. This
trend follows expectations for post-colonization divergence from progenitors and
convergence in allopatry, whereby populations freed from competition with close
relatives evolve towards common morphological and ecological optima. Taken to-
gether, our results show a complex history of ancient and recent Cuban diaspora with
populations on competitor-poor islands evolving away from their ancestral Cuban
The peer review history for this article is available at https://publons.com/publon/10.1111/jeb.13581
© 2019 European Society For Evolutionary Biology. Journal of Evolutionary Biology © 2019 European Society For Evolutionary Biology
J Evol Biol. 2020;00:1–27. wileyonlinelibrary.com/journal/jeb | 1
2   |                                                                                                                               REYNOLDS et al.

                                                  populations regardless of their phylogenetic relationships, thus providing insight into
                                                  the original diversification of colonist anoles at the beginning of the radiation. Our re-
                                                  search also supplies an evolutionary framework for the many studies of this increas-
                                                  ingly important species in ecological and evolutionary research.

                                                  KEYWORDS

                                                  adaptive radiation, convergent evolution, ecological release, morphometrics, next-generation
                                                  sequencing, phylogeography, population genomics

                                                                             communities (Bolnick, Svanback, Araujo, & Persson, 2007; Nosil
1 | I NTRO D U C TI O N                                                      & Reimchen, 2005; Yoder et al., 2010). Alternatively, populations
                                                                             might evolve directionally away from ancestral populations, owing
           Dedication: This manuscript is dedicated to the memory            to either idiosyncratic local selective pressures producing trait diver-
           of Lourdes Rodríguez-Schettino, a remarkable scientist            gence among populations (i.e. Price, Phillimore, Awodey, & Hudson,
           and major contributor to the systematics and ecology              2010), or general ‘relaxation’ towards a phenotypic optimum that is
           of Cuban anoles, including A. sagrei. Without her, the            favoured in the absence of competition resulting in similar pheno-
           present work (and so much else) would not have been               typic outcomes among populations (Lister, 1976b).
           possible.                                                             Caribbean Anolis lizards are well-known for their replicated adap-
                                                                             tive radiations on the islands of the Greater Antilles (reviewed in
        Interest in adaptive radiation has increased greatly over the last   Williams, 1969, Williams, 1983; Schluter, 2000; Losos, 2009), in which
two decades (Glor, 2010; Losos & Mahler, 2010; Parent & Crespi,              anole lineages have diversified ecologically and morphologically by
2009; Stroud & Losos, 2016; Yoder et al., 2010). Over a slightly lon-        specializing to use different microhabitats (Jackman, Losos, Larson,
ger period, the study of geographic variation, also known as phylo-          & Queiroz, 1997; Losos, Jackman, Larson, Queiroz, & Rodríguez-
geography, has similarly expanded (Avise, 2009; Knowles, 2009). In           Schettino, 1998; Mahler, Ingram, Revell, & Losos, 2013). A key fea-
many respects, these two areas of investigation are complementary.           ture of these replicated radiations is that almost all species are each
Research on adaptive radiation focuses on speciation and ecological          confined to a single island. That is to say, the radiations are indepen-
diversification (Glor, 2010; Losos, 2011a; Schluter, 2000; Yoder et al.,     dent because there has been almost no recent exchange of species
2010), whereas phylogeographic investigation focuses on intraspe-            between islands (at least prior to human activity (Helmus, Mahler,
cific differentiation through geographic space (Avise, 2000). Most phy-      & Losos, 2014)). These radiations, however, are quite old. The most
logeographic work focuses on patterns of genetic divergence among            recent molecular divergence-time estimates suggest that anoles may
populations, though the adaptive basis of phenotypic differentiation         have begun diversifying around 50 million years ago (Poe et al., 2017;
is also occasionally studied (e.g. Deagle, Jones, Absher, Kingsley, &        Román-Palacios, Tavera, & Castañeda, 2018). Given that the oldest
Reimchen, 2013; Thorpe, Barlow, Malhotra, & Surget-Groba, 2015;              known fossil anoles date to about twenty million years before the
Thorpe, 2017). Relatively few projects unite these two perspectives;         present (Sherratt et al., 2015), we have little direct evidence about
however, it is reasonable to suppose that in many cases adaptive radi-       the early stages of the Greater Antillean anole radiations, shrouded
ations are initiated by the geographic divergence among populations.         as they have been by the depths of time (Stroud and Losos, 2016).
A phylogeographic perspective should thus provide important insights         Phylogenetic analysis makes clear that anoles are descended from an
into the origins of adaptive radiation.                                      ancestral mainland taxon, some of whose descendants later diversi-
        Understanding the early stages of adaptive radiation is often        fied on the islands of the Greater Antilles. But the ecomorphology of
difficult, especially for old and diverse radiations for which little in-    that colonizing species is hard to infer owing to the enormous quan-
formation regarding ancestral taxa survives. Especially on islands,          tity of time that has elapsed and to the evolutionary lability of traits
a species in an adaptive radiation might bud off colonizing popula-          associated with anole ecomorphs, leading in turn to low confidence
tions that occupy areas allopatric to other members of the radiation         in deep-in-time ancestral reconstructions (Losos, 2011b; Losos & de
(Carlquist, 1974). In this context, studying such populations might          Queiroz, 1997; Poe, Goheen, & Hulebak, 2007).
serve as a good analogue to the ancestral species that first colonized           The evolution of multispecies communities is not a one-way
the islands, thus providing important insight into the earliest stages       street: some species that evolved in multispecies anole commu-
of adaptation and speciation that ultimately led to the radiation of         nities in the Greater Antilles have subsequently colonized smaller
the group (Grant, 1998). The ecological release or ecological oppor-         islands where very few or no other anole species occurred (Losos,
tunity hypotheses also suggest that populations colonizing areas             Irschick, & Schoener, 1994; Losos & de Queiroz, 1997; Poe et al.,
with fewer competitors should exhibit greater morphological trait            2007). Half a century ago, Ernest Williams noted that, in contrast to
variance than populations of the same species found in multispecies          the insular endemism that characterizes anole replicated radiations,
REYNOLDS et al.                                                                                                                             |     3

two species complexes, ‘A. carolinensis’ (more accurately A. porca-       subsequent colonization of depauperate communities might be ex-
tus given that Cuba appears to be the ancestral area for the complex)     pected to reverse this trend.
and A. sagrei, are widespread and relatively adept at colonizing over         The most thorough test of Williams’ hypothesis remains Lister’s
water (Figure 1a; Williams, 1969). Williams (1969) further suggested      (1976a,b) examination of seven populations of A. sagrei across
that much could be learned about anole evolutionary diversification       its range. Lister found that on islands with few or no other anole
via study of these two taxa. If co-occurrence with close relatives        species, A. sagrei perched higher off the ground than the other
leads species to occupy and adapt to specialized microhabitats, then      semi-terrestrial ‘trunk-ground’ habitat specialists of the Greater

F I G U R E 1 (a) Hypothesized spread of Anolis sagrei diaspora from an ancestral range in Cuba from Williams (1969), reprinted with
permission. (b) Our interpretation of the native range of A. sagrei across the Caribbean Basin (in dark grey). Note that it has been considered
unclear whether populations on Jamaica and in Mesoamerica are native or anthropogenically introduced. Proposed subspecies are
shown (after Schwartz & Thomas, 1975), and the other species within the sagrei species group are shown in western Cuba. Arrows show
hypothetical dispersal patterns in the sagrei group are overlaid on the map. Geographic points mentioned in the text are labelled. The
photograph, taken by the first author, is of a male A. sagrei from Conception Island, Bahamas
4   |                                                                                                                               REYNOLDS et al.

Antilles, including Cuban A. sagrei. Correspondingly, these popu-            that historical contingencies of the colonization process might lead
lations evolved better-developed toepads (more lamellae), a trait            to varying evolutionary outcomes across these islands.
that is linked to greater arboreality in anoles (Irschick, Herrel, &            This extraordinary colonizing ability, combined with its great abun-
Vanhooydonck, 2006). Despite the enormous amount of research                 dance and ability to thrive in many different habitats, suggests that
devoted to anoles in the subsequent 40 years (Losos, 2009), only a           A. sagrei might be a good model for the ancestor of the anole adaptive
few studies have been focused on the diaspora of either of these two         radiations (Losos, 2009; Williams, 1969). In this situation, as popula-
prolifically colonizing taxa (Glor, Losos, & Larson, 2005; Kolbe et al.,     tions in the A. sagrei diaspora are released from intense interspecific
2004), as well on whether or not colonizing lineages of either taxon         competition, we might expect them to experience ecological release
might have evolved under a scenario of ecological release (increased         (Lister, 1976a; Losos & de Queiroz, 1997; Nosil & Reimchen, 2005;
phenotypic variance) or directionally (divergent or convergent selec-        Wellborn & Langerhans, 2015; Yoder et al., 2010). Nevertheless,
tion in different populations) when freed from competitive interac-          more nuanced outcomes are also conceivable. Based on previous hy-
tion with congeners (or trophically similar species; Wright, 1981).          potheses related to evolution in West Indian anoles, we make four
        We aim to rectify this deficiency, focusing on A. sagrei, the        predictions of potential outcomes for populations descended from
most widely distributed anole species in the Caribbean (Figure 1b).          ancestors that occurred in multispecies communities, but which now
Although A. sagrei is a workhorse in both ecological and evolution-          find themselves in a relatively species-poor guild (Williams, 1969):
ary research programmes (e.g. Cox & Calsbeek, 2015; Driessens,
Huyghe, Vanhooydonck, & Damme, 2015; Bonneaud et al., 2016;                  1. ‘Trait Variance Expansion’. Island-colonizing populations might
Delaney & Warner, 2016; Fleishman et al., 2016; Logan, Duryea,                  have evolved greater morphological variance, owing to selection
Molnar, Kessler, & Calsbeek, 2016; Schoener, Kolbe, Leal, Losos, &              favouring increased niche breadth related to ecological release/
Spiller, 2017; Stroud, Giery, & Outerbridge, 2017; Kamath & Losos,              opportunity (e.g. Nosil & Reimchen, 2005; Bolnick et al., 2007;
2018; Lapiedra, Schoener, Leal, Losos, & Kolbe, 2018), we have here-            but this is not seen in Lesser Antillean anoles (Eaton, Larimer,
tofore lacked an understanding of the magnitude and geographic                  Howard, Powell, & Parmerlee, 2002; Losos & de Queiroz, 1997)).
distribution of genetic and morphological diversity within this wide-        2. ‘Intraspecific Divergence’. Island-colonizing populations might
spread species. From its ancestral origins in Cuba, A. sagrei has colo-         have evolved away from their immediate ancestral morphol-
nized the Bahamas Archipelago to the north and east, as well as the             ogy. Specifically, intraspecific phenotypic divergence increases
Cayman Islands, Jamaica (although human assistance in this case is              through time because individual populations tend to experience
debated), the Swan Islands (nearly 500 km south of the western tip              idiosyncratic directional selective pressures owing to environ-
of Cuba) and the Atlantic versant of Honduras, Mexico and Belize                mental differences among colonized islands (e.g. Lister, 1976a;
(Figures 1b and 2a; not to mention several farther-flung inarguably             Price et al., 2010; Yoder et al., 2010).
anthropogenic introductions). Almost everywhere that it occurs               3. ‘Convergence’. Island-colonizing populations might evolve direc-
naturally (with the possible exception of marginal habitats in Cuba),           tionally towards a phenotypic optimum in the absence of competi-
A. sagrei is the most common anole, with densities in some places as            tors that differs from that of the progenitor populations existing in
high as one lizard per square metre (Schoener & Schoener, 1980).                environments with congeneric competitors (Lister, 1976b; Losos
        In their ecology and morphology, members of this species are clas-      et al., 1998).
sic ‘trunk-ground’ anoles (Williams, 1969), whose major habitat includes     4. ‘Evolutionary Contingency’. Island-colonizing populations might
broad structures low to the ground, such as tree trunks and boulders.           show no clear patterns of morphological diversification owing
In Cuba, where the species evolved as part of the Cuban anole radia-            to historically contingent differences among populations, such
tion (Kolbe et al., 2004; Williams, 1969) currently comprising at least         as differences among ancestral populations or in the genetic
64 extant species (Uetz and Hoŝek, 2016), A. sagrei occurs in com-              constitution of the individuals in founder populations (e.g. Price,
plex communities that can include as many as ten other anole species            Lovette, Bermingham, Gibbs, & Richman, 2000).
adapted to different structural and microclimatic niches (Rodríguez-
Schettino, 1999; Rodríguez-Schettino et al., 2010; Williams, 1969). By          Here, we examine these not mutually exclusive scenarios in
contrast, throughout much of the rest of its non-Cuban range, A. sagrei      A. sagrei across the complete native range of the species.
co-occurs with few or no other anole species. In the Bahamas, for ex-
ample, it can often be found on single-species islets that can be as
small as 10 m2 (Schoener & Spiller, 2010), as well as on larger islands      2 | M ATE R I A L S A N D M E TH O DS
with 1–3 other anole species (Buckner, Franz, & Reynolds, 2012).
        This geographic dispersion of A. sagrei suggests several interest-   2.1 | Phylogeography: Genetic sample collection
ing questions, most generally: How many times have islands been              and data
colonized directly from Cuba? Williams’ (1969) figure (reproduced
here as Figure 1a, perhaps not meant to be taken literally in its orig-      New genetic samples in this study represent collections span-
inal presentation) suggested as many as 12 dispersal events from             ning the last two decades by the authors and others. Our sampling
Cuba to other regions in the Caribbean, thus raising the possibility         of 298 individuals covered the range of A. sagrei, with between one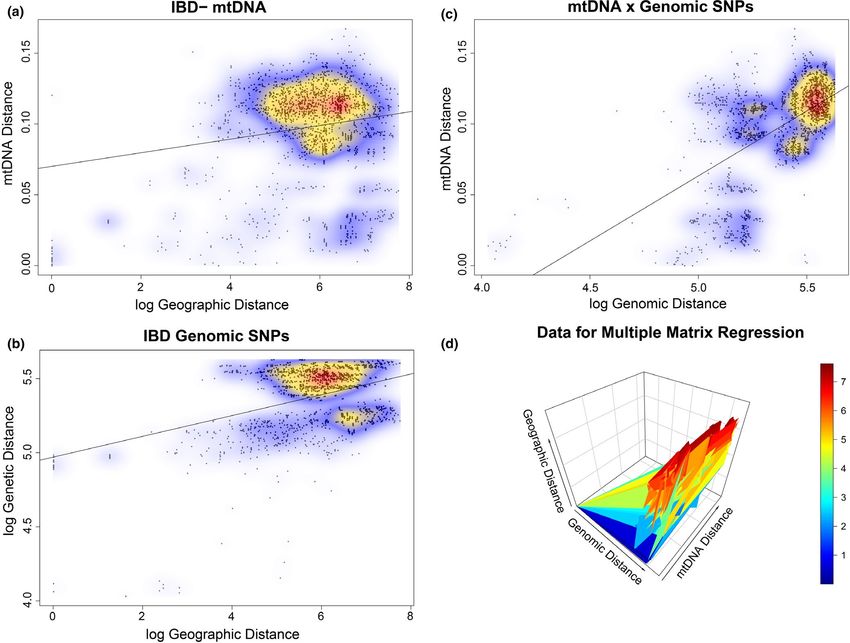
REYNOLDS et al.                                                                                                                           |   5

F I G U R E 2 (a) Map of sampling locations in this study, colour-coded by the mtDNA clade to which they belong. (b) Time-calibrated
mtDNA gene tree for Anolis sagrei from BEAST with nodal support shown. (c) Neighbour-joining SNP tree for a subset of samples from across
the range of Anolis sagrei. Tips are colour-coded by mtDNA clade to show correspondence between mtDNA and nucDNA phylogenetic
inferences. Map rendered in the R package marmap (Pante & Simon-Bouhet, 2013) from NOAA bathymetric data at a resolution of 1-arc
minute

and five genetic samples from each of 95 localities across the north-           To generate sequences for our samples we extracted whole ge-
ern Caribbean basin, including the Greater Antillean islands of Cuba         nomic DNA (gDNA) from tissue samples using the Wizard SV® Kit
(53 localities) and Jamaica (8 localities); the Great and Little Bahama      (Promega) and subsequently stored extracts at −20°C. We used
Banks (9 localities); Cayman Islands (4 localities); Swan Islands (‘Islas    the polymerase chain reaction (PCR) to amplify a fragment of the
de Cisne’); and 15 localities on mainland Mesoamerica (Mexico, Belize        mitochondrial genome (NADH subunit 2 [ND2]; primers from
and Honduras) (Figure 2a; Table S1). We also sampled other species           Macey, Larson, Ananjeva, & Papenfuss, 1997; conditions in Revell,
closely related to A. sagrei, including A. bremeri, A. quadriocellifer and   Harmon, Langerhans, & Kolbe, 2007). We sequenced PCR products
A. homolechis (all of which are members of the A. sagrei series; Cádiz et    in both directions on an automated sequencer (ABI 3730XL) at the
al., 2013; also referred to as the Trachypilus clade by Poe et al., 2017).   Massachusetts General Hospital DNA Core Facility. We assembled
6 | REYNOLDS et al.
contigs and visually verified ambiguous base calls using Geneious® Drummond, 2013). We combined the results from the three analyses
7.1.2 (Biomatters). We then generated an alignment including ad- using Logcombiner and generated a maximum clade credibility (MCC)
ditional out-groups using the ClustalW 2.1 (Larkin et al., 2007) al- tree using Tree Anotator. We estimated genetic distances (Tamura-
gorithm implemented in Geneious using reference sequences and Nei [TrN] distances) between major clades using Mega 6.0 (Tamura,
default parameters. We deposited this alignment in Dryad (accession Stecher, Peterson, Filipski, & Kumar, 2013).
# pending). To examine nuclear diversity and divergence in the A. sagrei se-
We analysed the complete mtDNA data set using both maxi- ries, we selected a subset of 61 A. sagrei individuals representing
mum-likelihood (ML) and Bayesian methods. We selected the best- each of the 11 main mtDNA clades identified in our analyses above
fit model of molecular evolution for the ND2 locus (TrN + G) using and spanning the entire geographic range of the species. We se-
the Bayesian information criterion (BIC) in jModelTest2 (Darriba, lected a further eight individuals of closely related taxa (A. bremeri
Taboada, Doallo, & Posada, 2012; Guindon & Gascuel, 2003). We n = 4, A. quadriocellifer n = 2, A. homolechis n = 2) that were also rep-
conducted ML analysis using RAxML (Stamatakis, 2006) via the resented in our mtDNA data set. We conducted GBS (genotyping
RAxML plugin for Geneious 7.1.2. We used the GTRGAMMA model, by sequencing) using the nextRAD (Nextera®-tagmented reduc-
as the TrN model is not implemented in the software and the use of tively amplified DNA) GBS approach as implemented by SNPsaurus
the invariant sites parameter (I) has been recommended against in (Institute of Molecular Biology) followed by single nucleotide
RAxML (since RAxML, like all phylogeny inference software, imple- polymorphism (SNP) genotyping for these 69 samples from 58 lo-
ments a discretized Γ model, invariant sites are usually confounded calities. Briefly, nextRAD uses selective primers to amplify frag-
with one of the Γ rate categories; Stamatakis, 2006). We used the ments across the genome, as opposed to using restriction enzymes
rapid bootstrapping algorithm with 103 bootstrap (BS) replicates followed by size selection (Baird et al., 2008; Etter & Johnson,
followed by the thorough ML search option with 100 independent 2012). These fragments are initially generated using Illumina®
searches. We consider BS values above 95% to indicate well-sup- Nextera® tagmentation, followed by selective PCR amplification
ported clades and values >70% but < 95% to indicate moderately and ligation of sequencing adapters and barcoded indices (Russello,
supported clades (Felsenstein, 2004; Taylor & Piel, 2004). To gen- Waterhouse, Etter, & Johnson, 2015). Prior to library preparation,
erate rough estimates of divergence times across the mitochondrial we quantitated each of our gDNA samples using a Qubit® 2.0 fluo-
gene tree, we inferred a time-calibrated ND2 tree in the program rometer system. Genomic DNA was fragmented using the Nextera
Beast v2.1.2 (Bouckaert et al., 2014). We estimated this tree using reagent (Illumina®, Inc.), which also ligates short adapter sequences
a relaxed molecular clock model and a rate of molecular evolution to the ends of each fragment. This reaction calls for 15ng of gDNA
(1.3% pairwise divergence per million years) estimated via geologic per sample, though 22.5ng of gDNA was included to compensate
events in related agamid lizards (Macey et al., 1998) that has been for the degradation of some of our older samples. We then ampli-
widely used in other studies of anoles (e.g. Campbell-Staton et al., fied these fragments using a selective primer complementary to
2013; Creer, Queiroz, Jackman, Losos, & Larson, 2001; Gartner, the adapter sequences, which also includes a nine base-pair (bp)
Gamble, Jaffe, Harrison, & Losos, 2013; Glor et al., 2004; Glor, selective sequence (GTGTAGAGC). We conducted amplification
Kolbe, Powell, Larson, & Losos, 2003; Glor et al., 2005; Jackman, using PCR at 73°C for 26 cycles, during which only fragments of
Irschick, Queiroz, Losos, & Larson, 2002; Tollis, Ausubel, Ghimire, gDNA that were able to hybridize with the selective sequence are
& Boissinot, 2012). We relied on this estimated rate of pairwise di- amplified. We performed sequencing on an Illumina® NextSeq 500
vergence because few pre-Pleistocene fossil records exist for Anolis, at the Institute of Molecular Biology, Eugene, OR, using a high-out-
and the small number of specimens of amber-preserved anoles is ei- put run to generate ~ 400 million single-end sequencing reads 75bp
ther taxonomically ambiguous, making their placement on a phylog- in length. We initially quality-filtered our sequencing reads using
eny problematic (Castañeda, d. R., Sherratt, E., & Losos, J. B., 2014), Trimmomatic (Bolger, Lohse, & Usadel, 2014) to remove adapters
or is not very closely related to A. sagrei (Sherratt et al., 2015). We and low-quality reads (with a Phred score of < 20), resulting in a
ran BEAST for 100 million generations using the TrN + G substitu- mean of 4,178,671 reads per individual. We called SNPs using the
tion model, a Yule speciation prior and an uncorrelated lognormal SNPsaurus nextRAD pipeline. This pipeline consists of custom
(UCLN) relaxed molecular clock model. We repeated the analyses scripts (SNPsaurus, LLC) that create a de novo reference from abun-
three times sampling every 10 4 generations and discarding the first dant reads. All sequencing reads are then mapped to the reference
25% of generations as burn-in following analysis of likelihood trace with an alignment identity threshold of 93% (BBMap, http://sourc
files. All computations were conducted on the Odyssey cluster sup- eforge.net/projec ts/bbmap/). We called genotypes using Samtools
ported by the Harvard FAS Research Computing Group (odyssey.fas. and bcftools using the following flags: (samtools mpileup –gu –Q
harvard.edu). We assured adequate mixing of the chains by calcu- 10 –t DP, DPR –f ref.fasta –b anolis.align_samples | bcftools call –cv
lating the effective sample size (ESS) values for each model param- -> anolis.vcf). We converted the resulting variant-call format (VCF)
eter, with ESS values greater than 200 taken to indicate adequate genotype file to subsequent input files using PDGSpider (Lischer
sampling of the posterior distribution. We assessed convergence & Excoffier, 2012) after excluding loci with only missing data and
of the independent runs by a comparison of likelihood scores and nonpolymorphic loci, as well as SNPs with Phred scores less than
model parameter estimates in Tracer v1.5 (Rambaut, Suchard, Xie, & 10. This resulted in 31,702 polymorphic SNPs across 12,415 loci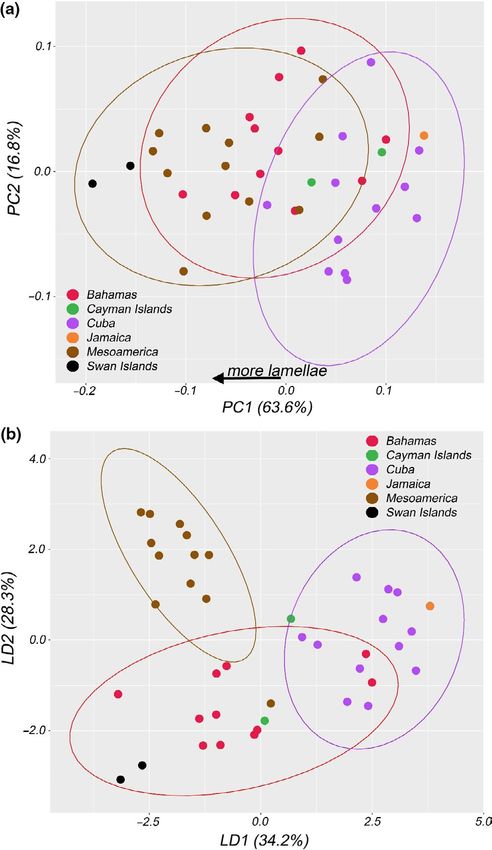
REYNOLDS et al.                                                                                                                                      |   7

(1–21 SNPs per locus), with an average of 7.62% missing data across            consisting of a run length of 106 generations and a burn-in of 25% fol-
69 genotypes of A. sagrei and out-groups.                                      lowing evaluation of convergence. We selected values of K using the
      We used the package vcfR (Knaus & Grünwald, 2017) in RStudio             ΔK method of Evanno, Regnaut, and Goudet (2005) implemented in
v1.0.136 (RStudio Team, 2016) running R v3.2.4 (R Development                  Structure Harvester (Earl & vonHoldt, 2012), and we visualized output
Team, 2016) to import and convert our VCF file within the R envi-              using Structure Plot (Ramasamy, Ramasamy, Bindroo, & Naik, 2014)
ronment. We first assessed the quality of the SNP data set by exam-            after using the Clumpp 1.1.2 (Jakobsson & Rosenberg, 2007) algorithm
ining the distribution of missing data and minor alleles, as well as the       to combine results across independent runs. As with DAPC, we used
distribution of SNPs across the 75bp reads using the R package ade-            a hierarchical set of analyses to examine natural evolutionary clusters,
genet   (Jombart, 2008; Jombart & Ahmed, 2011). We then calculated             or groups, across our data set. Our initial run consisted of the full 61
per-locus statistics including observed and expected heterozygosity            genotype SNP data set representing A. sagrei individuals from each of
(Ho and He) and FST to test for deviations from Hardy–Weinberg equi-           the mtDNA clades A–K (excluding the eight individuals representing
librium and to characterize genetic differentiation of populations.            other A. sagrei series species). Following this preliminary clustering, we
      As a first pass at understanding the relationships between the           subsequently ran nested substructure analyses as above.
populations represented in our SNP data set, we constructed a neigh-              We calculated Cavalli-Sforza and Edwards Chord distance (Dch;
bour-joining (NJ) tree using the R package      ape   (Paradis et al., 2016;   Takezaki & Nei, 1996), and Nei's distance (Ds; Nei, 1972) for each
Paradis, Claude, & Strimmer, 2004) after parsing the data with the             of the genomic groupings delimited in the above DAPC clustering
package    pegas   (Paradis, 2010). We visualized the tree using the pack-     analyses using the R package Heirfstat (Goudet, 2005). We tested
age   adegenet   (Jombart, 2008; Jombart & Ahmed, 2011). We do not             for isolation by distance (IBD) in the A. sagrei SNP data set (61 gen-
suppose that the relationships between all of the different populations        otypes) by calculating pairwise Dch genetic distances between
in our study are genuinely entirely ‘tree-like’ and as such we also con-       samples grouped by sampling locations in Heirfstat. We converted
structed a network using the neighbour-net algorithm implemented               sampling locations from latitude/longitude coordinates (decimal
in Splitstree v.4.13.1 (Huson & Bryant, 2006) and assessed support             degrees) to log-transformed Euclidean distance measures using the
among the major groups using 103 nonparametric bootstrap replicates.           G eographic Distance Matrix G enerator v1.2.3 (Ersts, 2017). We then
      Another approach to defining geographic evolutionary ‘groupings’         used   adegenet   (Jombart, 2008; Jombart & Ahmed, 2011) to test
is to detect the degree to which individual island populations, lineages       the hypothesis of IBD by computing matrix correlations (Mantel
within islands or island groups form natural clusters of evolutionarily        test; Mantel, 1967) between the matrices using the mantel.rtest()
related populations. To do this, we used two methods to examine clus-          function from the R package        ade 4   (Dray & Dufour, 2007) with
tering of individual SNP genotypes across A. sagrei sampling locations.        alpha = 0.05 and 10 4 repetitions. We also conducted IBD analyses
First, we used a discriminant analysis of principal components (DAPC;          on the mtDNA data from the same individuals used to generate the
Jombart, Devillard, & Balloux, 2010) implemented in the R package              SNP data set. We reduced the mtDNA alignment to these individu-
adegenet   (Jombart, 2008). This method attempts to maximize genetic           als and calculated genetic distances among them in Heirfstat using
differentiation between groups and minimize variation within groups            the Ds (Nei distance) model as a measure of minimum distances. We
by clustering individual genotypes using a principal component trans-          then conducted IBD analysis as above with the same geographic
formation of the genetic data prior to discriminant analysis. We used          distance data set.
a BIC approach to obtain the predicted number of clusters between                 To investigate whether a correlation exists between mitochon-
K = 1 and K = 20 after retaining n-1 PCs in optimizing the assignment of       drial genetic distance and nuclear genomic distance, as might be ex-
individuals to groups. To perform the DAPCs, we selected the optimal           pected given a strong phylogeographic signal (implicating allopatric
number of PCs to generate the discriminant functions using optim.a.            diversification), we conducted a multiple matrix regression (MMR)
score() in adegenet with 103 replications. We used a hierarchical set of       analysis (partial Mantel test) controlling for geographic distance. We
analyses to examine clustering across our data set. Our initial analysis       used the function mantel.partial() in the R package     vegan   (Legendre
included all 69 genotypes (including nominally different species within        & Legendre, 2012; Oksanen et al., 2014) to model the SNP distance
the A. sagrei series). We followed this with independent substructure          data set as the dependent matrix, and the geographic and mtDNA
analyses until we no longer detected multiple clusters. We examined            distance data sets as the independent matrices using a Pearson
loading plots to ensure that a small number of loci were not contribut-        coefficient and 103 permutations. We calculated genetic distances
ing to discriminant function loading.                                          and geographic distances as above, and simultaneously visualized
      A more explicit population genetic (allele frequency-based) ap-          the matrices using the surf3D() function in the R package         plot3D

proach to clustering is the Bayesian clustering algorithm Structure            (Soetaert, 2013).
(Pritchard, Stephens, & Donnelly, 2000), which uses an MCMC ap-
proach to cluster K groups based on individual allele frequencies. We
trimmed our SNP data set to include only the first SNP from each of            2.2 | Phenotype: Quantitative trait diversification
the first 1,000 loci to retain only presumably independent loci for
clustering analyses (Pritchard et al., 2000). We used the admixture            Our scenarios for trait evolution in diasporic A. sagrei posit that we
model and 10 replications of K = 1 to K = 10, with each replication            might see one or more of the following patterns: an expansion of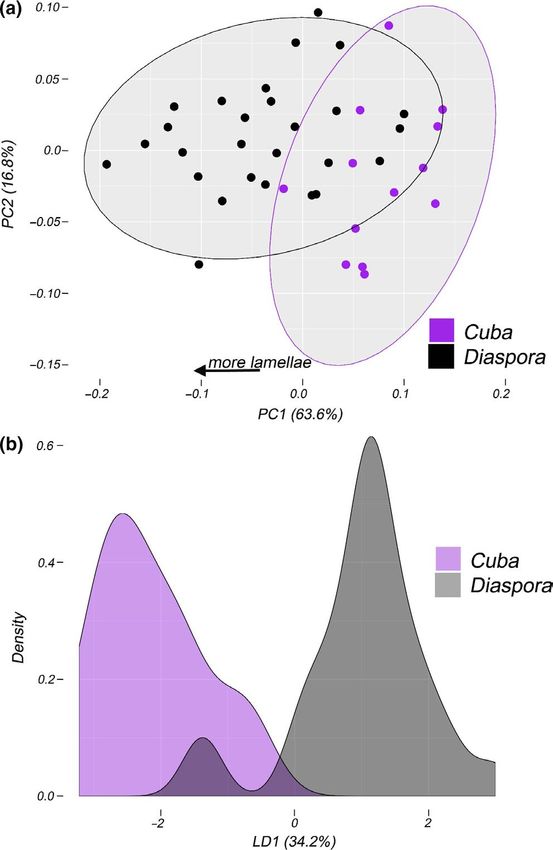
8   |                                                                                                                          REYNOLDS et al.

trait variance within populations, a shift in trait values among popu-    potentially correlated among species in Anolis (Glossip & Losos,
lations (with populations evolving idiosyncratically or convergently      1997). We checked residuals for outliers and normality and used
or both) or no apparent pattern of trait evolution owing to evolution-    the residuals for subsequent analyses, taking the mean residuals for
ary contingency. To assess the evolution of presumably ecologically       each sampling site. We performed these and all ensuing analyses in
relevant quantitative morphological traits (QTs) in A. sagrei, we ex-     R, with a complete data set consisting of the residuals of the nine
amined 558 museum specimens representing 40 sampling locations            linear measurements and counts.
across the range of the species for which we also had genetic data.          We initially surveyed the data set for broad-scale clustering in
We measured intact and well-prepared individuals (e.g. no missing         a multivariate framework using both K-means and model-based BIC
limbs and body proportions undistorted by preservation) in the col-       clustering analyses which we implemented in the R package     mclust

lection of the Harvard Museum of Comparative Zoology (MCZ), sup-          (Fraley & Raftery, 2002; Fraley, Raftery, Murphy, & Scrucca, 2012).
plemented by specimens from the Museum of Vertebrate Zoology              We next used principal component analysis (PCA) to determine
at Berkeley (MVZ), the University of Kansas Biodiversity Institute        whether morphological variation in our nine-character QT data set
(KU), the Natural History Museum of Los Angeles (NHMLA) and the           is partitioned among Cuban anoles and their diaspora. We used pop-
Florida Museum of Natural History (FLMNH) (Table S2). To reduce           ulation mean residuals from size correction and examined loadings,
potential complications owing to sexual dimorphism, we selected           biplots and proportion of explained variance to examine our ability
only adult males, ascertaining this condition by the presence of two      to discriminate between these two groups. To test whether Cuban
or more of the following characteristics: an enlarged dewlap, a rela-     populations differed significantly from diaspora populations, we
tively wide tail base, everted hemipenes, enlarged post-anal scales       conducted MANOVA on all PC axes and then on residuals from a
and lack of a typical female dorsal colour pattern. We obtained a         regression of all QTs on SVL, followed by tests for mean trait shifts
radiograph of each individual using a Thermo Kevex cabinet X-ray          using independent t tests (Cuba vs. diaspora) on each of the nine QTs
system (Model PX510-16W) at the MCZ, with a setting of 30μa and           with Benjamini–Hochberg correction (Benjamini & Hochberg, 1995)
30kV and a standard metric ruler on the detector plate. We taped          for multiple tests. We calculated mean and variance of the size-cor-
each specimen to the detector plate to ensure that we obtained a          rected residuals for each trait grouped by Cuba or diaspora (Cuba
consistent plane of focus, and we conducted image acquisition with        n = 140; diaspora n = 420). Despite these groupings consisting of
Varian Image Viewing    and   Acquisition (v2.0, Varian Paxscan Medical   divergent evolutionary lineages (see below), we are interested in
Systems). In addition, we scanned the toepads of each individual          whether a reduction in the number of sympatric anole species yields
using a standard flatbed scanner (Epson v500) at a resolution of          a detectable shift in morphological traits. We then used Levene's
1200–2600 dpi.                                                            test to test for trait variance expansion between Cuban and diaspora
        We analysed both radiographs and scans in the program Image J     populations followed by visualizing the data using density plots in
1.43 (Rasband, W.S., ImageJ, U. S. National Institutes of Health,         ggplot2   (Wickham, 2009).
Bethesda, Maryland, USA). A single observer obtained the fol-                Next, we assessed QT divergence within and among a series
lowing nine linear measurements for each radiograph (Figure S1):          of a priori groupings to determine whether relationships exist be-
snout–vent length (SVL), head length from tip of rostrum to poste-        tween morphological variation and geographic/genetic/taxonomic
rior of occipital (HL), head width behind the eyes (HW), snout width      grouping, or whether morphological variation is independent of
(SW), snout length (SL), upper jaw length (JL, average of left and        prior grouping. To do this, we first repeated the above PCA with
right sides), femur length (FL, average of left and right sides), tibia   points colour-coded by broad geographic region (Bahamas, Cayman
length (TL, average of left and right sides) and metatarsus IV length     Islands, Cuba, Jamaica, Mesoamerica and Swan Islands), to visualize
(MTL, average of left and right sides). We conducted symmetry and         among-group separation in morphometric space. We then assessed
repeatability measurements on a subset of individuals to ensure re-       whether QTs were different among regional groupings using an
liability of the measurements, with the average for left- and right-      ANOVA followed by post hoc Tukey tests. To then explicitly test
side measurements being used after excluding specimens scored as          our ability to use morphometric data to discriminate among a pri-
asymmetric or unrepeatable (details in Gómez Pourroy, 2014). We           ori groups, we conducted a linear discriminant function analysis
counted lamellae on scanned images of the fourth hind toe using           using the lda() function in the R package MASS (Venables & Ripley,
the ‘multipoint’ function in Image J. We followed the methodology         2002). This multivariate method maximizes variance among groups
outlined in Köhler (2014), with the slight modification of counting       specified a priori, rather than variance across the data set (as in
lamellar scales from the distal to the proximal ends of phalanges III     PCA). Our intention was to assess our ability to distinguish among
to V (numbered distal to proximal) of the fourth hind toe, beyond         groups defined by geographic region, genetic group (as identified in
the plane of the basal joint where the fourth toe meets the third         both the SNP and mtDNA data sets) and named subspecies. We fit
toe, to the last easily identifiable enlarged scale.                      models to various a priori groupings (Cuba/diaspora, Region, mtDNA
        We log-transformed quantitative trait data to reduce skew and     group, DAPC group, Structure group and Subspecies) against popu-
obtained residuals from a regression of each of the eight sets of lin-    lation means of size-corrected residuals from nine morphological
ear measurements against SVL to control for overall size. We also         measurements and assessed the intragroup variance represented
size-corrected lamella counts, as body size and lamella number are        by each discriminant function. We plotted the first two LD axes to
REYNOLDS et al. | 9
visualize group discrimination. We then estimated our ability to use was well-supported (Figure 2b). We collapsed the tree into 11 nono-
the discriminant axes to predict group membership for individual verlapping clades representing biogeographic breaks (Figure 2b).
populations. To do so, we used the predict() function in the MASS As in previous studies (Cádiz et al., 2013; Kolbe et al., 2004; Kolbe,
package to generate predicted population assignments based on Larson, Losos, & Queiroz, 2008), a core clade of A. sagrei hap-
the LD axes. We then determined the proportion of times in which lotypes (clades A–J) is distributed across the range of the species
that population was correctly assigned to its prior grouping (pro- (Figure 2a,b), as well as a sister clade (clade K) containing a mixture
portion of correct assignments = PoCA). We followed this by using of A. sagrei, A. quadriocellifer and A. bremeri haplotypes from western
a one-tailed exact binomial test to determine whether we were Cuba (Pinar del Río Province) with a tentative coalescent time (given
more successful than expected by chance in our ability to correctly caveats, see Methods) in the late Miocene or early Pliocene 6.4 Ma
reassign a population to a group based on LDA of QTs. (BS = 87; PP = 0.42; 95% highest posterior density interval [HPD]
At such a broad geographic scale, morphological variation could 7.4–5.5 Ma). We hereafter refer to the inclusive clade composed of
simply be related to geographic distance (‘morphological isolation by clades A–K as A. sagrei (sensu lato), whereas clades A–J represent
distance’). To investigate whether morphological divergence is cor- A. sagrei (sensu stricto). The node subtending A. sagrei sensu lato and
related with geographic distance, we performed independent matrix the out-group A. homolechis had a coalescent time of 6.8 Ma (95%
correlation analyses (Mantel tests) between geographic distances HPD 8.5–5.4 Ma). There is coalescence between eastern (I and J) and
and each of the first three PCs (which encompassed the majority western (A, B, C and E) Cuban clades in the early Pliocene 5.2 Ma
of the variance) from the morphological data set. We converted the (BS = 96; PP = 0.99; 95% HPD 5.9–4.5 Ma), with a contact zone east
latitude/longitude coordinates (decimal degrees) associated with the of Camagüey, Cuba.
museum specimens to UTM coordinates using the convUL() func- Based on our tree topology, we inferred that subsequent dis-
tion in the R package PBSmapping (Schnute, Couture-Beil, Haigh, & persals from Cuba have given rise to other Caribbean populations
Kronlund, 2013). We then calculated pairwise Euclidean distance (Figure 2b,c). The Bahamas contain two nonsister mtDNA clades
matrices from each of the orthogonalized PC axes and the log-trans- (D and F), possibly resulting from independent colonization events
formed geographic distances. We conducted Mantel tests as above from western Cuba (Figure 2b). These clades are not partitioned by
using the mantel.randtest() function in the R package ade4 (Dray & island bank: instead, clade D is represented on the western Great
Dufour, 2007) with 103 permutations. Bahama Bank (BS = 86; PP = 1; 95% HPD 4.1–2.8 Ma), whereas clade
We tested phylogenetic signal in our QT data set by pruning our F (BS = 51; PP = 0.99; 95% HPD 5.4–4.2 Ma) is distributed on the
ultrametric Bayesian mtDNA tree to lineages for which we could eastern Great Bahama Bank, the Little Bahama Bank and the south-
obtain QT means for each tip. We then reconstructed continuously ern Bahamas banks (San Salvador Bank and Crooked/Acklins Bank;
valued QT lineage means along the phylogenetic history of A. sagrei Figure 2b,c). We found evidence for a single dispersal to the Cayman
using the function contMap() in the R package phytools (Revell, 2012, Islands from East Cuba (BS = 92; PP = 1; 95% HPD 4.1–2.9 Ma), with
2013). We obtained residuals for each QT by fitting a phylogenetic Cayman Brac (clade G) and Little Cayman (clade H) populations being
regression against body size (SVL) using phyl.resid() in phytools (Revell, reciprocally monophyletic and moderately divergent sister clades
2009). We tested for phylogenetic signal in each of the continuous (BS = 100; PP = 1; 95% HPD 3.1–1.7 Ma).
traits by calculating Pagel’s (1997, 1999) λ using phylosig() in phytools Our Bayesian and ML analyses of the mtDNA data identified
to examine whether these QTs are evolving in concert with the phy- two distinct clades present in Mesoamerica, both of which are
logeny (λ close to zero implies that the trait is poorly correlated with nested within the south Cuban clade (clade I; Figure 2b,c; Figure
the phylogeny and thus may be homoplastic). We conducted 103 S2). The first clade contains haplotypes from Mesoamerica as well
Brownian motion simulations of the null hypothesis of homoplasy for as Little Swan Island and is divergent from Cuban members of
each QT to generate P-values for tests of phylogenetic signal. clade I with a coalescent time of 1.6 Ma (BS = 80; PP = 0.9; 95%
HPD 1.8–1.3 Ma; Figure S2). The Little Swan Island population is
sister to a haplotype from Campeche, Mexico (BS = 97; PP = 1;
3 | R E S U LT S 95% HPD 0.8–0.3 Ma), which together are distinct from a sister
Mesoamerican clade (BS = 99; PP = 1; 95% HPD 1.4–0.8 Ma) con-
3.1 | Phylogeography: Genetic sample collection sisting of 18 Mesoamerican haplotypes from Veracruz south-east
and data to Honduras (including four other Campeche, MX haplotypes). The
second Mesoamerican clade consists of only three haplotypes from
We generated an alignment of 1,101 bases for the mitochondrial Belize and Honduras, which are sister (BS = 82; PP = 1) to haplo-
ND2 sequence data (full coding sequence plus 3’ tRNA-TRP) from types from South Cuba (and western Jamaica). Great Swan Island is
298 A. sagrei series haplotypes, as well as individuals from the out- not sister to Little Swan Island (Figure S2); instead, it is represented
groups A. homolechis, A. mestrei and A. ophiolepis which we obtained by a separate clade nested within the South Cuba clade (I), albeit
through both direct sequencing and from online sequence reposito- with low nodal support (BS = 49; PP = 1; 95% HPD 1.0–0.6 Ma).
ries (Table 1). Both Bayesian and ML analyses resulted in similar esti- Jamaica has haplotypes representing two divergent mtDNA
mated topologies for the ND2 gene tree (Dryad # forthcoming) that clades (clades I and J), with the south Cuba clade I represented in10 | REYNOLDS et al.
TA B L E 1 Mitochondrial DNA summary statistics for Anolis sagrei clades
Mean coalescent
Clade N n S h π time (Mya) 95% HPD (Mya) Posterior probability Bootstrap %
A 35 31 44 0.99 ± 0.01 0.006 ± 0.003 3.2 3.7, 2.7 1 93
B 6 6 13 1.00 ± 0.09 0.005 ± 0.003 3.2 3.7, 2.7 1 93
C 7 5 15 0.90 ± 0.10 0.005 ± 0.003 3.8 4.3, 3.3 1 99
D 23 8 9 0.82 ± 0.06 0.002 ± 0.001 3.4 4.1, 2.8 1 86
E 33 18 26 0.91 ± 0.03 0.004 ± 0.002 3.4 4.1, 2.8 1 86
F 28 25 53 0.99 ± 0.01 0.009 ± 0.005 4.8 5.4, 4.2 0.99 51
G 8 4 10 0.75 ± 0.14 0.004 ± 0.003 2.4 3.1, 1.7 1 100
H 4 2 1 0.67 ± 0.20 0.001 ± 0.001 2.4 3.1, 1.7 1 100
I 11 5 9 0.71 ± 0.14 0.002 ± 0.001 3.5 4.1, 2.9 0.96 92
J 7 4 7 0.86 ± 0.10 0.002 ± 0.001 4.0 4.7, 3.4 1 100
K 7 6 13 0.95 ± 0.09 0.004 ± 0.003 6.4 7.4, 5.5 0.42 87
Note: N = number of individuals, n = number of haplotypes, S = number of segregating sites, h = haplotype diversity ± SD, π = nucleotide
diversity ± SD. Coalescent times, highest posterior density (HPD) and posterior probabilities are from a molecular clock-calibrated analysis in BEAST,
whereas bootstrap percentages are from a maximum-likelihood (ML) analysis in RaXML.
TA B L E 2 Results from Mantel tests for
↓Dependent | mtDNA
correlation between geographic, genetic
Data set and method Independent→ Geographic Distance Distance
and morphological distance pairings.
Genetic data Genetic distances are calculated as the
Mantel test mtDNA distance r = .15, p = .016 – Cavalli-Sforza chord distance (SNPs) or
Nei's pairwise distance (mtDNA). Multiple
Mantel test SNP distance r = .41, p < .001* r = .53,
matrix regression is a partial Mantel test
p = .001*
for correlation between two matrices
Multiple matrix SNP distance – r = .52, when controlling for a third
regression p = .001*
Morphometric Data
Mantel test PC1 r = .18, p = .001* –
Mantel test PC2 r = −0.06, p = .85 –
Mantel test PC3 r = .02, p = .33 –
*Significant at p < .05.
the west and the east-central Cuba clade J represented in the east there is no evidence for bias attributable to a minority of loci
(Figures S2 and S3). Western Jamaican (clade I) haplotypes are in- (Figure S5). Missing data and minor alleles were distributed evenly
terdigitated with, and minimally divergent from, Cuban haplotypes across the matrix of individuals and SNPs (Figure S6), with an av-
from the vicinity of Portillo (Figure S2). Eastern Jamaican (clade J) erage of 6.5% missing data per individual (mode = 2.6%) except for
haplotypes on the other hand form a monophyletic group (BS = 99; the two individuals of the out-group A. homolechis (50% and 49%
PP = 1) sister to two of four haplotypes from Vertientes, Cuba, with a missing data, probably owing to a combination of sample degrada-
coalescent time of 0.5 Ma (95% HPD 0.7–0.3 Ma; Figure S3). tion and lower orthology relative to filtered in-group SNPs). Many
Genetic distances (Tamura-Nei [TrN] distances) between major alleles are nearly fixed across individuals, although a large num-
mtDNA clades ranged from 6.1% pairwise divergence (Cayman Brac ber occur at intermediate allele frequencies (Figure S4). Observed
Clade G–Little Cayman Clade H) to 15.3% (Western Cuba Clade K– heterozygosity (Ho) varied among loci (Figure S7) and a significant
Western Bahamas Clade D; Table S3). There is a significant pattern difference (Bartlett test of homogeneity of variances K 2 = 91.22,
of isolation-by-distance in the mtDNA data set, although the correla- p < .001) existed between expected heterozygosity (He) and Ho on
tion between genetic and geographic distance explained little of the a per-locus basis (Figure S8), just as we might expect due to popu-
variation (r = .17, p = .001; Table 2, Figure 3a). lation subdivision.
We used 31,702 polymorphic SNPs (12,415 loci) among 69 As in the mtDNA data set, the deepest split in the nuclear ge-
individuals to better characterize genetic structure of A. sagrei nomic data set occurred between East Cuba and West Cuba, as
across the northern Caribbean. These SNPs were evenly distrib- visualized by both an NJ tree (Figure 2c) and a phylogenetic net-
uted across the 75bp sequence reads (Figure S4; average depth of work (Figure 4). We also found phylogenetic groupings concor-
sequencing 20×), and whereas some loci might be under selection, dant with the mtDNA data set for other geographic regions, withREYNOLDS et al. | 11 F I G U R E 3 Relationships between genetic and geographic distance in Anolis sagrei across the Caribbean Basin, showing (a) an isolation- by-distance (IBD) plot for the mtDNA data set, (b) IBD for the nuclear data set, (c) a regression with the relationship between the dependent matrix of SNP distance on the independent matrix of mtDNA distance and (d) a visualization of the matrices from the multiple matrix regression (partial mantel test) showing the relationship between SNP and mtDNA distances when controlling for geographic distance. Note that mtDNA distance (axis z) is less dependent on geographic distance (axis y), whereas SNP distance (axis x) has a greater correlation with geographic distance (axis y) the Cayman Islands representing a highly divergent split from the by the next likely clustering of K = 4 separating East Cuba, West rest of A. sagrei (minimum Ds = 0.16; Table S4). Contrary to the Cuba, the Cayman Islands and the Bahamas (Figure 5a; Figure S9). results from mtDNA, Bahamian lineages represent a single clade Within the West Cuba group (20 genotypes), there are two clus- separated from those in western Cuba (minimum Ds = 0.18; Table ters, separating the Bahamas from Cuba (Figure 5a; Figure S9). We S4). Western Cuba has a series of clades that are discordant with also found two clusters in the East Cuba group (34 genotypes), the mtDNA phylogeographic breaks. One individual identified as separating South Cuba, the Swan Islands and Mesoamerica from A. quadriocellifer in our mtDNA tree (USNM 515920) belongs to the east-central Cuba and Jamaica (Figure 5a), though most of these West Cuba lineage of A. sagrei (Figures 2 and 4). The Mesoamerican populations show some representation (assignment uncertainty and Swan Island populations are sister to each other, and unlike in possibly due to admixture) from both genetic clusters (Figure S9). our mtDNA tree, are reciprocally monophyletic. As in the case with The next likely clustering for the East Cuba cluster is K = 5, which the mtDNA tree, Mesoamerican and Swan Island populations are separates geographic regions into clusters—the Swan Islands, South nested with the clade containing all of the South Cuba samples Cuba (admixed), Mesoamerica, Jamaica (admixed) and east-central (Figure 2c). Cuba (two samples admixed). In both cluster sets, Jamaica appears Our ΔK analysis on STRUCTURE runs of 1,000 SNP loci to be admixed between east-central Cuban lineages (Figure S9), as among 61 A. sagrei genotypes (Table 3) resulted in an initial par- predicted by mtDNA, and some admixture between these lineages titioning of East Cuba (plus the Cayman Islands, Swan Islands and is apparent on Cuba as well, suggesting gene flow between these Mesoamerica) and West Cuba (plus the Bahamas) at K = 2, followed regions.
12 | REYNOLDS et al.
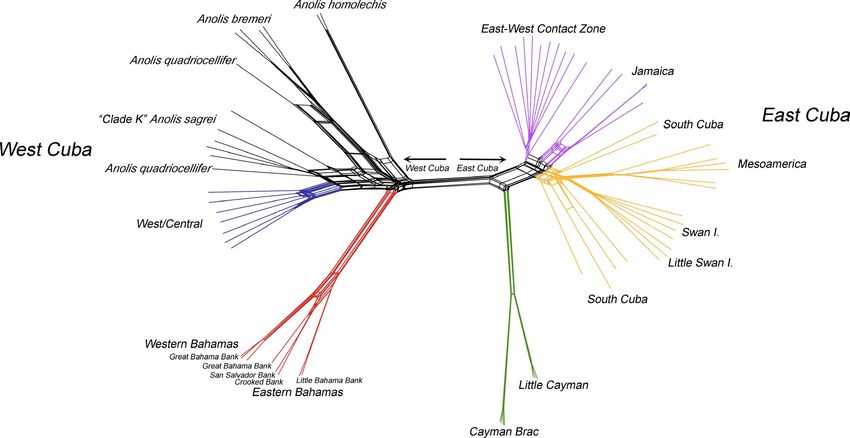
F I G U R E 4 Phylogenetic network of 12,415 SNP loci among 69 representative samples from across the range of Anolis sagrei. Major
nodes and nodes of interest with > 70% bootstrap support are labelled. Branches are coloured according to their genetic cluster assignment
determined using Structure, with other members of the Anolis sagrei superspecies (A. bremeri and A. quadriocellifer) and the A. sagrei series
(A. homolechis) coloured in black
TA B L E 3 Clustering analyses for the
Method Data set n K PCs Clusters
SNP data sets. Also, see Figures 4 and
DAPC All 69 5 5 Bahamas, West Cuba, East Cuba, 5. Data sets refer to inclusive (= ‘all’,
Caymans, Other Species including out-groups) and exclusive (Anolis
Anolis sagrei 61 3 2 West Cuba, East Cuba, Caymans sagrei sensu stricto) SNP genotype data
sets
West Cuba 20 4 3 West Cuba, West/Central Cuba, West
Bahamas, East Bahamas
East Cuba 34 3 2 East Cuba/Swan I., Mesoamerica, East
Cuba/Jamaica
STRUCTURE All – – – –
A. sagrei 61 2 – ECuba, WCuba
4 – ECuba, WCuba, Caymans, Bahamas
West Cuba 20 2 – WCuba, Bahamas
East Cuba 34 2 – E/C Cuba/Swan Islands/Central America,
E/S Cuba/Jamaica
5 – Swan Islands, E/C Cuba, Central America,
Jamaica, E/S Cuba
Discriminant analyses of 12,415 SNP loci implemented in DAPC included only A. sagrei sensu stricto samples, obtaining K = 3 (retain-
were largely congruent with Structure clustering (Table 3; Figure 5; ing 2 PCs) composed of West Cuba, East Cuba (including contact
Figures S10 and S11). For the initial analysis including both A. sagrei zone individuals) and the Cayman Islands. For the West Cuba group,
and other members of the A. sagrei series (A. bremeri, A. quadriocel- we found K = 4 (retaining 3 PCs), discriminating West Bahamas,
lifer, A. homolechis), we obtained K = 5 (retaining 5 PCs) composed north-east Bahamas, West Cuba and west-central Cuba. Within the
of Bahamas, West Cuba, East Cuba, Cayman Islands and other East Cuba group, K = 3 (retaining 2 PCs) distinguishes east-central
A. sagrei series species (Figure 5b; Figures S10 and S11). One of the Cuba plus Jamaica (no inferred admixture in Jamaica), South Cuba
samples of A. quadriocellifer was found to cluster with the Western (plus the Swan Islands) and Mesoamerica. We did not find evidence
Cuba group, and individuals from the East Cuba–West Cuba contact for discriminant functions being obviously driven by loadings of a
zone grouped with the East Cuba cluster. For the next analysis, we small number of loci (Figure S12).REYNOLDS et al. | 13 F I G U R E 5 Map showing genetic cluster assignments from (a) 1,000 SNP loci using the Bayesian clustering algorithm Structure and (b) 12,415 SNP loci using discriminant analysis of principal components
14   |                                                                                                                              REYNOLDS et al.

     Genetic distances (Cavalli-Sforza Chord and Nei's D) ranged          TA B L E 4 Analyses of quantitative traits for Anolis sagrei from
from 0.05 (South Cuba–Swan Islands–east-central Cuba) to 0.34–            Cuban and diaspora groupings

0.36 (Cayman Islands–West Bahamas) among major genetic clusters                                            Wilks    F         p
of A. sagrei (Table S4). Other A. sagrei series species (A. homole-
                                                                           MANOVA           All PCs        0.26         9.5
REYNOLDS et al. | 15 F I G U R E 6 Distributions of snout–vent length and residuals from size-corrected quantitative trait mean and variance in Cuban and diaspora groupings of Anolis sagrei. Each plot shows density plots of residual trait mean and variance in Cuban (red) and diaspora (blue) populations. Dotted lines are the mean for each group. The table lists values for mean and variance for each trait as well as results from Levene's test of trait variance. Significant values are in bold Our LDA approach also readily distinguished Cuban from dias- is strongly predictive of a priori geographic groupings among anal- pora lizards on a single LD axis (Figure 7b). Group prediction based yses. Our LD axes further demonstrated strong ability to discrimi- on LD axes suggested a 93% probability of correct group reassign- nate among a priori geographic groupings (Figure 9b; Table 5), with ment for either population based on LD1 (p < .001; Table 5). When an 88% probability of correct reassignment (PoCA), far higher than we overlaid geographic regions (Cuba, Bahamas, Cayman Islands, expected by chance (p < .001). We also found this method correctly Mesoamerica, Swan Islands) onto the PCA morphospace, we saw assigns individuals to their groups for all other a priori groupings that some regional diaspora groupings were especially well-differ- (Subspecies = 90%, DAPC = 80%, STRUCTURE = 85%, mtDNA = 85%) entiated from Cuban populations and to some extent each other, with much higher probabilities than expected by chance (Table 5). owing largely to differences in lamella number, which loads heavily There is a low, yet significant, correlation between geographic on PC1 (Figure 9a). Our ANOVA analyses showed significant differ- distance and morphological distance, as represented by the first ences among some geographic groups for all QTs (Figure S15). LDA orthogonal axis from our PCA analysis (Table 2; Figure S16). We generated some additional predictive assignment ability based on found evidence of phylogenetic signal (λ > 0) only for SVL (λ = 0.42, QTs. Our LDA indicated that most traits contribute to discrimination p = .008), suggesting that other morphological traits, such as more along LD axis 1 and/or LD axis 2 (Table S6), though leg length (TL, FL)
You can also read