Physical processes of cooling and mega-drought during the 4.2 ka BP event: results from TraCE-21ka simulations
←
→
Page content transcription
If your browser does not render page correctly, please read the page content below
Clim. Past, 15, 265–277, 2019
https://doi.org/10.5194/cp-15-265-2019
© Author(s) 2019. This work is distributed under
the Creative Commons Attribution 4.0 License.

Physical processes of cooling and mega-drought during the
4.2 ka BP event: results from TraCE-21ka simulations
Mi Yan1,2 and Jian Liu1,2,3
1 Key  Laboratory for Virtual Geographic Environment of Ministry of Education, State Key Laboratory of Geographical
Evolution of Jiangsu Provincial Cultivation Base, School of Geography Science, Jiangsu Center for Collaborative Innovation
in Geographical Information Resource Development and Application, Nanjing Normal University, Nanjing 210023, China
2 Open Studio for the Simulation of Ocean Climate Isotope, Pilot National Laboratory for Marine

Science and Technology, Qingdao 266237, China
3 Jiangsu Provincial Key Laboratory for Numerical Simulation of Large Scale Complex Systems, School of Mathematical

Science, Nanjing Normal University, Nanjing 210023, China

Correspondence: Jian Liu (jliu@njnu.edu.cn)

Received: 30 September 2018 – Discussion started: 11 October 2018
Revised: 5 February 2019 – Accepted: 5 February 2019 – Published: 12 February 2019

Abstract. It is widely believed that multi-decadal to cen-       mega-drought. The AMO-like pattern played a “bridge” role
tennial cooling and drought occurred from 4500 to 3900 BP,       in maintaining this barotropic structure in the atmosphere at
known as the 4.2 ka BP event that triggered the collapse of      a multi-decadal–centennial timescale. Our work provides a
several cultures. However, whether this event was a global       global image and dynamic background to help better under-
event or a regional event and what caused this event re-         stand the 4.2 ka BP event.
mains unclear. In this study, we investigated the spatiotempo-
ral characteristics, the possible causes and the related phys-
ical processes of the event using a set of long-term climate     1   Introduction
simulations, including one all-forcing experiment and four
single-forcing experiments. The results derived from the all-    Understanding the characteristics and mechanisms of cli-
forcing experiment show that this event occurs over most         mate changes during the Holocene can help predicting fu-
parts of the Northern Hemisphere (NH), indicating that this      ture changes. The multi-decadal to centennial abrupt climate
event could have been a hemispheric event. The cooler NH         change or the rapid climatic change during ca. 4.5–3.9 ka (be-
and warmer Southern Hemisphere (SH) illustrate that this         fore 1950 CE), the so-called “4.2 ka BP event”, was one of
event could be related to the slowdown of the Atlantic Merid-    the major climate events during the Holocene (Mayewski et
ional Overturning Circulation (AMOC). The comparison be-         al., 2004; Staubwasser and Weiss, 2006; Wang, 2009, 2010).
tween the all-forcing experiment and the single-forcing ex-      This event is considered to be closely linked to the cultural
periments indicates that this event might have been caused       evolutions of different regions of Eurasia such as the collapse
by internal variability, while external forcings such as or-     of the Akkadian empire, the termination of the urban Harap-
bital and greenhouse gases might have modulation effects. A      pan civilization in the Indus valley and the collapse of Ne-
positive North Atlantic Oscillation (NAO)-like pattern in the    olithic cultures around the Central Plain of China (Weiss et
atmosphere (low troposphere) triggered a negative Atlantic       al., 1993; Weiss and Bradley, 2001; Wu and Liu, 2001, 2004;
Multi-decadal Oscillation (AMO)-like pattern in the ocean,       Staubwasser et al., 2003; An et al., 2005; Staubwasser and
which then triggered a circum-global teleconnection (CGT)-       Weiss, 2006; Liu et al., 2013; Weiss, 2015, 2016). Moreover,
like wave train pattern in the atmosphere (high troposphere).    this event is also thought to be the transition of the Middle
The positive NAO-like pattern and the CGT-like pattern are       to Late Holocene (Walker et al., 2012; Finkenbinder et al.,
the direct physical processes that led to the NH cooling and     2016). However, the characteristics, causes and correspond-
                                                                 ing mechanisms behind this event remain unclear.

Published by Copernicus Publications on behalf of the European Geosciences Union.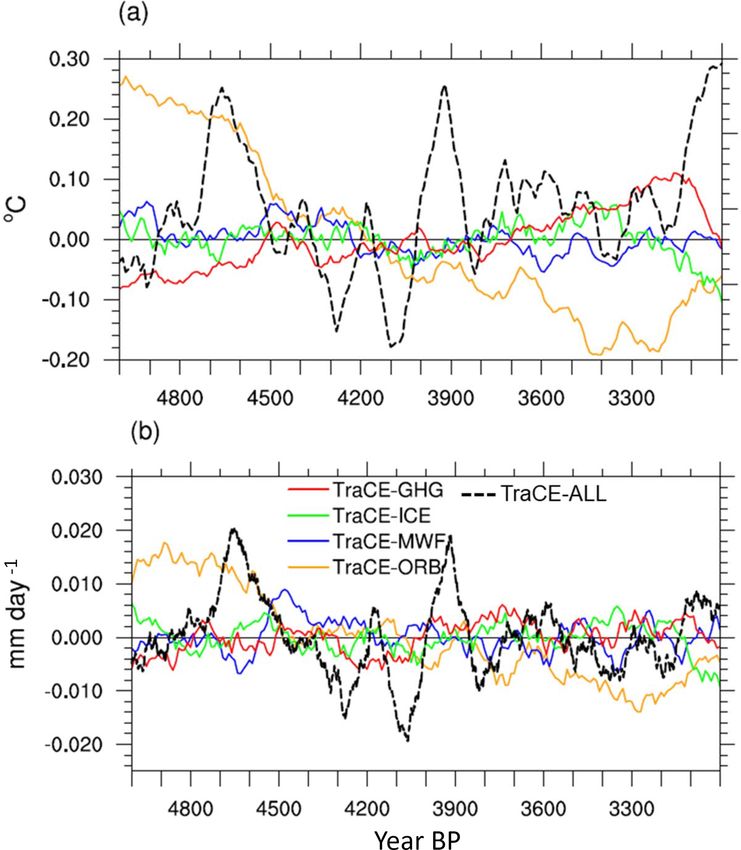
266                                  M. Yan and J. Liu: Physical processes of cooling and mega-drought in 4.2 ka BP event

   The 4.2 ka BP event is mostly characterized by rapid           is hard for reconstruction to provide a general record due to
events at various latitudes (Jansen et al., 2007), e.g., cool-    its limitations such as interpretation and spatial incomplete-
ing in Europe (Lauritzen, 2003), centennial mega-droughts         ness. The mechanisms behind the 4.2 ka BP event need to be
in North America (Booth et al., 2005), decreased precipita-       clarified.
tion in both southern and northern China (Tan et al., 2008),         Therefore, to improve understanding of the 4.2 ka BP
and the weakened summer monsoon in India (Nakamura et             event, new high-resolution reconstruction studies that fo-
al., 2016); however, the manifestation of this event is far       cus on the 4.2 ka BP event are required. On the other hand,
from convincing and needs more evidence and simulation            physically based modeling research can provide general con-
investigations (Roland et al., 2014). Many reconstructions        cepts of the characteristics of the event along with the causes
have shown that the 4.2 ka BP event is dominated by mega-         and the mechanisms. Climate simulations have been con-
droughts at a centennial scale over mid- to low latitudes         ducted to investigate another abrupt cooling event in the
(Tan et al., 2008; Yang et al., 2015; Weiss, 2016). However,      Early Holocene, the so-called 8.2 ka event. The simulations
Roland et al. (2014) found no compelling evidence, at least in    were used to test the hypothesis raised by the reconstruction
peatland records, to support that there was a 4.2 ka BP event     studies that the 8.2 ka event was most likely caused by fresh-
in Great Britain and Ireland. Moreover, according to the hy-      water forcing and was associated with a weakening of the
drologic cycle (i.e., the hydroclimate changes are often re-      Atlantic Meridional Overturning Circulation (AMOC) (Al-
gionally specific), it cannot be ruled out that there were no     ley and Agustsdottir, 2005; Ljung et al., 2008; Morrill et al.,
flooding events somewhere else during this period. For ex-        2013, 2014; Wagner et al., 2013; Matero et al., 2017). For
ample, Huang et al. (2011) and Tan et al. (2018) found that       example, the simulations argued that the meltwater from the
successive floods occurred over the middle reaches of the         collapse of the ice dome over Hudson Bay was an essential
Yellow River in China in association with the abrupt climatic     forcing of the 8.2 ka event (Wagner et al., 2013; Matero et al.,
event of 4.2 ka BP.                                               2017). However, little modeling work has been applied to the
   Understanding the causes and mechanisms of the                 4.2 ka BP event.
4.2 ka BP event can provide explanations for the recon-              Recently, Ning et al. (2019) briefly compared the spatial
structed discrepancies over different regions. For the causes     patterns of climate change in the ninth and fifth millennia BP
of the event, some reconstruction and modeling studies have       using a set of transient modeling results in a long-term per-
suggested that solar irradiance could have played an impor-       spective. In the present study, we will use the same set of
tant role in Early Holocene climate changes (Wang et al.,         simulation results to provide in-depth characteristics of the
2005; Rupper et al., 2009; Owen and Dortch, 2014); how-           4.2 ka BP event and will focus on the possible causes and
ever, no strong evidence has shown that the solar irradi-         mechanisms behind this event. The model and experiments
ance affected glacier fluctuations (cooling events) in the Late   are introduced in Sect. 2. The results are shown in Sect. 3.
Holocene since there is as yet no good mechanistic explana-       The possible causes and mechanisms are discussed in Sect. 4,
tions of how small changes in solar irradiance could signif-      and conclusions are drawn in Sect. 5.
icantly affect large-scale climate changes (Solomina et al.,
2015). Tan et al. (2008) thought that the 4.2 ka BP event         2   Model and experiments
could have been induced by the southward shift of the In-
tertropical Convergence Zone (ITCZ) and oceanic sea sur-          A set of transient simulations (TraCE-21ka, Simulation of
face temperature (SST) changes, as well as the vegetation         Transient Climate Evolution over the past 21 000 years; He,
feedback caused by the solar activity. Liu et al. (2013) and      2011) conducted with the Community Climate System model
Deininger et al. (2017) argued that the atmospheric circula-      version 3 (CCSM3) was used to investigate the spatial and
tion, such as the North Atlantic Oscillation (NAO)-like pat-      temporal characteristics of the 4.2 ka BP event and to deter-
tern but on a centennial timescale, could have played a more      mine the possible causes and mechanisms behind this event.
important role than the ocean circulation in this event, al-      The experiments are listed in Table 1, including one tran-
though the mechanisms that forced the circulation change re-      sient experiment with all forcings (TraCE-ALL), one single-
mained unclear. A new reconstruction study has also shown         forcing experiment forced only by transient orbital vari-
that the dry phases over the western Mediterranean in the pe-     ation (TraCE-ORB), one single-forcing experiment forced
riod of 4.5–2.8 ka generally agreed with positive NAO con-        only by transient meltwater flux (TraCE-MWF), one single-
ditions (Ramos-Román et al., 2018). However, studies come         forcing experiment forced only by a quasi-transient ice sheet
to different conclusions on the likely phase of the NAO-like      (TraCE-ICE) and one single-forcing experiment forced only
pattern during the Late Holocene (Finkenbinder et al., 2016).     by transient greenhouse gas concentrations changes (TraCE-
Some studies show positive NAO-type patterns during the           GHG). The simulations were conducted from 22 000 BP
Late Holocene (Tremblay et al., 1997; Sachs, 2007; Ramos-         to 1990 CE for the TraCE-ALL, the TraCE-ORB and the
Román et al., 2018), whereas others show negative NAO-like        TraCE-GHG experiments and from 19 000 BP to 1990 CE for
patterns (Rimbu et al., 2004). Since the mechanisms could be      the TraCE-MWF and the TraCE-ICE experiments.
a complex set of air–sea interactions (Roland et al., 2014), it

Clim. Past, 15, 265–277, 2019                                                                 www.clim-past.net/15/265/2019/
M. Yan and J. Liu: Physical processes of cooling and mega-drought in 4.2 ka BP event 267
Figure 1. Time series of (a) transient summer insolation (at 60◦ N
and 60◦ S) changes resulting from the orbital variation and (b) the
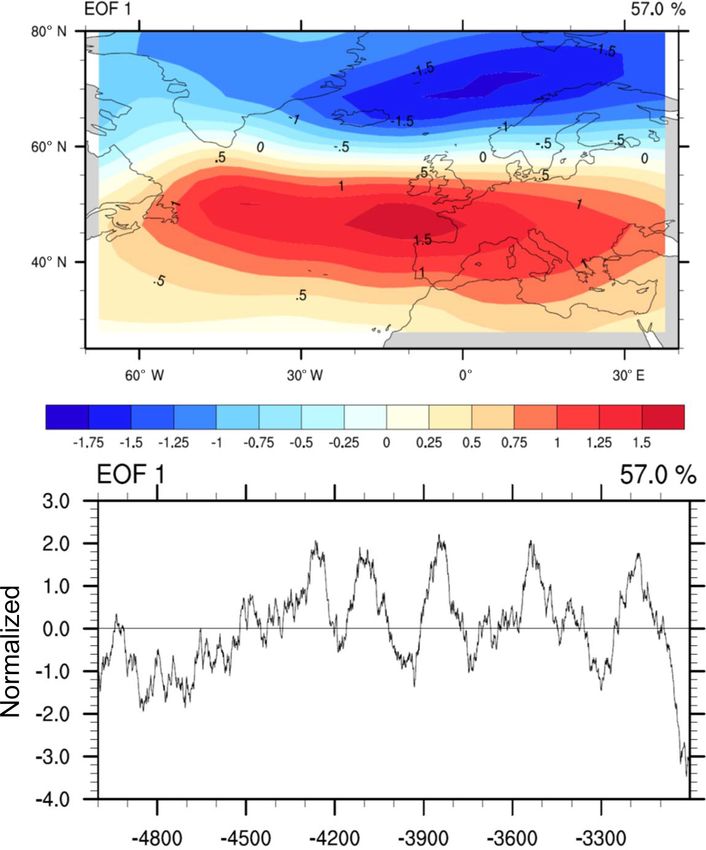
transient CO2 change used in the simulations. Figure 2. Time series of annual mean NH (a) surface temperature
anomalies and (b) precipitation anomalies derived from the TraCE-
ALL run (dashed black lines) and each single-forcing run (solid
color lines) from 5 to 3 ka. A 101-year running mean has been ap-
The transient June insolation changes at 60◦ N and 60◦ S plied to the time series.
that resulted from the orbital variation and the transient CO2
change used in the simulations are shown in Fig. 1. The
continental ice-sheet and topography changes are based on 3 Results
the ICE-5G (VM2) reconstruction (Peltier, 2004; He et al.,
2013). For the geography changes, the Barents Sea opens at 3.1 Identification of 4.2 ka BP event in the model
13.1 ka, the Bering Strait opens at 12.9 ka, Hudson Bay opens simulation
at 7.6 ka and the Indonesian throughflow opens at 6.2 ka.
The freshwater injected into Northern Hemisphere (NH) and The 101-year running mean annual NH surface temperature
Southern Hemisphere (SH) oceans are based on specific time and precipitation during 5–3 ka shows double-peak centen-
slices (e.g., 19 ka into North Atlantic, 17 ka into North At- nial cooling and drought from 4.4 to 4.0 ka (Fig. 2, dashed
lantic, 11.5 ka into Arctic, St. Lawrence River, Hudson Strait, black line). However, the variabilities are smaller over the
Barents Sea, North Sea, Ross Sea and Weddell Sea). Note SH than those over the NH. There is no significant cooling
that no freshwater was delivered to the ocean after 5000 BP and drought event during that period (Fig. S1 in the Supple-
in the TraCE-ALL and TraCE-MWF experiments. Detailed ment, dashed black line) over the SH. The SH precipitation
information about the experiment design can be found in even shows a double-peak wet condition during the period of
He (2011) and He et al. (2013). 4.4–4.0 ka.
The TraCE-21ka simulation was evaluated with recon- The double-peak centennial cooling and drought are still
structions and was found that it could reproduce major obvious when the 31-year running mean is applied to the time
deglacial temperature evolutions (Clark et al., 2012; Shakun series (not shown), which indicates that the simulated climate
et al., 2012). It has been used to depict the causes and mech- events are potentially comparable to the 4.2 ka event. More-
anisms of Holocene climate changes, such as the Bølling– over, the centennial warming periods right before and after
Allerød warming (Liu et al., 2009), cooling into the Younger the cooling event indicate that this event might be included in
Dryas and recovery to warm conditions (Liu et al., 2012), a quasi-millennium variation. Therefore, the 4.2 ka BP event
and the El Niño–Southern Oscillation (ENSO) evolution over could be a multiscale event, i.e., from multi-decadal to mil-
the past 21 kyr (Liu et al., 2014a). In the present work, lennium.
we adopted the period of 5000–3000 BP to focus on the The seasonal mean NH surface temperature changes show
4.2 ka BP event. that the annual mean variability is dominated by the boreal
www.clim-past.net/15/265/2019/ Clim. Past, 15, 265–277, 2019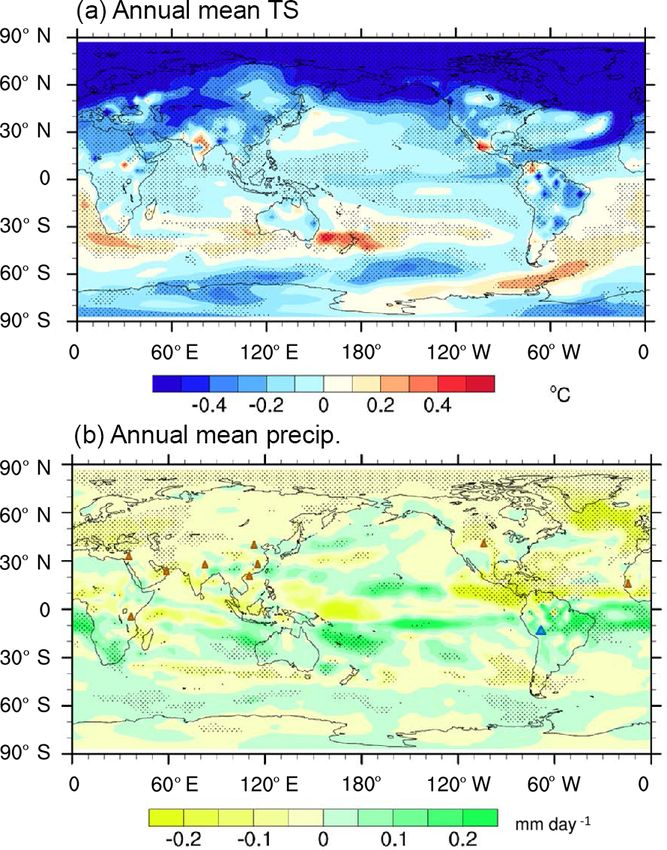
268                                    M. Yan and J. Liu: Physical processes of cooling and mega-drought in 4.2 ka BP event

Table 1. The information of the experiments used in this study.

      Experiments   Forcings                                                              Time spanning            Temporal resolution
      TraCE-ALL     Orbital, meltwater flux, continental ice sheet and greenhouse gases   22 000 BP to 1990 CE     Monthly mean
      TraCE-ORB     Orbital only                                                          22 000 BP to 1990 CE     Decadal mean
      TraCE-MWF     Meltwater flux only                                                   19 000 BP to 1990 CE     Decadal mean
      TraCE-ICE     Continental ice sheets only                                           19 000 BP to 1990 CE     Decadal mean
      TraCE-GHG     Greenhouse gases only                                                 22 000 BP to 1990 CE     Decadal mean

winter (December–January–February, DJF) surface temper-
ature change (Fig. S2). The correlation coefficient between
the annual mean NH surface temperature (NHT) and the DJF
mean NHT is 0.96 (after the 101-year running mean), which
is significant above the 99 % confidence level, much higher
than the correlation coefficient between the annual mean and
the boreal summer (June–July–August, JJA) mean of only
0.30 (after the 101-year running mean), which is not signif-
icant. However, this is different for the precipitation change,
for which both the JJA mean and the DJF mean contribute to
the annual mean precipitation change (not shown).
   To identify the characteristics of the 4.2 ka BP event, two
centennial cool periods and two centennial warm periods
that exceeded ±0.5 standard deviations are selected. The two
centennial cool periods span from 4320 to 4220 BP and from
4150 to 4050 BP, and the two centennial warm periods span
from 4710 to 4610 BP and from 3980 to 3880 BP.

3.2     Spatial characteristics of surface temperature and
        precipitation
To help draw a coherent global view of the 4.2 ka BP event,
the spatial characteristics of temperature and precipitation
changes during the 4.2 ka BP event are shown in Fig. 3.
   Figure 3a gives the spatial distribution of the annual mean
surface temperature difference between the cold periods and
the warm periods. The cooling significantly occurred over               Figure 3. Spatial distribution of the annual mean (a) surface tem-
most regions of the NH, especially over the middle to high              perature (TS) and (b) precipitation differences between the cold pe-
latitudes of the NH and most land regions of the SH. Most               riods and warm periods derived from the TraCE-ALL run. Those
parts of India, northern Mexico and the middle latitudes of             regions which were significant above the 95 % confidence level are
the SH ocean experienced warm conditions. Such asymmet-                 dotted. Triangles in (b) denote the dry (orange) and wet (blue) con-
ric change between the hemispheres (cool NH and warm SH)                ditions documented in the records, including the following sites:
favors the southward shift of the ITCZ. The spatial distri-             Kilimanjaro (3◦ 04.60 S, 37◦ 21.20 E) (Thompson et al., 2002), Dead
bution of the surface temperature change is still dominated             Sea (Yechieli et al., 1993), Gulf of Oman (24◦ 23.40 N, 59◦ 2.50 E)
by the boreal winter pattern (not shown). The large cooling             (Cullen et al., 2000), Lake Rara (29◦ 320 N, 82◦ 050 E) (Nakamura
                                                                        et al., 2016), Maar Lake in Huguangyan (21.15◦ N, 110.29◦ E) (Liu
over the NH and small warming over the SH could be related
                                                                        et al., 2000), Daihai Lake (40.58◦ N, 112.7◦ E) (Peng et al., 2005),
to the orbital change (Fig. S3), which induces insolation in-
                                                                        Poyang Lake (29.15◦ N, 116.27◦ E) (Ma et al., 2004), eastern Col-
creasing over the SH but decreasing over the NH.                        orado Dunes (40◦ 200 N, 104◦ 160 E) (Forman et al., 1995), Lake
   The spatial distribution of annual mean precipitation dif-           Titicaca (12.08◦ S, 69.85◦ W) and Lake Guiers (16.3◦ N, 16.5◦ W)
ferences between the cold periods and the warm periods is               (Marchant and Hooghiemstra, 2004).
shown in Fig. 3b. During the cold periods, significant drought
is mainly located over many land regions of the NH, espe-
cially over Europe, western Asia, and interior North Amer-
ica and Central America. The significant dry conditions over            and western North Africa and the wet conditions over South
the Dead Sea, the Gulf of Oman, interior North America                  America are consistent with the reconstructions (Yechieli et

Clim. Past, 15, 265–277, 2019                                                                         www.clim-past.net/15/265/2019/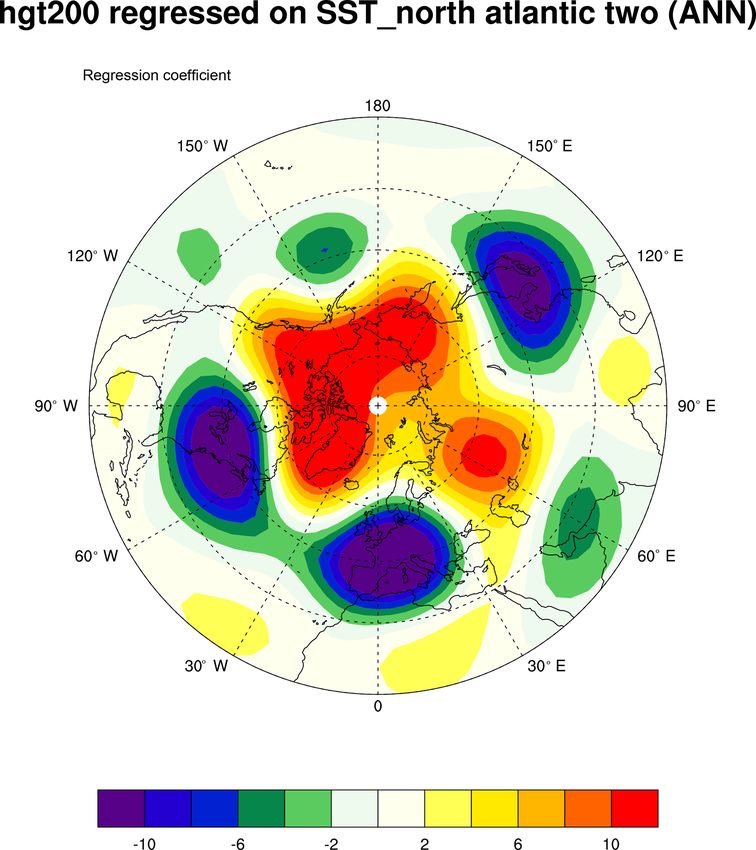
M. Yan and J. Liu: Physical processes of cooling and mega-drought in 4.2 ka BP event 269
3.3 Circulations associated with the 4.2 ka BP event
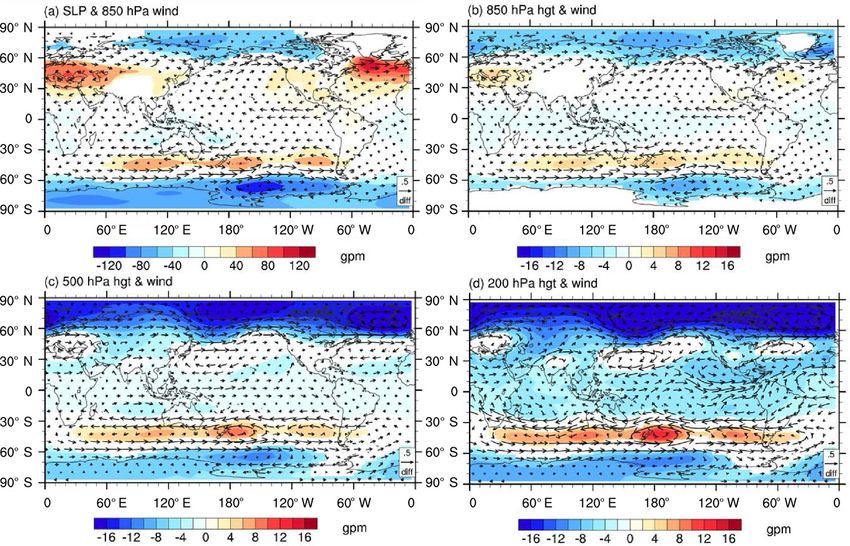
The sea level pressure (SLP) differences between the cooler
periods and the warmer periods show that the largest change
occurs over the mid- to high latitudes of the NH and SH
(Fig. 5a). The negative SLP anomalies over the high North
Atlantic and positive SLP anomalies over the middle North
Atlantic during the cool periods resemble a positive North
Atlantic Oscillation (NAO)-like pattern but on a centennial–
millennial timescale. The positive NAO-like pattern is ac-
companied by cyclonic circulation over Iceland and an-
ticyclonic circulation over the Azores and thus strength-
ened westerlies over the downstream regions (Fig. 5a). The
subtropical highs and the relative anticyclones in both the
SH and NH are strengthened during the cold periods from
Figure 4. Spatial distribution of annual mean SST difference be- low troposphere (850 hPa) to high troposphere (200 hPa),
tween the cold and warm periods derived from the TraCE-ALL run. which illustrates a barotropic structure (Fig. 5). Note that
Those regions which were significant above the 95 % confidence the strengthened subtropical highs over the NH are most
level are dotted.
significant at a low level (sea level and 850 hPa), while
the subtropical highs over the SH are most significant at a
al., 1993; Forman et al., 1995; Cullen et al., 2000; Marchant high level (200 hPa). The centers with positive geopoten-
and Hooghiemstra, 2004). For the SH, the land precipitation tial height anomalies during the 4.2 ka BP event over west-
increased, which indicates a southward shift of the ITCZ, ern Europe, Central Asia, East Asia, the east North Pacific
as suggested by the aforementioned asymmetric temperature and eastern North America, as well as the anticyclonic cir-
change and by the previous studies based on both reconstruc- culation anomalies at 200 hPa (Fig. 5d), resemble a circum-
tions (Fleitmann et al., 2007; Cai et al., 2012) and simulations global teleconnection (CGT)-like wave pattern (Ding and
(Broccoli et al., 2006). Over East China, the precipitation Wang, 2005; Lin et al., 2016) but on a centennial–millennial
anomalies show a wet-south–dry-north pattern, which indi- timescale.
cates a weakened East Asian monsoon revealed by the recon- The strengthened subtropical highs with midlatitude an-
struction record (Tan et al., 2018). However, the simulated ticyclones from lower to upper levels are the direct physi-
anomaly pattern is not very significant over East China. This cal processes that cause the precipitation decreases and thus
might be related to the model resolution, the model perfor- the following mega-drought over midlatitudes of NH regions,
mance or the actual climate change. Therefore, simulations particularly over Eurasia. The cooler- land–warmer-ocean
with higher resolution, inter-model and model–data compar- over East Asia and the west Pacific (Fig. 3a) indicates a
isons are required to gain a clearer view about the climate weakened land–ocean thermal contrast associated with sig-
change over East China. nificantly higher SLP over land and lower SLP over the ad-
The sea surface temperature (SST) shows that the largest jacent ocean (insignificant) (Fig. 5a). The weakened land–
change occurs over the northern Atlantic Ocean and then the ocean contrast can lead to a weaker East Asian monsoon,
northern Pacific Ocean (Fig. 4). The warmer south and cooler accompanied by precipitation increases over the southern
north over the Atlantic Ocean indicates an Atlantic Multi- China pattern and precipitation decreases over the northern
Decadal Oscillation (AMO)-like pattern with its cold phase. China pattern (Fig. 3b). Such a conclusion is very rough,
The cold phase of the AMO has been confirmed to induce since the simulated anomaly patterns are not very significant.
summer rainfall decreases over India and Sahel in both simu- More investigations with higher resolutions of modeling and
lations and proxy data (Zhang and Delworth, 2006; Shanahan reconstruction work are required to get satisfactory results.
et al., 2009).
The simulated characteristics of the temperature change, 4 Discussions
the precipitation change and the SST change are similar
to those responses to the weakened AMOC state (Vellinga The simulations show that the cool and dry conditions
and Wood, 2002; Zhang and Delworth, 2005; Delworth and of the 4.2 ka BP event are more like a hemispheric phe-
Zeng, 2012; Brown and Galbraith, 2016) (Fig. S4). nomenon, mainly located over the NH rather than a global
phenomenon. The land over the SH experiences cool but wet
conditions, and the midlatitude SH ocean is warmer. The po-
tential causes and mechanisms of this event will be discussed
in this section.
www.clim-past.net/15/265/2019/ Clim. Past, 15, 265–277, 2019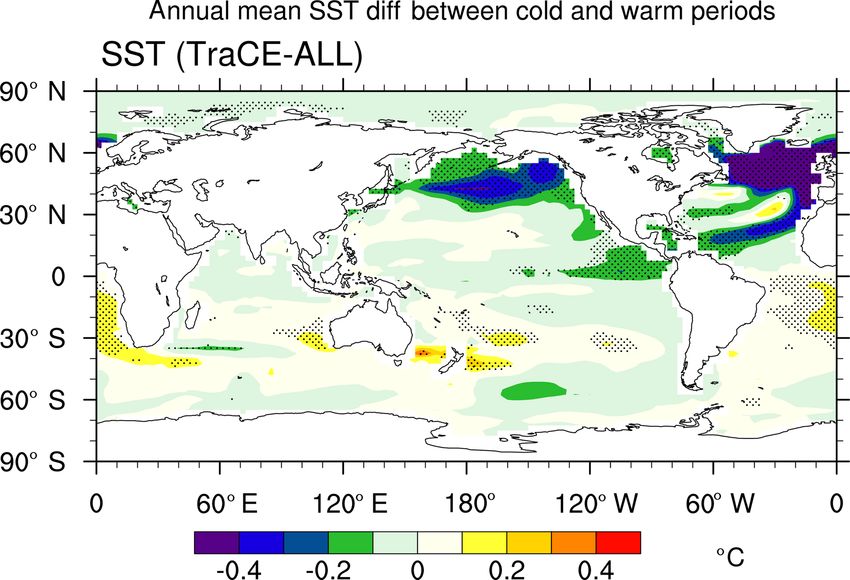
270                                    M. Yan and J. Liu: Physical processes of cooling and mega-drought in 4.2 ka BP event

Figure 5. Differences in annual mean (a) sea level pressure and 850 hPa wind, (b) geopotential height and wind at 850 hPa, (c) geopotential
height and wind at 500 hPa, and (d) geopotential height and wind at 200 hPa between cold and warm periods derived from the TraCE-ALL
run. Those regions which were significant above the 95 % confidence level are plotted.

4.1   The possible causes of the 4.2 ka BP event                        Table 2. Correlation coefficients between the annual mean and sea-
                                                                        sonal mean NHTs derived from the TraCE-ALL run and those from
                                                                        each single-forcing run from 5.0 to 3.0 ka.

Some records suggested that solar irradiance was one of                   Single-forcing run    Annual mean      JJA mean     DJF mean
the essential mechanisms that drove the Holocene climate
variation at centennial to millennial timescales (Bond et al.,            TraCE-ORB                    −0.05         0.79        −0.12
2001), whereas others suggested that the link between so-                 TraCE-MWF                    −0.18         0.48        −0.43
                                                                          TraCE-ICE                    −0.30        −0.20        −0.18
lar irradiance and multi-century-scale cooling events during
                                                                          TraCE-GHG                     0.14        −0.73         0.40
the Holocene was weak, particularly in the Middle to Late
Holocene (Turney et al., 2005; Wanner et al., 2008). Changes
in solar irradiance are not included in the experiments used in
the present work. Nonetheless, we still obtain multi-century            iment to determine the possible forcings that triggered the
cooling events (such as the 4.2 ka BP event) in the TraCE-              4.2 ka BP event.
ALL experiment but with smaller magnitude. This side fact                  The correlation coefficients between the annual mean
indicates that the solar irradiance might not be the driving            NHT derived from the TraCE-ALL run and the NHT de-
factor for the Holocene cooling events.                                 rived from each single-forcing run are listed in Table 2. A
   If the results derived from the TraCE-ALL experiment are             two-sided Student’s t test is used for the statistical signifi-
consistent with those derived from a particular single-forcing          cance test, assuming 20 degrees of freedom, which is esti-
sensitivity experiment, we assume the variation to be forced            mated simply from a 2000-year time series subjected to a
by that forcing. Otherwise, if the results derived from the             100-year running mean (Delworth and Zeng, 2012). There
TraCE-ALL experiment differ from those from the single-                 is no significant clue that the annual mean NHT variation is
forcing sensitivity experiments, we assume the variation to             forced by the orbital variation or the other forcings due to
be forced by internal variability. In this section, we use the          the nonsignificant correlations. During the period of 5000–
series after applications of 101-year running means as an ex-           3000 BP, the variation in simulated JJA mean NHT is likely
ample and compare the results derived from the all-forcing              forced by the solar radiation due to the orbital variation (Ta-
experiment to those derived from the single-forcing exper-              ble 2; the correlation coefficient between the two series is

Clim. Past, 15, 265–277, 2019                                                                        www.clim-past.net/15/265/2019/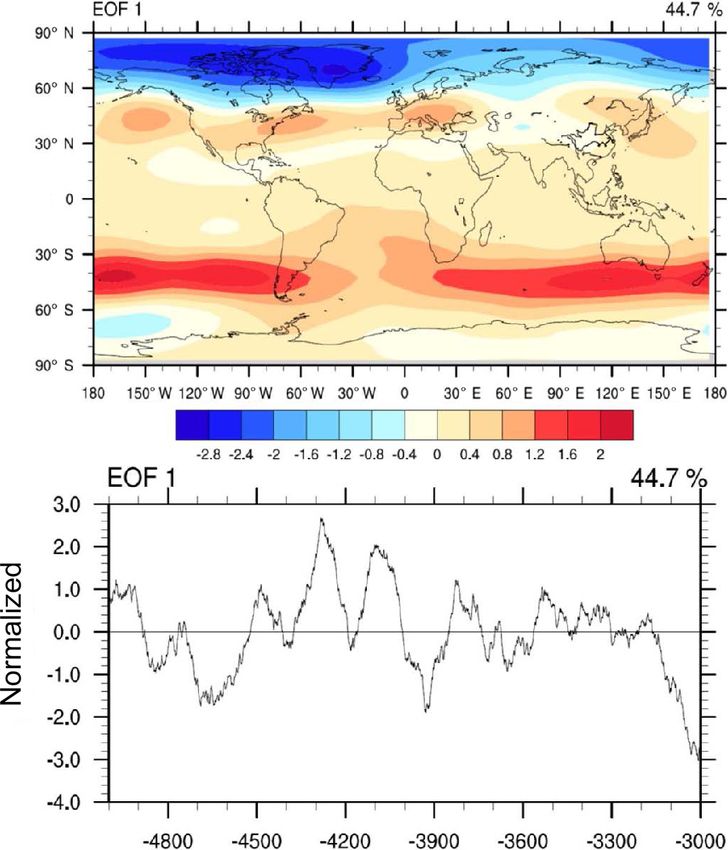
M. Yan and J. Liu: Physical processes of cooling and mega-drought in 4.2 ka BP event                                          271

0.79 at p < 0.05), whereas the greenhouse gas change has           lantic without external forcings (e.g., solar irradiance or vol-
a comparable negative impact on the JJA mean NHT (the              canic).
correlation coefficient is −0.73 at p < 0.05). The meltwater          However, why such large variation due to internal vari-
flux also has a moderate contribution to the JJA mean NHT          ability occurs at approximately 4.2 ka BP remains unknown.
change (the correlation coefficient is 0.48 at p < 0.05). For      There is little ice-sheet change and no meltwater discharge
the DJF mean NHT, only meltwater flux has a notable neg-           after 5.0 ka in the TraCE-ICE run and TraCE-MWF run, and
ative effect (the correlation coefficient is −0.43 at p < 0.05).   the variations in climate derived from these two runs can thus
However, there is no meltwater forcing during this period, so      be regarded as internal variabilities. The multi-centennial
the NHT change can be taken as internal variability. There-        cooling events can also be found in the standardized NHT
fore, the significant correlation coefficient between the all-     during the last 5000 years of the two experiments (Fig. S6),
forcing run result and the meltwater forcing run result might      and there are drought events in the standardized NH precipi-
be a coincidence, due to the autocorrelation of internal vari-     tation time series (not shown). However, the timing of those
ability. This is another side fact indicating the cold events      cooling and drought events occurs stochastically. This indi-
during the Late Holocene might be related to internal vari-        cates a general concept of the random variation in the in-
ability. Note that if the effective degree of freedom is used,     ternal mode of the climate system. There is a reduction in
none of the abovementioned correlation coefficients are sig-       NH temperature and precipitation at around 4600 BP in the
nificant. The effective degree of freedom is calculated by the     TraCE-ORB (Fig. 2, orange lines), which might be related to
following equation:                                                the timing of the event as speculated by Ning et al. (2019).
                                                                      Ning et al. (2019) compared the fifth millennium BP cool-
             1 − r1 × r2                                           ing with the ninth millennium cooling and concluded that
Ndof = N ×               ,                                  (1)
             1 + r1 × r2                                           the ninth millennium BP cooling resulted from freshwater
                                                                   forcing while orbital forcing is the most likely explanation
where Ndof is the effective degree of freedom regarding the        of cooling in the North Atlantic starting from the early fifth
two correlation samples, N is the total sample size, and r1        millennium BP through most of the later Holocene but with
and r2 are autocorrelation lag-1 values for sample 1 and sam-      fluctuations. In the present work, we attribute this fluctuation
ple 2, respectively (Bretherton et al., 1999).                     to internal variability, which is superposed on the orbitally
   On the other hand, the annual mean NHT difference be-           induced long-term trend. This work and Ning et al.’s (2019)
tween the TraCE-ALL run and the sum of the four single-            work focus on different aspects and different timescales, and
forcing sensitivity experiments shows variation similar to         they are complementary to better understand the 4.2 ka BP
the NHT derived from the TraCE-ALL run from 5000 to                event.
3000 BP (Fig. S5). The correlation coefficient between these
two time series is 0.66, which is significant above the 95 %       4.2   The mechanisms of the centennial–millennial
confidence level (assuming 20 degrees of freedom). We as-                cooling and drought
sume the difference between the TraCE-ALL run and the
sum of the four single-forcing runs to be the internal vari-       As has been mentioned in Sect. 3.3, the low-level NAO-like
ation, assuming that the climate responses to external forc-       pattern and upper-level CGT-like pattern are the direct mech-
ings are linear at global and hemispheric scales. Therefore,       anisms that cause cooling and mega-droughts over most parts
the internal variation might play a dominant role in the cli-      of the NH. Previous studies also proposed that the tempera-
matic variation during the period of 5000–3000 BP. However,        ture and precipitation changes over Eurasia and Africa were
the linearity of the climate responding to external forcings       directly linked to the NAO (Cullen et al., 2002; Kushnir and
needs further clarification, since there would be interactions     Stein, 2010). The first leading mode of the empirical orthog-
between each forcing and between forcings and internal vari-       onal function (EOF) of the annual mean SLP during 5–3 ka
ability.                                                           shows a double-peak positive NAO-like pattern but on a cen-
   Moreover, there is no double-peak cooling event during          tennial scale during the period of 4400–4000 BP (Fig. 6).
the period of 4400–4000 BP in any single-forcing run (Fig. 1,      The first leading EOF of geopotential height at 200 hPa after
colored lines), which indicates that the 4.2 ka BP event might     the application of a 31-year running mean shows a CGT-like
not be triggered by those external forcings, including orbital     pattern and similar double-peak variation during the period
forcing, the meltwater flux, the ice sheets and the greenhouse     of 4400–4000 BP, which is more obvious after applying the
gases in isolation. Volcanic eruptions have been identified as     101-year running mean (Fig. 7). This means that the double-
one of the important drivers of climate variation, whereas         peak cooling and drought of the 4.2 ka BP event could be
there were few eruptions during 4400–4000 BP (Sigl et al.,         strongly related to the double-peak positive NAO-like pat-
2018). Therefore, we conclude that the variability relating        tern (at a low level) and CGT-like pattern (at a high level) at
to the 4.2 ka BP event might be driven by internal variabil-       a centennial timescale.
ity. Klus et al. (2018) also suggested that the internal climate      Li et al. (2013) suggested that the NAO is a predictor of
variability could trigger abrupt cold events in the North At-      NHT multi-decadal variability during the 20th century. In

www.clim-past.net/15/265/2019/                                                                   Clim. Past, 15, 265–277, 2019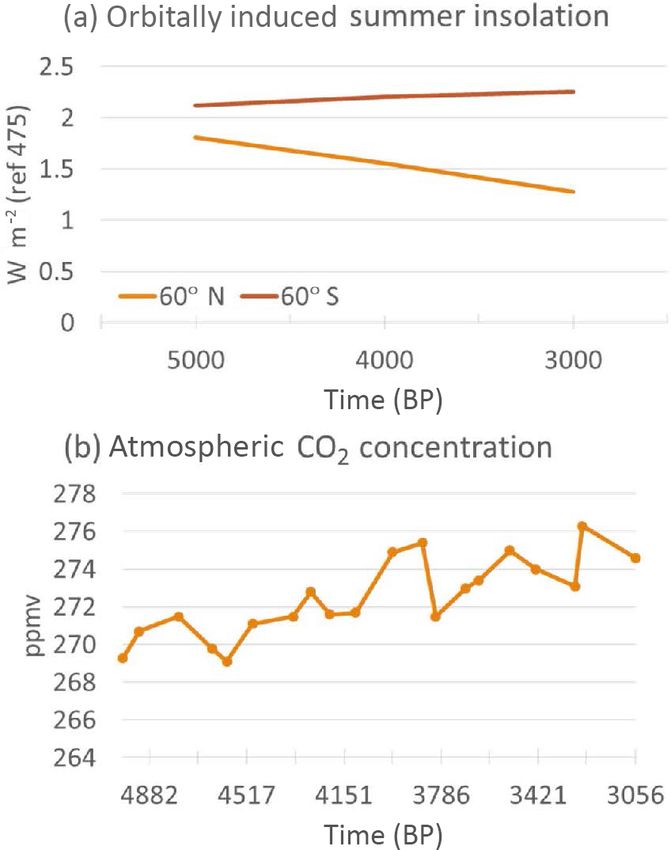
272                                      M. Yan and J. Liu: Physical processes of cooling and mega-drought in 4.2 ka BP event

                                                                        Figure 7. Standardized first leading mode of the EOF of annual
Figure 6. Standardized first leading mode of the EOF of annual          mean geopotential height at 200 hPa during the period of 5.0 to
mean SLP over the North Atlantic region (25–80◦ N, 70◦ W–40◦ E)         3.0 ka derived from the TraCE-ALL run, after the application of a
during the period of 5.0 to 3.0 ka derived from the TraCE-ALL run,      101-year running mean. The spatial distribution is shown in the top
after the application of a 101-year running mean. The spatial distri-   panel, and the time series is shown in the bottom panel. Only this
bution is shown in the top panel, and the time series is shown in the   mode passed the North test for the EOF.
bottom panel. Only this mode passed the North test for the EOF.

this study, significant correlation is also found between the
annual mean NAO index and the annual mean NHT during
the period of 4400–4000 BP, with the NAO leading by ap-
proximately 40 years (Fig. 8). The NAO index is defined by
the first leading mode of the EOF of the SLP. The regressed
annual mean surface temperature against the NAO index 40
years earlier during 4400 and 4000 BP shows cooler NH high
latitudes and a warmer SH (Fig. S7), especially the cooling
over the northern North Atlantic Ocean, Europe, East Asia
and North America.
   The geopotential height at 200 hPa regressed against the
SST over the two North Atlantic outstanding regions (Fig. 4)
shows a CGT-like pattern after the application of a 31-year
running mean (Fig. 9), which is similar to the conclusion
from Lin et al. (2016) that the CGT could be excited by the
AMO-related SST anomaly. The regressed 200 hPa geopo-
tential height shows a similar pattern after the application of
a 101-year running mean (not shown). The anticyclones asso-             Figure 8. Lead–lag correlation between the annual mean North At-
ciated with a CGT-like pattern over western Europe, Central             lantic Oscillation (NAO) and the Northern Hemisphere surface tem-
Asia and North America can suppress the precipitation and               perature (NHT) during 4.4–4.0 ka derived from the TraCE-ALL run.
                                                                        The black lines (±0.3) show the significance levels (p < 0.05).
thus lead to mega-drought over these regions.

Clim. Past, 15, 265–277, 2019                                                                        www.clim-past.net/15/265/2019/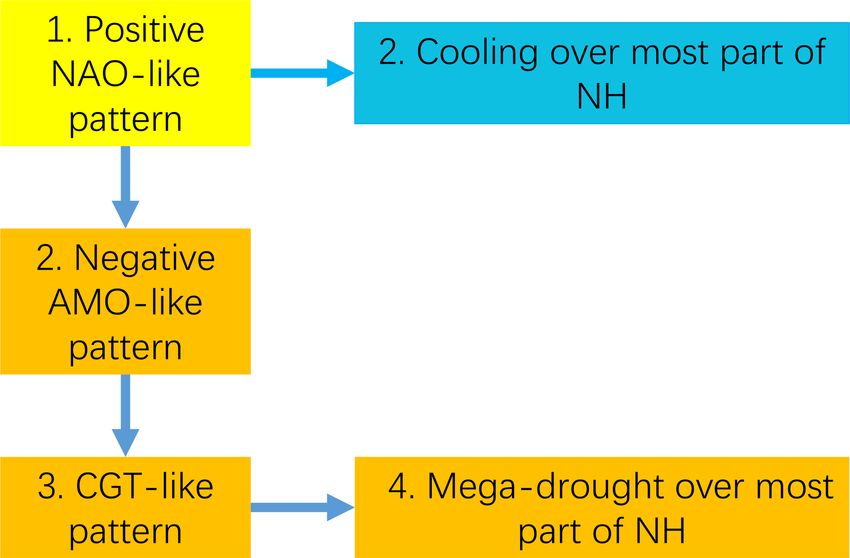
M. Yan and J. Liu: Physical processes of cooling and mega-drought in 4.2 ka BP event                                        273

                                                                  Figure 10. Schematic diagram showing the mechanisms behind the
                                                                  4.2 ka BP event.

                                                                  5   Conclusion

                                                                  The characteristics of the 4.2 ka BP event along with the po-
                                                                  tential drivers and the mechanisms are investigated using a
                                                                  set of transient climate simulations. The simulated event is
                                                                  characterized by hemispheric cooling and mega-drought over
Figure 9. Annual mean geopotential height regressed against the   the NH, whereas the SH experiences warming (over the mid-
SST over the North Atlantic during 5.0–3.0 ka derived from the    latitude ocean) and wet conditions during this event. The an-
TraCE-ALL run, after 31-year running mean application.            nual mean temperature change is dominated by the boreal
                                                                  winter change. The cool and dry NH and warm and wet SH
                                                                  pattern indicate a southward shift of the ITCZ, as suggested
   Considering the NAO-like pattern, the CGT-like pattern         by the reconstructions. These characteristics could also be
and the AMO-like pattern together, we suggest that the AMO        related to a weakening of the AMOC, which needs further
could be playing a “bridge” role to keep the barotropic struc-    investigation.
ture at the centennial scale, which is similar to the synthe-        By comparison between the all-forcing experiment and the
sis proposed by Li et al. (2013) that the AMO is a bridge         single-forcing sensitivity experiments, the 4.2 ka BP event
that links the NAO and NHT at a multi-decadal timescale.          can largely be attributed to internal variability, although or-
Delworth and Zeng (2016) suggested that the NAO varia-            bital forcing and greenhouse gases could impact the boreal
tion had a significant impact on the AMOC and its subse-          summer NHT variation. The origin could be in polar regions
quent influence on the atmosphere and large-scale climate         and the North Atlantic and may influence the NH climate
at multi-decadal–centennial timescales. Other studies also        through teleconnections such as the NAO-like pattern and
focused on the role of SST anomalies over the North Pa-           the CGT-like pattern. The positive NAO-like pattern in the
cific and North Atlantic oceans when investigating the pos-       atmosphere triggers cooling over the NH and the negative
sible mechanisms of the 4.2 ka BP event (Kim et al., 2004;        AMO-like pattern in the ocean, which may last for decades or
Marchant and Hooghiemstra, 2004; Booth et al., 2005).             even centuries. The negative AMO-like pattern triggers CGT-
   We note the centennial–millennial variation in the AMOC        like wave patterns at a multi-decadal–centennial timescale
after the mid-Holocene in the all-forcing run (Fig. S4a).         accompanied by anticyclones over western Europe, Central
There also exits a double-peak variation during the period        Asia and North America, which induce mega-drought over
of 4.4–4.0 ka, accompanied by similar spatial patterns of         those regions. The simplified diagram of the mechanism is
temperature and precipitation anomalies as in the simulated       shown in Fig. 10.
4.2 ka BP event (Fig. S4b, c). However, whether this AMOC            Our findings provide a global pattern and mechanical
variation is related to external forcing, such as orbital forc-   background of the 4.2 ka BP event that can help better un-
ing, or just internal variability remains unknown and needs       derstanding this event. We consider the internal variabilities
further investigations.                                           to be an essential forcing of the 4.2 ka BP event. However,
                                                                  whether or not external forcings have modulation effects
                                                                  needs to be clarified. For example, is the timing of the event
                                                                  stochastic due to internal variability or modulated by exter-
                                                                  nal forcings such as orbital changes? Why the SST forcing

www.clim-past.net/15/265/2019/                                                                 Clim. Past, 15, 265–277, 2019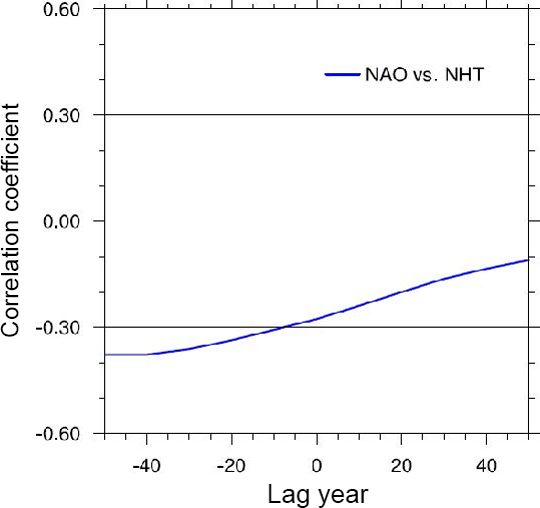
274                                    M. Yan and J. Liu: Physical processes of cooling and mega-drought in 4.2 ka BP event

in the North Atlantic can be maintained at a multi-decadal–         DOE Abrupt Change and EaSM programs.
centennial timescale requires more study. Current results are
mainly based on annual mean precipitation and temperature,          Edited by: Monica Bini
whereas the impacts of external forcings may have seasonal          Reviewed by: two anonymous referees
dependence; further investigations are required to evaluate
these impacts.
   The model responses to external forcings are small, espe-        References
cially in the Holocene, because of the absence of a significant
change in the AMOC and meltwater forcing after 6 ka (Liu et         Alley, R. and Agustsdottir, A.: The 8k event: cause
al., 2014b). So we use the amplified anomalies between the            and consequences of a major Holocene abrupt cli-
cold and warm periods, rather than simply the cold anoma-             mate change, Quaternary Sci. Rev., 24, 1123–1149,
lies against the long-term average, to illustrate the mecha-          https://doi.org/10.1016/j.quascirev.2004.12.004, 2005.
nisms of the event. We need to keep in mind that we still           An, C.-B., Tang, L., Barton, L., and Chen, F.-H.: Climate change
might not be modeling events comparable to the 4.2 ka BP              and cultural response around 4000 cal yr BP in the western
event, particularly during the Late Holocene. More model–             part of Chinese Loess Plateau, Quaternary Res., 63, 347–352,
                                                                      https://doi.org/10.1016/j.yqres.2005.02.004, 2005.
data, inter-model and inter-event comparisons are required
                                                                    Bond, G., Kromer, B., Beer, J., Muscheler, R., Evans, M. N., Show-
to better understand the cold events during the Holocene.             ers, W., Hoffmann, S., Lotti-Bond, R., Hajdas, I., and Bonani,
                                                                      G.: Persistent solar influence on North Atlantic climate during
                                                                      the Holocene, Science, 294, 2130–2136, 2001.
Data availability. The TraCE-21ka data used in this study can be    Booth, R. K., Jackson, S. T., Forman, S. L., Kutzbach, J. E., Bettis,
accessed through the website of Earth System Grid (2018) (https:      I. E. A., Kreig, J., and Wright, D. K.: A severe centennial-scale
//www.earthsystemgrid.org/project/trace.html, last access: 1 June     drought in mid-continental North America 4200 years ago and
2018).                                                                apparent global linkages, Holocene, 15, 321–328, 2005.
                                                                    Bretherton, C. S., Widmann, M., Dymnikov, V. P., Wallace, J. M.,
                                                                      and Bladé, I.: The effective number of spatial degrees of freedom
Supplement. The supplement related to this article is available       of a time-varying field, J. Climate, 12, 1990–2009, 1999.
online at: https://doi.org/10.5194/cp-15-265-2019-supplement.       Broccoli, A. J., Dahl, K. A., and Stouffer, R. J.: Response of the
                                                                      ITCZ to Northern Hemisphere cooling, Geophys. Res. Lett., 33,
                                                                      L01702, https://doi.org/10.1029/2005gl024546, 2006.
Author contributions. MY and JL designed the work. MY per-          Brown, N. and Galbraith, E. D.: Hosed vs. unhosed: interruptions
formed the formal analyses and prepared the paper. JL provided        of the Atlantic Meridional Overturning Circulation in a global
supervision.                                                          coupled model, with and without freshwater forcing, Clim. Past,
                                                                      12, 1663–1679, https://doi.org/10.5194/cp-12-1663-2016, 2016.
                                                                    Cai, Y., Zhang, H., Cheng, H., An, Z., Lawrence Edwards, R.,
Competing interests. The authors declare that they have no con-       Wang, X., Tan, L., Liang, F., Wang, J., and Kelly, M.: The
flict of interest.                                                    Holocene Indian monsoon variability over the southern Tibetan
                                                                      Plateau and its teleconnections, Earth Planet. Sc. Lett., 335–336,
                                                                      135–144, https://doi.org/10.1016/j.epsl.2012.04.035, 2012.
                                                                    Clark, P. U., Shakun, J. D., Baker, P. A., Bartlein, P. J., Brewer,
Special issue statement. This article is part of the special is-
                                                                      S., Brook, E., Carlson, A. E., Cheng, H., Kaufman, D. S.,
sue “The 4.2 ka BP climatic event”. It is a result of “The 4.2 ka
                                                                      Liu, Z., Marchitto, T. M., Mix, A. C., Morrill, C., Otto-
BP Event: An International Workshop”, Pisa, Italy, 10–12 January
                                                                      Bliesner, B. L., Pahnke, K., Russell, J. M., Whitlock, C., Ad-
2018.
                                                                      kins, J. F., Blois, J. L., Clark, J., Colman, S. M., Curry,
                                                                      W. B., Flower, B. P., He, F., Johnson, T. C., Lynch-Stieglitz,
                                                                      J., Markgraf, V., McManus, J., Mitrovica, J. X., Moreno, P.
Acknowledgements. We acknowledge Bin Wang and two                     I., and Williams, J. W.: Global climate evolution during the
anonymous referees for the comments helping to clarify and            last deglaciation, P. Natl. Acad. Sci. USA, 109, 1134–1142,
improve the paper. This research was jointly supported by the Na-     https://doi.org/10.1073/pnas.1116619109, 2012.
tional Key Research and Development Program of China (grant no.     Cullen, H., deMenocal, P., Hemming, S., Hemming, G., Brown, F.
2016YFA0600401), the National Basic Research Program (grant           H., Guilderson, T., and Sirocko, F.: Climate change and the col-
no. 2015CB953804), the National Natural Science Foundation            lapse of the Akkadian empire: Evidence from the deep sea, Ge-
of China (grant nos. 41671197, 41420104002 and 41631175),             ology, 28, 379–382, 2000.
Open Funds of State Key Laboratory of Loess and Quaternary          Cullen, H. M., Kaplan, A., Arkin, P. A., and DeMenocal, P. B.: Im-
Geology, Institute of Earth Environment, CAS (SKLLQG1820),            pact of the North Atlantic Oscillation on Middle Eastern climate
and the Priority Academic Development Program of Jiangsu              and streamflow, Clim. Change, 55, 315–338, 2002.
Higher Education Institutions (PAPD, grant no. 164320H116).         Deininger, M., McDermott, F., Mudelsee, M., Werner, M.,
TraCE-21ka was made possible by the DOE INCITE computing              Frank, N., and Mangini, A.: Coherency of late Holocene
program and supported by NCAR, the NSFP2C2 program and the            European speleothem δ 18 records linked to North At-

Clim. Past, 15, 265–277, 2019                                                                     www.clim-past.net/15/265/2019/
M. Yan and J. Liu: Physical processes of cooling and mega-drought in 4.2 ka BP event 275 lantic Ocean circulation, Clim. Dynam., 49, 595–618, Kushnir, Y. and Stein, M.: North Atlantic influence on 19th– https://doi.org/10.1007/s00382-016-3360-8, 2017. 20th century rainfall in the Dead Sea watershed, telecon- Delworth, T. L. and Zeng, F.: Multicentennial variability of nections with the Sahel, and implication for Holocene cli- the Atlantic meridional overturning circulation and its cli- mate fluctuations, Quaternary Sci. Rev., 29, 3843–3860, matic influence in a 4000 year simulation of the GFDL https://doi.org/10.1016/j.quascirev.2010.09.004, 2010. CM2.1 climate model, Geophys. Res. Lett., 39, L13702, Lauritzen, S.-E.: Reconstruction of Holocene climate records from https://doi.org/10.1029/2012gl052107, 2012. speleothems, in: Global Change in the Holocene, edited by: Delworth, T. L. and Zeng, F.: The Impact of the North Atlantic Mackay, A., Battarbee, R., Birks, H. J. B., and Oldfield, F., Oscillation on Climate through Its Influence on the Atlantic Arnold, London, UK, 242–263, 2003. Meridional Overturning Circulation, J. Climate, 29, 941–962, Li, J., Sun, C., and Jin, F.-F.: NAO implicated as a pre- https://doi.org/10.1175/jcli-d-15-0396.1, 2016. dictor of Northern Hemisphere mean temperature multi- Ding, Q. and Wang, B.: Circumglobal Teleconnection in the North- decadal variability, Geophys. Res. Lett., 40, 5497–5502, ern Hemisphere summer, J. Climate, 18, 3483–3505, 2005. https://doi.org/10.1002/2013gl057877, 2013. Earth System Grid: TraCE-21ka data, available at: https://www. Lin, J.-S., Wu, B., and Zhou, T.-J.: Is the interdecadal circum- earthsystemgrid.org/project/trace.html, last access: 1 June 2018. global teleconnection pattern excited by the Atlantic multi- Finkenbinder, M. S., Abbott, M. B., and Steinman, B. A.: Holocene decadal Oscillation?, Atmos. Ocean. Sci. Lett., 9, 451–457, climate change in Newfoundland reconstructed using oxygen https://doi.org/10.1080/16742834.2016.1233800, 2016. isotope analysis of lake sediment cores, Global Planet. Change, Liu, J. Q., Lv, H. Y., Negendank, J. F. W., Mingram, J., Luo, X. 143, 251–261, https://doi.org/10.1016/j.gloplacha.2016.06.014, J., Wang, W. Y., and Chu, G. Q: Cyclic of the Holocene climate 2016. variability in Huguangyan Maar lake, China, Chinese Sci. Bull., Fleitmann, D., Burns, S. J., Mangini, A., Mudelsee, M., 45, 1190–1195, 2000 (in Chinese). Kramers, J., Villa, I., Neff, U., Al-Subbary, A. A., Buet- Liu, Y. H., Sun, X., and Guo, C. Q.: Records of 4.2 ka BP tner, A., Hippler, D., and Matter, A.: Holocene ITCZ and In- Holocene Event from China and Its Impact on Ancient Civiliza- dian monsoon dynamics recorded in stalagmites from Oman tions,Geological Science and Technology Information (in Chi- and Yemen (Socotra), Quaternary Sci. Rev., 26, 170–188, nese), 32, 99-106, 2013. https://doi.org/10.1016/j.quascirev.2006.04.012, 2007. Liu, Z. Y., Otto-Bliesner, B., He, F., Brady, E. C., Tomas, R. A., Forman, S., Oglesby, R., Markgraf, V., and Stafford, T.: Paleocli- Clark, P. U., Carlson, A. E., Lynch-Stieglitz, J., Curry, W., Brook, matic significance of Late Quaternary eolian deposition on the E., Erickson, D. J., Jacob, R., Kutzbach, J., and Cheng, J.: Tran- Piedmont and High Plains, Central United States, Global Planet. sient simulation of Last Deglaciation with a new mechanism for Change, 11, 35–55, 1995. Bolling-Allerod Warming, Science, 325, 310–314, 2009. He, F.: Simulating Transient Climate Evolution of the Last deglacia- Liu, Z., Carlson, A. E., He, F., Brady, E. C., Otto-Bliesner, B. L., tion with CCSM3, Doctor of Philosophy, Atmospheric and Briegleb, B. P., Wehrenberg, M., Clark, P. U., Wu, S., Cheng, J., Oceanic Sciences, University of Wisconsin-Madison, Wi, USA, Zhang, J., Noone, D., and Zhu, J.: Younger Dryas cooling and 161 pp., 2011. the Greenland climate response to CO2 , P. Natl. Acad. Sci. USA, He, F., Shakun, J. D., Clark, P. U., Carlson, A. E., Liu, Z., Otto- 109, 11101–11104, https://doi.org/10.1073/pnas.1202183109, Bliesner, B. L., and Kutzbach, J. E.: Northern Hemisphere forc- 2012. ing of Southern Hemisphere climate during the last deglaciation, Liu, Z., Lu, Z., Wen, X., Otto-Bliesner, B. L., Timmermann, Nature, 494, 81–85, https://doi.org/10.1038/nature11822, 2013. A., and Cobb, K. M.: Evolution and forcing mechanisms of Huang, C. C., Pang, J., Zha, X., Su, H., and Jia, Y.: Extraor- El Nino over the past 21 000 years, Nature, 515, 550–553, dinary floods related to the climatic event at 4200 a BP https://doi.org/10.1038/nature13963, 2014a. on the Qishuihe River, middle reaches of the Yel- Liu, Z., Zhu, J., Rosenthal, Y., Zhang, X., Otto-Bliesner, low River, China, Quaternary Sci. Rev., 30, 460–468, B. L., Timmermann, A., Smith, R. S., Lohmann, G., https://doi.org/10.1016/j.quascirev.2010.12.007, 2011. Zheng, W., and Elison Timm, O.: The Holocene tempera- Jansen, E., Overpeck, J. T., Briffa, K. R., Duplessy, J.-C., Joos, F., ture conundrum, P. Natl. Acad. Sci. USA, 111, 3501–3505, Masson-Delmotte, V., Olago, D., Otto-Bliesner, B., Peltier, W. https://doi.org/10.1073/pnas.1407229111, 2014b. R., Rahmstorf, S., Ramesh, R., Raynaud, D., Rind, D. H., Solom- Ljung, K., Björck, S., Renssen, H., and Hammarlund, D.: South ina, O., Villalba, R., and Zhang, D.: Palaeoclimate, in: Climate Atlantic island record reveals a South Atlantic response to the Change 2007: The Physical Science Basis, Cambridge Univer- 8.2 kyr event, Clim. Past, 4, 35–45, https://doi.org/10.5194/cp-4- sity Press, Cambridge, UK and New York, NY, USA, 2007. 35-2008, 2008. Kim, J.-H., Rimbu, N., Lorenz, S. J., Lohmann, G., Nam, S.- Ma, Z. X., Huang, J. H., Wei, Y., Li, J. H., and Hu, C. Y.: Or- I., Schouten, S., Rühlemann, C., and Schneider, R. R.: North ganic carbon isotope records of the Poyang Lake sediments Pacific and North Atlantic sea-surface temperature variability and their implications for the paleoclimate during the last during the Holocene, Quaternary Sci. Rev., 23, 2141–2154, 8 ka, Geochimica, 33, 279–285, https://doi.org/10.19700/j.0379- https://doi.org/10.1016/j.quascirev.2004.08.010, 2004. 1726.2004.03.007, 2004 (in Chinese). Klus, A., Prange, M., Varma, V., Tremblay, L. B., and Schulz, Marchant, R. and Hooghiemstra, H.: Rapid environmental change M.: Abrupt cold events in the North Atlantic Ocean in a in African and South American tropics around 4000 years transient Holocene simulation, Clim. Past, 14, 1165–1178, before present: a review, Earth-Sci. Rev., 66, 217–260, https://doi.org/10.5194/cp-14-1165-2018, 2018. https://doi.org/10.1016/j.earscirev.2004.01.003, 2004. www.clim-past.net/15/265/2019/ Clim. Past, 15, 265–277, 2019
276                                       M. Yan and J. Liu: Physical processes of cooling and mega-drought in 4.2 ka BP event

Matero, I. S. O., Gregoire, L. J., Ivanovic, R. F., Tindall, J. C., and   Rupper, S., Roe, G., and Gillespie, A.: Spatial patterns of Holocene
  Haywood, A. M.: The 8.2 ka cooling event caused by Lauren-                 glacier advance and retreat in Central Asia, Quaternary Res., 72,
  tide ice saddle collapse, Earth Planet. Sc. Lett., 473, 205–214,           337–346, https://doi.org/10.1016/j.yqres.2009.03.007, 2009.
  https://doi.org/10.1016/j.epsl.2017.06.011, 2017.                       Sachs, J. P.: Cooling of Northwest Atlantic slope waters
Mayewski, P. A., Rohling, E. E., Curt Stager, J., Karlén, W.,                during the Holocene, Geophys. Res. Lett., 34, L03609,
  Maasch, K. A., Meeker, L. D., Meyerson, E. A., Gasse, F.,                  https://doi.org/10.1029/2006gl028495, 2007.
  van Kreveld, S., Holmgren, K., Lee-Thorp, J., Rosqvist, G.,             Shakun, J. D., Clark, P. U., He, F., Marcott, S. A., Mix, A.
  Rack, F., Staubwasser, M., Schneider, R. R., and Steig, E. J.:             C., Liu, Z., Otto-Bliesner, B., Schmittner, A., and Bard, E.:
  Holocene Climate Variability, Quaternary Res., 62, 243–255,                Global warming preceded by increasing carbon dioxide con-
  https://doi.org/10.1016/j.yqres.2004.07.001, 2004.                         centrations during the last deglaciation, Nature, 484, 49–54,
Morrill, C., LeGrande, A. N., Renssen, H., Bakker, P., and                   https://doi.org/10.1038/nature10915, 2012.
  Otto-Bliesner, B. L.: Model sensitivity to North Atlantic               Shanahan, T. M., Overpeck, J. T., Anchukaitis, K. J., Beck, J. W.,
  freshwater forcing at 8.2 ka, Clim. Past, 9, 955–968,                      Cole, J. E., Dettman, D. L., Peck, J. A., Scholz, C. A., and King,
  https://doi.org/10.5194/cp-9-955-2013, 2013.                               J. W.: Atlantic forcing of persistent drought in West Africa, Sci-
Morrill, C., Ward, E. M., Wagner, A. J., Otto-Bliesner, B. L.,               ence, 324, 377–380, 2009.
  and Rosenbloom, N.: Large sensitivity to freshwater forcing lo-         Sigl, M., Severi, M., and McConnell, J. R.: A role for volcanoes in
  cation in 8.2 ka simulations, Paleoceanography, 29, 930–945,               causing the “4.2 ka BP event”?, The 4.2 ka BP event: an interna-
  https://doi.org/10.1002/2014pa002669, 2014.                                tional workshop, 10–12 January 2018, Pisa, Italy, 2018.
Nakamura, A., Yokoyama, Y., Maemoku, H., Yagi, H., Oka-                   Solomina, O. N., Bradley, R. S., Hodgson, D. A., Ivy-
  mura, M., Matsuoka, H., Miyake, N., Osada, T., Adhikari,                   Ochs, S., Jomelli, V., Mackintosh, A. N., Nesje, A., Owen,
  D. P., Dangol, V., Ikehara, M., Miyairi, Y., and Matsuzaki,                L. A., Wanner, H., Wiles, G. C., and Young, N. E.:
  H.: Weak monsoon event at 4.2 ka recorded in sediment                      Holocene glacier fluctuations, Quaternary Sci. Rev., 111, 9–34,
  from Lake Rara, Himalayas, Quatern. Int., 397, 349–359,                    https://doi.org/10.1016/j.quascirev.2014.11.018, 2015.
  https://doi.org/10.1016/j.quaint.2015.05.053, 2016.                     Staubwasser, M. and Weiss, H.: Holocene Climate and
Ning, L., Liu, J., Bradley, R. S., and Yan, M.: Comparing the                Cultural Evolution in Late Prehistoric–Early His-
  spatial patterns of climate change in the 9th and 5th millen-              toric West Asia, Quaternary Res., 66, 372–387,
  nia?BP from TRACE-21 model simulations, Clim. Past, 15, 41–                https://doi.org/10.1016/j.yqres.2006.09.001, 2006.
  52, https://doi.org/10.5194/cp-15-41-2019, 2019.                        Staubwasser, M., Sirocko, F., Grootes, P. M., and Segl, M.: Climate
Owen, L. A. and Dortch, J. M.: Nature and tim-                               change at the 4.2 ka BP termination of the Indus valley civiliza-
  ing of Quaternary glaciation in the Himalayan–                             tion and Holocene south Asian monsoon variability, Geophys.
  Tibetan orogen, Quaternary Sci. Rev., 88, 14–54,                           Res. Lett., 30, 1425, https://doi.org/10.1029/2002gl016822,
  https://doi.org/10.1016/j.quascirev.2013.11.016, 2014.                     2003.
Peltier, W. R.: GLOBAL GLACIAL ISOSTASY AND THE                           Tan, L. C., An, Z. S., Cai, Y. J., and Long, H.: The
  SURFACE OF THE ICE-AGE EARTH: The ICE-5G (VM2)                             Hydrological Exhibition of 4.2 ka BP Event in China
  Model and GRACE, Annu. Rev. Earth Pl. Sc., 32, 111–149,                    and Its Global Linkages, Geol. Rev., 54, 94–104,
  https://doi.org/10.1146/annurev.earth.32.082503.144359, 2004.              https://doi.org/10.16509/j.georeview.2008.01.010, 2008 (in
Peng, Y., Xiao, J., Nakamura, T., Liu, B., and Inouchi, Y.: Holocene         Chinese).
  East Asian monsoonal precipitation pattern revealed by grain-           Tan, L. C., Cai, Y. J., Cheng, H., Edwards, L. R., Gao, Y. L., Xu,
  size distribution of core sediments of Daihai Lake in Inner Mon-           H., Zhang, H. W., and An, Z. S.: Centennial- to decadal- scale
  golia of north-central China, Earth Planet. Sc. Lett., 233, 467–           monsoon precipitation variations in the upper Hanjiang River re-
  479, https://doi.org/10.1016/j.epsl.2005.02.022, 2005.                     gion, China over the past 6650 years, Earth Planet. Sc. Lett., 482,
Ramos-Román, M. J., Jiménez-Moreno, G., Camuera, J., García-                 580–590, https://doi.org/10.1016/j.epsl.2017.11.044, 2018.
  Alix, A., Anderson, R. S., Jiménez-Espejo, F. J., and Carrión,          Thompson, L. G., Mosley-Thompson, E., Davis, M., Hender-
  J. S.: Holocene climate aridification trend and human impact               son, K. A., Brecher, H., Zagorodnov, V. S., Mashiotta, T.,
  interrupted by millennial- and centennial-scale climate fluc-              Lin, P. N., Mikhalenko, V. N., Hardy, D. R., and Beer, J.:
  tuations from a new sedimentary record from Padul (Sierra                  Kilimanjara Ice Core Records: Evidence of Holocene Cli-
  Nevada, southern Iberian Peninsula), Clim. Past, 14, 117–137,              mate Change in Tropical Africa, Science, 298, 589–593,
  https://doi.org/10.5194/cp-14-117-2018, 2018.                              https://doi.org/10.1126/science.1073198, 2002.
Rimbu, N., Lohmann, G., Lorenz, S. J., Kim, J. H., and                    Tremblay, L. B., Mysak, L. A., and Dyke, A. S.: Evi-
  Schneider, R. R.: Holocene climate variability as derived                  dence from driftwood records for century-to-millennial scale
  from alkenone sea surface temperature and coupled ocean-                   variations of the high latitude atmospheric circulation dur-
  atmosphere model experiments, Clim. Dynam., 23, 215–227,                   ing the Holocene, Geophys. Res. Lett., 24, 2027–2030,
  https://doi.org/10.1007/s00382-004-0435-8, 2004.                           https://doi.org/10.1029/97gl02028, 1997.
Roland, T. P., Caseldine, C. J., Charman, D. J., Turney,                  Turney, C., Baillie, M., Clemens, S., Brown, D., Palmer, J., Pilcher,
  C. S. M., and Amesbury, M. J.: Was there a “4.2 ka                         J., Reimer, P., and Leuschner, H. H.: Testing solar forcing of per-
  event” in Great Britain and Ireland? Evidence from                         vasive Holocene climate cycles, J. Quaternary Sci., 20, 511–518,
  the peatland record, Quaternary Sci. Rev., 83, 11–27,                      https://doi.org/10.1002/jqs.927, 2005.
  https://doi.org/10.1016/j.quascirev.2013.10.024, 2014.

Clim. Past, 15, 265–277, 2019                                                                            www.clim-past.net/15/265/2019/
You can also read