Phytohormone Production Profiles in Trichoderma Species and Their Relationship to Wheat Plant Responses to Water Stress
←
→
Page content transcription
If your browser does not render page correctly, please read the page content below
pathogens
Article
Phytohormone Production Profiles in Trichoderma Species and
Their Relationship to Wheat Plant Responses to Water Stress
María Illescas, Alberto Pedrero-Méndez                     , Marcieli Pitorini-Bovolini, Rosa Hermosa               and Enrique Monte *

                                          Institute for Agribiotechnology Research (CIALE), Department of Microbiology and Genetics,
                                          University of Salamanca, Campus de Villamayor, C/Duero, 12, 37185 Salamanca, Spain; millesmor@usal.es (M.I.);
                                          alberto.pedrerom@usal.es (A.P.-M.); m.bovolini@hotmail.com (M.P.-B.); rhp@usal.es (R.H.)
                                          * Correspondence: emv@usal.es; Tel.: +34-923294500 (ext. 5119)

                                          Abstract: The production of eight phytohormones by Trichoderma species is described, as well as the 1-
                                          aminocyclopropane-1-carboxylic acid (ACC) deaminase (ACCD) activity, which diverts the ethylene
                                          biosynthetic pathway in plants. The use of the Trichoderma strains T. virens T49, T. longibrachiatum
                                          T68, T. spirale T75 and T. harzianum T115 served to demonstrate the diverse production of the
                                          phytohormones gibberellins (GA) GA1 and GA4 , abscisic acid (ABA), salicylic acid (SA), auxin
                                          (indole-3-acetic acid: IAA) and the cytokinins (CK) dihydrozeatin (DHZ), isopenteniladenine (iP)
                                          and trans-zeatin (tZ) in this genus. Such production is dependent on strain and/or culture medium.
                                          These four strains showed different degrees of wheat root colonization. Fresh and dry weights,

                                   conductance, H2 O2 content and antioxidant activities such as superoxide dismutase, peroxidase and
                                          catalase were analyzed, under optimal irrigation and water stress conditions, on 30-days-old wheat
Citation: Illescas, M.;
                                          plants treated with four-day-old Trichoderma cultures, obtained from potato dextrose broth (PDB) and
Pedrero-Méndez, A.;
Pitorini-Bovolini, M.; Hermosa, R.;
                                          PDB-tryptophan (Trp). The application of Trichoderma PDB cultures to wheat plants could be linked to
Monte, E. Phytohormone Production         the plants’ ability to adapt the antioxidant machinery and to tolerate water stress. Plants treated with
Profiles in Trichoderma Species and       PDB cultures of T49 and T115 had the significantly highest weights under water stress. Compared to
Their Relationship to Wheat Plant         controls, treatments with strains T68 and T75, with constrained GA1 and GA4 production, resulted in
Responses to Water Stress. Pathogens      smaller plants regardless of fungal growth medium and irrigation regime.
2021, 10, 991. https://doi.org/
10.3390/pathogens10080991                 Keywords: fungal phytohormones; gibberellin; auxin; cytokinin; ACC deaminase; drought

Academic Editors: David Turrà,
Stefania Vitale, Sheridan Lois Woo
and Francesco Vinale                      1. Introduction
                                                The establishment of microbial symbioses to promote plant growth and nutrient
Received: 6 July 2021
Accepted: 2 August 2021
                                          acquisition by beneficial microbes have been correlated to the biosynthesis of plant growth
Published: 6 August 2021
                                          regulators and phytohormones [1,2]. It is well established that, in addition to inducing
                                          host hormone synthesis, pathogenic and symbiotic fungi can also modulate the hormonal
Publisher’s Note: MDPI stays neutral
                                          network of plants, as they produce by themselves small amounts of phytohormones to
with regard to jurisdictional claims in
                                          serve their purpose. Jasmonic acid (JA), auxin (indole-3-acetic acid: IAA), cytokinins (CK),
published maps and institutional affil-   gibberellins (GA), ethylene (ET), abscisic acid (ABA) and salicylic acid (SA) of fungal
iations.                                  origin are involved in favoring tissue colonization and nutrient uptake, by means of
                                          plant development control and activation of signaling events during biotic and abiotic
                                          stresses [3]. Thus, auxin and GA producing endophytic fungi can enhance host plant
                                          growth and alleviate adverse effects of an abiotic stress, opening up the possibility of
Copyright: © 2021 by the authors.
                                          their use to improve agricultural productivity under adverse soil conditions [4]. In the
Licensee MDPI, Basel, Switzerland.
                                          same case is Trichoderma, a fungal biocontrol agent that includes species that are well
This article is an open access article
                                          known for their ability to produce fungal and oomycete cell wall degrading enzymes [5],
distributed under the terms and           scavenging reactive oxygen species (ROS) and causing plant cell wall hydrolysis [6,7] to
conditions of the Creative Commons        facilitate the endophytic colonization of root tissues in competition with pathogens [8].
Attribution (CC BY) license (https://     Selected Trichoderma species also produce effector molecules capable of triggering signaling
creativecommons.org/licenses/by/          cascades in the plant [9–11] that lead to the induction of systemic resistance to biotic and
4.0/).                                    abiotic stresses as well as growth promotion [12,13]. In this regard, rhizosphere competent

Pathogens 2021, 10, 991. https://doi.org/10.3390/pathogens10080991                                        https://www.mdpi.com/journal/pathogens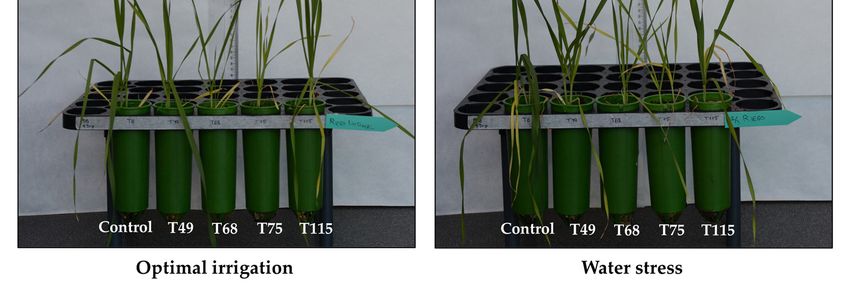
Pathogens 2021, 10, 991                                                                                            2 of 18

                          species have evolved to manipulate root development, plant immunity and stress tolerance
                          by producing phytohormones [14]. It has been shown that T. atroviride, T. virens and
                          T. harzianum produce IAA, T. parareesei produces SA and Trichoderma sp. produces IAA
                          and GA without any inducers, although it is known that their production levels depend
                          on the amount of tryptophan (Trp) present in the medium [15–21]. T. asperellum also
                          releases ABA together with IAA and GA into the culture medium, and its application
                          to cucumber promoted seedling growth and alleviated the effects of salt stress [22]. The
                          production of IAA by T. harzianum has been related to the biocontrol of anthracnose
                          disease and improved growth of sorghum plants [21]. The application of T. parareesei
                          T6 or T. harzianum T34 to tomato seeds also improved the tolerance of plants to salt
                          stress and enhanced the growth when plants grew under this adverse condition [23,24].
                          T. afroharzianum (formerly T. harzianum) T22 improved tolerance of tomato seedlings to
                          water deficit [25]. The colonization of cocoa seedlings by T. hamatum DIS 219b enhanced
                          seedling growth, altered gene expression, and delayed the onset of the cocoa drought
                          response in leaves [26]. Similarly, T. atroviride ID20G inoculation of seeds ameliorated
                          drought stress-induced damages by improving antioxidant defense in maize seedlings [27].
                          The same happened with the improved drought tolerance observed in rice genotypes
                          inoculated with T. harzianum Th-56, in which the antioxidant machinery was activated in a
                          dose-dependent manner [28].
                                IAA is the phytohormone that regulates the plant’s development of the primary and
                          lateral roots [29]. It has been described in other fungi such as Serendipita indica that plant
                          IAA levels have little or no effect on the beneficial fungus-mediated growth promotion,
                          as the plant is very sensitive to changes in IAA concentration and a slight increase in this
                          phytohormone, rather than stimulate, can limit growth [30]. It is well known that addi-
                          tional Trichoderma metabolites and proteins are involved in the regulation of IAA signals
                          in the plant, leading to root hair growth and increased root mass development [31–33].
                          This evidence seems to indicate that rather than a major function in root morphogenesis,
                          IAA and the other phytohormones of fungal origin play a role in interconnecting plant
                          development and defense responses as a component of the complex Trichoderma-regulated
                          phytohormone networking in plants [12,13].
                                To further complicate the understanding of this issue, ethylene (ET) is a phytohormone
                          which regulates plant growth, development, and senescence, and it is well established that
                          low ET concentrations in the root zone correspond to higher shoot growth [34]; therefore,
                          limiting the levels of ET serves to increase agricultural production. A strategy followed by
                          many rhizospheric microorganisms to favor plants consists of reducing the concentration
                          of 1-aminocyclopropane-1-carboxylic acid (ACC), the precursor molecule of ET, by means
                          of the ability to produce the enzyme ACC deaminase (ACCD). Trichoderma strains have the
                          capacity to produce ACCD. This is the case of T. longibrachiatum TL-6, involved in promoting
                          wheat growth and enhancing plant tolerance to salt stress [35], and T. asperelloides (formerly
                          T. asperellum) T203 that by being able to regulate the endogenous ACC levels stimulates
                          root elongation of cucumber [36] and T. asperellum MAP1, which enhanced wheat plant
                          tolerance to waterlogging stress [37].
                                Wheat is one of the most important crops in the world, providing one-fifth of proteins
                          and calories in human diet, and its extensive production is often subjected to non-irrigation
                          conditions [38]. ROS are key players in the complex signaling network of plant responses to
                          drought stress, so it is essential to maintain ROS at non-toxic levels in a delicate balancing
                          act between ROS production, involving ROS generating enzymes and the unavoidable
                          production of ROS during basic cellular metabolism, and ROS-scavenging pathways [39].
                          The application of Trichoderma to wheat triggers systemic defense pathways [40] and seems
                          to be a good choice to minimize damage caused by abiotic stresses [35,37], also limiting en-
                          vironmental pollution. There is sufficient evidence to consider that Trichoderma association
                          can help plants in sustaining drought stress by increasing: (i) the expression of antioxidative
                          enzymes that alleviate the damage caused by the accumulation of ROS and modulating
                          the balance of plant’s phytohormones [25,41]; (ii) the absorption surface that leads the
Pathogens 2021, 10, 991 3 of 18
plant to improve water-use efficiency [33]; and (iii) the synthesis of phytohormones and
phytohormonal analogues to promote plant performance.
In the present work, we have used four Trichoderma strains of four different species
representing the genetic diversity of the genus, in which we analyzed their capacity for
wheat root colonization, measured ACCD activity, and production levels of the phytohor-
mones GA1 , GA4 , ABA, SA, IAA and the CK dihydrozeatin (DHZ), isopenteniladenine
(iP) and trans-zeatin (tZ) in medium supplemented or not with Trp. We then analyzed
the ability of PDB and PDB-Trp cultures of these strains to favor wheat plants in their
growth and their adaptation to grow under water stress. In addition, activities related to
the reduction of ROS levels in plants were measured as an indication of good performance
of plants inoculated with Trichoderma strains.
2. Results
2.1. Molecular Characterization of Trichoderma Strains
The identity of the four soil-isolated Trichoderma strains used in this study was con-
firmed at the species level by analysis of the sequences of ITS1-ITS4 region and a fragment
ca. 600 bp in length of tef1α gene. They had sequences identical to those of ex-type strains
or representative species available in databases. They were identified as: T. virens T49, T.
longibrachiatum T68, T. spirale T75 and T. harzianum T115, and the accession numbers of
their sequences in the GenBank are shown in Table 1. These strains showed significant
differences in growth and degree of sporulation after culturing in three different culture
media (Table 2). Strain T49 showed the highest growth rate when cultivated on PDA, PDA-
Trp and MEA while T75 was the lowest growing on these media. The growth differences
observed for T68 between PDA and PDA-Trp indicate that the addition of Trp negatively
affected the growth of this strain. The effect of culture medium was also observed on the
sporulation degree, with T75 being the strain that significantly showed the lowest values
on PDA or PDA-Trp, and T49 the highest on MEA.
Table 1. Source, origin and accession numbers of Trichoderma strains included in this study.
GenBank
Strain Identified as Source Origin
NumbersITS//tef1α
T49 T. virens soil Brazil MZ312097//MZ346026
T68 T. longibrachiatum soil Brazil MZ311298//MZ346027
T75 T. spirale soil Spain MZ311299//MZ346028
T115 T. harzianum soil Philippines MZ313912//MZ346029
Table 2. Colony growth of Trichoderma strains, expressed in cm, on PDA, PDA-Trp and MEA after
48 h at 28 ◦ C, and sporulation rate (spore/mL) measured at 10 days of incubation.
Growth Rate Spores Produced
Strain
PDA PDA-Trp MEA PDA PDA-Trp MEA
T49 7.1 a 6.9 a 7.0 a 2.5 × 10⁸a 4.1 × 10⁸ b 1.46 × 10⁸ a
T68 7.0 a 6.3 b 4.7 c 2.4 × 10⁸ a 4.2 × 10⁸ b 6.2 × 10⁷ b
T75 4.1 c 4.0 d 3.6 d 6.8 × 10⁶ b 7.7 × 10⁵ c 1.2 × 10⁷ b
T115 5.4 b 5.4 c 5.4 b 4.0 × 10⁸ a 7.7 × 10⁸ a 4.9 × 10⁷ b
Data are calculated from n = 4 replicates per condition. Values in the same column with different letters are
significantly different according to one-way analysis of variance (ANOVA) followed by Tukey’s test at the 0.05
alpha-level of confidence.
2.2. Differences in Colonization of Roots of Wheat Seedlings by Trichoderma Strains
In order to perform a comparative analysis of the wheat root colonization ability
among the four Trichoderma strains, we determined the proportion of fungal DNA vs. plant
DNA from qPCR data in 10-day-old seedling roots at 42 h after fungal inoculation. AsPathogens 2021, 10, 991 4 of 18
shown in Table 3, strains T49, T75 and T115 colonized the roots, with the highest rates for
T49 and T75 (p < 0.05), while T68 showed no colonization.
Table 3. Colonization of wheat roots by Trichoderma strains (T. virens T49, T. longibrachiatum T68, T
spirale T75 and T. harzianum T115) *.
Trichoderma Actin Wheat Ctin
Strains Ratio ****
Ct SD Qty ** SD Ct SD Qty *** SD
T49 18.06 0.07 3.08 0.80 22.85 0.11 2.47 0.73 1.39 ± 0.71 a
T68 19.40 0.04 0.16 0.18 22.36 0.30 2.99 1.14 0.04 ± 0.04 c
T75 17.39 0.02 5.13 0.72 21.95 0.09 4.70 0.14 1.09 ± 0.13 ab
T115 18.66 0.10 2.74 0.54 21.89 0.15 4.22 0.45 0.65 ± 0.11 b
* Fungal DNA present on wheat roots 42 h after the inoculation was quantified by qPCR. Ct, threshold cycle and
SD, standard deviation. ** Quantity of Trichoderma DNA (ng) referred to Trichoderma actin gene. *** Quantity
of wheat DNA (ng) referred to wheat actin gene. **** Proportion of fungal DNA vs. plant DNA. Data are
calculated from n = 4 replicates per strain. Values in the same column with different letters are significantly
different according to one-way analysis of variance (ANOVA) followed by Tukey’s test at the 0.05 alpha-level
of confidence.
2.3. Differences in ACCD Activity and Phytohormonal Profiles in Trichoderma Strains
The ACCD activity was calculated for all four strains after growing them for four days
in synthetic minimal medium. Strain T115 showed significantly higher specific ACCD
activity (1.8 mmol of α-ketobutyrate per mg of protein) compared to that of the other three
strains (0.09 to 0.20 mmol α-ketobutyrate per mg of protein) (Tukey test at p < 0.05), which
showed no significant differences between them.
The production of eight phytohormones by the four Trichoderma strains was mea-
sured in PDB medium with and without Trp. Since the PDB medium is composed of
plant material, uninoculated media were used as controls. Under these two conditions,
a comparative analysis of the production profiles of GA4 , GA1 , ABA, SA, IAA, DHZ, iP
and tZ by strains T49, T68, T75 and T115 is shown in Figure 1. When compared to the
control conditions of each culture medium in a one-way ANOVA, not all Trichoderma strains
exhibited production of the eight phytohormones in both media. There was an effect of
the variable “strain” (p < 0.001) and variable “medium” (p < 0.001), and their combination
on the production of seven of the phytohormones investigated, according to a two-way
ANOVA (p < 0.001).
Particularly, the CK iP was the only one that showed no significant effect for the
combination of the two variables. T. virens T49 significantly exhibited the highest levels
of GA4 in both media, being much higher in PDB-Trp (p < 0.001). Considering the phy-
tohormone production profiles as a whole T. longibrachiatum T68 did not stand out for
any of them. In addition, GA4 levels were lower for this strain than those detected in
its controls, which would be indicative of the metabolization of this molecule present in
the medium. Similar behavior was observed only for GA1 with strains T75 and T115 in
PDB-Trp medium. T. spirale T75 showed the highest production levels of SA, IAA and CK.
The biosynthesis of SA and CK by this strain did not respond to the addition of Trp to
the culture medium. However, strain T75 in PDB-Trp increased IAA levels by about 80
times. On the contrary, strain T49 showed higher levels of IAA production in PDB than in
PDB-Trp. T. harzianum T115 was the strain in which the levels of GA1 and ABA production
in PDB were significantly the highest.Pathogens 2021,10,
2021,
Pathogens 10,991
x FOR PEER REVIEW 5 of 18 5 of 18
Phytohormone
Figure1. 1.Phytohormone
Figure production
production in 4-days
in 4-days PDB and PDB and PDB-tryptophan
PDB-tryptophan (Trp)bycultures
(Trp) cultures four by four
Trichoderma
Trichoderma strains
strains (T. (T. virens
virens T49,T49, T. longibrachiatum
T. longibrachiatum T68, TT75
T68, T spirale spirale
and T75 and T. harzianum
T. harzianum T115) com-T115) com-
pared
pared toto
their respective
their respective PDBPDBand and
PDB-Trp mediamedia
PDB-Trp controls. (A) Gibberellin
controls. 4 (GA4), (B)
(A) Gibberellin gibberellin
4 (GA 4 ), (B) gibberellin
1 GA1, (C) abscisic acid (ABA), (D) salicylic acid (SA), (E) indole-3-acetic acid (IAA), (F) cytokinin
1 GA1 , (C) abscisic acid (ABA), (D) salicylic acid (SA), (E) indole-3-acetic acid (IAA), (F) cytokinin
dihydrozeatin (DHZ), (G) cytokinin isopenteniladenine (iP), and (H) cytokinin trans-zeatin (tZ).
dihydrozeatin
Data are calculated(DHZ),
from (G)
n = 3cytokinin
replicatesisopenteniladenine
per strain and culture(iP), and (H)For
medium. cytokinin trans-zeatin (tZ). Data
each phytohormone
areculture
and calculated
medium, n = 3 replicates
fromdifferent letters aboveperthe
strain
barsand culture
indicate medium.
significant For each
differences phytohormone
according to and
one-way
culture analysis
medium,ofdifferent
variance letters
(ANOVA) abovefollowed by indicate
the bars Tukey’s test at the 0.05
significant alpha-level
differences of confi-to one-way
according
dence. For each phytohormone, significant effects were determined by a two-way ANOVA for
analysis of variance (ANOVA) followed by Tukey’s test at the 0.05 alpha-level of confidence. For each
phytohormone, significant effects were determined by a two-way ANOVA for Trichoderma strain,
culture medium and the combination strain per culture medium (***: p < 0.001; **: p < 0.01; ns: no
statistical differences).Pathogens 2021, 10, 991 6 of 18
2.4. The Effect of Trichoderma Strains on Wheat Plants under Drought Stress
Greenhouse-grown wheat plants were used to evaluate the effect of PDB and PDB-Trp
cultures of the four Trichoderma strains when they were applied to the plant substrate. Plant
fresh and dry weight and conductance parameters were measured after 30 days of growth
under optimal irrigation and 1/3 of the watering applied during the third and fourth weeks
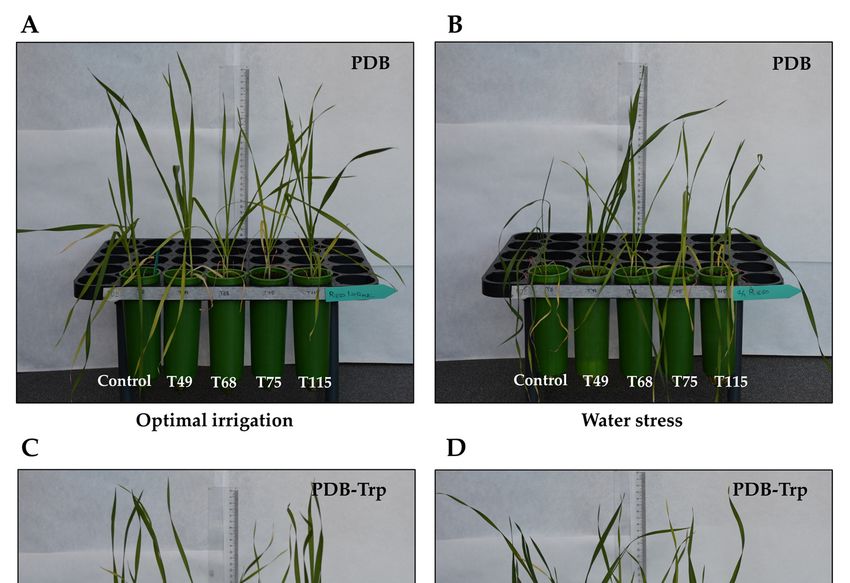
(water stress) (Tables 4 and 5). Representative phenotypes observed in wheat plants treated
with the different Trichoderma cultures and irrigation regimes are shown in Figure 2. In
a broad sense, the one-way ANOVA results showed the existence of significance for the
factors “strain” (p < 0.001), “culture medium” (p < 0.001) and “stress” (p < 0.001). Two
different plant responses were observed for Trichoderma cultures from both PDB and PDB-
Trp media. Therefore, plants treated with T68 and T75 PDB cultures significantly showed
the lowest fresh and dry weight compared to the other treatments under optimal irrigation
conditions (Table 4). On the other hand, under water stress conditions, plants treated with
PDB cultures of T49 and T115 had significantly the highest weights, with an increase of ca.
100%. Regarding conductance values, wheat plants showed significantly higher numbers
with T49 and T115 PDB cultures under optimal irrigation conditions, whereas the control
presented a significant reduction compared to any of the four Trichoderma strains applied
under water stress.
Table 4. Effect of 4-days PDB cultures of Trichoderma strains on mean fresh and dry weight and
conductance values of 30-day-old wheat plants grown in greenhouse with optimal irrigation and
water stress conditions (1/3 in the last two weeks).
Fresh Weight (g) Dry Weight (g) gs (mol H2 O m−2 s−1 )
Treatment Optimal Water Optimal Water Optimal Water
Irrigation Stress Irrigation Stress Irrigation Stress
Control 1.13 a 0.39 b 0.22 a 0.10 b 0.166 b 0.006 b
T49 1.09 a 0.82 a 0.21 a 0.22 a 0.278 a 0.089 a
T68 0.51 b 0.35 b 0.11 b 0.07 b 0.108 b 0.110 a
T75 0.35 b 0.41 b 0.10 b 0.08 b 0.139 b 0.132 a
T115 0.93 a 0.76 a 0.20 a 0.17 a 0.234 a 0.100 a
Data are calculated from n = 10 replicates per treatment and condition. Values in the same column with different
letters are significantly different according to one-way analysis of variance (ANOVA) followed by Tukey’s test at
the 0.05 alpha-level of confidence.
Table 5. Effect of 4-days PDB-Trp cultures of Trichoderma strains on mean fresh and dry weight and
conductance values of 30-day-old wheat plants grown in greenhouse with optimal irrigation and
water stress conditions (1/3 in the last two weeks).
Fresh Weight (g) Dry Weight (g) gs (mol H2 O m−2 s−1 )
Treatment Optimal Water Optimal Water Optimal Water
Irrigation Stress Irrigation Stress Irrigation Stress
Control 1.26 a 0.82 a 0.20 a 0.19 a 0.189 ab 0.157 a
T49 1.32 a 0.67 a 0.23 a 0.22 a 0.213 a 0.188 a
T68 0.68 b 0.52 a 0.12 b 0.11 b 0.147 b 0.165 a
T75 0.55 b 0.61 a 0.11 b 0.12 b 0.150 b 0.161 a
T115 1.27 a 0.74 a 0.24 a 0.21 a 0.162 ab 0.108 a
Data are calculated from n = 10 replicates per treatment and condition. Different letters indicate significant
differences within each column according to one-way analysis of variance (ANOVA) followed by Tukey’s test at
the 0.05 alpha-level of confidence.T68 0.68 b 0.52 a 0.12 b 0.11 b 0.147 b 0.165 a
T75 0.55 b 0.61 a 0.11 b 0.12 b 0.150 b 0.161 a
T115 1.27 a 0.74 a 0.24 a 0.21 a 0.162 ab 0.108 a
Data are calculated from n = 10 replicates per treatment and condition. Different letters indicate
Pathogens 2021, 10, 991 7 of 18
significant differences within each column according to one-way analysis of variance (ANOVA)
followed by Tukey’s test at the 0.05 alpha-level of confidence.
Figure 2. Wheat plants from untreated (control) or treated with Trichoderma (T. virens T49, T. longi-
Figure 2. Wheat
brachiatum T68, Tplants
spiralefrom untreated
T75 and (control)
T. harzianum or treated
T115) strains with Trichoderma
subjected (T. virens
to different T49, T.
irrigation longi-
regimes.
brachiatum T68, T spirale T75 and T. harzianum T115) strains subjected to different irrigation regimes.
(A) Four-days PDB Trichoderma cultures were applied to the plant growth substrate or PDB (control)
(A) Four-days PDB Trichoderma cultures were applied to the plant growth substrate or PDB (control)
under optimal irrigation. (B) The same under water stress (1/3 of the watering applied during the
under optimal irrigation. (B) The same under water stress (1/3 of the watering applied during the
third and
third and fourth
fourth weeks)
weeks) condition.
condition. (C)
(C)four-days
four-daysPDB-tryptophan
PDB-tryptophan(Trp) Trichoderma cultures
(Trp) Trichoderma cultures were
were
applied to the substrate of plant growth or PDB-Trp (control) under optimal irrigation.
applied to the substrate of plant growth or PDB-Trp (control) under optimal irrigation. (D) The same (D) The
same under water stress (1/3 of the watering applied during the third and fourth weeks)
under water stress (1/3 of the watering applied during the third and fourth weeks) condition. Pho- condition.
Photographs
tographs werewere taken
taken when when plants
plants werewere 30 days
30 days old. old.
In a similar way, wheat plants treated with T68 and T75 PDB-Trp cultures had signif-
icantly lower fresh and dry weight values than control plants or those treated with T49
and T115 PDB-Trp cultures under optimal irrigation conditions (Table 5). However, no
differences in weight and conductance values under water stress were observed among
treatments with the sole exception of those plants treated with T68 or T75 PDB-Trp cul-
tures, which gave significantly lower dry weight values (Table 5). A two-way ANOVA
for dry weight data showed significance for “culture medium” × “stress” (p < 0.05); and
for conductance data, all combinations (“strain” × “culture medium”, “strain” × “stress”,
“culture medium” × “stress”; p < 0.001) were significant. Additionally, a three-way ANOVA
showed significance for the combination “strain” × “culture medium” × “stress” for fresh
and dry weight (p < 0.05) and for conductance (p < 0.01).
Endogenous H2 O2 content in wheat leaf from 30-day-old plants did not show variation
in unstressed plants, neither in the control nor with Trichoderma regardless of the presence
of Trp in the medium to grow the fungus (Figure 3). Water stress control plants from the
PDB condition showed a significant increase in H2 O2 content compared to those challenged
with Trichoderma. However, PDB-Trp condition stressed control plants showed lower levelsPathogens 2021, 10, x FOR PEER REVIEW 8
Endogenous H2O2 content in wheat leaf from 30-day-old plants did not show va
tion in unstressed plants, neither in the control nor with Trichoderma regardless of
Pathogens 2021, 10, 991 8 of 18
presence of Trp in the medium to grow the fungus (Figure 3). Water stress control pla
from the PDB condition showed a significant increase in H2O2 content compared to th
challenged with Trichoderma. However, PDB-Trp condition stressed control pla
showed lowerwith
of H2 O2 than plants treated levels of H2O2 than
Trichoderma plants treated
cultures, which with Trichoderma
in turn cultures, which in t
were significantly
different, with the highest levels for the T115 treatment. The two-way ANOVA showedThe two-w
were significantly different, with the highest levels for the T115 treatment.
ANOVA
significance of the showed significance
three considered factors andof their
the three considered
pairwise factors and
combinations (pPathogens 2021, 10, x FOR PEER REVIEW
Pathogens 2021, 10, 991 9 of 18
Figure 4. Effect of Trichoderma
Figure 4. Effect ofstrain (T. virens
Trichoderma T49,(T.
strain T. longibrachiatum T68, T spirale T75
virens T49, T. longibrachiatum andT T.
T68, harzianum
spirale T115)
T75 and T. treatmen
from 4-daysharzianum
PDB andT115)
PDB-tryptophan (Trp) cultures on (A) SOD, (B) POD and (C) CAT activities
treatments from 4-days PDB and PDB-tryptophan (Trp) cultures on (A) SOD, (B) PODof wheat plants grow
under optimal irrigation and water stress (1/3 of the watering applied during the third and fourth weeks)
and (C) CAT activities of wheat plants grown under optimal irrigation and water stress (1/3 of the conditions. Da
are calculated from n = 4 replicates for each strain, culture medium and plant growth condition. For each fungal cultu
watering applied during the third and fourth weeks) conditions. Data are calculated from n = 4
medium and plant growth condition, different letters above the bars indicate significant differences according to one-wa
replicates for each strain, culture medium and plant growth condition. For each fungal culture
analysis of variance (ANOVA) followed by Tukey’s test at the 0.05 alpha-level of confidence. SOD: superoxide dismutas
medium
POD: peroxidase, andand plant
CAT: growth condition, different letters above the bars indicate significant differences
catalase.
according to one-way analysis of variance (ANOVA) followed by Tukey’s test at the 0.05 alpha-level
of confidence. SOD: superoxide dismutase, POD: peroxidase, and CAT: catalase.
3. Discussion
3. Discussion Trichoderma is a very complex fungal genus that includes nearly 400 species [42
practical application
Trichoderma is a very complexof Trichoderma
fungal genus needs a correctnearly
that includes molecular characterization
400 species [42]. as th
control, biostimulation and other beneficial effects to plants should
The practical application of Trichoderma needs a correct molecular characterization as thenot be conside
broad terms,and
biocontrol, biostimulation butother
at thebeneficial
level of strain.
effectsWe
to have
plantsincluded in our
should not study four strains b
be considered
ing to four phylogenetically distant species to explore their behavior
in broad terms, but at the level of strain. We have included in our study four strains regarding how
promote
belonging to four growth and distant
phylogenetically favor water-stressed wheattheir
species to explore plants. Modern
behavior Trichoderma taxo
regardingPathogens 2021, 10, 991 10 of 18
how they promote growth and favor water-stressed wheat plants. Modern Trichoderma
taxonomy suggests the analysis of three DNA barcodes (ITS, tef1 and rpb2) [42], and we
have achieved unambiguous species identification by ITS1-ITS4 and 600 bp in length of
tef1α gene sequencing. Two out of four strains identified belong to T. harzianum and T. virens,
two species widely used as biocontrol agents in commercial practice [43,44]. The other two
strains belong to species less used in biological control, although there is recent work on the
efficacy of T. spirale and T. longibrachiatum in the control of plant pathogenic fungi [45,46].
Our study has been focused on the abilities of these strains to stimulate the growth
of wheat plants and alleviate them from water stress. Root colonization ability is often
a criterion for selecting Trichoderma strains beneficial to plants [12], and we found that
wheat was not a host for strain T68. An important and little studied aspect of Trichoderma
is the capacity to produce phytohormones that may be involved in plant interactions.
Depending on the strain of Trichoderma and the composition of the culture medium, with or
without addition of Trp, or the combination of both, the production of phytohormones was
affected. The observed differences in phytohormone production could be affected by the
degree of growth of the different strains. However, strain T68 showed good growth and
sporulation performances on PDA and PDA-Trp and did not stand out in the production of
any of the eight phytohormones tested in PDB and PDB-Trp. PDB has been used because
it is a common medium for Trichoderma growth and because the production of IAA has
been described in this medium supplemented with Trp [16]. As PDB contains molecules
of plant origin, the uninoculated medium has been used as a control, with and without
Trp addition, to subtract possible phytohormones already present in the fungal culture
media. Although Trp-containing media seem to favor the production of IAA, this is not
a rule, as strain T49 showed a behavior contrary to the other three Trichoderma strains.
T49 and T115 were the only strains that produced GA4 and GA1 , respectively, in medium
not supplemented with Trp. However, the addition of Trp to the growth medium of the
fungus induced GA4 , but not GA1 , production in both strains. Production of GA3 has been
described in T. harzianum, and accumulation of this phytohormone in combination with
IAA has been related to plant growth promotion [15,19]. The production of gibberellic
acid by Trichoderma also cooperates with IAA and ACCD in the modulation of defense
responses in wheat seedlings [18]. Production of GA1 and GA4 have been described in
other fungi such as Phoma, Penicillium and Aspergillus as plant growth promoters under
stress conditions [47,48]. In our case, we have seen that the production profiles of GA1 and
GA4 are antagonistic, and in the strains that produce them, T49 and T115, their biosynthesis
seems to be compensated. It is well known the antagonistic regulation of GA and ABA in
plants [49], and this also occurs in Trichoderma for GA4 and ABA production. However,
this was not the case of GA1 , as strain T115 reached in PDB the highest levels of this
phytohormone and ABA simultaneously. Regarding CK, it has been described that their
production in fungi is related to hyphal growth and branching, and their accumulation
allows better adaptation to stress and colonization of the roots, although the effect on
fungal growth is made in a dose-dependent manner [3]. T. spirale T75 produced the highest
amount of the three CK analyzed, DHZ, iP and tZ, in the two media used and this was
accompanied by the slowest significant growth on PDA and PDA-Trp. As seen in plants [1],
this strain showed the typical IAA-CK antagonism when cultured in PDB. However, strain
T75 showed the highest IAA and CK production values in PDB-Trp. It should be noted
that the production of IAA by strain T75 in PDB-Trp was particularly high and that the
trend in all strains was that the addition of Trp reduced the CK levels.
Trichoderma can manipulate the phytohormone regulatory network decreasing the
ET precursor ACC through the ACCD activity [12,36]. The four Trichoderma strains exhib-
ited ACCD activity although strain T115 showed 20 times more activity than the other
three under identical growth conditions in a synthetic medium. These results are also
a consequence of working with strains from genetically very distant species, given the
great diversity that exists within the Trichoderma genus [50]. Trichoderma ACCD has also
been described as a mechanism in enhancing wheat tolerance to salt stress [35] and wa-Pathogens 2021, 10, 991 11 of 18
terlogging [37]. Our study has included the application of Trichoderma to wheat plants
to analyze the effect on growth and tolerance to water stress. The greenhouse assay was
conducted using mycelium plus culture supernatant of Trichoderma to inoculate the sub-
strate where wheat plants were grown, and it is therefore difficult to assess the role of
Trichoderma phytohormones in wheat plant responses. Under optimal irrigation conditions,
none of the treatments with Trichoderma appeared to promote the growth of wheat plants.
Moreover, two of the strains, T68 and T75, performed worse than the PDB and PDB-Trp
control plants (Figure 2). Perhaps the smaller size and weight of plants compared to their
controls (Tables 4 and 5) may be because these two Trichoderma strains show no GA1 and
GA4 production. It is noteworthy that strain T75, which produced as indicated above the
highest concentrations of IAA in PDB-Trp, did not promote plant growth, which would
indicate that fungal IAA contributes to the total concentrations of this phytohormone, but
it is not the major player in root development as plant IAA does. The high levels of SA
and CK reached by this strain (Figure 2) could be the cause of the phenotype observed
in T75-treated plants. Since strain T68 was unable to colonize the wheat root, it may be
releasing some other metabolites that could limit the growth of the plant. PDB cultures
from strains T49 and T115, those producing maximum amounts of GA4 , and GA1 and
ACCD activity, respectively, were the ones that best increased plant tolerance to water
stress, also being the ones that provided higher conductance and weight values in plants
(Table 4). The importance of selecting a suitable strain of Trichoderma is a key point in this
type of study, as it has been observed that the colonization of Arabidopsis, tomato and maize
roots by T. virens Gv29.8 led to reduced growth of both roots and stems [7,51,52]. Never-
theless, plants treated with PDB cultures of strains T68 and T75 did not show increased
growth but did show high conductance (Table 4) and a water stress tolerance phenotype
compared with PDB control plants (Figure 2). The significant increases in conductance
that we observed in plants from the Trichoderma PDB treatments compared to their control
under water stress conditions agree with previous reports indicating that Trichoderma can
ameliorate the conductance decline in drought stressed plants [26,53].
Plants treated with Trichoderma PDB cultures under water stress conditions signifi-
cantly decreased the H2 O2 content compared to the control, although no differences were
detected under optimal irrigation condition. This result is in line with what has been
described in maize treated with T. atroviride under drought stress [27]. In the present study,
all Trichoderma strains were able to produce to a greater or lesser extent SA (Figure 2), this
phytohormone being very important in the establishment of a plant oxidative burst in
response to stress, but also in the upregulation of antioxidant metabolism [13]. The antioxi-
dant level in plant was analyzed by measuring SOD, POD and CAT activities. In a broad
sense and as expected, Trichoderma increased the SOD antioxidant activity of the plants
under water stress conditions. These results would agree with those reported in stressed or
infected tomato plants inoculated with Trichoderma [25,54]. Like in maize inoculated with T.
harzianum under salt stress [55], we have also seen that Trichoderma application decreased
POD and CAT activities under water deficit conditions. Considering the profiles observed
for the three enzyme activities in wheat plants treated with Trichoderma PDB cultures, it
seems that the effect of Trichoderma prevails over the stress condition in driving the plant’s
antioxidant machinery. The addition of Trp to Trichoderma cultures did not appear to modify
plant antioxidant enzyme profiles, upregulation of SOD and downregulation of CAT, under
non-stressed conditions. However, stressed plants did not modify their antioxidant activity
with respect to the control, and it seems that the Trp effect prevailed over the Trichoderma
application. Finally, Trp is shown to play a prominent role in the response of wheat plants
to water stress as the PDB-Trp control plants had higher weight and conductance values
than the PDB control plants. The phenotype of PDB-Trp control plants agrees with the
collapse observed in tomato plants over-stimulated with NPK fertilization and Trichoderma
under salt stress [24]. However, the phenotypes of the Trichoderma-treated plants did not
appear to be greatly affected by Trp supplementation.Pathogens 2021, 10, 991 12 of 18
The production of the phytohormones GAs, ABA, SA, IAA and CKs by Trichoderma
species is a strain-specific characteristic and depends on the composition of the culture
medium. These differences are a factor to be considered when exploring the beneficial
effects of Trichoderma on plants. In this way, the T. virens T49 and T. harzianum T115 cul-
tures were the best performers in alleviating wheat plants from water stress and it was
precisely these two strains which exhibited GA1 and IAA, and GA4 and ABA production,
respectively, in media not supplemented with Trp. The present work contributes to high-
lighting the role that the balance of phytohormone levels, to which Trichoderma contributes
with its own production, plays in beneficial plant-Trichoderma interactions. In any case,
the growth promotion and plant protection effects of Trichoderma are mechanisms with
complex regulation that depends on other Trichoderma traits and not only on the production
of phytohormones by this fungus. The results of this work are an example of the usefulness
of Trichoderma strains in the protection of crop plants against abiotic stresses.
4. Materials and Methods
4.1. Trichoderma Strains
Four Trichoderma strains isolated from soil and representing different genotypes were
used in this study: T. virens T49, T. longibrachiatum T68, T. spirale T75 and T. harzianum
T115 (references of our collection, CIALE, University of Salamanca, Spain). Three out of
four strains (T49, T68 and T75) have been included in a previous genetic diversity study
and their ITS (internal transcribed spacer) 1 sequence was available [56]. Strains were
routinely grown on potato dextrose agar (PDA, Difco Laboratories, Detroit, MI, USA)
at 28 ◦ C in the dark. For long-term storage, the strains were maintained at −80 ◦ C in a
30% glycerol solution.
4.1.1. Assays of Trichoderma Growth and Sporulation
For the determination of fungal growth, 5-mm-diameter PDA plugs of fungi were
placed at the center of Petri dishes containing PDA, PDA-Trp or malt extract agar (MEA,
Difco Laboratories Inc., Detroit, MI, USA) medium, plates were incubated at 28 ◦ C in the
dark, and colony diameters were recorded at two days. After 10 days of incubation at
28 ◦ C, fungal spores were harvested and counted as previously described [23]. For each
strain and medium, four replicates were performed.
4.1.2. Molecular Characterization of Trichoderma Strains
DNA was obtained from mycelium collected from cultures in potato dextrose broth
(PDB, Difco Laboratories Inc.) medium for 48 h as previously described [57]. The ITS
regions of the nuclear rDNA gene cluster, including ITS1 and ITS2 and the 5.8S rDNA
gene, and a fragment of the tef1α gene were amplified with the primer pairs ITS1/ITS4 and
EF1-728F/tef1rev, respectively, as described previously [56,58].
PCR products were electrophoresed on 1% agarose gels, the amplicons were excised
from the agarose gels, and DNA purified and sequenced as previously described [58].
The sequences obtained were analyzed considering homology in the NCBI database with
ex-type strains and taxonomically established isolates of Trichoderma as references. All
sequences obtained in this study have been submitted to GenBank, and their accession
numbers are indicated in Table 1.
4.1.3. Root Colonization Assay
The quantification of Trichoderma DNA in wheat roots was performed by quantitative
PCR (qPCR) as previously described [6,20], with some modifications. Wheat roots were
collected from 10-day-old seedlings cultured in 10-mL flasks containing 8 mL of liquid
Murashige and Skoog medium (MS, Duchefa Biochemie BV, Haarlem, Netherlands) supple-
mented with 1% sucrose, and inoculated with 105 conidial germlings mL− 1 of Trichoderma
strain or not (control). Three seedlings per flask were used. Trichoderma germlings were ob-
tained from 15 h cultures in PDB at 28 ◦ C and 200 rpm. After 42 h of fungal inoculation, thePathogens 2021, 10, 991 13 of 18
wheat roots were collected, washed with sterile water, homogenized under liquid nitrogen,
and kept at −20 ◦C until DNA obtainment. DNA was extracted using the Fast DNA Spin
Kit for Soil (MP Biomedical LLC, Irvine, CA, USA). Four independent wheat-Trichoderma
strain co-cultures were used for each fungal strain.
qPCR were performed with a Step One Plus thermocycler (Applied Biosystems, Foster
City, CA, USA), using KAPA SYBR FAST (Biosystems, Buenos Aires, Argentine) and the pre-
viously described primer couples Act-F//Act-R (50 ATGGTATGGGTCAGAAGGA-30 and 50
ATGTCAACACGAGCAATGG) [6] and Act-Fw//Act-Rw (50 -TGACCGTATGAGCAAGGAG-
30 //50 -CCAGACACTGTACTTCCTC-30 [40], which amplify a fragment of the actin gene
from Trichoderma and wheat, respectively. Reaction mixtures, prepared in triplicate with
1:10 diluted DNA, and PCR conditions were as previously describe [20]. Ct values were
calculated and the amount of fungal DNA was estimated using standard curves; and finally
values were normalized to the amount of wheat DNA in the samples. Each sample was
tested in quadrupled.
4.1.4. ACCD Activity of Trichoderma Strains
The ACCD activity of T49, T68, T75 and T115 strains was carried out as previously
described [35,36] with some modifications. For each strain, 100 µL of spore suspension
(1 × 10⁶ spores/mL) were inoculated in 10 mL of synthetic medium [59], and the cultures
grown at 28 ◦ C and 180 rpm for 4 days. The mycelia were collected, resuspended in
2.5 mL of Tris buffer 0.1 M (pH 8.5) and homogenized for 1 min. Toluene (25 µL) was
added to a 200 µL aliquot and vortexed for 30 s, and 20 µL of 0.5 M ACC was added (Tris
buffer was added in the control). The following steps, including the additions of HCl,
2,4-dinitrophenylhydrazine and NaOH, centrifugations, and the incubation periods of
reactions, were as previously described [36]. ACC activity was analyzed quantitatively
by measuring the amount of α-ketobutyrate produced by the deamination of ACC. α-
ketobutyrate (10–200 µmol) was used for the standard curve and absorbance was measured
at 540 nm. ACCD activity was expressed as mmol α-ketobutyrate mg−1 protein h−1 .
The Bradford protein assay was used to measure the protein total concentration in the
samples [60] using the BioRad Promega Biotech Ibérica, Alcobendas, Madrid, Spain)
reactive. Three independent replicate cultures were analyzed.
4.1.5. Determination of Phytohormone-like Compounds by Trichoderma
The strains were grown in 200 mL of PDB and PDB with 200 mg/L of tryptophan
(PDB-Trp) media at 28 ◦ C and 200 rpm for 4 days, and culture supernatants were collected
by filtration. In parallel, uninoculated PDB and PDB-Trp media were used as controls. The
supernatants were lyophilized, the dry weight was measured, and they were kept at 4 ◦ C
until hormones extraction.
Fifty mg (dry weight) of fungal cultures and media supernatant (control) were sus-
pended in 80% methanol-1% acetic acid containing internal standards and mixed by shaking
during 60 min at 4 ◦ C. The extract was kept a −20 ◦ C overnight and then centrifuged
and the supernatant dried in a vacuum evaporator. The dry residue was dissolved in
1% acetic acid and passed through the Oasis® HLB (reverse phase) column as previously
described [61].
For GA, IAA, ABA and SA quantification, the dried eluate was dissolved in 5%
acetonitrile-1% acetic acid, and the hormones were separated using an autosampler and reverse
phase UHPLC chromatography (2.6 µm Accucore RP-MS column, 100 mm length × 2.1 mm
i.d., ThermoFisher Scientific) with a 5 to 50% acetonitrile gradient containing 0.05% acetic
acid, at 400 µL/min over 21 min. For CK, the extracts were additionally passed through the
Oasis® MCX (cationic exchange) and eluted with 60% methanol-5% NH4 OH to obtain the
basic fraction. The final eluate was dried and dissolved in 5% acetonitrile-1% acetic acid and
CK were separated with a 5 to 50% acetonitrile gradient over 10 min. The hormones were
analyzed with a Q-Exactive mass spectrometer (Orbitrap detector, ThermoFisher Scientific,
Waltham, MA, USA) by targeted selected ion monitoring (SIM). The concentrations ofPathogens 2021, 10, 991 14 of 18
hormones in the extracts were determined using embedded calibration curves and the
Xcalibur 4.0 and TraceFinder 4.1 SP1 programs. The internal standards for quantification
of each of the different plant hormones were the deuterium-labelled hormones. Three
independent replicate flasks were analyzed for each strain and culture medium.
4.2. Wheat-Trichoderma Greenhouse Assay
The ability of four Trichoderma strains, T49, T68, T75 and T115, to promote the growth
of wheat plants and induce tolerance to water stress was evaluated in a in vivo assay.
Wheat (Triticum aestivum L., variety Berdún) seeds were surface disinfected by shaking in
2% sodium hypochlorite for 20 min followed by an additional step of 1 min in 0.1 N HCl,
and then rinsed them five times with sterile water. The seeds stratification was conducted
for 3 days at 4 ◦ C. Trichoderma was applied to the plant growth substrate, and Trichoderma
cultures were obtained by the inoculation of 0.5 L flasks containing 250 mL of PBD or
PDB-Trp medium with 1 × 10⁶ spore/mL and growing of the strains at 28 ◦ C and 180 rpm
for 4 days. Then, 250 mL of Trichoderma culture (mycelium and supernatant) were used for
inoculating 10 pots.
Surface-disinfected seeds were sown in conical pots (two seeds per pot) of 250 mL
capacity containing as substrate a sterile mixture of commercial (Projar Professional, Com-
ercial Projar SA, Fuente el Saz de Jarama, Spain) peat: vermiculite (3:1). The assay initially
included 20 treatments and a total of 200 plants, distributed in two blocks (100 plants per
block with 10 replicates per treatment) as follows: five for PDB, four PDB cultures and
one PDB medium (control); and five for PDB-Trp, four PDB-Trp cultures and one PDB-Trp
medium (control). Plants were maintained in a greenhouse at 22 ± 4 ◦ C, as previously
described [24], and watered as needed for 2 weeks. Thus, plants from the above indicated
two blocks were distributed into 2 sub-blocks as follows: (i) plants from PDB cultures with
optimal irrigation; (ii) plants from PDB cultures with water stress (1/3 watering during the
third and fourth weeks); (iii) plants from PDB-Trp cultures with optimal irrigation; and
(iv) plants from PDB-Trp cultures with water stress. This assay included 10 replicates per
condition and lasted 30 days.
4.2.1. Physiological Parameters of Plants
Stomatal conductance (gs) data were taken on 30-day-old wheat plants (10 plants per
condition). The gs was measured in the abaxial leaf using a leaf AP4 porometer (Delta-T
Devices Ltd., Cambridge, UK). The total shoot of wheat plants was taken at 30 days to
record fresh weight (five plants per condition) and dry weight (five plants per conditions),
after maintaining plants at 65 ◦ C for 5 days.
4.2.2. Biochemical Analyses of Plants
Wheat plants of 30 days from the greenhouse assay were used to analyze several
enzymatic activities. An intermediate leaf of four wheat plants was collected from each
treatment and each considered condition (optimal irrigation and water stress), immediately
frozen in liquid nitrogen and ground. Proteins were extracted by homogenizing 50 mg of
leaf material in 1 mL of 50 mM potassium phosphate buffer (pH 7.8) and centrifugation
at 10,000 rpm for 20 min at 4 ◦ C, and later the supernatant was taken and used for the
estimation of activity of superoxide dismutase (SOD), catalase (CAT) and peroxidase
(POD) antioxidants enzymes. The activities of CAT and POD were determined by using
a spectrophotometer as previously described [62], and one unit defined as the change of
0.01 absorbance unit per min. The activity of SOD was measured according to the previous
procedure reported [62] with minor modifications. The mixture reaction contained 2 mL
of 50 mM potassium phosphate buffer (pH 7.8), 13 mM methionine, 80 µM nitro blue
tetrazolium chloride (NBT), 15 µM riboflavin, and 50 µL of protein extract. One unit of
SOD was considered as the amount of enzyme needed to cause 50% inhibition in the
photochemical reduction of NBT. The activities of CAT, POD and SOD were expressed asPathogens 2021, 10, 991 15 of 18
unit per min per mg protein and data were calculated for four biological replicates per
considered treatment-condition.
4.2.3. H2 O2 Contents in Wheat Plants
The quantification of H2 O2 was assayed using potassium iodide and by monitoring
the absorbance at 390 nm as reported previously [63]. For each sample, fresh plant material
was ground in liquid nitrogen and 50 mg used for each sample. Four biological replicates
per considered treatment-condition were assayed.
4.3. Statistical Analysis
IBM SPSS® Statistics 27 (IBM Corp.) was used for statistical analyses, through an
analysis of variance (ANOVA), to test for possible interactions between the main effects
(strain, culture medium, stress water) followed by a mean separation using Tukey’s test
(p < 0.05).
5. Conclusions
Four Trichoderma strains belonging to genotypically distant species such as T. virens
T49, T. longibrachiatum T68, T. spirale T75 and T. harzianum T115 were able to produce to a
greater or lesser extent not only the already known IAA and SA, but also the CK iP and tZ.
However, not all strains produced the phytohormones GA1 , GA4 , ABA and the CK DHZ. In
addition, the four Trichoderma strains displayed ACCD activity. Phytohormone production
depended on the strain and/or the composition of the culture medium. Trichoderma strains
showed different root colonization behavior, with wheat not appearing to be a host for T68.
The application of PDB cultures of Trichoderma strains can be linked to the ability of wheat
plants to adapt the antioxidant machinery and to tolerate water stress. However, non-
inoculated PDB-Trp application made water-stressed control plants collapsed, while those
treated with Trichoderma did not. In any case, the plant’s ROS production and antioxidant
activities of none of the treatments with addition of Trp did not seem to respond to water
stress, although those corresponding to the application of Trichoderma PDB-Trp cultures
showed better protection. Plants treated with T49 and T115 showed the best water stress
tolerance phenotypes. Perhaps the production of GA4 by T49 and ACCD by T115 could be
a cause of this good performance of the wheat plants.
Author Contributions: E.M. and R.H. conceived and designed the experiments. M.I., A.P.-M., M.P.-B.
performed the experiments. All authors analyzed the data. R.H. and E.M. wrote the manuscript. All
authors have read and approved the final version of the manuscript.
Funding: This research was funded by the Spanish Government, grant RTI2018-099986-B-I00, the
European Regional Development Fund (FEDER) under the Regional Government of Castile and
Leon support, grants SA094P20 and Escalera de Excelencia CLU-2018-04, and Provincial Council of
Salamanca, Spain (Diputación projects-2018).
Institutional Review Board Statement: Not applicable.
Informed Consent Statement: Not applicable.
Data Availability Statement: Not applicable.
Acknowledgments: M.I. and M.P.-B. were granted with a predoctoral fellowship of the Regional
Government of Castile and Leon, and A.P.-M. was granted with a predoctoral contract of the Regional
Government of Castile and Leon (Escalera de Excelencia CLU-2018-04).
Conflicts of Interest: The authors declare no conflict of interest.Pathogens 2021, 10, 991 16 of 18
References
1. Boivin, S.; Kazmierczak, T.; Brault, M.; Wen, J.; Gamas, P.; Mysore, K.S.; Frugier, F. Different cytokinin CHK receptors regulate
nodule initiation as well as later nodule developmental stages in Medicago truncatula. Plant Cell Environ. 2016, 39, 2198–2209.
[CrossRef]
2. Egamberdieva, D.; Wirth, S.J.; Alqarawi, A.A.; Abd-Allah, E.F.; Hashem, A. Phytohormones and beneficial microbes: Essential
components for plants to balance stress and fitness. Front. Microbiol. 2017, 8, 2104. [CrossRef]
3. Chanclud, E.; Morel, J.-B. Plant hormones: A fungal point of view. Mol. Plant Pathol. 2016, 17, 1289–1297. [CrossRef]
4. Khan, M.I.R.; Fatma, M.; Per, T.S.; Anjum, N.A.; Khan, N.A. Salicylic acid-induced abiotic stress tolerance and underlying
mechanisms in plant. BMC Microbiol. 2012, 12, 3. [CrossRef]
5. Sanz, L.; Montero, M.; Grondona, I.; Vizcaíno, J.A.; Hermosa, R.; Llobell, A.; Monte, E. Cell wall degrading isoenzyme profiles
of Trichoderma biocontrol strains have correlation with rDNA taxonomical species. Curr. Genet. 2004, 46, 277–286. [CrossRef]
[PubMed]
6. Morán-Diez, E.; Hermosa, R.; Ambrosio, P.; Cardoza, R.E.; Gutiérrez, S.; Lorito, M.; Monte, E. The ThPG1 endopolygalacturonase
is required for the Trichoderma harzianum-plant beneficial interaction. Mol. Plant-Microbe Interact. 2009, 22, 1021–1031. [CrossRef]
[PubMed]
7. Nogueira-Lopez, G.; Greenwood, D.R.; Middleditch, M.; Winefield, C.; Eaton, C.; Steyaert, J.M.; Mendoza-Mendoza, A. The
apoplastic secretome of Trichoderma virens during interaction with maize roots shows an inhibition of plant defence and scavenging
oxidative stress secreted proteins. Front. Plant Sci. 2018, 59, 409. [CrossRef]
8. Carrero-Carrón, I.; Rubio, M.B.; Niño-Sánchez, J.; Navas, J.A.; Jiménez-Díaz, R.M.; Monte, E.; Hermosa, R. Interactions between
Trichoderma harzianum and defoliating Verticillium dahliae in resistant and susceptible wild olive clones. Plant Pathol. 2018, 67,
1758–1767. [CrossRef]
9. Hermosa, R.; Rubio, M.B.; Cardoza, R.E.; Nicolás, C.; Monte, E.; Gutiérrez, S. The contribution of Trichoderma to balancing the
costs of plant growth and defense. Int. Microbiol. 2013, 16, 69–80.
10. Mendoza-Mendoza, A.; Zaid, R.; Lawry, R.; Hermosa, R.; Monte, E.; Horwitz, B.; Mukherjee, P.K. Molecular dialogue between
Trichoderma and roots. Role of the fungal secretome. Fungal Biol. Rev. 2018, 32, 62–85. [CrossRef]
11. Ramírez-Valdespino, C.A.; Casas-Flores, S.; Olmedo-Monfil, V. Trichoderma as a model to study effector-like molecules. Front.
Microbiol. 2019, 10, 1030. [CrossRef]
12. Hermosa, R.; Viterbo, A.; Chet, I.; Monte, E. Plant-beneficial effects of Trichoderma and of its genes. Microbiology 2012, 158, 17–25.
[CrossRef]
13. Morán-Diez, M.E.; Martínez de Alba, A.E.; Rubio, M.B.; Hermosa, R.; Monte, E. Trichoderma and the plant heritable priming
responses. J. Fungi. 2021, 7, 318. [CrossRef] [PubMed]
14. Guzmán-Guzmán, P.; Porras-Troncoso, M.D.; Olmedo-Monfil, V.; Herrera-Estrella, A. Trichoderma species: Versatile plant
symbionts. Phytopathology 2019, 109, 6–16. [CrossRef] [PubMed]
15. Chowdappa, P.; Kumar, S.P.M.; Lakshmi, M.J.; Upreti, K.K. Growth stimulation and induction of systemic resistance in tomato
against early and late blight by Bacillus subtilis OTPB1 or Trichoderma harzianum OTPB3. Biol. Control. 2013, 65, 109–117. [CrossRef]
16. Contreras-Cornejo, H.A.; Macías-Rodríguez, L.I.; Cortés-Penagos, C.; López-Bucio, J. Trichoderma virens, a plant beneficial fungus,
enhances biomass production and promotes lateral root growth through an auxin-dependent mechanism in Arabidopsis. Plant
Physiol. 2009, 149, 1579–1592. [CrossRef] [PubMed]
17. Gravel, V.; Antoun, H.; Tweddell, R.J. Growth stimulation and fruit yield improvement of greenhouse tomato plants by inoculation
with Pseudomonas putida or Trichoderma atroviride: Possible role of indole acetic acid (IAA). Soil Biol. Biochemist. 2007, 39, 1968–1977.
[CrossRef]
18. Jaroszuk-Ściseł, J.; Tyśkiewicz, R.; Nowak, A.; Ozimek, E.; Majewska, M.; Hanaka, A.; Tyśkiewicz, K.; Pawlik, A.; Janusz, G.
Phytohormones (auxin, gibberellin) and ACC deaminase in vitro synthesized by the mycoparasitic Trichoderma DEMTkZ3A0
strain and changes in the level of auxin and plant resistance markers in wheat seedlings inoculated with this strain conidia. Int. J.
Mol. Sci. 2019, 20, 4923. [CrossRef]
19. Kamalov, L.S.; Turgunov, K.K.; Aripova, S.F.; Abdilalimov, O. Gibberillin A-3 from the microscopic fungus Trichoderma harzianum.
Chem. Nat. Compd. 2018, 54, 421–422. [CrossRef]
20. Pérez, E.; Rubio, M.B.; Cardoza, R.E.; Gutiérrez, S.; Bettiol, W.; Monte, E.; Hermosa, R. The importance of chorismate mutase in
the biocontrol potential of Trichoderma parareesei. Front. Microbiol. 2015, 6, 1181. [CrossRef]
21. Saber, W.I.A.; Ghoneem, K.M.; Rashad, Y.M.; Al-Askar, A.A. Trichoderma harzianum WKY1: An indole acetic acid producer for
growth improvement and anthracnose disease control in sorghum. Biocontrol Sci. Technol. 2017, 27, 654–676. [CrossRef]
22. Zhao, L.; Zhang, Y. Effects of phosphate solubilization and phytohormone production of Trichoderma asperellum Q1 on promoting
cucumber growth under salt stress. J. Integr. Agric. 2015, 14, 1588–1597. [CrossRef]
23. Rubio, M.B.; Quijada, N.M.; Pérez, E.; Domínguez, S.; Monte, E.; Hermosa, R. Identifying Trichoderma parareesei beneficial qualities
for plants. Appl. Environ. Microbiol. 2014, 80, 1864–1873. [CrossRef] [PubMed]
24. Rubio, M.B.; Hermosa, R.; Vicente, R.; Gómez-Acosta, F.A.; Morcuende, R.; Monte, E.; Bettiol, W. The combination of Trichoderma
harzianum and chemical fertilization leads to the deregulation of phytohormone networking, preventing the adaptative responses
of tomato plants to salt stress. Front. Plant Sci. 2017, 8, 294. [CrossRef] [PubMed]You can also read


