Piping profits - Publish What You Pay Norway
←
→
Page content transcription
If your browser does not render page correctly, please read the page content below
• R evealed: Ten of the world´s most powerful
                               extractive industry giants own at least 6,038
                               subsidiaries
                             • Over 1/3 of the subsidiaries are incorporated
                               in secrecy jurisdictions
                             • The quest by Latin American journalists
                               to try to find out more
NOVEMBER 2011      pwyp.no     Written and researched by Nick Mathiason

                Piping profits
ACKNOWLEDGEMENTS
Researched and written by Nick Mathiason
Nick Mathiason has been a journalist for over 20 years working mostly at the
Guardian and Observer newspapers where he was Business Correspondent for ten
years investigating a range of issues including private equity, tax abuse, the extractive
industry, construction, real estate and corruption stories. Twice shortlisted for major
international newspaper awards, Nick has presented in-depth packages for BBC Radio
4’s World Tonight and regularly appears on television and radio. Nick is currently
Business Correspondent at the London-based Bureau of Investigative Journalism.
The Bolivia Fact Finding Mission was led by Weimar Arandia
and Marco A. R. Escalera Rivero
The Ecuador Fact Finding Mission was led by Marcelo Varela and
Christian Zurita. Fernando Villavicencio researched and Juan Freile
translated
Web Database Design by Jonny Chubb at London Timeware,
and GreenNet (www.pwyp.no/pipingprofits)
Database Entry by Paul Browne, Emma Kelly, Caroline Mathiason
and Evie Salomon
Art Production and Layout by Kate Fishpool
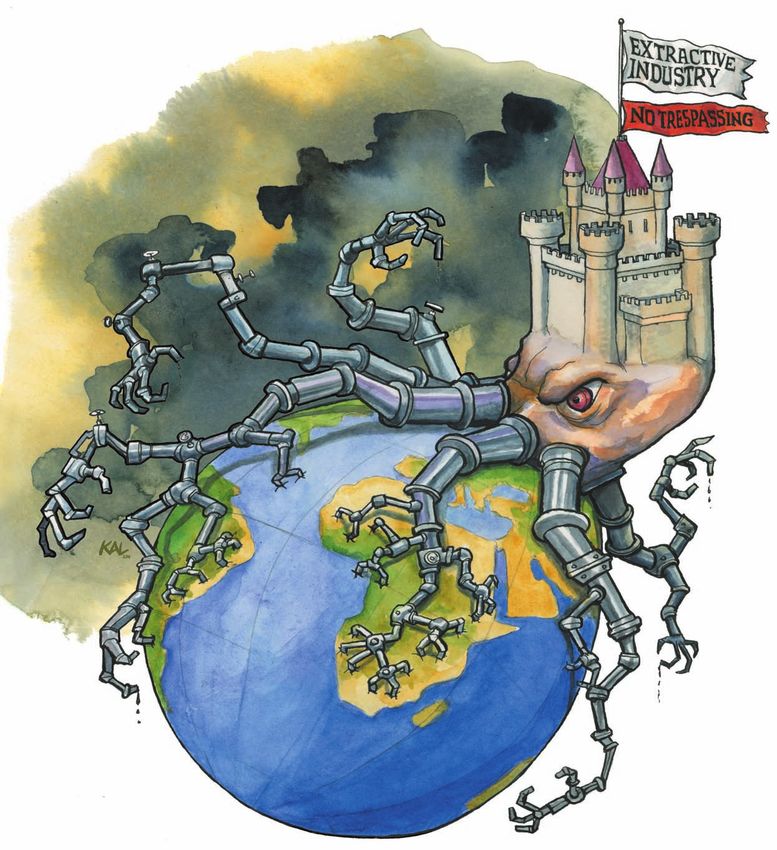
Front Cover Cartoon by Kal
Photographs by Gideon Mendel
Proof Reading by Ros Weaver
Print by CopyCat
Many thanks to Patrick Benson, John Christensen, Jonny Chubb, Heather
Lowe, Marcus Meinzer, Ros Weaver, Daniel Hennessey, David Hirst at 5RB,
Øyvind Gallefoss, Anders Firing Lunde, Alice Powell, Joseph Williams,
Arntzen de Besche and in particular Richard Murphy.
Financing from:
This report has received financial support from the Royal Norwegian Ministry of Foreign Affairs, through
‘The Dialogue Project Capital for Development’ and from the Norwegian Agency for Development
Cooperation (Norad). Publish What You Pay Norway takes full responsibility for the content of this report.
2 PIPING PROFITS
CONTENTS

           CONTENTS

           Acknowledgements...................................................................................................... 2
           Preface.............................................................................................................................. 4
           Legal Disclaimer............................................................................................................. 5
           List of Acronyms............................................................................................................. 5
           Executive Summary....................................................................................................... 6
           Introduction by Raymond Baker.............................................................................. 10

           PART 1
           Methodology................................................................................................................. 12

           PART 2
           The Extractive Industry Participant Profile........................................................... 16

           PART 3
           Inside the Secret Money Maze................................................................................. 19

           PART 4
           The quest of Bolivians and Ecuadorians to find out more................................ 30

           PART 5
           Conclusions................................................................................................................... 32

           PART 6
           Recommendations....................................................................................................... 34

           PART 7
           The Piping Profits Database – a new global resource........................................ 35

           APPENDICES
           Bolivian and Colombian Extractive Industry........................................................ 36
           Norwegian Company Information Transparency Protocols............................. 41

                                                                                                                                          PIPING PROFITS   3
PREFACE

                     PREFACE
                     MONA THOWSEN

                     In many countries north and south of the equator, citizens are asking whether
                     lucrative deals to extract their countries’ non-renewable and finite natural
                     resources provide meaningful investment opportunities to escape poverty.

                     Until now, the main focus of questions in this respect has been on corruption
                     and poor leadership, as citizens have both a right and a duty to hold their
                     leaders accountable. History has given us countless examples of a state’s
                     apparatus and its leaders failing to protect citizens and promote democracy.

                     That said, many nation states find it virtually impossible to penetrate the
                     secrecy surrounding international billion dollar agreements to extract non-
                     renewable and finite natural resources.

                     Global financial and technological integration has made it easier for
                     multinational companies to structure transactions and profit between
                     jurisdictions, helped by armies of corporate accountants and lawyers. Out of
                     public sight, around 60-70% of multinational trade is intragroup through the
                     use of subsidiaries.

                     So Publish What You Pay Norway wanted to establish the number of subsidiaries
                     extractive companies use, where they are located and how many of them are
                     incorporated in so-called ‘secrecy jurisdictions’.

                     This report would not have been possible without funding from the Norwegian
                     Ministry of Foreign Affairs through its Dialogue programme. We are very
                     grateful for this.

                     We commissioned Nick Mathiason, Business Correspondent at the Bureau
                     of Investigative Journalism and a former senior Guardian and Observer
                     journalist, to carry out a journalistic investigation, working with participants in
                     our TRACE programme to see what information they could gather. They have
                     worked tirelessly to uncover information in many countries worldwide.

                     We are honoured that Raymond Baker, director of Global Financial Integrity
                     and the author of Capitalism’s Achilles Heel, has agreed to write the
                     introduction to this report. We would also like to thank Kevin Kallaugher, the
                     eminent Economist illustrator, for creating the art on the front cover, and world
                     renowned photographer Gideon Mendel for contributing his photographs of
                     African miners which appear in this report.

                     Finally, we would like to thank all those who have supported us with their
                     knowledge and precious time in the making of this report.

                     Mona Thowsen
                     Director, PWYP Norway

4   PIPING PROFITS
LEGAL DISCLAIMER : ABBREVIATIONS

                                   Legal disclaimer:
                                   This publication is based on information provided to Publish What You Pay Norway (‘PWYP
                                   Norway’) and individuals acting on behalf of PWYP Norway by the companies mentioned
                                   herein and information that is publicly available. The conclusions presented herein are based
                                   only on information so provided. PWYP Norway and those acting on behalf of PWYP Norway
                                   have strived towards acquiring full overview of all relevant information and data to prepare
                                   this publication including by way of direct requests to the companies mentioned herein. We
                                   do not accept liability whatsoever for any insufficiency or inadequacy of the information and
                                   data that this publication is based upon.

                                   While PWYP Norway has taken all reasonable care to ensure that the information contained
                                   in this publication is accurate, publicly available information and data has not been verified
                                   by the companies and neither PWYP Norway or any person acting on behalf of PWYP Norway
                                   in the drafting and preparation of this publication can be held legally responsible for the
                                   content or guarantee that it is totally free from errors or inaccuracies.

                                   Any references contained in this publication pertaining to any kind of sources, publications or
                                   websites from third parties, are inserted for convenience only and are purely for informative
                                   purposes only and do not constitute endorsement of material on those sites, publications or
                                   sources. PWYP Norway and those acting on its behalf accept no liability whatsoever for any
                                   loss or damage arising from the use of such information.

                                   ABBREVIATIONS
                                   ABG ............................. Africa Barrick Gold
                                   AR................................. Annual Return
                                   CBCR............................ Country-by-Country Reporting
                                   E&P............................... Exploration & Production
                                   EI................................... Extractive Industry
                                   EIC................................ Extractive Industry Company
                                   EICs............................... Extractive Industry Companies
                                   EITI................................ Extractive Industries Transparency Initiative
                                   FSF ............................... Financial Stability Forum
                                   FSI ................................ Financial Secrecy Index
                                   IMF .............................. International Monetary Fund
                                   IRS................................. Internal Revenue Service
                                   OFC.............................. Offshore Financial Centre
                                   PIW............................... Petroleum Intelligence Weekly
                                   PWC.............................. PricewaterhouseCoopers
                                   PWYP Norway............ Publish What You Pay Norway
                                   SEC............................... Securities and Exchange Commission
                                   SEDAR .......................... System for Electronic Document Analysis and Retrieval

                                                                                                                        PIPING PROFITS   5
EXECUTIVE SUMMARY
EXECUTIVE SUMMARY
In this report, Publish What You Pay Norway (PWYP Norway) has attempted to unravel
labyrinthine corporate structures created by some of the world’s biggest energy and
mining companies.
Trawling filings made in British company registers and in United States and Canadian
stock exchanges, PWYP Norway has investigated:
1) how many subsidiaries ten of the most powerful Extractive Industry Companies
(EICs) control;
2) where those subsidiaries are incorporated;
3) the proportion of EIC subsidiaries incorporated in Secrecy Jurisdictions;
4) the Secrecy Jurisdictions most widely used by powerful EICs;
5) the intense difficulties faced by journalists and campaigners in Bolivia and Ecuador
in accessing key financial and industrial performance indicators from major
companies operating in their countries.
The ten Extractive Industry (EI) giants largely featured in this study are based in Australia,
Canada, Switzerland, the United Kingdom and the United States. Their operations and
influence are global.
The companies Piping Profits studied are ExxonMobil, ConocoPhillips, Chevron, BP and
Royal Dutch Shell in the oil and gas sector and Glencore International AG, Rio Tinto, BHP
Billiton, Anglo American and Barrick Gold Corporation in the broader extractive sector.1
These ten global corporations state that they generate revenues of $1,824 billion, state
their costs as $1,592 billion, make $144.7 billion profits net of tax and pay $106.9 billion
in tax according to their ‘consolidated’ accounts.2
‘Consolidated’ accounts are the sum of millions of separate transactions from thousands
of subsidiary companies which EICs either own outright or enjoy substantial control over
that are scattered throughout the world.3
Piping Profits has looked beyond EICs consolidated accounts and found that combined
the ten most powerful EI giants own 6,038 separate companies.
This in itself reveals the complicated nature of the EI. BP, the UK based oil giant, lists 2,870
separate subsidiary entries in its 2010 Annual Report. But that is only part of the story.
Piping Profits also reveals that 2,083 or 34.5% of these 6,038 subsidiaries are
incorporated in Secrecy Jurisdictions – places where among many other advantages for
companies requiring secrecy, company accounts and beneficial ownership details are not
publicly available.
This presents difficulties for citizens in resource-rich nations or shareholders with their
pension money invested in EICs wanting to understand the performance of a particular
company’s operations in a specific jurisdiction.
1 We also mapped three Norwegian Exploration & Production firms: Statoil, DNO International and InterOil whose results are not
included in the main findings but detailed later in this report.
2 Financial details taken from the Ten EICs Annual Reports in 2010 except BP where we used the 2008 results as explained more fully later.
3 http://www.ocf.berkeley.edu/~cchang/pdf%20docs/ch003.pdf
6 PIPING PROFITSEXECUTIVE SUMMARY
For instance:
• H
ow is it possible to work out the amount of natural assets depleted in a defined
period by a particular company in a specific country?
• H
ow is it possible to gauge the amount of revenues earned, profits made and costs
incurred if they are largely hidden from view?
• H
ow can stakeholders establish the exact nature of tax deals and investment
incentives struck by governments and executives behind closed doors?
Accurate information of an EIC’s assets and performance in each country it operates
would:
1) help investors quantify the risk of investing in it;
2) help generate information that could be used by civil society to assess whether EIC
tax and royalty payments represent a good deal for their country; and
3) help civil society track how EI taxes have been spent in their country.
But getting any specific operational and financial performance information from oil and
mining firms, as proved by a number of journalists based in Bolivia and Ecuador working
on the Piping Profits report, was difficult, if not impossible.
EI giants’ corporate ownership structures, their use of secrecy jurisdictions and the lack of
meaningful information they impart is a major reason why stakeholders in resource-rich
nations often meet a wall of silence when asking questions about EICs. This makes it very
difficult to hold their politicians and the companies that extract oil, gas and minerals to
account.
These structures seem to hinder efficient markets, level playing fields and improved
governance. Even worse, the same structures can potentially encourage corruption and
aggressive tax avoidance, so depriving citizens in least developed and emerging nations
of manifold political, economic and social opportunities.
Many multinational companies are adept at using controversial techniques to
significantly reduce perceived profits. This in turn means they pay less tax in revenue
generating countries.4
Techniques include:
1) .creating subsidiary companies to act as the ultimate owners of brands and assets
in opaque jurisdictions like the Netherlands;
2) the payments of large management fees by revenue producing companies in one
country to another group company that is based in a tax haven;
3) shrouding revenues made by a revenue generating company through inter-
company trading activity in an activity known as transfer pricing; and
4) thin capitalisation which is when a loan is issued by a group subsidiary member
to a revenue generating one at sometimes very steep interest rates.
There is nothing to suggest that the companies featured in this report act in this way
or illegally evade tax.
4 http://www.actionaid.org.uk/doc_lib/calling_time_on_tax_avoidance.pdf
PIPING PROFITS 7EXECUTIVE SUMMARY
However, among the many findings of Piping Profits is that the global EI’s favourite place
by far to incorporate is the US state of Delaware. The so-called First State also happens
to be the headquarters of global corporate secrecy5 where:
1) details of trusts on public record are not available;
2) international regulatory requirements are not sufficiently complied with;
3) company accounts are not available on public record;
4) beneficial ownership of companies is not recorded on public record;
5) company ownership details are not maintained in official records; and
6) protected cell companies are allowed.
There are 915 Delaware subsidiaries owned by the ten EI majors – 15.2% of the overall 6,038.
The EICs sampled owned 1,154 subsidiaries incorporated in the United States with 78.9%
of them located in Delaware.
The second favourite EIC Secrecy Jurisdiction is the Netherlands, where 358
subsidiaries belonging to EI giants are based. The Netherlands does not
1) put details of trusts on public record;
2) require that company accounts or beneficial ownership be available on public record; and
3) maintain company ownership details in official records.
The Netherlands is the largest host of conduit companies worldwide and is an important
jurisdiction for corporate internal debt shifting. It is why oil, gas and mining assets from
all over the world are held, at least on paper, in the Netherlands including diamonds from
Mali, gas from Egypt and oil from West Africa.
The Piping Profit Report also established that the most opaque major EIC in this study is Chevron.
• Of Chevron’s 77 subsidiaries, 62% are located in Secrecy Jurisdictions.
• O
f Chevron’s 33 American subsidiaries, 23 of them are in Delaware – over two thirds
of its US incorporated companies.
• 21 of Chevron’s 77 subsidiaries (27%) are in either Bermuda or the Bahamas.
ConocoPhillips is the second most opaque oil and gas major in this report after Chevron
with 57% of its 536 subsidiaries incorporated in Secrecy Jurisdictions.
Exxon is almost as shy when it comes to the incorporation of its subsidiaries. Some 52%
of its 170 reported subsidiaries are held in Secrecy Jurisdictions.
Chevron, Conoco and Exxon are the three US EI major companies surveyed in this report.
Combined, 439 (56.1%) of those three North American oil majors’ 783 subsidiaries are
incorporated in Secrecy Jurisdictions.
Glencore International AG is the most opaque mining company in our survey with
46% of its 46 subsidiaries incorporated in Secrecy Jurisdictions. This is relevant given
information contained in Glencore’s recent listing document which confirms that its effective
tax rate for its 2010 $234m tax bill, ‘was 9.3% compared to 12.6% for 2009’ on revenues of
$144.9 billion and profits of $4.1 billion.6 The Swiss-based firm controls 60% of the world’s
zinc, half the world’s copper, 38% of aluminium and 9% of the global grain market.
5 Financial Secrecy Index http://www.financialsecrecyindex.com/2009results.html
6 Glencore International’s Initial Public Offering Prospectus – http://www.scribd.com/doc/54605519/Glencore-IPO-
8 PIPING PROFITSEXECUTIVE SUMMARY
The findings contained in this report are, we believe, of critical concern because natural
resources offer perhaps the largest financial potential to improve the economic and
social opportunities for hundreds of millions of people living in least developed and
emerging countries. Aid will never reach necessary volumes, and developing countries
should have the right to mobilise their own resources.
Yet this report offers a clear indication that a veil of secrecy might shroud those opportunities.
That is why PWYP Norway believes every company should publish their full revenues,
costs, profits, tax and the amount of natural resources it has used, written off and
acquired in any given year in every country it operates.
This is full Country-by-Country Reporting (CBCR) and it is clearly urgently needed given
the secretive nature of the EI industry.
This report is published at a critical time. Within the 2010 Dodd Frank Wall Street Reform
and Consumer Protection Act (Dodd-Frank)7 is a useful disclosure that requires all US-
listed firms (American and foreign) to report to the Securities and Exchange Commission
(SEC) detailed payments made to any state in which it operates on a project-by-project
basis. The SEC is finalising how those rules will be applied.
Dodd-Frank does not implement full CBCR. But the 2011 version of the Stop Tax Haven
Abuse Act8 does contain a full CBCR provision.
The European Union is also poised to publish similar legislation. As yet it is unclear how
strong its legislation will be.
If these policies are framed in the public rather than the corporate interest to produce a
full CBCR international standard, they have the potential to improve problems associated
with corruption, aggressive tax avoidance and secrecy immeasurably. This in turn will
improve beyond recognition the political, economic and social progress made by least
developed and emerging resource-rich nations.
The US and EU are both at a major crossroads with the formation of these policies.
There are, however, serious concerns that these new international rules currently drafted and
discussed will fall short of implementing full CBCR and so fail to address and improve good
governance and efficient markets as well as tackling corruption and aggressive tax avoidance.
‘I always heard it was very complex – and sometimes even dangerous – to obtain financial
information about the activity of the Extractive Industries,’ concluded Bolivian campaigner
Marco Escalera after spending six weeks attempting to draw out key financial information
from EICs operating in his country. ‘Whether it is the extractive industries or the state itself,
they close ranks against the common enemy: civil society questions. The story is repeated
over and over again: There is no access to timely and reliable information.’
Policymakers in the EU and US currently have a choice:
1) whether to frame new CBCR legislation to aid people like Marco Escalera in his
quest for clarity, justice and equity based on the public interest; or
2) to tolerate conditions that allow corruption and aggressive tax avoidance to thrive.
Soon we will know whose side legislators in the EU and US are on.
7 http://www.gpo.gov/fdsys/pkg/PLAW-111publ203/pdf/PLAW-111publ203.pdf
8 http://levin.senate.gov/newsroom/press/release/summary-of-the-stop-tax-haven-abuse-act-of-2011
PIPING PROFITS 9INTRODUCTION
INTRODUCTION BY
RAYMOND BAKER
Over the last half century there has arisen over our world a complex global shadow
financial system that manages, moves, and secretes trillions of dollars a year. This
system comprises tax havens, secrecy jurisdictions, shell corporations, anonymous
trust accounts, fake foundations, trade mispricing practices, and a variety of money
laundering techniques. Drug traffickers, other racketeers, corrupt government officials
and commercial tax evaders have equal access to this system. By some estimates it
handles perhaps half of global trade and capital movements, interjected between the
beginning and the end of transactions to shield sources or uses of funds.
The development of this system accelerated in the 1960s for two reasons. First,
that period was the era of independence, with 48 countries gaining their freedom
from colonial powers. Some of the economic and political elites in these new
nations wanted to get their money out by any means possible. Western banks and
governments serviced this desire for capital flight with a great deal of creativity and
courtesy. Second, corporations began to spread their flags around the world. There
are now more than 60,000 multinationals operating usually in dozens of countries.
Many of these corporations normalized the use of the shadow financial system to shift
profits round the world.
Economists usually attribute a ‘rational’ explanation to this phenomenon. Individuals
are said to be engaged in portfolio diversification or protection against inflation
or confiscation. Corporations are escaping taxes in far-flung operations and even
in home countries. All true, but such explanations miss the more fundamental
motivation. The essential purpose of the global shadow financial system is the shift
of money from poor to rich. This is about getting rich secretly and not having to
account for such riches locally. The hidden accumulation of wealth, whether by
persons or corporations, is the driving force sustaining and expanding the shadow
system. The facilitation of opacity is what the system was intended to do from the
1960s onward, and it performs this function most efficiently, to the detriment of the
poor across the globe.
What can change this now entrenched reality? Many bankers and treasury officials
argue that this subject matter is extremely complex, fraught with interlaced intricacies
preventing easy solutions. Not so. The focused application of political will can readily
alter the status quo. Take for example shell banks, which used to be part of the global
shadow financial system – banks fronted by nominees and trustees in such a way that
no one knew who were the real owners and managers. In October 2001, a month after
9/11, the United States enacted the Patriot Act aimed at curtailing terrorist activity
and its financing. The Patriot Act said that no US bank could receive money from a
foreign shell bank, no other bank in the world could send money to the United States
that it had received from a shell bank, and that this prohibition included wire transfers
that might momentarily pass through New York correspondent bank accounts before
speeding off elsewhere. Within weeks the number of shell banks dropped from
thousands to a handful. There are a few still operating in Europe and Asia, all very
careful to assure that their activities never touch the United States. In other words,
with a stroke of the legislative pen shell banks were virtually erased from the global
shadow financial system. This was achieved through an exercise of political will.
10 PIPING PROFITSINTRODUCTION
Nowhere has the absence of political will been more evident than in the extractive
industries. That is, until now. Finally, with the Dodd-Frank legislation in the United States
and similar measures expected in the European Union soon, oil and mining companies
will be required to account for what they pay to governments in production shares,
bonuses, royalties, and taxes on a project-by-project basis. This is a much needed step in
the right direction.
But it does not begin to curtail the use of the shadow financial system by extractive
industries, as convincingly demonstrated by Publish What You Pay Norway in this report,
Piping Profits. Ten of the most powerful oil and mining companies operate through 6,038
subsidiaries. Over one-third of these subsidiaries are located in tax havens and secrecy
jurisdictions where company accounts are not required or available. Quite simply, it
is impossible to determine what money flows into or out of these entities, for what
purposes. Even, as this report shows, when journalists and advocates ask companies for
basic information about their local activities, they are deflected and stonewalled. Opacity
works. Don’t tamper with my right to horde money you can’t see.
PWYP Norway, while strongly supportive of the Extractive Industries Transparency
Initiative and the original Publish What You Pay agenda which focussed on payments
to government, goes further and urges full country-by-country reporting for oil and
mining companies in every jurisdiction where they operate. This means reporting on
an annual basis gross revenues, costs, profits, taxes paid, resources extracted, and
remaining reserves.
Only with such reporting can citizens know what is happening to their birthright: What
resources did we begin with? How much did we produce? What did we get for it? What’s
left? Only with such reporting can investors know the value of their holdings.
Only with such reporting can governments know they are collecting their fair share
of revenues and taxes. Country-by-country reporting, for extractive industries and
eventually for all multinational corporations, is the essential step on the road toward a
more transparent economic order. And transparency is a necessary step toward a more
equitable world.
Financial opacity serves only the rich. The time has come to own up to the poor.
Raymond Baker
Director,
Global Financial Integrity
Raymond Baker is director of Global Financial
Integrity, a Washington-based think-tank
leading international efforts to curtail
illicit financial flows and enhance global
development and security
PIPING PROFITS 11PART 1: METHODOLOGY
PART 1:
METHODOLOGY
This report’s aim is to:
1) locate precisely in which countries the subsidiaries of the world’s most powerful oil,
gas and mining companies are found;
2) establish the number and proportion of Extractive Industry (EI) subsidiaries based
in Secrecy Jurisdictions; and
3) test whether it is possible for journalists in Bolivia and Ecuador to ascertain key
financial performance and tax information from strategically important subsidiaries
of EI Companies (EICs) operating in their countries.
To do this, our first task was to select the 10 most powerful Extractive Industry
Companies (EICs) which also reflect the diversity of the sector: oil, gas, mining
and trading.
Selecting the Oil & Gas Companies
The world’s ten biggest oil companies, according to Petroleum Intelligence Weekly’s (PIW)
2010 ranking, included four state owned companies and six publicly quoted ones.
Of the five biggest oil and gas companies in the PIW 2010 league table, four are
owned by the governments of Saudi Arabia, Iran, Venezuela and China. By nature their
international reach is limited. And despite our best efforts, we could not establish the
subsidiaries of these companies let alone where they are based. So, with regret we ruled
them out of our study. We would, however, be very grateful for any help in tracing those
state-owned EICs.
Among the remaining six firms included in the PIW Top Ten are ExxonMobil, BP, Royal
Dutch Shell, ConocoPhillips, Chevron and Total.
The information we required to fulfill our task – establishing the jurisdiction where
EICs’ subsidiaries are incorporated – is available in filings submitted by publicly quoted
companies in some, but not all, countries.
It should be noted there is seemingly no requirement for French companies to reveal
the jurisdiction where their subsidiaries are based. Despite repeated requests for Total
to submit information, it steadfastly refused to do so. We will discuss this situation in
greater detail later in this report.
So we targeted just five oil and gas companies: the above companies regrettably
minus Total.
The Mining Firms
We selected the world’s five biggest mining companies based on the
PricewaterhouseCoopers’ document, Mine 2011: the Game has changed. Mine 2011 ranks
the world’s 40 biggest mining companies based on market capitalisation in 2009 and
2010. Over this two year period, the top five mining firms were BHP Billiton, Vale,
Rio Tinto, China Shenhua and Anglo American.
12 PIPING PROFITSPART 1: METHODOLOGY
We had difficulties accessing relevant subsidiary information for Vale, a Brazilian
mining giant. In its US SEC filings, the information we required did not appear to
be present.
China Shenhua’s activities are principally focused on coal and power production in
China. Its subsidiaries are virtually all based in China according to its annual report.
So we judged that while the company is a global giant, its strategic interest was not as
significant, for instance, as Glencore International AG.
Glencore has operations in many countries, is a dominant player in a number of mining
sectors, listed shares on the London Stock Exchange for the first time in May 2011 and
now has a market capitalization of £33bn.
We also selected Barrick Gold Corporation, the world’s biggest gold company. It is the
eighth biggest mining company in the world according to the PWC report over the last
two years. But given the price of gold metal is breaking historic records, we believe, it is
appropriate to assess Barrick.
The Norwegian Extractive Industry Companies
We also included in our target companies Norwegian Extractive Industry companies with
significant production units overseas. The three we considered to be the most significant
and active are: Statoil, DNO International and InterOil.
Finding the raw data for the subsidiaries
The 13 companies selected are based or listed in the UK, the United States, Canada and
Norway. As stated previously, accessing the information in France and Brazil proved
difficult. In France, there is no obligation to publish the jurisdiction of French company
subsidiaries. In Brazil, we could not establish whether this was the case or not.
In the UK, the public can establish the country of incorporation of company subsidiaries
at Companies House – the official UK register of companies. All UK based companies
have to file this information in their Annual Return (AR01) which includes all subsidiaries
and their place of incorporation.
In the United States, companies are required to list their subsidiaries and their place of
incorporation in Exhibit 21 of their annual report on Form 10-K. We searched for United
States holding company 10-K filings on the Securities and Exchange Commission
EDGAR system9 where the required information can be found fairly easily.
In Canada, we searched Barrick Gold Corporation using the System for Electronic
Document Analysis and Retrieval (SEDAR). In Barrick’s Annual Information Form, we
discovered a ‘subsidiary organogram’ which laid out Barrick’s full corporate structure
including the information we were looking for – the jurisdiction of incorporation. We
will feature this fascinating organogram in more detail later in this report.
In Norway, we found it hard to establish whether there exists a standard or official way
of accessing the country of incorporation for subsidiaries belonging to Norwegian
companies. It was unclear whether The Brønnøysund Register Centre, Norway’s principal
company register, held the required information. We found the subsidiaries belonging to
Statoil, DNO International and Interoil by going through their published Annual Reports
and requesting the companies selected to confirm the country of incorporation. Some of
the Norwegian companies volunteer this information in their Annual Reports.10
9 http://www.sec.gov/edgar/searchedgar/webusers.htm
10 For a full analysis of Norwegian company information protocols, please see the Appendix of this report.
PIPING PROFITS 13PART 1: METHODOLOGY
Gathering the Data
US and Canadian company filings are available in digital format and so were entered into
the web-based database built for this project using a specially written script.
Unfortunately, UK Annual Returns tend to be scanned documents. Consequently,
subsidiary data has to be manually entered which took several weeks of repetitive work.
Mapping the data: Defining Secrecy Jurisdictions
Once we entered the subsidiary data, our next task was to establish the proportion of
subsidiaries based in Secrecy Jurisdictions and Tax Havens.
No consensus exists on the definition of a Secrecy Jurisdiction or Tax Haven, so we used
three international definitions. This gives interested parties a choice on which to base
their own conclusions.
The Definitions we used
1) A ‘List of Offshore Financial Centers’ published by both the International Monetary
Fund and the Financial Stability Forum (FSF) in 2000.11 This list has been widely
referred to subsequently as a definition of tax havens or offshore financial centres
(OFC). This list features 46 countries including Ireland which has grown significantly
over the last 25 years to become a hugely significant OFC.
2) A list drawn up by the United States Internal Revenue Service (IRS) court filings
that identified jurisdictions as ‘probable locations for US tax evasion.’ This list was
referenced in the Stop Tax Haven Abuse Act 200912 introduced by Senators Levin,
Whitehouse, McCaskill and Nelson. It does not include Ireland but includes most
of the other jurisdictions listed by the IMF/FSF. An updated version of this Act was
published in July 2011. It did not feature this list.
3) The Financial Secrecy Index (FSI) study in 2009 by the Tax Justice Network.13 This is
our preferred definition, as it is the only benchmark that meticulously assesses the
financial transparency of jurisdictions. The FSI merged two data sets:
i) .a jurisdiction’s share of the global market for offshore financial services; and
ii) the degree of secrecy provided by its laws and regulations. Secrecy
was assessed using 12 key questions around the ability to access key
financial information.
Each country received an Opacity Score based on whether for instance accounts, trust
ownership and beneficial ownership information is available for public inspection.
This study isolated the Opacity Score element of the FSI and included countries that
scored more than 50%. The number of countries this covers equals 59 including the
United States because of the corporate legal conditions found in Delaware.
The Delaware Question
In their SEC filings, US companies include the State in which their American subsidiaries are
located. This is a very important fact.
In the United States, the level of corporate disclosure between the 50 States varies
considerably. The states widely judged to have the lowest levels of disclosure are
Delaware, Nevada and Wyoming. These ‘secrecy states’ tend to be very popular states
with corporations. More than 900,000 business entities choose Delaware as a location to
incorporate.14 The number of businesses exceeds Delaware’s human population of 855,000.
11 http://www.imf.org/external/pubs/ft/wp/2007/wp0787.pdf (Table 10)
12 http://levin.senate.gov/newsroom/press/release/?id=0dd3cbe8-6617-4d30-ab88-867535db2a09
13 http://www.financialsecrecyindex.com/2009results.html
14 http://corp.delaware.gov/10CorpAR.pdf
14 PIPING PROFITSPART 1: METHODOLOGY
UK companies’ filings do not disclose which US State their subsidiaries are located in.
But it is possible to establish UK companies’ Delaware connection by checking the name
of any subsidiary against a Corporate Register of Companies run by the State of Delaware
on its website.15
The subsidiaries based in Delaware belonging to companies in the UK and other
countries were included in the Opacity Index. This is because Delaware, according to
the 2009 FSI:
1) does not put details of trusts on public record;
2) does not comply sufficiently with international regulatory requirements;
3) does not require that company accounts be available on public record;
4) does not require that beneficial ownership of companies is recorded on
public record;
5) does not maintain company ownership details in official records;
6) does not exchange tax information pursuant to the European Union Savings
Tax Directive;
7) does not have adequate access to banking information;
8) allows protected cell companies;
9) allows company redomiciliation; and
10) provides banking secrecy
There are similar concerns with respect to Nevada and Wyoming. This is why subsidiaries
of United States companies incorporated in these states were also included in our High
Opacity metric. As stated before, UK EICs do not disclose which individual US state they
incorporate in. We have not yet established for ourselves whether UK EIC subsidiaries are
incorporated in Nevada and Wyoming.
The absence of this data means the overall 34.5% Opacity Score we have for EICs could
be slightly higher.
The BP issue
We found BP the hardest company in our sample study to assess. BP’s 2010 Annual
Return contains a 68-page ownership grid which lists 2,870 separate subsidiaries divided
into 14 ‘tiers’. But there are a huge amount of repeated company entries among those
2,870 entities.
Weeding out all the obvious repetitions, we arrived at 1,596 BP subsidiaries. BP has told
us it controls 1,491 subsidiaries as of September 2011. But it disappointingly would
not supply us with any documents listing its subsidiaries beyond what is in the public
domain.
15 https://delecorp.delaware.gov/tin/GINameSearch.jsp
PIPING PROFITS 15PART 2: THE EXTRACTION INDUSTRY PARTICIPATION PROFILE
PART 2:
THE EXTRACTIVE INDUSTRY
PARTICIPATION PROFILE
The EICs surveyed in our investigation are profiled here.
Oil and Gas
1617181920212223
ExxonMobil16 Royal Dutch Shell18
Key Facts: Exxon’s current Key Fact: In 2010, Royal
Revenues: $383.2 billion portfolio of more than Revenues: $378.1 billion Dutch Shell reduced costs
Total Costs: $330.2 billion 130 major development Total Costs: $342.8 billion by $2bn. The company
projects could deliver Total Tax on Income: $35.3 billion made nine notable
Total Tax on Income: $21.5 billion
more than 26 billion net discoveries in 2010 that in
Net Profit: $30.4 billion oil- equivalent barrels Net Profit: $20.4 billion total exceeded production
E&P17 Country Total: 38 during its lifetime. Its E&P Country Total: 25 volume. New projects
Subsidiaries: 170 revenues in 2011 are Subsidiaries: 1,273 will emerge in the Gulf
predicted to increase of Mexico, Australia, Iraq
High Opacity: 52% to over $470 billion. High Opacity: 41% and China.
BP19 Chevron21
Key Fact: BP has proven Key Fact: ‘Chevron is the
Revenues: $367 billion reserves of 18 billion Revenues: $204.9 billion largest private producer
Total Costs: $331.8 billion barrels of oil equivalent. Total Costs: $172.9 billion of oil in Kazakhstan, the
top oil and natural gas
Total Tax on Income: $12.6 billion Total Tax on Income: $12.9 billion
producer in Thailand,
Net Profit: $21.6 billion Net Profit: $19 billion the largest oil producer
E&P Country Total: 29 E&P Country Total: 2422 in Indonesia and the
Subsidiaries: 1,49120 Subsidiaries: 77 top leaseholder in the
US Gulf of Mexico. It
High Opacity: 35% High Opacity: 62% has major operations in
Nigeria, Angola, Chad, the
Democratic Republic of
Congo and Venezuela.’
ConocoPhillips23
Key Fact: ‘ConocoPhillips
Revenues: $198.6 billion has exploration activities in
Total Costs: $178.9 billion 17 countries and produced
Provision for Income Tax: $8.33 billion hydrocarbons in 14 countries,
with proven reserves in 16
Net Profit: $11.3 billion countries. Producing areas
E&P Country Total: 31 included the United States,
Subsidiaries: 536 Norway, the United Kingdom,
Canada, Australia, offshore
High Opacity: 57% Timor-Leste in the Timor Sea,
Indonesia, China, Vietnam,
Libya, Nigeria, Algeria, Russia
and Qatar.’
16 Exxon 2010 annual report http://phx.corporate-ir.net/External.File?item=UGFyZW50SUQ9ODk0MzZ8Q2hpbGRJRD0tMXxUeXBlPTM=&t=1
17 E&P stands for Exploration & Production.
18 http://www.annualreportandform20f.shell.com/2010/servicepages/downloads/files/all_shell_20f_10.pdf
19 http://www.bp.com/assets/bp_internet/globalbp/globalbp_uk_english/set_branch/STAGING/common_assets/downloads/pdf/BP_Annual_Report_and_Form_20F.pdf We used BP’s 2008 figures as
last year was distorted by the Gulf of Mexico spillage disaster which saw BP record a loss. 2009 was a bad year for ALL the oil majors as the oil price dropped sharply after the 2008 spike. We consider 2008
and 2010 roughly comparable.
20 As explained, BP lists 2,870 separate entities in its Annual Return. The company states it has 1,491. Using just the company’s Annual Return, we have identified 1,596 separate entities.
21 http://www.chevron.com/annualreport/2010/documents/pdf/Chevron2010AnnualReport.pdf
22 estimate
23 http://www.conocophillips.com/EN/about/company_reports/annual_report/Documents/2010_SummaryAnnualReport.pdf
16 PIPING PROFITSPIPING PROFITS PART 2: THE EXTRACTION INDUSTRY PARTICIPATION PROFILE
Mining Companies
242526272829
Glencore International AG24 Rio Tinto25
Key Facts: Glencore’s 2010 Key Fact: Rio Tino’s aluminium
Revenues: $144.9 billion financial statement confirms Revenues: $56.5 billion division’s revenues at $773m
Operating Costs: $140.4 billion that its effective tax rate for Total Costs: $36.6 billion grew by more than 26% in
Taxation: $234 million the firm’s $234m tax bill, Taxation: $5.29 billion 2010. Copper, which accounts
‘excluding share of income for 17% of group revenues,
Net Profit: $4.1 billion from associates which is Net Profit: $15.18 billion grew by $1.5bn to $7.7bn.
E&P Country Total: 40 recorded post tax, was 9.3% E&P Country Total: 40 countries Iron ore is Rio’s major cash
Subsidiaries: 46 compared to 12.6% for 2009’. Subsidiaries: 926 generator accounting for 68%
The firm controls 60% of the of revenue. Rio is expanding
High Opacity: 46% world’s zinc, half the world’s High Opacity: 20% iron ore facilities in Pilbara,
copper, 38% of aluminium and Australia; Simandu, Guinea
9% of the global grain market. and Orissa, India.
BHP Billiton26 Anglo American27
Key Facts: BHP is the world’s Key Facts: Anglo controls
Revenues: $52.79 billion largest diversified mining Revenues: $27.6 billion the world’s largest platinum
Operating Costs: $33.29 billion company producing oil, coal, Operating Costs: $19.4 billion reserves and is the largest
Total Taxation: $6.56 billion iron ore, copper, aluminium Taxation: $2.69 billion primary producer of platinum,
uranium and diamonds. In with 40% of world supply.
Net Profit: $13 billion July 2011, it eclipsed previous Net Profit: $6.4 billion Anglo owns 45% of De Beers
E&P Country Total: 25 record production levels in E&P Country Total28: 17 which controls 35% of the
Subsidiaries: 462 four commodities. Subsidiaries: 837 world’s rough diamond and
whose principal entities are
High Opacity: 20% High Opacity: 15% based in Luxembourg, one
of Europe’s most opaque
jurisdictions. Iron ore and
copper are among the firm’s
Barrick Gold Corporation29 major earners.
Key Facts: Canadian-based
Revenues: $10.99 billion Barrick Gold Corporation’s gold
Costs: $6.34 billion production increased to 7.8
Taxation: $1.48 billion million ounces at total cash
costs of $457 per ounce. The
Net Profit: $3.29 billion Company says it consistently
E&P Country Total: 10 (estimate) replaced its reserves in each
Subsidiaries: 115 of the last five years. Gold
reserves now stand at about
High Opacity: 27% 140 million ounces, the largest
in the industry. In addition,
measured and indicated gold
resources grew 24% to 76 million
ounces. ‘Inferred’ gold resources
increased by 18% to 37 million
ounces. Barrick also owns 6.5
billion pounds of copper reserves,
13 billion pounds of measured
and indicated copper resources
and 9.1 billion pounds of inferred
copper resources.
24 http://www.scribd.com/doc/54605519/Glencore-IPO-
25 http://www.riotinto.com/documents/Investors/RioTinto_Annual_report_2010.pdf
26 http://www.bhpbilliton.com/home/investors/reports/Documents/bhpBillitonAnnualReport2010.pdf
27 http://www.angloamerican.com/investors/reports/~/media/Files/A/Anglo-American-Plc/investors/reports/2011rep/angloamerican-annual-report-2010.pdf
28 estimate
29 http://www.barrick.com/Theme/Barrick/files/Annual-Report-2010/PDF/Barrick-Annual-Report-2010.pdft
PIPING PROFITS 17PART 2: THE EXTRACTION INDUSTRY PARTICIPATION PROFILE
Norwegian Extractives
30 3132
Statoil30 InterOil31
Key Facts: Statoil’s biggest Key Facts: InterOil is
Revenues: $95.23 billion activities are located in Revenues: $104.7 million just six years old but
Costs: $70.6 billion Norway but its future success Costs: $61.6 million has significant oil and
Income before tax $24.6 billion will be determined in countries Taxation: $7.9 million natural gas assets in
like Angola which currently Colombia, Peru and
Taxation: $17.84 billion accounts for 37% of its Net Loss: $48.8 million Ghana. InterOil’s finance
Net Income: $6.77 billion international oil and gas E&P Country Total: 3 costs are put at $66.8
E&P Country Total: 16 output. It is the world’s 13th Subsidiaries: 15 million triggering a loss.
biggest oil and gas firm. The
Subsidiaries: 35 Norwegian government owns High Opacity: 47%
High Opacity: 11% 67% of its shares.
DNO International ASA32
Key Facts: DNO is based in
Revenues: $230 million Oslo, Norway. Most of its oil
Costs: $200 million currently produced comes
Taxation: $13.68 million from the Kurdistan region
of Iraq. It is also active in
Net Loss: $50.93 million Yemen, UK, Equatorial
E&P Country Total: 5 Guinea and Mozambique.
Subsidiaries: 5 DNO International’s finance
costs are put at NOK 407.7m,
High Opacity: 0% triggering a loss.
30 http://www.statoil.com/annualreport2010/en/financialstatements/pages/consolidatedfinancialstatementsstatoil.aspx
31 http://hugin.info/137537/R/1510962/446147.pdf
32 http://www.dno.no/Investors/Financials/Annual-Reports/4419/
18 PIPING PROFITSPART 3: INSIDE THE SECRET MONEY MAZE
PART 3:
INSIDE THE SECRET MONEY MAZE
The Data
This investigation discovered that the ten global EICs featured in this report between
them own a total of 6,038 subsidiary companies across the world.
It should be recognised that the list of subsidiaries supplied by EICs in public filings
are only the ones they deem to be materially important. It is likely EICs own even more
subsidiaries than they disclose.
But of these 6,038 subsidiaries, 2,083 or 34.5% are incorporated in jurisdictions with high
levels of corporate secrecy as defined by the Financial Secrecy Index.
Using the combined IMF and FSF definition, the top global EICs own a total of 681
subsidiaries or 11% in ultra-low tax havens. Using the US Internal Revenue Service
definition yields 576 subsidiaries or 10%.
Table 1: The Global Extractive Industry and its reliance on Secrecy Jurisdictions33
Company Total subsidiaries FSI listed % IMF listed % IRS listed %
Anglo American 837 129 15 91 11 72 9
Barrick Gold Corporation 115 31 27 21 18 21 18
BHP 462 146 32 50 11 46 10
BP 1596 605 38 143 9 122 8
Chevron 77 48 62 22 29 22 29
Conoco Phillips Holdings Co. 427 239 56 72 17 63 15
Conoco Phillips Petroleum Ref. 109 63 58 21 19 20 18
Exxon 170 89 52 35 21 32 19
Glencore International AG 46 21 46 12 26 12 26
Rio Tinto plc 926 189 20 67 7 57 6
Shell (Corporate) 128 64 50 27 21 23 18
Shell (Downstream) 694 221 32 76 11 48 7
Shell (Projects & Technology) 52 33 63 6 12 5 10
Shell (Trading) 39 25 64 8 21 8 21
Shell (Upstream Americas) 89 61 69 2 2 2 2
Shell (Upstream International) 271 119 44 28 10 23 8
All companies 6038 2083 34 681 11 576 10
33 Secret states figures also include five incorporated in Nevada and one in Wyoming
PIPING PROFITS 19PART 3: INSIDE THE SECRET MONEY MAZE
The Extractive Industry’s Favourite Locations
Overwhelmingly, the global extractive industry’s favoured location to incorporate is
the United States. And 78.9% of the 1,154 US subsidiaries belonging to some of the
world’s most powerful EIs are located in Delaware. Delaware has more business entities
choosing the so-called First State as their home than humans – 900,000 companies
to 855,000 people.
Table 2: The Top 25 Jurisdictions where Extractive Industry Subsidiaries
are Incorporated
United States 1,154
United Kingdom 921
Australia 611
Netherlands 358
South Africa 284
Germany 263
Canada 248
France 198
Bermuda 127
China 84
Brazil 75
British Virgin Islands 67
Singapore 59
Bahamas 54
Malaysia 54
Zimbabwe 53
Switzerland 51
New Zealand 51
Cayman Islands 49
Luxembourg 48
Chile 44
Spain 41
Hong Kong 40
Ireland 37
Nigeria 37
Delaware is increasingly recognised as the headquarters of international corporate
secrecy. In 2009, The Observer reported:
Delaware – the political power-base of the US vice-president, Joe Biden – offers high
levels of banking secrecy and does not make details of trusts, company accounts and
beneficial ownership a matter of public record. Delaware also allows companies to
re-domicile within its borders with minimal disclosure, and allows the existence of
privacy-enhancing ‘protected cell’ or ‘segregated portfolio’ companies, among many
other stratagems useful for protecting the identity of those who do business there.
The only financial privacy indicator on which Delaware scores positively is that it is
party to a large number of international tax information sharing agreements, but this
is because those agreements are signed by the United States.
Delaware state officials say it is not the ability to protect identities that attracts so many
companies and individuals to register businesses; rather, it is the state’s sophisticated
judicial system, which has evolved, they say, into the top corporate dispute resolution
centre in America.
20 PIPING PROFITSPART 3: INSIDE THE SECRET MONEY MAZE
But lawyer Jack Blum, a former US Senate staff attorney who has worked on high-profile
fraud cases, including the BCCI investigation, says: ‘Secrecy in Delaware has been a
massive problem and has been for sometime. They have a lot of rules that… make it
so advantageous to be there that it is breathtaking.’ And, he adds, requests for legal
assistance from other countries fall on deaf ears. ‘The requests pile up in district courts.
It’s beyond embarrassing. It’s a disgrace.’
Table 3: Extractive Industry’s United States and Delaware subsidiaries:
(Delaware EI subsidiaries as a proportion of its US subsidiaries)
Company Total USA Del. Del %
Anglo American 837 9 7 77.78
Barrick Gold Corporation 115 25 9 36.00
BHP 462 63 51 80.95
BP 1596 450 354 78.67
Chevron 77 33 23 69.70
Conoco Phillips Holdings Co. 427 157 136 86.62
Conoco Phillips Petroleum Ref. 109 37 32 86.49
DNO International 5 0 0 0.00
Exxon 170 50 44 88.00
Glencore International AG 46 4 4 100.00
Interoil 15 0 0 0.00
Rio Tinto plc 926 145 95 65.52
Shell (Corporate) 128 12 11 91.67
Shell (Downstream) 694 79 69 87.34
Shell (Projects & Technology) 52 13 10 76.92
Shell (Trading) 39 11 11 100.00
Shell (Upstream Americas) 89 60 54 90.00
Shell (Upstream International) 271 5 5 100.00
Statoil 35 1 1 100.00
PIPING PROFITS 21PART 3: INSIDE THE SECRET MONEY MAZE
The Netherlands connection
Delaware is, by a margin of almost three times, the EI sectors’ favourite place to
incorporate compared with other Secrecy Jurisdictions, using the Opacity Score
component within the Tax Justice Network’s 2009 FSI.
In second place, by a similar wide margin, is the Netherlands. The Netherlands is not
normally bracketed with palm-fringed island paradises or snow-coated Alpine micro-
states when corporate financial secrecy is discussed.
Table 4: The Extractive Industries Subsidiaries Favourite Secrecy Jurisdictions
Delaware 915
Netherlands 358
Bermuda 127
British Virgin Islands 67
Singapore 59
Bahamas 54
Malaysia 54
Switzerland 51
Cayman Islands 49
Luxembourg 48
Hong Kong 40
Ireland 37
Belgium 35
Austria 25
Philippines 23
Barbados 19
Jersey 18
United Arab Emirates 15
Liberia 13
Panama 10
Mauritius 10
Isle of Man 8
Guernsey 6
Cyprus 6
Nevada 5
Hungary 5
Brunei Darussalam 4
Uruguay 3
Bahrain 2
Saint Lucia 2
Netherlands Antilles 2
Malta 2
Cook Islands 2
Gibraltar (UK) 2
Saint Kitts and Nevis 1
Wyoming 1
Marshall Islands 1
Antigua and Barbuda 1
Lebanon 1
Costa Rica 1
Anguilla 1
22 PIPING PROFITSPART 3: INSIDE THE SECRET MONEY MAZE
But the Netherlands, the country where the world’s first multinational was formed – The
Dutch East India Company – offers advantages for companies that want or need to place
a veil of mystery over their affairs.
The Netherlands:
1) does not put details of trusts on public record;
2) does not comply sufficiently with international regulatory requirements;
3) does not require that company accounts be available on public record;34
4) does not require that beneficial ownership of companies is recorded on public record;
5) does not maintain company ownership details in official records; and
6) does not provide adequate access to banking information.
The Netherlands is also the largest host of conduit companies worldwide and is an
important jurisdiction for corporate internal debt shifting. Studies have revealed how the
use of Dutch financing affiliates affects the capital structure of European multinationals.
As Francis Weyzig, in his comprehensive 2007 paper The Central Role of Dutch Financing
Companies in Tax Avoidance strategies, wrote:
It turns out that many conduit constructions involve affiliates in the Netherlands.
These affiliates are officially registered by the Dutch Central Bank (DNB) as Special
Financial Institutions (SFIs). According to the DNB definition, SFIs are foreign owned
and are used at least partly for fiscal reasons. The SFI register is not public. The
volume of investments using SFI structures is enormous: 13% of all inward FDI stocks
worldwide is held via some 10,000 Dutch SFIs (Weyzig & Van Dijk 2007). This makes the
Netherlands the largest conduit country worldwide.
Among the 358 Netherlands subsidiaries belonging to the world’s most powerful
Extractive Industry companies are subsidiaries whose names suggest their physical assets
are held in a country which is not the Netherlands.
ConocoPhillips
Conoco Pakistan Exploration & Production B.V.
Conoco Taiwan Exploration & Production B.V.
Conoco Trinidad (4a) B.V.
Conoco Trinidad (4b) B.V.
Conoco Venezuela B.V.
BP
BP Pipelines Vietnam B.V.
BP Trinidad Exploration B.V.
Korea Energy Investment Holdings B.V.
Amoco Chemical Malaysia Holding I B.V.
Baku-Tbilisi-Ceyhan Pipeline Holding B.V.
Amoco Chemical Malaysia Holding B.V.
Amoco Chemical Malaysia Holding B.V.
34 Although the annual accounts of most Dutch companies are available online, there is an important exception to this rule. In the
second book of the Dutch Civil Code, disclosure requirements are specified in part 10 and onwards, from article 394 onwards.
Generally, the amount of detail of the financial information depends on the size of the company. The exception clause is in article
403 which says roughly that a company does not need to publish its accounts if: a) the financial figures of the legal entity are
consolidated into the accounts of another legal entity (the ultimate parent or some intermediate holding) to which the EU require-
ments regarding financial reporting apply (that is, the consolidating company is located in the EU); b) those consolidated accounts
are published in or translated into Dutch, English, French or German; c) the consolidating entity has declared full liability for any
debts of the Dutch legal entity; d) the declaration of liability and the accounts of the consolidating entity or a reference to those
accounts have been deposited with the chamber of commerce where the Dutch legal entity is registered (Art. 403, second book
Dutch Civil Code). In practice this allows multinational companies to hide accounts of Dutch subsidiaries from view. As regards
online information, the address and type of business is freely available for most entities. Other information is available for a fee
ranging from €0,50 to €2,90.
PIPING PROFITS 23You can also read