Plastics - the Facts 2016 - An analysis of European plastics production, demand and waste data - Plastics Europe

Page created by Gabriel Frank
 
CONTINUE READING
Plastics - the Facts 2016 - An analysis of European plastics production, demand and waste data - Plastics Europe
Plastics – the Facts 2016
An analysis of European plastics
production, demand and waste data
Plastics - the Facts 2016 - An analysis of European plastics production, demand and waste data - Plastics Europe
Plastics – the Facts is an analysis of the data related to the production,
demand and waste management of plastic materials. It provides the
latest business information on production and demand, trade, recovery
as well as employment and turnover in the plastics industry. In short,
this report gives an insight into the industry’s contribution to European
economic growth and prosperity throughout the life cycle of the material.
The data presented in this report was collected by PlasticsEurope (the Association of Plastics Manufacturers in Europe)
and EPRO (the European Association of Plastics Recycling and Recovery Organisations). PlasticsEurope’s Market
Research and Statistics Group (PEMRG) provided input on the production of and demand for plastics raw materials.
Consultic Marketing & Industrieberatung GmbH helped assess waste generation and recovery data. Official statistics
from European or national authorities and waste management organisations have been used for recovery and trade data,
where available. Research or expertise from consultants completed gaps.

Figures cannot always be directly compared with those of previous years due to changes in estimates. Some estimates
from previous years have been revised in order to track progress, e.g. for use and recovery of plastics across Europe over
the past decade.

All figures and graphs in this report show data for EU-28 plus Norway and Switzerland, which is referred to as Europe for
the purposes of abbreviation – other country groups are explicitly listed.

                                                                                                                             3
Plastics - the Facts 2016 - An analysis of European plastics production, demand and waste data - Plastics Europe
Plastics: an efficient use of resources
    Plastics are a wide family of resource efficient materials derived from organic products such as cellulose, coal, natural
    gas, salt and, of course, crude oil.
    The new members of this wide family are “bio-plastics” – this term actually describes two different concepts:
    • Biodegradable plastics: which are materials that are degraded by microorganisms into water, carbon dioxide (or
      methane) and biomass under specified conditions, and can be made from organic and/or fossil resources.
    • Bio-based plastics: which are materials made from biological and renewable resources such as grains, corn,
      potatoes, beet sugar, sugar cane or vegetable oils.
    It is important to stress that at European level only 4 to 6% of the oil and gas is used to produce plastic materials.

                                              45%
                                                                                5%
                                        Transportation
                                                                               Others

                                                                                          42%
                                                               8%                       Electricity
                                                           Chemistry                    and heat
                     How oil and gas are                  (plastics 4 to 6%)

                         used in Europe

4
Plastics - the Facts 2016 - An analysis of European plastics production, demand and waste data - Plastics Europe
Plastics: for a more sustainable world
Plastic materials are extremely resource efficient not only in their production phase but also during their use phase.
This is highly important, since the rule of thumb says that a product - a house, a car, an electronic device - is
consuming most of the energy during the use phase. That makes it even more important to optimise the use phase.
In some applications like insulation, during their service life, plastic materials save more than 140 times the energy
needed for their production. They are also champion when it comes to protecting goods & food, thereby reducing
breakage and waste.
Because of the unique properties of plastic materials, they are used in a wide range of application sectors, such as
packaging, building and construction, automotive and aeronautics, electrical and electronic equipment, agriculture,
leisure and sports equipment or medical and health products, to help us to live and build a more sustainable world.

Did you know that 80% of a product’s energy consumption accounts for the use phase?
Products energy consumption

                                                                           ca   20%
                                                                           production

                              ca   80%                                     and manufacturing phase

                                   use phase

                                               Plastic materials are
                    functional                        aesthetical                           sustainable
                                                                                                                         5
Plastics - the Facts 2016 - An analysis of European plastics production, demand and waste data - Plastics Europe
PLASTICS
contribution to european society
          and economy
Plastics - the Facts 2016 - An analysis of European plastics production, demand and waste data - Plastics Europe
Key figures of the European plastics industry
    The European plastics industry includes plastics raw materials producers, plastics
    converters and plastics machinery manufacturers in the EU28 Member States.

                over         The plastics industry gives direct
     1.5 million             employment to over 1.5 million                                Jobs
                             people in Europe

           close to
       60,000                An industry in which close to 60,000
                                                                                      Companies
    companies                companies operate, most of them SME’s

                over         The European plastics industry had a
    340 billion              turnover of more than 340 billion euros                    Turnover
         euros               in 2015

                over         The European plastics industry had a
    16.5 billion             trade balance of over 16.5 billion euros
                                                                                          Trade
          euros              in 2015*                                                   balance

     * Data including only plastics raw materials producers and plastics converters
8
Plastics - the Facts 2016 - An analysis of European plastics production, demand and waste data - Plastics Europe
The European plastics industry               close to
Contribution to                 contributed close to 27.5 billion euros to   27.5 billion
public finances                 public finances and welfare in 2015          euros

                                                                             x2.4 in GDP
Multiplier                      The European plastics industry has a
                                multiplier effect of 2.4 in GDP and almost   and almost
effect                          3 in jobs*                                   x3 in jobs

                                The European plastics industry ranks 7th
Industrial                      in Europe** in industrial value added        7th in
                                contribution. At the same level as the       Europe
value added                     pharmaceutical industry.

                                                                             over
                                In 2014, more than 7.5 tonnes of plastics    7.5 million
Recycling                       waste were collected for recycling
                                                                             tonnes

 * The European House Ambrosetti study, data for Italy, 2013
** Measured by gross value added at factor prices, 2012                                     9
Plastics - the Facts 2016 - An analysis of European plastics production, demand and waste data - Plastics Europe
PLASTICS
  market data
World and EU plastics production data
                                                                                                             322
                                                                                                       311
                                                                                               299
                                                                                       288
     Includes plastic materials (thermoplastics and                           279
     polyurethanes) and other plastics (thermosets,                     257
     adhesives, coatings and sealants). Does not include
     the following fibers: PET-, PA-, PP- and polyacryl-fibers.   230
     Source: PlasticsEurope (PEMRG) / Consultic

          WORLD
                                                                  2005 2007 2011 2012 2013 2014 2015

      EUROPE         (EU28+NO/CH)
                                                                   61         59       59       57     59    58
                                                                        65
12                                                                                 in million tonnes
Distribution of global plastic materials production
China is the largest producer of plastic materials* (only thermoplastics and polyurethanes), followed by Europe and NAFTA.
World production of plastic materials in 2015: 269 million tonnes.
Source: PlasticsEurope (PEMRG) / Consultic

                                                                         2,6%
                                                       18,5%                     CIS
          18,5%
                    NAFTA                                      EUROPE                                 4,3%
                                                                                         27,8%
                                                                                                                JAPAN
                                                                    7,3%
                                                                                             CHINA

                                                                                       16,7%
                                                                          MIDDLE
                                                                        EAST, AFRICA
                            4,4%                                                       REST
                                                                                       OF ASIA
                                     LATIN
                                    AMERICA

* Plastic materials: only thermoplastics and polyurethanes
                                                                                                                         13
Trade balance
     A positive trade balance of more than 16.5 billion euros in 2015.

                                                  Plastics manufacturing extra EU-28
                                                     bn€
                                                      30

                                                      25

                                                      20

                                                      15

                                                      10

                                                       5

                                                       0
                                                           2005   2006    2007    2008     2009    2010     2011   2012   2013    2014   2015

                                                             Extra-EU trade balance      Extra-EU exports      Extra-EU imports

                                                  Plastics processing extra EU-28
                                                     bn€
                                                      14

                                                      12

                                                      10

                                                       8

                                                       6

                                                       4

                                                       2

                                                       0
                                                           2005   2006    2007    2008     2009    2010     2011   2012   2013    2014   2015

     Source: Eurostat                                        Extra-EU trade balance      Extra-EU exports      Extra-EU imports
14
Top extra EU trade partners in value

              2015 Exports extra EU-28                                 2015 Imports extra EU-28

                    Plastics Plastics                                        Plastics Plastics
               manufacturing processing                                 manufacturing processing

   Turkey              13.3 %   14.8 %              USA    USA                     25.4 %      23.8 %                   USA

    China              12.6 %   10.7 %       Switzerland     Saudi Arabia          12.9%       14.3 %           China

        USA            11.7 %   9.5 %       China                South Korea       12.4%       14.2 %           Switzerland

            Russia     6.6 %    8.4 %      Russia                    Switzerland       6.6 %   11.1 %       Turkey

         Switzerland     6%     6%       Turkey                                Japan     6%    5.3 %    Japan

Source: Eurostat
                                                                                                                              15
Plastic materials EU demand per country
     European plastic demand includes plastic materials (thermoplastics and polyurethanes) and other plastics (thermosets,
     adhesives, coatings and sealants). Does not include the following fibers: PET-, PA-, PP- and polyacryl-fibers.
     Source: PlasticsEurope (PEMRG) / Consultic / myCeppi

           mt
                                                                                                                                                                                                       2015 plastics demand
         12                                                                                                                                                                                                  in Europe

         10                                                                                                                                                                                                      49 m t
                                                                                                                                                                         70% of the demand is concentrated in six countries
         8

          6
                                                                                                                              24.6%                                                 14.3% 9.6%                                                        7.7%                       7.5%                     6.3%
          4                                                                                                                            GERMANY                                          ITALY                              FRANCE                     SPAIN                          UK                  POLAND

          2

          0
                          Italy
                Germany

                                                                                                                                                                                                                                      Bulgaria
                                                                                                                                                                          Hungary
                                                                             Belgium & Lux.
                                                                                              Netherlands

                                                                                                                                                                                                                                                           Norway
                                                                                                                                                           Switzerland
                                                   United Kingdom

                                                                                                                                                                                                                           Slovakia
                                                                                                                                                Portugal
                                  France

                                                                                                                             Austria

                                                                                                                                                                                                                                                                                                     Latvia
                                                                                                                                                                                                                                                 Ireland

                                                                                                                                                                                                                                                                               Croatia
                                                                                                                                                                                    Romania

                                                                                                                                                                                                                                                                                                              Estonia
                                                                                                                                                                                                                                                                                                                        Cyprus & Malta
                                                                                                                                                                                                                                                                    Slovenia

                                                                                                                                                                                                                                                                                         Lithuania
                                                                                                                                                                                              Greece
                                                                                                            Czech Republic

                                                                                                                                       Sweden
                                           Spain

                                                                                                                                                                                                       Finland
                                                                    Poland

                                                                                                                                                                                                                 Denmark

                     2013                  2014                       2015
16
Plastic materials demand main market sectors
Distribution of European (EU-28+NO/CH ) plastics demand by segment in 2015.
Source: PlasticsEurope (PEMRG) / Consultic / myCeppi

                                                                              PACKAGING
         Total demand                                                         39.9%
            49 m t                                          BUILDING &
                                                           CONSTRUCTION
                                                                                             OTHERS

                                                               19.7%                         22.4%
                        ELECTRICAL &          AUTOMOTIVE                                     Consumer
                         ELECTRONIC                                                        and household
 AGRICULTURE
                           5.8%                  8.9%                                     goods, furniture,
     3.3%                                                                                   sport, health
                                                                                           and safety, etc.

                                                                                                              17
Plastic materials EU demand per polymer
     European plastics demand includes plastic materials (thermoplastics and polyurethanes) and other plastics (thermosets,
     adhesives, coatings and sealants). Does not include the following fibers: PET-, PA-, PP- and polyacryl-fibers.
     Source: PlasticsEurope (PEMRG) / Consultic / myCeppi

      mt

                                                                                                    49 million                           2015 European
      10

      9                                                                                                tonnes                            plastics demand
      8

      7

      6

      5

      4

      3

      2

      1

      0                                                                                                                                    2013   2014   2015
           PP

                  PE-LD, PE-LLD

                                  PE-HD, PE-MD

                                                 PVC

                                                       PUR

                                                             PET

                                                                   PS

                                                                        PS-E

                                                                               ABS, SAN

                                                                                               PC

                                                                                                            Other ETP

                                                                                                                        Other plastics
                                                                                          PA

                                                                                                     PMMA

18
Plastic materials main fields of applications
European plastics demand (EU-28+NO/CH) by polymer type 2015.
Source: PlasticsEurope (PEMRG) / Consultic / myCeppi
                                                                                                                             OTHERS
                                                                                                                PP
                                                                                           PE-LD,
                                                                                           PE-LLD
                                                                                                                            19.9%
                                                                                                            19.1%
                                                                        PE-HD,            17.3%                                Hub caps
                                                                                                                            (ABS); optical
                                                                                                                             fibres (PBT);
                                                                        PE-MD                                                 eyeglasses
                                                        PVC                                                                lenses, roofing
                                                                       12.1%                                                 sheets (PC);
     PS
    PS-E
                       PET             PUR             10.1%                                                    Food
                                                                                                                            Touch screens
                                                                                                                           (PMMA); cable
                                                                                                             packaging,        coating in

  6.9%              7.1%             7.5%               Window
                                                                                                                sweet
                                                                                                             and snack
                                                                                                                            telecommuni-
                                                                                                                           cations (PTFE);
                                                        frames,                                               wrappers,        and many
  Eyeglasses                                        profiles, floor                                         hinged caps,   others in aeros-
frames, plastic                        Building         and wall         Toys, (PE-        Reusable          microwave      pace, medical
   cups, egg                         insulation,       covering,       HD, PE-MD),      bags, trays and        -proof       implants, sur-
   trays (PS);                      pillows and      pipes, cable      milk bottles,      containers,        containers,    gical devices,
  packaging,        Bottles for     mattresses,       insulation,        shampoo        agricultural film      pipes,        membranes,
    building        water, soft       insulating    garden hoses,     bottles, pipes,    (PE-LD), food       automotive    valves & seals,
   insulation     drinks, juices,     foams for        inflatable       houseware       packaging film       parts, bank       protective
  (PS-E), etc.    cleaners, etc.    fridges, etc.     pools, etc.      (PE-HD), etc.     (PE-LLD), etc.      notes, etc.    coatings, etc.

                                                                                                                                              19
Plastics demand by polymer and market segment
     European plastics demand (EU-28+NO/CH) by polymer type 2015.
     Source: PlasticsEurope (PEMRG) / Consultic / myCeppi

       Packaging                                                                                                             39.9%

       Building &                                                                                                            19.7%
     Construction

      Automotive                                                                                                             8.9%

      Electrical &                                                                                                           5.8%
       Electronic

          Others                                                                                                             25.7%
                              LD

                                        D

                                                                                      A
                                                                      T

                                                                                                             R
                                                         -E
                                             PP

                                                                                                    ET er
                                                                                N
                                                  PS

                                                                                                                     tic r
                                                                C

                                                                                          PA

                                                                                               PC

                                                                                                                   as e
                                                                    PE
                                       M

                                                                                     M

                                                                                                            PU
                                                              PV

                                                                             SA
                                                       PS
                               L

                                                                                                        h

                                                                                                                 pl Oth
                                                                                                      P
                                         -
                            E-

                                                                                    PM

                                                                                                     Ot

                                                                                                                        s
                                      PE

                                                                          S,
                          P

                                                                      AB
                                   D,
                       D,

                                -H
                       -L
                     PE

                              PE

20
What is plastic?
Plastics is not one single material. The plastics’ family is composed of a great variety of materials designed to meet the very
different needs of thousands of end products. As products evolve, so do plastic materials, so many of them are still to come.

Most common materials

                      Polyethylene                           Polyvinyl-
                          (PE)        Polypropylene
                                                              chloride          Polystyrene      Polyethylene
                                           (PP)                                                                         Expanded
                                                               (PVC)                (PS)         Terephthalate         polystyrene
                                                                                                     (PET)                              ABS
                                                                                                                          (PS-E)
                                                                       Poly
        Thermoplastics          SAN           Polycarbonate           methyl
                                                   (PC)             methacrylate         Polyamides
                                                                     (PMMA)                  (PA)       Fluoropolymers          PEEK

                                       POM                    PBT              Polyaryl-       Thermoplastic
                                                                               sulfone
                                                                                (PSU)
                                                                                                elastomers
                                                                                                   (TPE)
                                                                                                                       Etc.
                                                                                                                                         PLASTICS
                                                                                                                                          SHAPE
                                                       Polyester          Epoxy resins        Vinyl ester          Silicone             THE FUTURE
         Thermosets           Polyurethane
                                  (PUR)

                                                                                       Phenol-              Melamine             Etc.
                                                                   Urea-
                                             Acrylic                                formaldeyhde             resin
                         Phenolic                              formaldeyhde
                          resins             resins

                                                                                                                                                     21
PLASTICS
   not waste
  but resource
Plastics waste treatment in EU28+2
     In 2014, 25.8 million tonnes of post-consumer plastics waste ended up in the official waste streams. 69.2% was recovered
     through recycling and energy recovery processes while 30.8% still went to landfill.
     Within the different plastic applications, plastic packaging reached the highest recycling rate with 39.5%* and represented more
     than 80% of the total recycled quantities.
     Source: Consultic

                   Recycling          29.7%                   Energy recovery 39.5%                 Landfill         30.8%

     2006-2014 waste treatment evolution:

                                                                                                    + 64 %            Recycling
          12.9
                                                                               10.2
                                                                               8.0
                                                                                                    + 46 %            Energy
                                                                                7.7                                   recovery
          7.0

           4.7
                                                                                                     - 38 %           Landfill

     The annual average of post-consumer plastics waste generation from 2006 to 2014 is 25 million tonnes
     *Based on in-put quantities into recycling facilities.
24
Plastics waste treatment by country in 2014
In 2014, landfilling was still the 1st option in many EU countries. In general, countries with landfill ban achieve higher
recycling rates.
Source: Consultic
                                       Sw
                                            itz
                                                er                         Plastics waste going to landfill (2014)
                                  Ne        Au land
                                       the st
                                          rl ria                                        Date of landfill ban in force
                                    Ge and
                                        rm       s
                                           a
                          Lux Swed ny
                                em        en
                                    b                                           > 50%
                            Den ourg
                                  ma
                           Bel         rk                                       10% - 50%
                                 giu                                                                                                                           2016
                          Nor m
                                 way                                            < 10%
                         Irela                                                                                                          2009   2005
                                 n
                        Finla d
                                nd
                       Eston
                                ia
                    Sloven
                               ia
                      France
                   Portugal                                                                                             1999 +     1997
                                                                                                                         2006
                        Italy
           United Kingdom
                                                                                                                                 1996                   2016
                  Slovakia
                                                                                                                                        2005
            Czech Republic
                 Lithuania
                      Spain                                                                                                                      2004
                     Poland                                                                                                         2006
                    Hungary
                               ia
                    Roman
                        Latvia
                                 ia
                        Croat
                          u l g aria
                        B
                                   ce
                           Gree s
                                 p ru
                              Cy
                                      lta
                                  Ma

              Recycling rate             Energy recovery rate   Landfill rate
                                                                                                                                                                      25
Plastics: key resource for circular economy
     Recycling is the preferred option for plastics waste. However, when recycling is not the most sustainable option,
     energy recovery is the alternative. Both options complement each other and exploit the full potential of plastics waste.

                                      RECYCLING                                       ENERGY RECOVERY
                                     is the preferred                                   is needed to stop the
                                          option                                         landfilling of plastics
      ...out of which                                                                                                           The energy value
          new plastic                                                                                                           of plastics is used
            products                                                                                                            to produce
            are made                                                                                                            electricity, heating
                            Plastics are sorted and crushed                        Those plastics which cannot be sustainably
                                                                                                                                and cooling
                                 into “flakes”, washed,                                 recycled can be used in efficient
                                                                                                                                for millions of homes
                               dried and sorted again...                                    Waste-to-Energy facilities
                                                                                         to produce electricity and heat

                                                                                                                                      Alternatively
                                                                                                                                      plastics are used
                                                                                                                                      as fuel
                                                                                                                                      for industrial
                                                                                                                                      processes,
                                                                                                                                      replacing
                                                                                                                                      fossil fuel

                                                                                                                                Emissions
                                                                                                                                are subject
          ...processed                                                                                                          to strict regulations
       into granulates                                                                                                          and control standards

26
Plastic materials have several lives

            Clothes & Footwear

                                                          Agriculture

       Outdoor elements

                                                         Bags & Complements

              Furniture & Design

                                                                        Packaging
       Automotive

                                                         Building & Construction

                                   Plastics recyclates
                                       are used to
                                      manufacture
                                     a wide variety
                                   of new products

                                                                                    27
Plastics: proper waste management is key to avoid Marine Litter

     Thanks to their unique properties, plastic materials are essential in many applications and often make the impossible
     possible. However, to take full advantage of the benefits of plastics, its products need to be properly recovered and
     managed when they reach the end of their service life. It is simple, plastics are just too valuable to be wasted or thrown
     away and it is unacceptable that any waste is entering the marine environment!
     Whether deliberately or accidently, when plastics waste is not properly disposed it may end up as litter in the environment,
     the world’s oceans, seas and rivers and harming wild life, fisheries and tourism.
     Marine Litter has become a global challenge and derives from land and sea based human activities, mainly caused by poor
     waste management and infrastructures or people’s behaviour. Thus, prevention at source through the creation of proper
     waste collection and treatment together with improved human behaviour are key to reduce litter inputs, to protect our on-
     land and water environment and to secure recovery of our resources after disposal.
     In March 2011, the Global Declaration for Solutions on Marine Litter was launched by 47 plastics associations from regions
     across the globe. Recognizing their important role in fighting Marine Litter, these plastics associations have launched
     and are supporting projects in six key areas aimed at contributing to sustainable solutions. These six focus areas are:
     education, research, public policy, sharing best practices, plastics recycling/recovery, and plastic pellet containment.

           Since 2011, 65 associations in 34 countries have signed on to the
                 Global Declaration, and 260 projects are underway,
                                planned or completed.

                                                    Learn more about these project on

                                          www.marinelittersolutions.eu
28
And human behaviour makes the difference
Everyone can contribute. Thus it is crucial to create awareness about Marine Litter and invest in educational projects
to enhance individual responsibility and keep products and waste where they belong.

                        Marine
                        Litter

                                                                                                                         29
PLASTICS
Snapshot
      snapshot
         and outlooks
    and outlook
In 2016, plastics production shows a slight increase,
     but is still below pre-crisis level
     Plastics industry production in EU-28 index (2010=100, trend cycle & seasonally adjusted data).

            Index
      140

      130

      120

      110

      100

       90

       80

       70

                                                                                                                                           year
       60
            1992 1993 1994 1995 1996 1997 1998 1999 2000 2001 2002 2003 2004 2005 2006 2007 2008 2009 2010 2011 2012 2013 2014 2015 2016

                    Plastics in Primary Forms     Plastics Machinery          Manufacture of Plastics Products
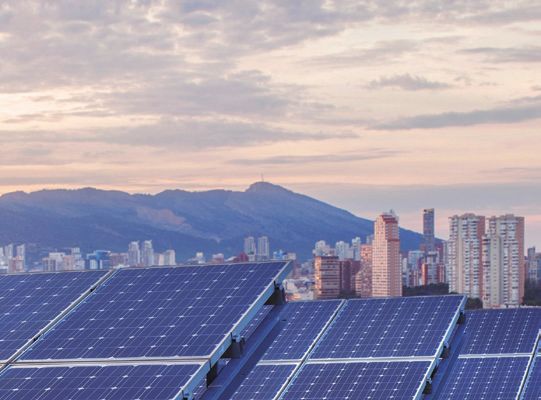
32
In 2017, plastics production is expected to continue
on a positive trend
Production of plastics in primary forms, EU28.
Index 2010 = 100 on a quarterly basis; seasonally and working day adjusted; annual average.
      Index
130

120

110
                                                                                                          The production of plastics
                                                                                                          in primary forms has been
100
                                                                                                          stable in the past years.
 90
                                                                                                          Short-term estimates show a
 80                                                                                                       moderate upward trend:
                                                                                                          Estimate 2016: +1.5%
 70                                                                                                       Estimate 2017: +1.5%

 60

 50                                                                                                year
      2007 2008 2009 2010                   2011   2012   2013   2014      2015   2016   2017

              Production primary plastics           Average annual index           Average annual index estimates

                                                                                                                                        33
Glossary of terms
ABS         Acrylonitrile butadiene styrene resin   PE-HD       Polyethylene, high density
ASA         Acrylonitrile styrene acrylate resin    PE-LD       Polyethylene, low density
bn          billion                                 PE-LLD      Polyethylene, linear low density
CH          Switzerland                             PE-MD       Polyethylene, medium density
CIS         Commonwealth of Independent States      PEMRG       PlasticsEurope Market Research Group
Consultic   Consultic Marketing &                   PET         Polyethylene terephthalate
            Industrieberatung GmbH                  Plastic
EU          European Union                          materials   Thermoplastics + Polyurethanes
EPRO        European Association of Plastics        PMMA        Polymethyl methacrylate
            Recycling and Recovery Organisations    POM         Polyoxymethylene
ETP         Engineering Thermoplastics              PP          Polypropylene
GDP         Gross domestic product                  PS          Polystyrene
mt          Million tonnes                          PS-E        Polystyrene, expandable
my Ceppy    my Ceppy Kft                            PTFE        Polytetrafluoroethylene
NAFTA       North American Free Trade Agreement     PUR         Polyurethane
NO          Norway                                  PVC         Polyvinyl chloride
Other                                               SAN         Styrene-acrylonitrile copolymer
plastics    Thermosets, adhesives, coatings         Thermo-
            and sealants                            plastics    Standard plastics (PE, PP, PVC, PS, EPS, PET
PA          Polyamides                                          (bottle grade)) + Engineering plastics (ABS,
PBT         Polybutylene terephthalate                          SAN, PA, PC, PBT, POM, PMMA, Blends, and
                                                                others including High Performance Polymers)
PC          Polycarbonate
                                                    Thermosets Urea-formaldehyde foam, melamine resin,
PE          Polyethylene
                                                               polyester resins, epoxy resins, etc.
PEEK        Polyetheretherketone
                                                                                                               35
PlasticsEurope is the association of plastics                   EPRO is the association of national
manufacturers and one of the leading European         organisations responsible for organising and
trade associations with centres in Brussels,           promoting plastics recycling and recovery in
Frankfurt, London, Madrid, Milan and Paris. It is        Europe. EPRO provides a unique forum for
networking with European and national plastics      leading European specialists in plastics waste
associations and have more than 100 member               management to exchange experience and
companies, producing over 90% of all polymers         ideas, develop integrated plastics packaging
across the EU28 member states plus Norway,            and agriculture waste strategies and support
Switzerland and Turkey.                                                technological development.

Avenue E. van Nieuwenhuyse 4/3                                                  Konigin Astridlaan 59
1160 Brussels – Belgium                                                     1780 Wemmel – Belgium
Phone +32 (0)2 675 32 97                                                   Phone +32 (0)2 456 84 49
info@plasticseurope.org                                                       Fax +32 (0)2 456 83 39
www.plasticseurope.org                                                info@epro-plasticsrecycling.org
www.plastics-themag.com                                               www.epro-plasticsrecycling.org
   @PlasticsEurope
PlasticsEurope offices
 Central Region                     Mediterranean Region              West Region
 PlasticsEurope Deutschland e.V.    PlasticsEurope Italia             PlasticsEurope France
 Mainzer Landstraße 55              Via Giovanni da Procida 11        Le Diamant A
 60329 Frankfurt am Main. Germany   20149 Milano. Italy               14, rue de la République
 Phone: +49 69 2556 1303            Phone: +39 (0)2 345 65 309        92800 Puteaux. France
                                                                      Mailing address: Le Diamant A
 Iberica Region                     North Region                      92909 Paris - La Défense Cedex. France
 PlasticsEurope España              PlasticsEurope UK                 Phone: +33 1 46 53 10 53
 Hermosilla, 31-1º                  6 Bath Place
 28001 Madrid. Spain                Rivington Street
 Phone: +34 91 431 79 64            London EC2A 3JE. United Kingdom
                                    Phone: +44 20 7457 5000

Other representatives
 Poland                             Austria                           The Netherlands
 PlasticsEurope Polska              PlasticsEurope Austria            PlasticsEurope Nederland
 ul. Trębacka 4 p. 109              Paniglgasse 24/I/19a              P.O. Box 443
 00-074 Warszawa. Poland            1040 Wien. Austria                2260 AK Leidschendam. The Netherlands
 Phone: +48 22 630 99 01            Phone: +43 1 712 72 77            Phone: + 31 70 444 06 10
10-2016
Published on the occasion of the special presentation of K 2016
The special presentation is organised jointly by
Messe Düsseldorf and
PlasticsEurope Deutschland e.V.

© 2016 PlasticsEurope. All rights reserved.
You can also read