Plumpton and Kororoit - Retail and Employment Land Assessment - Prepared for Metropolitan Planning Authority - Retail and Employment Land ...
←
→
Page content transcription
If your browser does not render page correctly, please read the page content below
Plumpton and Kororoit -
Retail and Employment Land
Assessment
Prepared for Metropolitan Planning
Authority

March 2015
Plumpton and Kororoit Retail and Employment Land Assessment

                         CONTENTS
                         1    Introduction ................................................................................... 5
                              Project Context .............................................................................. 5
                              Purpose ......................................................................................... 5
                              Study Area ..................................................................................... 6
                              Report Structure ............................................................................ 7
                         2    Existing Information Review .......................................................... 8
                              Introduction ................................................................................... 8
                              Policy and Research ....................................................................... 8
                              Summary ...................................................................................... 19
                         3    Economic and Social Context Review .......................................... 20
                              Introduction ................................................................................. 20
                              Demographic Overview ............................................................... 20
                              Economic Overview ..................................................................... 21
                              Summary ...................................................................................... 23
                         4    Business and Industrial Market Analysis and Projections ........... 24
                              Introduction ................................................................................. 24
                              Land Supply and Conditions ........................................................ 24
                              Industrial Investment Trends....................................................... 28
                              Property Sales and Leasing Activity ............................................. 29
                              Projections of Future Demand..................................................... 33
                              Employment Estimate ................................................................. 34
                              Design Considerations ................................................................. 36
                              Summary ...................................................................................... 37
                         5    Retail and Activity Centre Analysis .............................................. 39
                              Introduction ................................................................................. 39
                              Plumpton Major Town Centre (MTC) .......................................... 39
                              Activity Centre Uses on Business and Industrial Land ................. 48
                              Local Town Centre (LTC) Areas .................................................... 51
                              Summary ...................................................................................... 59
                         6    Findings and Recommendations ................................................. 61
                              Overall Framework ...................................................................... 61
                              Business and Industrial Land ....................................................... 62
                              Plumpton Major Town Centre and Interface Area ...................... 62

Ref: M15030                                                                                                                     HillPDA Page 2 | 65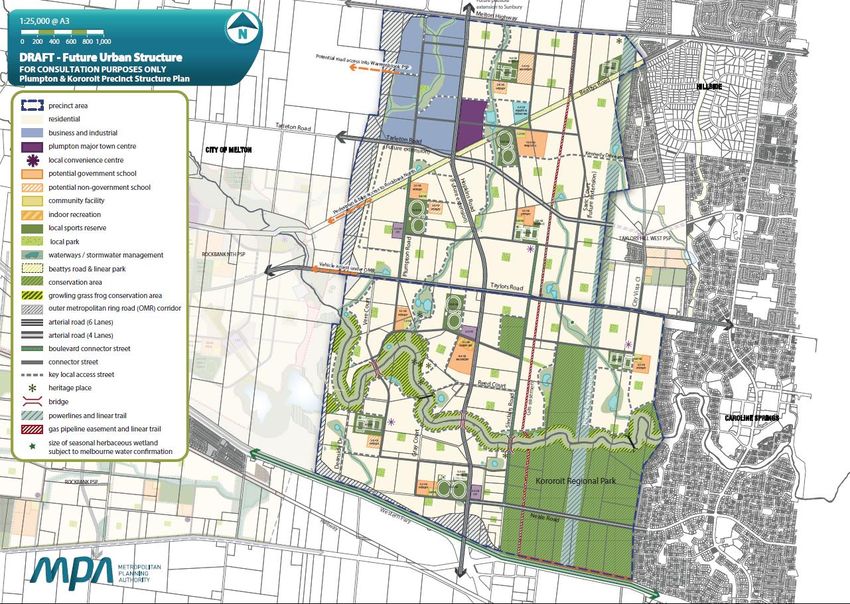
Plumpton and Kororoit Retail and Employment Land Assessment

                              Local Town Centres...................................................................... 63

Ref: M15030                                                                                                             HillPDA Page 3 | 65
Plumpton and Kororoit Retail and Employment Land Assessment

Ref: M15030                                                   HillPDA Page 4 | 65
Plumpton and Kororoit Retail and Employment Land Assessment
1 INTRODUCTION
Project Context
This report provides a Retail and Employment Land Assessment
(RELA) for the Plumpton and Kororoit Precinct Structure Plan (PSP).
The study area is expected to accommodate approximately 50,000
people over the next 20 to 30 years.
A significant amount of work has been undertaken to define the
structure of the area including the economic land use structure,
defined by business and industrial land and an activity centre
network. The base information that informed the structure includes
the West Growth Corridor Plan (2012), Planning for Employment and
Industry in Melbourne’s Growth Areas (2011) and the Melton Retail
and Activity Centres Strategy (2014) as well as a number of
background reports on local land issues.
Based on consultation with stakeholders, a draft Future Urban
Structure (FUS) has been developed by the MPA in conjunction with
Melton City Council for the study area. The FUS (November 2014
draft for consultation) identifies:
An area of Business and Industrial Land (formerly identified as
Industrial within the West Growth Corridor Plan);
A Major Town Centre (as per the concept in the West Growth
Corridor Plan with updated location based on catchment
analysis); and
The size and location of Local Town Centres (as per the Melton
Retail and Activity Centres Strategy).
The FUS preparation process has raised questions regarding the
demand for, and likely take-up of, the business and industrial land in
the north-west of the Plumpton PSP area. Furthermore, additional
detail regarding activity centres has been requested. This report was
commissioned to respond to these topics.
Purpose
The purpose of this report, as specified in the project brief, is as
follows:
“The key output for this project is a report which forecasts demand
for commercial (retail, office and other uses) and industrial land, and
associated employment numbers in the Plumpton and Kororoit PSP
areas, within the context of the West Growth Corridor Plan (2012),
Ref: M15030 HillPDA Page 5 | 65
Plumpton and Kororoit Retail and Employment Land Assessment
Melton Employment Land Supply Review (2013) and the Melton Retail
and Activity Centres Strategy (2014).”
A focus of the project is to:
“… provide further directions and recommendations for non-retail
employment that can be accommodated within the two precincts.
The future employment uses within the Plumpton business and
industrial precinct are to be a focus of the work, accompanied by an
estimate of the timeframes for its development.”
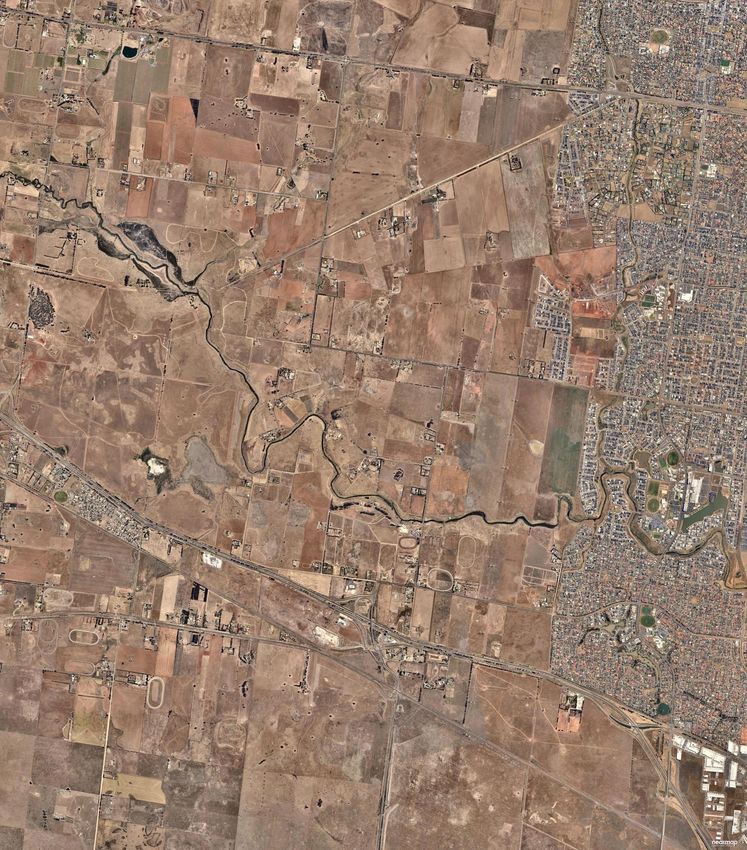
Study Area
The study area is shown in Figure 1 below. It is defined by a natural
catchment that includes the Outer Metropolitan Ring Road (OMR)
reservation to the west, Melton Highway and the approved Taylors
Hill West PSP to the north, Caroline Springs to the east and Western
Freeway to the south.
Plumpton (PSP 1078):
1,015 hectares (ha) of land.
109.2 hectares identified as a business and industrial precinct.
Projected yield of approximately 10,494 lots and 29,382 people.
Kororoit (PSP 1080):
1,181 hectares of land (including proposed Regional Park).
Projected yield of 8,811 lots and 24,670 people.
Ref: M15030 HillPDA Page 6 | 65
Plumpton and Kororoit Retail and Employment Land Assessment
Figure 1 - Study Area: Kororoit and Plumpton Draft Future Urban Structure
(November 2014 Draft for Consultation)
Source: Metropolitan Planning Authority (2014)
Report Structure
This report is structured as follows.
Section 2 - Existing Information Review;
Section 3 - Economic and Social Context Review;
Section 4 - Business and Industrial Market Analysis and
Projections;
Section 5 - Retail and Activity Centre Analysis; and
Section 6 - Findings and Recommendations.
Ref: M15030 HillPDA Page 7 | 65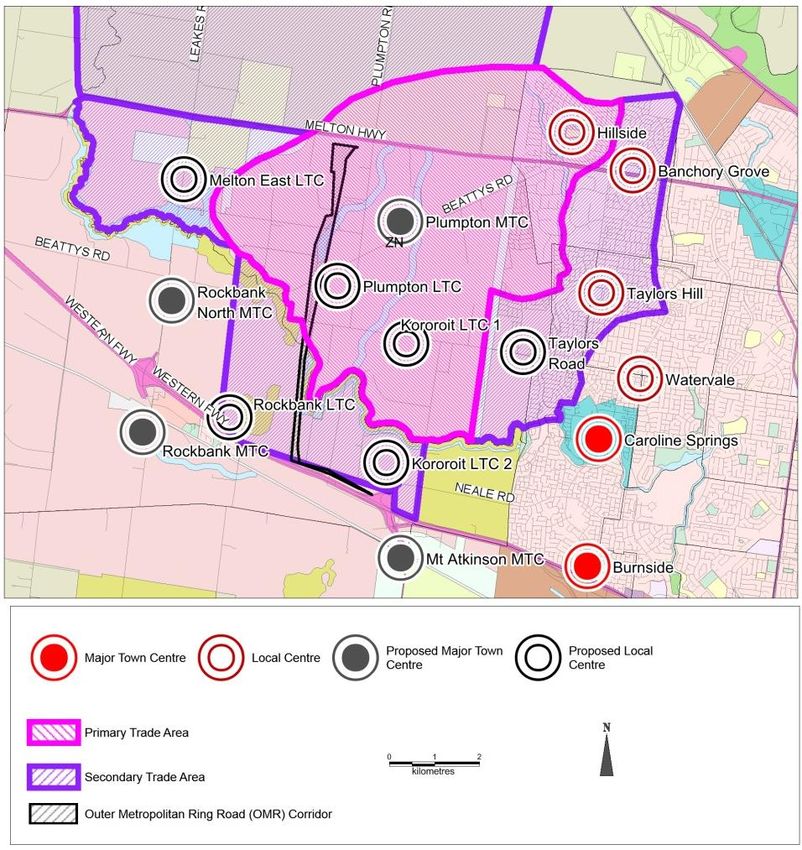
Plumpton and Kororoit Retail and Employment Land Assessment
2 EXISTING INFORMATION REVIEW
Introduction
This section of the report provides a summary of the existing
information base in relation to currency of information and
alignment with property market and economic metrics.
The information that is reviewed is:
West Growth Corridor Plan (2011);
Research inputs that informed the Growth Corridor Planning
process:
– Industrial Land in Melbourne: An analysis of the use, zone,
distribution and consumption of industrial land (2010);
– Study into the take-up of industrial land and future land
requirements in Melbourne (2010);
– Activity Centre and Employment Planning (2011);
– Planning For Employment and Industry in Melbourne’s
Growth Areas (2011);
Melton Retail and Activity Centres Strategy (2014);
Draft Mt Atkinson and Tarneit Plains: Commercial and Industrial
Land Review (2014); and
Melbourne West Growth Corridor Plan – Employment Land and
Activity Centre - Assessment of Plumpton (2013 with 2015
update).
Policy and Research
West Growth Corridor Plan (Growth Areas Authority, 2011)
The West Growth Corridor Plan states that the region is planned to
grow significantly and diversify economically over time in response to
the challenge in generating employment to keep pace with the
growing regional population. The plan proposes that the West
Growth Corridor will achieve greater local job self-containment over
time.
The region will continue to play a vital role in industrial, freight and
logistics activity and diversify its economy with new industrial areas,
business areas and activity centres contributing to growth and
diversification.
Ref: M15030 HillPDA Page 8 | 65
Plumpton and Kororoit Retail and Employment Land Assessment
Growth will be supported by new and improved infrastructure
networks including freeways (proposed Outer Metropolitan Ring
Road), rail services (Melton rail corridor and Regional Rail Link) and
freight facilities and connections to the Port of Melbourne and other
freight hubs.
The study area (of Plumpton and Kororoit) is nominated to
accommodate a Major Town Centre and a new industrial precinct
(part of which is within the study area).
Major land use features in the area around the study area are:
Principal Town Centres at Sydenham, Sunshine and Toolern;
Major Town Centres at Caroline Springs and Rockbank North;
The Western Industrial Node (which is noted for a 1,510 ha
extension);
Hopkins Road Business Precinct (which is located south of Melton
highway and was nominally planned to accommodate 400 ha
mixed use business such as office parks, research and
development, 120 ha of industrial land and 65 ha of commercial
uses) - this mix is subject to review and refinement via the more
detailed Precinct Structure Planning process; and
Toolern Employment Precinct (470 ha of industrial land and 120
ha of mixed use employment land).
The employment features of the West Growth Corridor Plan are
shown in the figure below.
Figure 2 - West Growth Corridor Plan Employment Concept
Source: Growth Areas Authority 2011
Ref: M15030 HillPDA Page 9 | 65
Plumpton and Kororoit Retail and Employment Land Assessment

                         The land use provisions nominated in the Growth Corridor Plan were
                         in part based on economic research shown in Planning for
                         Employment and Industry in Melbourne’s Growth Areas (Essential
                         Economics, 2011). That work is based on observed and projected
                         ratios of development capacity and employment, and as such
                         provides a guide to future conditions for the purposes of long term
                         strategic planning.
                         The work does not however provide local area analysis or details on
                         expected development timing and take up rates to inform more
                         detailed development planning.
                         The quantum of land allocated in the West Growth Corridor Plan for
                         employment land uses is significant and may take many decades to
                         be developed and absorbed.
                         In the development period of the West Growth Corridor, residential
                         demand is likely to remain strong and as such pressure to use (and
                         reallocate or rezone) some of the land nominated for employment
                         uses for residential purposes is likely to persist for the long term.
                         Some pressure to reallocate land may be justified and some not.
                         Case by case assessment (using the latest available information) is
                         required to make informed decisions about such proposals in the
                         context of achieving the overarching directions and objectives of the
                         Growth Corridor Plan.

                         Industrial Land in Melbourne: An analysis of the use, zone,
                         distribution and consumption of industrial land (Spatial Economics
                         for the Growth Areas Authority, 2010)

                         This report examines the quantum, location and composition of
                         historic, current and projected demand and supply of industrial land
                         across metropolitan Melbourne. The report was prepared to inform
                         future industrial land requirements within growth areas and specific
                         investigation areas. Selected findings are noted below.
                         Consumption of industrial land averaged 230 ha per annum between
                         2004 and 2009 with key industrial nodes in Melbourne absorbing
                         around 81% of the take up.
                         The primary consumers of industrial land were Wholesale Trade
                         (19%), Manufacturing (17%), Construction (11%) and Transport,
                         Postal & Warehousing (7%).
                         The analysis indicates that there are numerous business types
                         located on industrial zoned land that are not ‘traditional’ industrial

Ref: M15030                                                                                       HillPDA Page 10 | 65
Plumpton and Kororoit Retail and Employment Land Assessment
uses (factories and warehouses), such as retail trade, administrative
services and arts & recreation uses.
The average site area for recently consumed core industrial land
include: Manufacturing – 4,900 sqm; Wholesale Trade – 5,350 sqm;
Transport & Warehousing – 7,315 sqm; and Construction – 3,400
sqm.
The report recommends that:
The lot size distribution within unzoned / future industrial areas
is ‘driven’ by the market at the point of subdivision;
Land zoned for industry should be relatively flat, in diverse
ownership structure and characterised by relatively large ‘parent’
parcels; and
There appears scope to potentially encourage non-core industrial
users such as financial, education, administrative type users that
require relatively large land parcels to locate within business park
type estates near activity centres and public transport.
Study into the take-up of industrial land and future land
requirements in Melbourne (Jones Land LaSalle for the Department
of Innovation, Industry and Regional Development, 2010)
This report examines industrial land supply and demand in the six
growth area municipalities of Melbourne.
At the time of assessment, the report recommended provision of
industrial land stocks to accommodate a 15-year rolling supply of
industrial land to satisfy projected demand between FY2010 and
FY2030.
The report also recommended that the policy of ensuring a
continuous 15-year rolling supply of industrial land be reviewed on
the basis that Melbourne cannot expand indefinitely.
Priority industrial land and related directions are identified as:
Land supply around the Principal Freight Network exclusively for
industrial purposes;
Where possible, land should be preserved exclusively for
industrial purposes to counter demand for other uses (such as
activity centres, office parks, public open space) or the potential
re-zoning of industrial land for higher order uses such as
residential development; and
Ref: M15030 HillPDA Page 11 | 65Plumpton and Kororoit Retail and Employment Land Assessment
Not all future land stock will be suitable for industry therefore a
set of criteria is required to determine the appropriate location
of new industrial areas and quality of industrial land.
This report projects the quantum of demand for industrial land in
Melbourne’s growth areas during a 20-year (2010–2030) study period
based on 2009 Urban Development Program (UDP) conditions and
trends.
Activity Centre and Employment Planning (Essential Economics for
Growth Areas Authority, 2011)
This report provides advice on activity centre and employment
planning in growth areas based on implementation of Melbourne @5
million. The information was intended to inform the preparation of
Growth Corridor Plans to identify the broad pattern of urban
development and infrastructure delivery in the growth areas.
The report adopts a target based approach in relation to employment
self-sufficiency and how a network of activity centres and
employment precincts can help achieve the target.
The targets are summarised as:
An overall target of one new job for each new dwelling to be
created in the growth corridors;
Approximately one-third of jobs to be provided at the local level
(i.e. in local community neighbourhoods);
Approximately 70% of jobs to be located at the sub-regional level
(i.e. within approximately 5km);
A target for 100% employment self-sufficiency at the wider
regional level (i.e. within approximately 10km);
A target for 80-90% of all households to be within 1km of
neighbourhood-level shopping facilities that have a supermarket;
A network of neighbourhood and higher-order centres planned
on the basis of a square mile block (1.6km x 1.6km), and
supported by a grid system of streets to reflect this pattern of
development.
This report does not provide traditional demand and supply analysis
for various land markets (i.e. retail, office and industrial). It is noted
that the findings of the report may need to be refined or adjusted
during more detailed planning to account particular characteristics of
some development precincts.
Ref: M15030 HillPDA Page 12 | 65Plumpton and Kororoit Retail and Employment Land Assessment
Planning for Employment and Industry in Melbourne’s Growth
Areas (Growth Areas Authority, 2011)
This report consolidates the findings of previous research to inform
economic land use planning in the preparation of strategic plans
(Growth Corridor Plans) for growth areas. The report notes that
ensuring an adequate supply of well-located industrial land in the
growth areas will be a key element of maintaining Melbourne’s
competitiveness as Australia’s premier manufacturing and logistics
centre.
The report assesses that the Growth Corridor Plans should include a
total provision for an additional 5,000 hectares of industrial land,
including around 800 hectares of commercial and mixed use
precincts that are suitable for industrial purposes. This is assessed as
sufficient to provide for an adequate metropolitan supply of
industrial land to at least 2040.
Approximately 90% of the proposed increase in industrial land supply
is nominated for the western, northern and Sunbury growth
corridors. This distribution is based on forecast demand for industrial
land in each region, with major influences being the superior access
of the western and northern growth corridors to the Port of
Melbourne, Melbourne Airport and to interstate freeway and rail
links. It also reflects the relatively greater number of years supply
that exists in the south‐eastern growth corridor.
Melton Retail and Activity Centres Strategy (Tim Nott with Harvest
Digital Planning and Hansen Partnership, 2014)
This report provides a retail and activity centres strategy for the City
of Melton. The report nominates a retail and activity centre hierarchy
in the context of policy directions and anticipated urban
development and population growth.
A hierarchy of activities is nominated, summarised as follows:
The primary centre in the municipality is nominated as Toolern as
a Metropolitan Activity Centre with a regional retail role;
8 second tier centres are nominated as activity centres with most
having sub-regional retail roles. The proposed Plumpton centre
is nominated in this category;
25 neighbourhood activity centres are nominated including two
in Kororoit and one in Plumpton;
Ref: M15030 HillPDA Page 13 | 65Plumpton and Kororoit Retail and Employment Land Assessment
The Melton Bulky Goods Precinct is nominated as the primary
bulky goods node with a sub-regional catchment; and
Local activity centres are also identified (11 existing centres).
The proposed network is shown the figure below.
Figure 3 - Melton Retail and Activity Centres Strategy
Source: Tim Nott et al 2014
The strategy proposes that floorspace caps be applied to
neighbourhood centres in growth areas with relevant centres being:
Plumpton 1 - 7,500 sqm retail cap on the basis of a 11,000 person
catchment;
Kororoit 1 - 5,500 sqm retail cap on the basis of a 8,000 person
catchment; and
Kororoit 2 - 8,000 sqm retail cap on the basis of a 12,000 person
catchment.
The activity centre nominated for Plumpton (sub-regional retail role)
has no proposed floorspace cap nominated on the basis of
competitive neutrality. Other existing such centres in the
municipality are not subject to floorspace caps under existing
Planning Scheme provisions.
The specific details and future composition of many centres,
particularly proposed centres in growth areas, is not provided in the
report. More detailed investigation beyond the strategy report is
required for such detail to be provided.
Ref: M15030 HillPDA Page 14 | 65Plumpton and Kororoit Retail and Employment Land Assessment
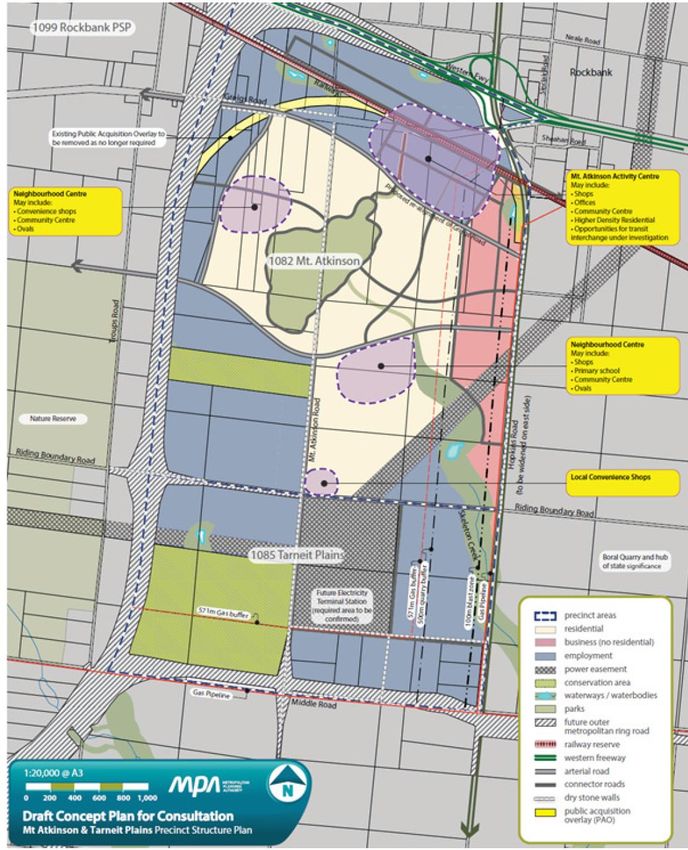
Draft Mt Atkinson and Tarneit Plains: Commercial and Industrial
Land Review (JLL for Metropolitan Planning Authority, 2014)
This draft report provides analysis and directions for economic land
uses in the precinct south of Western Freeway known as Mt Atkinson
and Tarneit Plains PSP areas (see figure below). The report considers
the potential demand for commercial offices, retail, bulky goods,
industrial uses and other commercial uses in the area.
The area is nominated as a significant future employment precinct in
recognition of its strategic location at the intersection of the Western
Freeway and Hopkins Road and potential to establish a train station
on the Melton rail line corridor.
Figure 4 - Mt Atkinson and Tarneit Plains Draft Concept Plan
Source: Metropolitan Planning Authority 2014
Ref: M15030 HillPDA Page 15 | 65Plumpton and Kororoit Retail and Employment Land Assessment
A summary of demand findings from the report follows.
Commercial Offices - Potential to attract suburban office market
activities of 35,000 to 40,000 sqm over 25 years at Mt Atkinson.
This may generate 2,250 jobs. This is defined as a very good
outcome.
Retail - The provision of a sub-regional sized retail centre of
23,500 sqm.
Bulky Goods Retailing – Given the location of the area on the
Western Freeway there is scope to establish a regional bulky
goods cluster in the area, nominally with 100,000 sqm of bulky
goods space to 2031. A precinct of 25 hectares may generate
around 1,000 to 1,250 jobs.
Industrial - Given considerable supply of industrial land in
western Melbourne the assessment suggests demand in the area
to be limited in the short and medium term (next 5 to 10 years).
The 572 hectares of planned industrial land in the area is
expected to provide up to 20 years future supply from 2020 to
2040, based on achieving 20% to 30% regional market share from
2020. Development of the area is expected to generate about
7,000 to 9,000 jobs.
Other Commercial – This includes car showrooms, trade supplies
and related uses that can be accommodated within industrial
areas and community infrastructure that can be accommodated
in predominantly residential and activity centre locations.
The assessment provides broad quantitative guidance for the
economic land uses of interest. The competitive implications of this
planned area for the Plumpton and Kororoit area are significant and
assessed as follows:
Commercial Offices - Very High Competition. The regional
market for office development is limited at the current time and
multiple competing areas, existing and new, will continue to
compete for the demand.
Retail - Moderate Competition. There may be some but limited
overlap of catchments between Kororoit and Mt Atkinson.
Bulky Goods Retailing – Very High Competition. The Mt Atkinson
area has better accessibility and exposure attributes for
establishing and developing a large scale regional cluster for
bulky goods compared to the Plumpton area.
Ref: M15030 HillPDA Page 16 | 65Plumpton and Kororoit Retail and Employment Land Assessment
Industrial - Very High Competition. Like bulky goods retailing, the
Mt Atkinson and Tarneit area has better accessibility and
exposure attributes for establishing and developing large scale
regional industry activities compared to the Plumpton area.
Showrooms and Trade Supplies – High Competition. Showrooms
and related uses have the same attributes as bulky goods.
Community Infrastructure – Low Competition. Local community
infrastructure relates directly to local residential catchments.
In summary, the Plumpton and Kororoit area will operate in a
regional framework in which the areas to the south of the Western
Freeway are likely to take a higher order role in industry and bulky
goods retailing activities. The planned Toolern centre is also planned
to perform regional scale roles for a range of retail and commercial
activities.
Melbourne West Growth Corridor Plan – Employment Land and
Activity Centre - Assessment of Plumpton (MacroPlan Dimasi for
Australand and Mondous Property Group, Addendum Report, 2
April 2013 with 2015 update1)
MacroPlan Dimasi prepared a consultant report for land holders that
have an interest in the Plumpton PSP area.
A focus of the report is assessment of industrial land needs in the
western region of Melbourne. The assessment is used to support an
opinion on the best use of land in the proposed Plumpton
employment area. The opinion is that the proposed Plumpton
employment area land is not suited for industrial development in
part based on its location and in part based on significant land supply
being available elsewhere in the region.
With respect to land supply, the method adopted for the assessment
is high-level comparison of:
Land supply - existing and planned future supply via the growth
corridor plans; and
Historic take up rates of land - using variable scenarios for
industrial land as a whole at a regional level.
This high level comparison provides a broad guide to number of years
of developable land supply in the region as a whole.
1
Melbourne West Growth Corridor Plan – Industrial Land Analysis (Letter from MacroPlan Dimasi to Echelon Planning, 11
March 2015)
Ref: M15030 HillPDA Page 17 | 65Plumpton and Kororoit Retail and Employment Land Assessment
The report summarises changes to land supply as provided by the
evolution of strategic planning documents. Take-up rate scenarios
are based on selected trends shown in Urban Development Program
data.
The report states that:
Based on information available in 2011 there would be between
38 and 50 years supply of industrial land in the western region of
Melbourne; and
Based on information available in 2013 there would be between
48 and 65 years supply of industrial land in the western region of
Melbourne.
On this basis the report states that removing the Plumpton
employment area from future industrial supply will not significantly
impact the distribution of industrial land throughout the west.
The above estimates were updated in 2015 via an addendum letter.
The update states:
Based on information available in 2015 there would be
approximately 36 years supply of industrial land in the western
region of Melbourne - however the consultant provides an
opinion that a more realistic figure may be 47 years supply.
In terms of location, the report states that the Plumpton location is
not suited for industrial use and the area is likely to be uncompetitive
as an industrial development area. The main reasons cited are that
the area would be dependent on the OMR being established (which is
uncertain) and the area will have residential interfaces.
A mixed use option is proposed for the area including residential and
higher density employment uses such as highway commercial, office,
health and education services and local level service industry.
It is the opinion of this report (HillPDA) that the land take-up
argument used in the MacroPlan Dimasi report has limited value in
assessing the potential role of the Plumpton employment area as an
industrial location. The MacroPlan Dimasi analysis states that the
area could be fully developed as an industrial area in a period
between 36 years and 47 years depending on which high level
regional take-up trend is selected. Another take-up scenario would
produce another timeframe estimate.
The disaggregation of industrial activity into different types such as
light industry through to large lot logistics for example is not
Ref: M15030 HillPDA Page 18 | 65Plumpton and Kororoit Retail and Employment Land Assessment
provided in the report. As such the potential market positioning of
precincts and take up rates for market segments within the industrial
economy is not provided.
Nevertheless, the opinion of the MacroPlan Dimasi report that the
Plumpton location may be suited for higher job density and mixed
commercial and industrial uses appears reasonable. The justification
for this opinion is based on a broad assessment of the attributes of
the land and location. The justification for allowing residential uses
in the area is limited.
Summary
A draft framework has been established for the study area which is
assessed as being robust in overall structure. The framework is
based on the West Growth Corridor, Melton Retail and Activity
Centres Strategy and other strategic work.
Matters that require further analysis and detailing are:
Advancing the retail and activity centre concepts with further
details, based on the latest available information; and
Developing a robust and realistic assessment of office and
industrial demand for the Employment Area.
Ref: M15030 HillPDA Page 19 | 65Plumpton and Kororoit Retail and Employment Land Assessment
3 ECONOMIC AND SOCIAL CONTEXT REVIEW
Introduction
This section of the report presents a brief demographic and economic
overview of the City of Melton to set the scene for the projections
shown in latter report sections.
Demographic Overview
Overall, the City of Melton is expected to grow from about 112,700
residents in 2011 to around 316,000 in 2036.
Household size is expected to remain fairly stable during the period,
in the range of 2.8 to 3.0 persons per household, reflecting the family
with children emphasis of households in the area.
Table 1 - City of Melton Population and Household Forecasts
2011 2016 2021 2026 2031 2036
Population 112,646 133,174 165,196 207,255 258,249 315,910
Change in population (5yrs) 20,528 32,022 42,059 50,994 57,661
Average annual change 3.4 4.4 4.64 4.5 4.11
Households 37,290 44,434 55,510 70,747 89,597 110,164
Average household size 2.98 2.95 2.92 2.88 2.84 2.83
Dwellings 39,104 46,568 58,247 74,202 93,630 114,439
Dwelling occupancy rate 95.36 95.42 95.3 95.34 95.69 96.26
Source: id consulting 2014
A snapshot of the qualifications profile of residents and as at 2011 is
shown in the figure below. This shows the profile of the municipality
versus Greater Melbourne and the suburb of Caroline Springs.
Caroline Springs is used as an example to demonstrate that newer
housing estates are having an impact in attracting a higher skilled and
higher income demographic to the municipality. As such, assessment
of retail and service demand in the area should consider the new
resident profile as opposed to the municipal average.
Weekly household income data shows a similar pattern, with
Caroline Springs having a higher income profile compared to the
municipality as a whole.
Greater Melbourne has a more even household income profile to
that of Melton, with higher shares of lower and higher income
households. Melton household tend to be concentrated in middle
income bands which is part reflect the mortgage belt profile of the
area.
Ref: M15030 HillPDA Page 20 | 65Plumpton and Kororoit Retail and Employment Land Assessment
Figure 5 - Qualifications, 2011
60.0%
Caroline Springs City of Melton Greater Melbourne %
50.0%
40.0%
30.0%
20.0%
10.0%
0.0%
Bachelor or Higher Advanced Diploma or Vocational No qualification
degree Diploma
Source: id consulting 2014 derived from ABS Census of Population and Housing 2011
Figure 6 - Weekly Household Income, 2011
30.0%
25.0%
20.0%
15.0%
10.0%
5.0%
0.0%
Caroline Springs City of Melton Greater Melbourne %
Source: id consulting 2014 derived from ABS Census of Population and Housing 2011
Economic Overview
Jobs located within the City of Melton increased from around 14,600
in 2006 to 21,500 in 2011. The stock of jobs in the municipality is
estimated to be around 23,500 as at 2013.
The leading sectors in terms of local job provision (as at 2011) are:
Retail trade (2,511 jobs);
Education and training (2,348);
Construction (1,803);
Health care and social assistance (1,583);
Public administration and safety (1,337);
Ref: M15030 HillPDA Page 21 | 65Plumpton and Kororoit Retail and Employment Land Assessment
Accommodation and food services (1,328); and
Manufacturing (1,168).
All of the above listed sectors (apart from manufacturing) can be
defined as being population-driven.
Figure 7 - Jobs Within City of Melton, 2006-2013
25,000 23,467
22,367
21,488
20,000
14,568
15,000
10,000
5,000
0
2006 2007 2008 2009 2010 2011 2012 2013
Source: id consulting based on National Institute of Economic and Industry Research data
(2014) using 2006 and 2011 Census data points and updates for 2012 and 2013
Figure 8 - Profile of Jobs in Melton, 2011
18.0%
16.0% 15.4%
14.4%
14.0%
12.0% 11.1%
9.7%
10.0%
8.2% 8.2%
8.0% 7.2%
6.0%
4.4%
3.9% 3.9%
4.0% 3.4%
2.7%
1.8% 1.6%
2.0% 1.0% 0.7%
0.6% 0.6% 0.3%
0.0%
Retail trade
Education and training
Construction
Health care and social assistance
Public administration and safety
Accommodation and food services
Manufacturing
Administrative and support services
Other services
Transport, postal and warehousing
Professional, scientific and technical services
Wholesale trade
Arts and recreation services
Rental, hiring and real estate services
Financial and insurance services
Agriculture, forestry and fishing
Information media and telecommunications
Electricity, gas, water and waste services
Mining
Source: Derived from ABS Census of Population and Housing 2011
Ref: M15030 HillPDA Page 22 | 65Plumpton and Kororoit Retail and Employment Land Assessment
Benchmarked to Greater Melbourne, the industry sectors in which
Melton has a greater concentrations or emphasis in is shown in the
figure below, with a score of 1.0 being the Greater Melbourne
average. For example, Melton has 11.1% of its jobs in construction
whereas Greater Melbourne has 6.2% of its jobs in that sector, and
therefore the ratio is 1.8 (11.1 / 6.2 = 1.8).
Again, this shows that urban development and population-driven
sectors are important in the area and that higher order business
services are currently lacking in emphasis in the area.
Figure 9 - Industry Concentration Index - City of Melton versus Greater
Melbourne, 2011
2.0
1.8
1.8 1.7
1.6
1.6 1.5 1.5
1.4 1.4 1.4
1.4
1.2 1.1
1.0 Greater Melbourne Profile
1.0 0.9
0.8 0.8
0.8
0.6
0.6
0.6 0.5
0.4
0.4 0.3
0.2
0.2
0.0
Construction
Education and training
Mining
Public administration and safety
Agriculture, forestry and fishing
Retail trade
Accommodation and food services
Administrative and support services
Other services
Rental, hiring and real estate services
Arts and recreation services
Health care and social assistance
Transport, postal and warehousing
Manufacturing
Electricity, gas, water and waste services
Wholesale trade
Professional, scientific and technical services
Information media and telecommunications
Financial and insurance services
Source: Derived from ABS Census of Population and Housing 2011
Summary
The City of Melton is growing rapidly and is maintaining an emphasis
on relatively bigger household sizes reflecting the family with
children orientation of the area.
The skills and income profile of new residents entering new housing
estates is higher than the historic municipal average and compares
favourably to the metropolitan average.
The number of jobs in the area is growing strongly and is mainly
driven by urban development and population-driven industry sectors.
This includes retail, education and construction. Higher order
business services are currently lacking in emphasis in the area.
Ref: M15030 HillPDA Page 23 | 65Plumpton and Kororoit Retail and Employment Land Assessment
4 BUSINESS AND INDUSTRIAL MARKET ANALYSIS
AND PROJECTIONS
Introduction
This section of the report provides an assessment of business activity
which may be attracted to the business and industrial land located to
the west of the Plumpton MTC.
The section reviews land supply and conditions, industrial investment
trends and property sales and leasing activity. Projections of
potential future demand and jobs are provided based on population
threshold and investment trend methods.
The analysis identifies the type of properties that are most likely to
be demanded in the area and take up over time, focusing on business
type, lot and floorspace profile and job generation.
Land Supply and Conditions
The City of Melton (called Melton hereafter) currently has 400 ha of
occupied industrial land. A further 899 ha is zoned and vacant.
Table 2 - Industrial Land Supply, Selected Areas, 2014
Occupied ha Vacant ha Total ha
City of Melton 400 899 1,299
West State Significant Industrial Precinct 3,520 1,952 5,472
Total Western Subregion 4,860 2,826 7,686
Total Metropolitan Melbourne 18,482 7,246 25,729
Source: Department of Transport, Planning and Local Infrastructure (2014) Urban Development
Program
An additional 1,950 ha is planned to be brought into supply in Melton
via PSPs as identified in the West Growth Corridor Plan.
Table 3 - Planned Additional Industrial Land Supply, Selected Areas, 2014
Planned Supply
(Zoned UGZ)
City of Melton 1,950
Total Western Subregion 2,610
Total Metropolitan Melbourne 6,520
Source: Department of Transport, Planning and Local Infrastructure (2014) Urban Development
Program
Melton generally performs two roles in the industrial economy:
Firstly, accommodating relatively small industrial precincts,
designed to serve local areas; and
Secondly, accommodating a share of the Western State
Significant Industrial Precinct.
Ref: M15030 HillPDA Page 24 | 65Plumpton and Kororoit Retail and Employment Land Assessment
The figure below provides an illustration of industrial land supply in
the Western Subregion. The most relevant shadings are:
Light blue - unavailable industrial land (mostly occupied);
Dark blue - available industrial land (vacant zoned land); and
Blue diagonal stripes - proposed industrial land supply.
Industrial land is defined as primarily Industrial 1, 2 and 3 and
Commercial 2 Zones. It also includes a range of area specific zones
such as some Special Use and Comprehensive Development Zones
and Precinct Structure Plan identified industrial land.
Figure 10 - Industrial Land Supply - Western Subregion, 2014
Source: Department of Transport, Planning and Local Infrastructure (2014) Urban Development
Program
Ref: M15030 HillPDA Page 25 | 65Plumpton and Kororoit Retail and Employment Land Assessment
Melton has about 8.2% of the Western Subregion's occupied
industrial land stock. It has however a large share of the Western
Subregion's zoned vacant land supply (31.8%).
Figure 11 - City of Melton's Share of Industrial Land Area (ha), 2014
50.0%
46.1%
45.0%
40.0%
35.0% 31.8%
West State Significant Industrial
30.0% Precinct
23.7%
25.0% Total Western Subregion
20.0% 16.9%
Total Metropolitan Melbourne
15.0% 12.4%
11.4%
10.0% 8.2%
5.0%
5.0% 2.2%
0.0%
Occupied ha Share Vacant ha Share Total ha Share
Source: Department of Transport, Planning and Local Infrastructure (2014) Urban Development
Program
The growth area planning process intends to increase Melton's share
of Western Subregion's vacant land supply to 52.4%.
Figure 12 - City of Melton's Share of Industrial Land Area Including Planned
Supply (ha), 2014
60.0%
52.4%
50.0%
40.0%
31.6%
30.0% Total Western Subregion
Total Metropolitan Melbourne
20.7%
20.0%
10.1%
10.0% 8.2%
2.2%
0.0%
Occupied ha Share Vacant ha Share Total ha Share
Source: Department of Transport, Planning and Local Infrastructure (2014) Urban Development
Program
Ref: M15030 HillPDA Page 26 | 65Plumpton and Kororoit Retail and Employment Land Assessment
The study area's business and industrial land comprises 109.2 ha of
the planned future supply. The study area therefore represents 5.6%
of Melton's planned future supply.
Trends in industrial land take-up are broadly defined by rapid
development in growth areas - and in particular the State Significant
Industrial Precincts - and rezoning of some land in inner and middle
suburbs to non-industrial uses.
The Urban Development Program notes that industrial land
consumption across metropolitan Melbourne averaged 190 ha per
annum since 2008-09. The consumption rate was around 280 ha per
annum prior to Global Financial Crisis.
Land consumption in the Western State Significant Industrial Precinct
has fluctuated in the range of 60 ha to 105 ha per annum since 2005-
06.
Figure 13 - Consumption of Industrial Land in State Significant Industrial
Precincts, 2005-06 to 2013-14
Source: Department of Transport, Planning and Local Infrastructure (2014) Urban Development
Program
Ref: M15030 HillPDA Page 27 | 65Plumpton and Kororoit Retail and Employment Land Assessment
Industrial Investment Trends
Industrial development applications and construction data for the
City of Melton in the period September 2006 to February 2015 is
shown the figure below. The figure shows that most projects are
under $2m in value with the occasional high value project.
Figure 14 - Industrial Investment Applications - City of Melton, September
2006 to February 2015
$25,000,000
$20,000,000
$15,000,000
$10,000,000
$5,000,000
$0
19/09/2006
18/05/2010
16/08/2010
27/05/2011
12/08/2011
25/10/2011
18/01/2012
16/05/2012
24/02/2015
23/10/2012
30/01/2013
12/03/2013
29/04/2013
10/07/2013
14/10/2013
29/11/2013
12/08/2014
24/04/2014
13/06/2014
10/07/2014
21/08/2014
14/10/2014
10/02/2015
1/07/2009
8/11/2010
7/03/2011
5/06/2013
2/12/2014
Source: Cordell Connect and HillPDA 2015
It is estimated that 61 projects have been completed with a total
value of $95.2m at an average of $11.2m per year during this data
period. The average project value is $1.6m.
A slightly higher value of industrial investment is in the pipeline, with
$100.4m noted as likely construction (generally when tenders have
been let). Most projects are likely to be completed within two or
three years and as such this pipeline suggests a higher industrial
construction rate than the completion rate noted here. A further
$45.3m worth of projects are noted as possible.
Table 4 - Industrial Construction Activity and Pipeline - City of Melton,
September 2006 to February 2015
Number of Average Project Average Value
Stage Value
Projects Value Per Annum
Construction 61 $95,160,000 $1,560,000 $11,195,294
Likely Construction 41 $100,408,000 $2,448,976 $11,812,706
Possible Construction 37 $45,320,000 $1,224,865 $5,331,765
Deferred 8 $43,288,000 $5,411,000 $5,092,706
No Further Information 17 $23,948,000 $1,408,706 $2,817,412
Total Applications 164 $308,124,000 $1,878,805 $36,249,882
Source: Cordell Connect and HillPDA 2015
Ref: M15030 HillPDA Page 28 | 65Plumpton and Kororoit Retail and Employment Land Assessment
Using the constructed project value as a guide, it is possible to
estimate annual floorspace and land take up rates, as shown in the
table below. Two scenarios are provided, one using a construction
value of $750 per sqm, which reflects warehouse style projects, and
the second scenario uses $1,250 per sqm, which reflects office
warehouse projects. In both scenarios a 40% site coverage ratio is
used.
The data suggests land take up trends have been up to 3.7 ha per
annum in Melton.
The pipeline data shown above suggests this rate could possibly
double in the near future, say up to 8 ha per annum. This rate could
accelerate further into the longer term as land supplies are
exhausted in other areas of Melbourne.
Table 5 - Estimated Annual Industrial Floorspace and Land Development -
City of Melton, September 2006 to February 2015
Scenario 1 - Assuming $750 / sqm Scenario 2 - Assuming $1,250 / sqm
Stage Construction Cost and 40% Site Construction Cost and 40% Site
Coverage Coverage
Floorspace Site Area Floorspace Site Area
Construction (sqm) 14,927 37,318 8,956 22,391
Construction (ha) 1.5 3.7 0.9 2.2
Source: Cordell Connect and HillPDA 2015
Property Sales and Leasing Activity
Industrial property sales (land with buildings) in the City of Melton
since 2010 provides 107 reported records. The median land area
(which also reflects floorspace for most samples shown) is 350 sqm
with a median selling price of $341,000. Most samples are small
'factoryette' units or office warehouse units.
Table 6 - Reported Industrial and Commercial Sales - City of Melton,
January 2010 to February 2015
Land Area Median Land
Properties Sold Total Value Median Value
(sqm) Area (sqm)
Industrial 107 175,712 350 $80,597,187 $341,000
Industrial Development Site 8 12,454 1,259 $2,359,526 $305,800
Office 6 9,459 567 $7,962,000 $400,000
Source: RP Data Professional and HillPDA 2015
The breakdown of size is shown in the following figure. Most
properties (57%) sold were 500 sqm or less and 79% were 2,000 sqm
or less.
Ref: M15030 HillPDA Page 29 | 65Plumpton and Kororoit Retail and Employment Land Assessment
Figure 15 - Size of Industrial Properties Sold - City of Melton, January 2010
to February 2015
2.8% 2.8%
15.0%
Under 501 sqm
501-1,000 sqm
1,001- 2,000 sqm
12.1% 2,001-5,000 sqm
57.0%
5,001-10,000 sqm
10,001 sqm +
10.3%
Source: RP Data Professional and HillPDA 2015
The size profile of industrial properties sold is different if industrial
units are taken out of the data, as shown is the figure below (based
on 38 non-unit records).
The median size of these industrial properties is 1,200 sqm and the
lot size is fairly evenly spread in the size brackets up to 5,000 sqm.
About 68% are 2,000 sqm or less.
Figure 16 - Size of Industrial Properties Sold Excluding Units - City of
Melton, January 2010 to February 2015
2.7%
24.3%
29.7% Under 501 sqm
501-1,000 sqm
1,001- 2,000 sqm
10.8% 2,001-5,000 sqm
5,001 sqm +
32.4%
Source: RP Data Professional and HillPDA 2015
Ref: M15030 HillPDA Page 30 | 65Plumpton and Kororoit Retail and Employment Land Assessment
This profile reflects the small business role that Melton has
performed in the regional industrial economy to date.
Price per square metre patterns suggest properties achieve around
$1,000 / sqm and the trend has been flat for the past five years.
These price rates are relatively high for industrial land in the Western
Subregion and reflect the small property nature of the data sample.
Figure 17 - Price Per Square Metre ($/sqm) Trend for Industrial Properties
Sold - City of Melton, January 2010 to February 2015
$7,000.00
$6,000.00
$5,000.00
$4,000.00
$3,000.00
$2,000.00
$1,000.00
$0.00
18-Jan-10 18-Jan-11 18-Jan-12 18-Jan-13 18-Jan-14
Source: RP Data Professional and HillPDA 2015
This price trend may also reflect downward pressure on prices due to
land supply growth and mixed business conditions for the industrial
sector.
The above profile reflects the small business role of Melton in
industry, and provides a guide to the type of properties that are likely
to be attracted to the Plumpton business and industrial area over
time.
The industrial profile of the municipality is likely to diversify as the
Western State Significant Industrial Precinct expands into the south-
eastern sector of the municipality, with a focus on large lot industry.
However, this role is not expected to be focused on the Plumpton
business and industrial area because it is:
Remote from the Western State Significant Industrial Precinct;
Accessed predominantly by residential catchment roads, the
main one being Melton Highway;
Is located on somewhat sloping terrain, particularly along the two
creek corridors in the area; and
Ref: M15030 HillPDA Page 31 | 65Plumpton and Kororoit Retail and Employment Land Assessment
Is located adjacent to predominantly (future) residential and
Town Centre activities.
The capacity of the area to accommodate larger lot industry would
be enhanced with construction of the OMR and assuming direct
diamond intersection access to Melton Highway. However, the area
may begin development before the OMR is constructed (which has
no set timeframe).
Shown below is a map of topography in the area of proposed
business and industrial land.
Figure 18 - Topography in Vicinity of Business and Industrial Land (0.5m
Contours)
Note: Beattys Road access to OMR no longer proposed
Source: Metropolitan Planning Authority 2014
Ref: M15030 HillPDA Page 32 | 65Plumpton and Kororoit Retail and Employment Land Assessment
Projections of Future Demand
The adopted method to project future demand for the Plumpton
business and industrial land requires partitioning local level industrial
(or light industry) demand from state economy based large scale
industry demand (which is mainly export-oriented manufacturing and
logistics activity).
To that end, the approach adopted is to compare occupied industrial
land in the City of Melton and in Melton Township to the number of
households in those areas. This approach provides a guide to local
level light industry demand in those areas, given activity in the
municipality and Township currently has that emphasis.
The table below provides the data. This shows that for every 1,000
households in the municipality, 9.6 ha of industrial land is occupied.
The same ratio for the Township is 13.2 ha (of occupied industrial
land per 1,000 households).
Table 7 - Occupied Industrial Land to Household Ratios, 2014
Occupied Hectares Per
Industrial Households 1,000
Hectares (ha) (2014 estimate) Households
2014 (2014)
City of Melton 400 41,576 9.6
Melton Township 250 18,971 13.2
Source: Urban Development Program 2014 and HillPDA 2015
Using the estimated household yields for the Plumpton and Kororoit
PSP areas, and assuming full development at 2036, it is possible to
extrapolate equivalent light industry demand at different household
thresholds using the two ratios shown above. These are shown in the
table below.
The next step is to allocate a share of the local demand to the
Plumpton business and industrial area. For the purpose of this
assessment, it is considered that half of the assessed local demand is
a reasonable allocation for the study area and the other half is
assumed to be accommodated in other industrial precincts in the
region. The 50% market share assumption is applied to the mid-point
of the municipal and Township ratios.
This approach suggests that total demand in the area could be
around 110 ha at full development and, on average, take up may be
around 5.2 ha per annum over the forecast period.
Ref: M15030 HillPDA Page 33 | 65Plumpton and Kororoit Retail and Employment Land Assessment
The outcome of this approach aligns with the investment trends
analysis which suggests that land take up has been up to 3.7 ha per
annum in Melton with capacity for this rate to accelerate over time.
In terms of actual take-up of land in the study area, a linear
compound growth pattern as shown in the data is unlikely to occur in
practice. Like other economic activities, development is likely to
occur once certain thresholds of demand are achieved in the area,
such as after 3,000 households are established and assuming
infrastructure and subdivision has occurred to enable development.
Table 8 - Estimate of Light Industry Demand Captured in Plumpton and
Kororoit
Source: HillPDA 2015
Employment Estimate
The capacity of the business and industrial area to accommodate
development is determined by land that can accommodate business
lots, taking out land for roads, creeks, easements and parks. For the
purpose of this assessment it is assumed 70% of the land is able to be
developed into business lots, meaning approximately 76.4 ha (of
109.2 ha) would be taken up by businesses.
Ref: M15030 HillPDA Page 34 | 65Plumpton and Kororoit Retail and Employment Land Assessment
Floorspace site coverage and job ratios vary considerably within
industrial business types. For light industry, it is assessed that a 50%
floorspace ratio and 60 sqm job density outcome is possible.
The floorspace to site area ratio of 50% is adopted for analysis
purposes based on HillPDA urban development metrics and checked
via a sample survey of sites which shows around 30% site coverage
for large lot industry and over 80% site coverage for small
'factoryette' and office warehouse premises.
The job density assumption (i.e. floorspace used per job) is based on
HillPDA urban development metrics and reviewed against City of
Melbourne Census and Land Use Employment data. Office uses have
a ratio of around 19 sqm per job, research space at 58 sqm per job,
industry at 102 sqm per job through to warehouses at around 241
sqm per job. The adopted figure of 60 sqm assumes the overall mix
of businesses will be offices, research facilities, office warehouses
and office industry activities.
Table 9 - Job Density Ratios for Office and Industry Land Uses
Space Use 2002 2004 2006 2008 2010 2012
Office 21.3 22 21.3 19.9 18.8 18.9
Storage/Wholesale 261.3 230.4 234.1 272 217.2 240.6
Manufacturing 91.8 100.2 109.6 90.1 100.6 101.6
Educational/Research 65.2 66.6 56.9 53.1 54.7 58.3
Source: Derived from City of Melbourne Census of Land Use and Employment (2002 to 2012)
On that basis the business and employment area has potential to
accommodate about 6,370 jobs.
Development may occur around 2033 to 2034 on the basis of the
timeline shown in this report, or about 19 years after
commencement of development of the area.
Ref: M15030 HillPDA Page 35 | 65Plumpton and Kororoit Retail and Employment Land Assessment
Table 10 - Business and Industrial Area Land and Floorspace Capacity and
Job Estimates in Relation to Assessed Demand
Estimated Floorspace
Year Jobs
Demand (sqm)
2015 5.4 27,026 450
2016 6.2 31,197 520
2017 7.2 36,010 600
2018 8.3 41,567 693
2019 9.6 47,981 800
2020 11.1 55,384 923
2021 12.8 63,930 1,066
2022 14.8 73,795 1,230
2023 17.0 85,181 1,420
2024 19.7 98,325 1,639
2025 22.7 113,497 1,892
2026 26.2 131,010 2,183
2027 30.2 151,225 2,520
2028 34.9 174,559 2,909
2029 40.3 201,494 3,358
2030 46.5 232,585 3,876
2031 53.7 268,473 4,475
2032 62.0 309,899 5,165
2033 71.5 357,717 5,962
2034 82.6 412,914 6,882
2035 95.3 476,627 7,944
2036 110.0 550,171 9,170
Capacity (70% 0f 107 ha) 76.4 382,200 6,370
Source: HillPDA 2015
Design Considerations
The size of lots would be determined by market demand.
Nevertheless, the profile of (non-unit) industrial properties sold over
the past five years provides a guide to potential outcomes. That data
suggests a median lot size of 1,200 sqm with about two-thirds of lots
being 2,000 sqm or less. Larger lots are also likely to be demanded,
generally up to 5,000 sqm.
Small lots and office warehouse uses may be suitable for integration
within the interface area whereas larger lots may be suitable closer
to the OMR corridor.
Shown in the figure below is a sample of properties being
constructed and leased in the City of Melton at the current time. The
examples range in size from 166 sqm (floorspace) to 4,373 sqm
(floorspace).
Ref: M15030 HillPDA Page 36 | 65Plumpton and Kororoit Retail and Employment Land Assessment
Figure 19 - Examples of Modern Industrial Properties for Lease, February
2015
Source: RP Data Professional and HillPDA 2015
Summary
The City of Melton's industrial land profile is currently dominated by
light industry and small and medium sized lots. This profile is likely to
diversify as the Western State Significant Industrial Precinct expands
into the south-eastern sector of the municipality, with a focus on
large lot industry. However, this role is not expected to be focused
on the Plumpton business and industrial area, which is likely to
attract local level industrial (or light industry) demand.
It is estimated that there will be sufficient demand from the local
area to develop the business and employment land with industrial
land uses by the time the study area is fully developed with
households. Take up may be around 5.2 ha per annum on average
over the forecast period, with actual take-up likely to occur after a
catchment is established in the area.
Ref: M15030 HillPDA Page 37 | 65Plumpton and Kororoit Retail and Employment Land Assessment
The capacity of the business and industrial area to accommodate lots
and jobs may be around 79.4 ha and 6,370 jobs.
The size of lots would be determined by market demand but the
median lot size may be around 1,200 sqm with some higher density
and office warehouses uses potentially being suitable for integration
within the interface area adjacent to the planned Major Town
Centre.
Ref: M15030 HillPDA Page 38 | 65You can also read