POLISH TEXTILE AND APPAREL INDUSTRY: GLOBAL SUPPLY CHAIN MANAGEMENT PERSPECTIVE - Sciendo
←
→
Page content transcription
If your browser does not render page correctly, please read the page content below
AUTEX Research Journal, DOI 10.2478/aut-2021-0021

        POLISH TEXTILE AND APPAREL INDUSTRY: GLOBAL SUPPLY CHAIN
                        MANAGEMENT PERSPECTIVE
                    Adam Sadowski1, Bogusława Dobrowolska2, Beata Skowron-Grabowska3, Andrzej Bujak4

                   1 Institute of Logistics and Informatics, University of Lodz, 90-214 Lodz, 37 Rewolucji 1905r. Street, Lodz, Poland+
               2 Department of Economic and Social Statistics, University of Lodz, 90-214 Lodz, 37 Rewolucji 1905r. Street, Lodz, Poland
           3 Department of Enterprise Management, Czestochowa University of Technology, Management Faculty, 19b Armii Krajowej Street, 4
                                                                2-200 Czestochowa, Poland
                                      4 WSB University in Wroclaw, Fabryczna Street 29-31, 53-609 Wrocław, Poland
      *Corresponding author. E-mail: adam.sadowski@uni.lodz.pl (Adam Sadowski); boguslawa.dobrowolska@uni.lodz.pl (Bogusława Dobrowolska);
                  beata.skowron-grabowska@wz.pcz.pl (Beata Skowron-Grabowska); andrzej.bujak@wsb.wroclaw.pl (Andrzej Bujak)

Abstract:

        The article presents changes that took place in the textile and apparel (T&A) industry in Poland in the years 2004–
        2020. To describe the changes, we adopted the supply chain management perspective, which allowed for a global
        view of the changes taking place. We discuss the basic characteristics, such as the size and structure of the
        industry, innovation, production value, and the use of information and communications technology (ICT). In the
        research, we used the databases of the Central Statistical Office (GUS) on the sold production of the T&A industry,
        as well as imports and exports. Our research shows that, at the level of basic characteristics, the industry is close
        to the European model. However, it is characterized by a smaller share of small companies in the structure of
        enterprises. The research showed an upward trend in the production of sold textiles and, to a lesser extent, apparel.
        At the same time, the operation of the Polish T&A industry is influenced by the import of finished products and raw
        materials from China, Germany, Bangladesh, and Turkey. The export is directed to the German, Czech, Romanian,
        and Ukrainian markets. The article provides an overview of the development trends in the Polish T&A industry in the
        broad context of international conditions.

Keywords:

        Polish textile and apparel industry, production, trade, global supply chain

1. Introduction                                                                        The aim of this article is to analyze the changes taking place
                                                                                       in the sold industrial production, imports, and exports of the
The textile industry is classified as a low-technology industry,                       textile and apparel (T&A) industry in Poland in the context of
which affects its specificity and strong dependence on both                            trends in the global supply chain of the textile industry. These
the raw material base and the markets for finished products.                           changes are due to global trends in the transformation of
This leads to the creation of complex structures for the flows                         supply chain management in T&A enterprises. They are related
of materials and finished products of the textile industry with                        to main supply chain processes, such as planning, sourcing,
a global scope. This also applies to the Polish textile industry,                      production, and delivery to customers within retail sales
which is a complex system sensitive to changes in both                                 networks. The drive for sustainable operations and sustainable
the supply and the outlet markets for finished products [1].                           supply chain management in the T&A industry has resulted, as
Household expenditure on clothing is steadily increasing and                           across entire Europe, in changing the location of supply chain
places Poland in the seventh place in the European Union (EU)                          processes and moving sourcing and production processes to
[2]. The way in which household members purchase clothes is                            countries with lower environmental standards and lower labor
also changing. Poland, along with Russia, the United States                            costs.
(US), Spain, France, the United Kingdom, Israel, Korea, and
the Middle East, is one of the most important markets for Ali                          The research used the following statistical methods: structure,
Express in the sale of clothing [3].                                                   correlation, regression, and dynamics analysis. Calculations
                                                                                       were made in the PS Imago software on the basis of data
Showing these dependencies requires looking at the production                          describing the textile industry in Poland. The time scope of the
of the textile industry in Poland from the perspective of supply                       research on changes in production covered the years 2010–
chain management. The demand-oriented nature of creating                               2018. On the other hand, the trends of changes in imports and
global supply chain processes requires an analysis of imports,                         exports covered the years 2004–2020. The research used
exports, and production in the textile industry.                                       databases and publications of the Central Statistical Office
                                                                                       (Główny Urząd Statystyczny or GUS) in Warsaw.

               © 2021 by the authors. This article is an open access article distributed under the terms and conditions of the Creative Commons Attribution (CC BY) license
               (http://creativecommons.org/licenses/by/4.0/).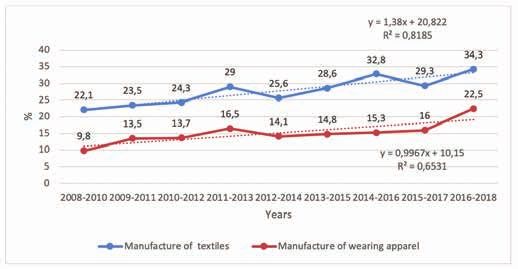
AUTEX Research Journal, DOI 10.2478/aut-2021-0021

2. Key parameters of the T&A industry in Poland                              the way of financing the activity, which is associated with the
                                                                             risk of implementing innovations [5]. Other studies – carried out
The production of the textile industry in Poland is shaped,                  in the Spanish T&A industry – prove that a large expenditure
similarly to that in the EU countries, by international relations            on research and development (R&D) does not necessarily
related to the flow of raw materials for the production of                   translate into the development of innovation. For example,
finished products, as well as production of textile products and             specialization, formalization, management attitude, and internal
apparel. These relations result from international agreements                communication are of key importance for innovation [6].
on trade and commercial exchange of goods, according to
which the EU market is treated primarily as an outlet for the                The research conducted by the Central Statistical Office (GUS)
finished products of the textile industry. In Poland, in 2018,               on the group of medium-sized and large enterprises showed
in the structure of sold production of industrial products, the              significant differences in product and process innovation in the
production of textiles and apparel accounted for 1.0% and                    textile industry (Table 3). It can be observed that the size of
0.4%, respectively [Statistical Yearbook of Industry; Central                the enterprise influences the introduction of innovations. Most
Statistical Office 2019]. In the period 2005–2018, there were                innovations are introduced in the area of textile production in
two opposing trends in the textile industry in Poland. The first             large enterprises, i.e., 66.7%. At the same time, the level of
one was the developmental trend in the production of textile                 innovation is greater in enterprises involved in the production
products, which is confirmed by the 68.7 increase in the number              of textiles compared to those involved in the production of
of entities producing textile products. The second, degressive               apparel. Moreover, the percentage share of enterprises that
trend in the production of clothing resulted in a decrease in the            introduced product innovations in the field of textile production
number of active entities by 65.0%. The Herfindahl-Hirschman                 is more than twice as high as that of enterprises involved in
Index and the Lorenz factor of production concentration sold                 the production of apparel (Figure 1). This shows the main area
in 2018 are higher for the production of textile products and                of R&D in the textile industry in Poland. Smaller differences
amount to 0.035 and 0.736, respectively. For the production                  occur in the share of enterprises that have introduced new
of apparel, they are lower and amount to 0.004 and 0.579,                    or significantly improved business processes (29.2% and
respectively, which proves a stronger competitive position of                18.9%, respectively). The innovativeness of enterprises in the
enterprises involved in the production of textiles in Poland. In             textile industry is also influenced by the use and development
the production of textiles, 19.9% of entities have an 80% share              of information and communications technology (ICT) in their
in the value of sold production and 39.8% in the production of               contacts with customers (Table 4). Considering traditional forms
apparel. The structure of the Polish textile industry is close to            and tools of communication, such as the Internet, websites, and
the EU average. Enterprises employing 19,000 enterprises (Table 1).
Almost all of them belong to the private sector. Productivity in
the textile industry differs significantly depending on the type
of activity (Table 2). It is the largest for enterprises involved in
the preparation and spinning of textile fibers and amounts to
PLN 385,800. The productivity is the lowest for enterprises that
manufacture wearing apparel, except fur apparel, and amounts
                                                                             Figure 1. Enterprises that introduced new or improved products or
to PLN 115,700. For comparison, the average productivity
                                                                             business processes in the manufacture of textiles and wearing apparel
for the textile industry in the EU in 2018 was EUR 30,200. As                in Poland during the period 2008–2018.
the research conducted in the Italian T&A industry shows, an                 Source: Own calculations based on Central Statistical Office data from
enterprise’s economic results and productivity directly affect               the Statistical Yearbook of Industry 2008–2019 [www.stat.gov.pl].

Table 1. Economic entities by ownership sectors, sections, and divisions in textile industry.
                                                                       Total                     Public sector             Private sector
                                                               2005            2018             2005       2018          2005           2018
                  Manufacture of textiles                      3,506           5,915             16          3           3,490          5,912
            Manufacture of wearing apparel                    20,336           13,174            16          4          20,320         13,170

Source: Own calculations based on Central Statistical Office data from the Statistical Yearbook of Industry 2019 [www.stat.gov.pl].

http://www.autexrj.com/                                                  2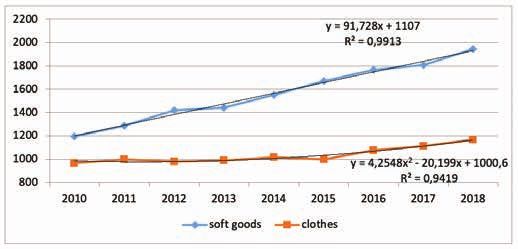
AUTEX Research Journal, DOI 10.2478/aut-2021-0021

Table 2. Basic data concerning the textile industry (2018).*

                                                                                                              Average
                                                        Sold         Average paid            Labor                              Gross value
                                                                                                              monthly
                                 Economic           production,      employment,         productivity,                            of fixed
       Specification                                                                                        gross wages
                                  entities           in million      in thousand         in thousand                             assets, in
                                                                                                            and salaries,
                                                        PLN               PLN                 PLN                               million PLN
                                                                                                               in PLN
      Manufacture of
                                     196              10,779.1              34.9             308.7             3,620.78               6,234.9
         textiles
     Preparation and
    spinning of textile               12               834.4                2.2              385.8             3,697.58               875.3
          fibers

   Weaving of textiles                20               662.9                2.6              256.7             3,613.50               584.0

   Finishing of textiles              19               543.8                3.1              177.5             3,496.89               463.9

  Manufacture of other
                                     145              8,737.9               27.1             322.3             3,629.35               4,311.7
        textiles
     Manufacture of
                                     296              4,178.0               34.3             121.8             2,879.36               1,888.5
     wearing apparel
  of which manufacture
   of wearing apparel,               262              3,370.3               29.1             115.7             2,858.43               1,311.5
    except fur apparel
Note: *For entities with >10 employees.
Source: Own calculations based on Central Statistical Office data from the Statistical Yearbook of Industry 2019 [www.stat.gov.pl].

It is particularly visible in enterprises involved in the production        3. Global impact on the T&A supply chain in
of apparel, of which only 25.5% use social media.
                                                                            Poland
Based on the analysis of the number of companies that
introduced new or improved business products in the period                  Globalization has led to profound structural changes in the
2008–2018 in Poland, the section of companies producing                     global trade in T&A [7]. They were based on trade liberalization
textiles and clothing is steadily increasing, as shown in Figure            and international agreements that directly changed the
1. On average, over the whole period studied, the number of                 global supply chain [8]. The restructuring of the T&A industry
companies that introduced new or improved business products                 particularly affected the EU countries, such as Poland, which
among the textile companies increased by an average of 1.38                 had to adapt the production profile to meet the market changes
percentage points per year, while for apparel manufacturing                 as well as technological and environmental conditions [9–11].
companies, the average annual increase between 2008 and                     Even in highly industrialized countries such as the US, trade
2018 was almost 1 percentage point. In 2018, compared to                    policies such as the North American Free Trade Agreement
2008, the number of companies that introduced new or improved               (NAFTA) do not solve the problem of the declining international
business products among textile companies increased by 55%                  competitiveness of the US textile industry, due to the high and
and among apparel manufacturing companies – by as much                      constantly growing labor costs [12]. These changes took place
as 129.6%.                                                                  with different intensities in all regions and countries, especially
                                                                            in the EU countries. In Poland, they resulted in the development
                                                                            of a network of business relations and cooperation with the

Table 3. Product and business process innovative enterprises in textile industry by size and type in Poland during the period 2016–2018.

                                   Enterprises that introduced new or improved products or business processes during the
       Specification
                                                                      period 2016–2018
                                                                                                                New or
                                                Number of employees             New or improved products
                                                                                                             significantly
                                  Total                                                                       improved
                                                                                             Of which new      business
                                               50–249            ≥250             Total
                                                                                              to the market   processes
                                                                    % of total enterprises
 Manufacture of textiles          34.3              29.6              66.7                 26.4                 12.0                   29.2

      Manufacture of
                                  22.5              20.3              47.8                 11.8                  5.4                   18.9
      wearing apparel
Source: Own calculations based on Central Statistical Office data from the Statistical Yearbook of Industry 2019 [www.stat.gov.pl].

http://www.autexrj.com/                                                 3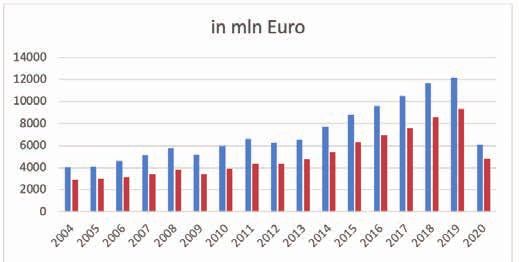
AUTEX Research Journal, DOI 10.2478/aut-2021-0021

Table 4. Enterprises in the textile industry using selected information and communications technology approaches.
                                                    Internet access                                                Enterprises
                                                                                                                     buying        Enterprises
                                                                                    Own
  Specification           Computers                                                            E-government         services       using social
                                          Total      Broadband     Mobile          website
                                                                                                                    in cloud          media
                                                                                                                   computing
                                                         % of total enterprises of a given economic activity
   Manufacture
                            95.9          95.9          95.9          58.9           71.3            91.1               6.6             21.5
    of textiles
   Manufacture
    of wearing              86.4          86.4          86.4          39.0           51.8            89.9               5.5             25.5
     apparel
Source: Own calculations based on Central Statistical Office data from the Statistical Yearbook of Industry 2019 [www.stat.gov.pl].

German textile industry. Poland, Romania, and Tunisia have                       The T&A supply chain includes raw materials, spinning,
played a key role in the subcontracting and outsourcing of                       weaving/knitting, and dyeing/finishing, as well as the producer
production processes by Germany for many years [13]. It is                       and the brand/customer. Their efficiency depends primarily on
worth emphasizing that the importance of technical textile                       the supply chain processes. Research from the Egyptian textile
production in Poland is strongly related to industrial customers                 industry shows that the planning-and-delivery process has the
and proves the effectiveness of the niche market strategy in the                 greatest impact on the overall performance of the supply chain.
production of apparel [14, 15]. The niche strategy is also used                  Sourcing and manufacturing affect the process to a lesser
in the Portuguese T&A industry, which is also strongly affected                  extent [24]. At the same time, the T&A supply chain, due to the
by globalization. However, it concerns the reorientation of                      overwhelming share of small- and medium-sized enterprises,
production toward high-quality niches, such as Portuguese                        faces a problem in terms of inclusion and participation of
cotton flannel and some synthetic fabrics [16]. The production                   these enterprises in global value chains [25]. This issue also
of clothing in the EU includes two categories: low- to medium-                   applies to small- and medium-sized enterprises operating in
priced products for the mass market, produced in countries                       the T&A sector in Poland, as they encounter real limitations
such as Poland, Hungary, Romania, and Portugal; and high-                        in co-creating the global supply chain. The problem refers to
end luxury apparel, made by developed members of the EU                          system integration and limitations in sharing production and
such as Italy, France, and Germany. International agreements                     sales data with other supply chain participants [26]. The key
such as the Trans-Atlantic Trade and Investment Partnership                      issue for Polish enterprises in the context of global expansion
(T-TIP) strengthen intraregional trade and constitute an                         in the competitive T&A market is the development of a firm-
opportunity for Poland in the production of apparel for the EU                   specific strategy, as shown by the example of companies such
mass market [17].                                                                as Zara and Uniqlo [27].

These changes have led to the emergence of trade patterns                        A large number of textile companies are outsourcing a variety
and industrial development in the T&A manufacturing sector                       of operations to developing countries, such as India, African
depending on the income gap between countries [18].                              countries, China, and Brazil, to reduce costs and avoid
Diversification of production in the textile industry is particularly            restrictive environmental and labor laws [28]. Therefore,
visible in relation to its innovation. Poland, together with                     questions about the effectiveness of actions taken by
peripheral regions in Spain, Italy, the Baltic States, and some                  enterprises in the supply chain are perfectly legitimate. When
Eastern European countries, forms the group of regions with                      outsourcing services, it is extremely important to control and
the lowest patent intensities in the EU [19]. In 2018, the number                evaluate textiles in the supply chain. It should cover all types
of national patent applications for the textile industry was 29                  of inspections and assessments during the entire textile
(including the paper industry) [Statistical Yearbook of Industry;                production process, primarily, quality control, along with the
Central Statistical Office 2019]. The opening of the EU textile                  assessment of the properties of textiles and the identification of
industry to products from China and the consequences resulting                   errors that occur in each link of the supply chain [29]. The main
from that fact are also worth noting. Research carried out in                    aim is to ensure that the quality of the finished textile products
Spain confirms the negative impact of introducing Chinese                        is at the customers’ expectation level [30]. Managing the
products into the EU market on the technical efficiency in the                   production of textile products in an effective supply chain refers
textile industry in the EU countries [20]. China, which is one of                to planning, organizing, monitoring, and controlling production
the largest producers of T&A, is shifting its production from the                activities such as line balancing and layout of production halls,
mid-range and low-end products to higher-quality and upstream                    as well as overall information flow management [31]. Supply
goods [21]. This has a negative impact on the competitiveness                    chain management in the textile industry, while requiring the
of T&A production in Poland, especially in the absence of                        coordination of both information flow and customer relations
global luxury brands [22]. In terms of international flows of the                activities, is certainly profitable but poses various challenges
products of the T&A industry, differences in technical efficiency                in terms of effective management [32]. Existing research on
are visible in the import of raw materials into Poland. They                     supply chain management in the T&A industry focuses on three
have a direct effect, for instance, on the scale of import of raw                core processes, namely, sourcing, production, and retailing
materials into Poland from Bangladesh [23].                                      (Table 5). It is conducted at two levels: industry; and supply-

http://www.autexrj.com/                                                      4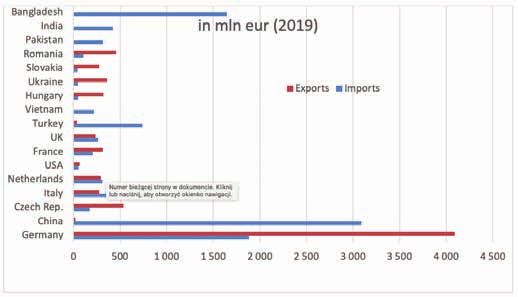
AUTEX Research Journal, DOI 10.2478/aut-2021-0021

Table 5. Research on textile and apparel supply chain management in the business field.

   Covered                                              Description                                          Research scope             Source
    topic
                                                             Sourcing of raw material
                      Methodological framework to characterize the geographical configuration                Adidas, Benetton,            [33]
                                      of a firm’s supplier and retailer networks                              C&A, and Puma
                               Examination of multisourcing triads in terms of coordination,                103 suppliers in the          [34]
                                              collaboration, and integration                                textiles-and-apparel
                                                                                                                   industry
                            Assessment of Haiti vs China as apparel-sourcing partners through              41 apparel companies           [35]
                             evaluation of macro-, supply-chain-, and microlevel environments
                               Examination of the trade-offs in sourcing and sales strategies                 Apparel industry            [36]
                                                                  Manufacturing
                           Identification of the essential steps in fashion product development               Apparel industry            [37]
                          processes, which include planning, product designing, manufacturing,
                                                   and product launching
                          Conceptualization of sustainable supply chain management (SSCM) to                    156 apparel               [38]
                          delineate mechanisms that facilitate the implementation of supply chain              manufacturers
                                                       sustainability
                        Identification and prioritization of the success factors and challenges             Swedish textile and           [39]
                           related to competitive manufacturing capabilities in a high-cost                  clothing industry
                      environment; identification of their potential to support future reshoring in
                                        textile and clothing (T&C) supply chains
                                                                      Retailing
                      Exploration of the drivers and barriers to omnichannel retailing in China,               Factories and              [40]
                       and attempts to understand how companies formulate their business                    distribution centers
                           strategies during their transformation to omnichannel retailing
                             Definition of C&T as the science of investigating the satisfaction              Conceptual paper             [41]
                                      processes of human clothing needs and wants
                          Project to balance the design, schedule, and cost of the production and              Major apparel              [42]
                                         logistics for a major apparel manufacturer                            manufacturer

chain actors, such as raw material suppliers, producers, and                 apparel sold in the value of the total production of goods sold
retailers. This allows understanding the specific relationships              in Poland in the period 2010–2018 ranges from 1.1% to 1.19%
and principles of creating supply chains that are focused on                 (Table 6).
customer expectations for products considering both the
changes in fashion and sustainability. It should be stressed that            It is worth noting that the increase in the value of the sold
while many studies are aimed at clarifying local and national                production of textiles and apparel in the analyzed period
supply chain management problems, they are considered                        stemmed mainly from the increase in the value of the sold
from the perspective of global dependencies between the raw
material base and the sales networks.

4. Changes in production and trade in the T&A

industry in Poland

The value of the total production sold in Poland, as well as
textiles and apparel, in the period 2010–2018 systematically
grew both in nominal and real terms. The value of total
production of goods sold in Poland in 2018, compared to 2010,
increased by as much as 50.86%, while simultaneously, the                    Figure 2. Value of the sold production of textiles and apparel in the
value of sold production of textiles and apparel increased by                period 2010–2018 in Poland.
                                                                             Source: Own calculations based on Central Statistical Office data from
44.3%. The share of the value of the production of textiles and
                                                                             the Statistical Yearbook of Industry 2019 [www.stat.gov.pl].

http://www.autexrj.com/                                                  5
AUTEX Research Journal, DOI 10.2478/aut-2021-0021
Table 6. Value of total production sold, as well as textiles and apparel, in the period 2010–2018 in Poland in nominal and real terms.*
Value of the
Total value of sold Total value of
Total value of sold total production
production of sold production
production of of textiles and Share in
goods in Poland of textiles and
Years goods in Poland apparel sold percentage of
in constant prices apparel in Poland
at current prices, in Poland in total value, in %
(2010 = 100), in at current prices,
in thousand euros constant prices
thousand euros in thousand euros
(2010 = 100)
2010 181,350,995.6 181,350,995.6 2,158,749.0 2,167,418.7 1.19
2011 208,034,394.1 193,340,514.9 2,287,079.0 2,211,875.2 1.10
2012 216,051,145.6 194,376,599.8 2,402,559.0 2,266,885.9 1.11
2013 219,517,191.5 200,096,177.5 2,432,426.3 2,315,909.8 1.11
2014 223,479,783.7 206,810,348.4 2,570,704.5 2,467,302.7 1.15
2015 228,437,710.7 216,153,846.6 2,668,673.0 2,551,126.1 1.17
2016 238,097,343.7 225,519,568.1 2,843,723.1 2,691,550.3 1.19
2017 259,099,138.1 238,495,546.9 2,920,185.5 2,797,490.9 1.13
2018 273,583,160.6 246,648,186.5 3,115,425.2 2,946,226.5 1.14
Year
150.86 136.00 144.31 135.93 95.80
2010=100
Previous
105.59 103.42 102.53 105.32 100.88
year=100
Note: *The euro exchange rate as on December 12, 2019, i.e., the update of data on the value of production sold in Poland (1 euro = PLN 4.2851);
https://www.nbp.pl/home.aspx?navid=archa&c=/ascx/tabarch.ascx&n=a240z191212.
Source: Own calculations based on Central Statistical Office data from the Statistical Yearbook of Industry 2019 [www.stat.gov.pl].
production of textiles by 63.16% because the increase in the and, compared to 2004, decreased by 0.52%. During this
value of production of apparel sold at that time amounted only period, export decreased by 0.97% and, in 2019, amounted to
to 21.04% (Figure 2). 3.92% of the total value of exports.
A particularly high increase in the value of textiles sold, by The largest import of T&A products to Poland in 2019 came
approximately 70%, was recorded for yarns and threads and from countries such as China, Germany, Bangladesh, and
other textile products, including two groups of products, i.e., Turkey. On the other hand, export from Poland was directed to
carpets, rugs and other textile floor coverings; and nonwovens Germany, the Czech Republic, Romania, and Ukraine (Figure
and goods made of nonwovens, which almost doubled the 4). Poland’s largest trade in T&A products is with Germany,
value of production in the analyzed period. Only the value of which is influenced by the proximity of both markets and the
the production sold of fabrics showed a drop in the value of deepening integration of the Polish and German economies.
production sold by 3.1% in the compared years (Table 7). It is affected by differences in labor costs. This also applies to
extended cooperation and integration of the T&A supply chain.
On the other hand, the analysis of the value of production of Based on the sections for “Textiles and textile articles” (Figure 5),
apparel sold shows that in the analyzed years, the value of the analysis of the export and import structure of T&A products
protective and work apparel produced in Poland increased by in 2019 showed that three sections have the largest share in
as much as 115%, where the strongest increase (by 27.2%) in
the value of production of this apparel was recorded in 2018
compared to the previous one. In 2018, compared to 2010, only
the value of the production of leather apparel sold decreased
by 10.2% (Table 8). This confirms the earlier forecasts about
the decreasing importance of the production of the leather
industry in Poland [43].
The domestic T&A market is highly dependent on the
relationship between imports and exports. In the years 2004–
2020, there was a constant lead of imports over exports of T&A
products (Figure 3), with a systematic increase in the value
of imports and exports. The share of the import value of T&A Figure 3. Exports and imports in Poland (2004–2020). Source: Own
calculations based on data from the Foreign Trade database of the
products in the total import value in 2019 amounted to 5.12%
Central Statistical Office.
http://www.autexrj.com/ 6AUTEX Research Journal, DOI 10.2478/aut-2021-0021
Table 7. Value of the sold production of textile products in Poland in the period 2010–2018 (in thousand euros).
Value of total textile products sold in Poland at current prices, in thousand euros
Other textile products
Years Nonwovens and
Yarn and threads Fabrics Other textiles Carpets, rugs,
goods made
and other textile
from nonwovens,
floor coverings
except apparel
2010 113,155.2 141,062.1 938,726.7 70,601.0 105,308.5
2011 144,239.8 129,252.6 1,013,546.0 91,158.6 124,218.9
2012 154,844.4 128,630.0 1,137,629.5 103,006.4 131,625.8
2013 140,526.3 135,254.3 1,166,172.2 112,598.8 142,305.9
2014 159,243.7 146,491.8 1,248,034.8 122,846.0 165,432.3
2015 170,579.0 141,030.0 1,357,591.3 133,319.5 180,203.1
2016 185,366.8 152,143.3 1,431,257.9 136,027.2 192,000.2
2017 184,666.2 130,770.0 1,494,020.9 137,193.5 200,732.1
2018 197,731.8 136,704.1 1,611,969.3 136,875.3 209,549.1
Year 2010=100 174.7 96.9 171.7 193.9 199.0
Previous
107.1 104.5 107.9 99.8 104.4
year=100
Source: Own calculations based on Central Statistical Office data from the Statistical Yearbook of Industry 2019 [www.stat.gov.pl].
Table 8. The value of production of clothes sold in Poland in the period 2010–2018 (in thousand euros).
Value of production of clothes sold in Poland at current prices, in thousand euros
Years
Other apparel
Workwear and
Leather apparel Other outerwear Underwear and clothing
protective wear
accessories
2010 5,488.1 101,768.5 365,381.4 158,589.9 124,716.8
2011 3,788.1 110,816.8 364,588.5 160,963.0 133,000.4
2012 4,704.4 123,597.6 342,440.5 167,038.7 140,201.6
2013 5,643.8 149,754.1 338,136.1 165,838.0 134,813.9
2014 4,662.8 150,210.6 350,186.9 171,091.4 139,749.6
2015 4,456.4 155,324.8 365,139.8 167,454.3 118,570.9
2016 4,422.3 153,457.0 389,748.0 195,254.4 140,565.7
2017 4,188.8 172,463.5 374,261.5 214,531.7 150,206.9
2018 4,926.6 219,316.3 399,010.2 218,472.0 148,780.0
Year 2010=100 89.8 215.5 109.2 137.8 119.3
Previous
117.6 127.2 106.6 101.8 99.1
year=100
Source: Own calculations based on Central Statistical Office data from the Statistical Yearbook of Industry 2019 [www.stat.gov.pl].
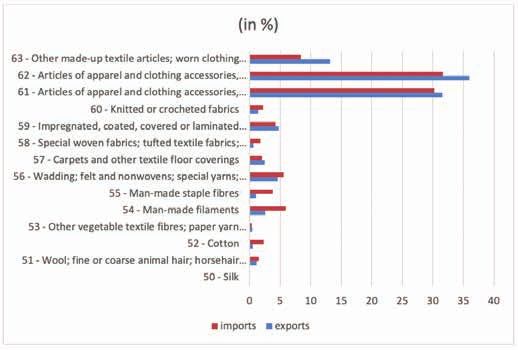
the structure of exports and imports: 62 (Articles of apparel and articles; rags). Their total share in total exports amounted to
clothing accessories, not knitted or crocheted), 61 (Articles of 80.7%, and the share in total imports was 70.3%.
apparel and clothing accessories, knitted or crocheted), and 63
(Other made-up textile articles; worn clothing and worn textile
http://www.autexrj.com/ 7AUTEX Research Journal, DOI 10.2478/aut-2021-0021
global market, with particular emphasis on the German market.
We may conclude that the supply chain of the T&A industry in
Poland, as in other EU countries, is an accepted concept limited
by different trade factors within the EU. Examples of import
and export cases discussed in the paper provide valuable
indicators for how theoretical concepts of supply chain can be
successfully applied in practice. However, this study has also
shown that the studied supply chain is experiencing uncertainty
and facing the challenge of removing trade boundaries in
textile industries among European countries. This research
is an example of a cross-disciplinary analysis that becomes
increasingly applicable to the dynamic and integrated supply
chains in the European T&A industry. It provides important
Figure 4. Exports and imports of textiles and textile articles (2019).
insights for researchers seeking solutions for import- and
Source: Own calculations based on data from the Foreign Trade
database of the Central Statistical Office. export-related problems of supply chains.
References
[1] Jabłońska, M., Stawska, J., Czechowska, D. I. (2020).
County-specific determinants of textile industry
development in Poland: Comparative analysis of the Years
2007 and 2017. Autex Resarch Journal, 20(2), 186–193.
doi: 10.2478/aut-2019-0064.
[2] Department of Strategy and International Analysis. (2017).
Apparel industry: Increasing importance of polish exporters
in the world. Retrieved from https://wspieramyeksport.pl/
api/public/files/1068/PKO_BRANZA_ODZIEZOWA.pdf
[3] Amed, I., Berg, A., Brantberg, L., Hedrich, S. (2020). The
state of fashion, McKinsey. Colourage, 63(12), 42–43.
[4] Euratex (2020). Facts & Key Figures of the European
Textile and Clothing Industry.
[5] Dezi, L., Del Giudice, M. (2014). Economic performance
Figure 5. Structure of exports and imports of textiles and textile articles and capital structure choices: A nonparametric analysis of
(2019). Source: Own calculations based on data from the Foreign
the southern Italian textile-clothing industry. International
Trade database of the Central Statistical Office.
Studies of Management and Organization, 44(1), 42–54.
doi: 10.2753/IMO0020-8825440103.
5. CONCLUSION
[6] Molina-Morales, F. X., Expósito-Langa, M. (2012). The
impact of cluster connectedness on firm innovation: R&D
The research shows that the T&A industry production in
effort and outcomes in the textile industry. Entrepreneurship
Poland, similarly to that in other EU countries, is based on and Regional Development, 24(7–8), 685–704. doi:
small companies. However, the number of small companies 10.1080/08985626.2012.710260.
in Poland is several percentages lower than the EU average. [7] Lim, M. (2003). The development pattern of the global textile
The research revealed very low innovation in the production of industry and trade: Part I: Evidence from textile exports
T&A products, which is influenced by the fact that the industry of the ec, the far east, and emerging textile exporting
is classified as a low-technology industry. In addition, final countries in the 1980s. Journal of the Textile Institute,
products dominate in the import structure, which indirectly 94(1–2), 32–52. doi: 10.1080/00405000308630618.
inhibits the development of product innovation at the level of [8] Chester, K. M., To, Z.M, Z., Chun-sun, L., Jimmy M.T,
searching for new solutions in the field of material engineering C., K.L, M. (2005). Trade liberalization in the post-MFA
and innovative materials for the T&A industry. Innovation is also regime: The influences of CEPA and quota phasing-out on
not favored by the existing model of cooperation with Germany Hong Kong’s Textiles and Clothing Manufacturing Industry.
based on outsourcing production to Polish companies. The Research Journal of Textile and Apparel, 9(4), 70–76. doi:
study demonstrated that the increase in the value of the sold 10.1108/RJTA-09-04-2005-B007.
production of the T&A industry in Poland related mainly to [9] Keenan, M., Saritas, O., Kroener, I. (2004). A dying
textile products and, to a lesser extent, apparel. The production industry - or not? The future of the European textiles
of workwear is an exception, which indicates the progressive and clothing industry. Foresight, 6(5), 313–322. doi:
specialization of the industry and the development of strategies 10.1108/14636680410563016.
based on filling market niches. The supply chain of the T&A [10] Ostrowska, E., Lu, S., Kowalewska, M., Jachuła, M.,
industry in Poland, as in other EU countries, adapts to the Huml, I., et al. (2012). Is technological change really skill-
changing preferences of customers. The key to its development biased? Evidence from the introduction of ICT on the
Italian textile industry (1980-2000). Journal of Fashion
from the perspective of supply chain management is the supply
Marketing and Management, 11(1), 2842–2854. doi:
chain planning and quick reaction to changes occurring on the
10.1108/13612020710734427.
http://www.autexrj.com/ 8AUTEX Research Journal, DOI 10.2478/aut-2021-0021
[11] Baccini, A., Cioni, M. (2010). Is technological change really [24] Abdelsalam, H. M., Fahmy, G. A. (2009). Major variables
skill-biased? Evidence from the introduction of ICT on affecting the performance of the textile and clothing
the Italian textile industry (1980-2000). New Technology, supply chain operations in Egypt. International Journal of
Work and Employment, 25(1), 80–93. doi: 10.1111/j.1468- Logistics Research and Applications, 12(3), 147–163. doi:
005X.2009.00240.x. 10.1080/13675560902729334.
[12] Lim, M., Suh, M. W., Gaskill, L. (2009). Economic analysis [25] Chen, C. L. (2019). Value creation by SMEs participating
of US textile production activities under the North American in global value chains under industry 4.0 trend: Case
Free Trade Agreement. Journal of the Textile Institute, Study of Textile Industry in Taiwan. Journal of Global
100(7), 612–625. doi: 10.1080/00405000802125170. Information Technology Management, 22(2), 120–145.
[13] Kooli, K., Wright, L. T., Wright, A. (2010). Business doi: 10.1080/1097198X.2019.1603512.
implications in the subcontracting alliance life cycle: Case [26] Kuo, T. C., Hsu, C. W., Huang, S. H., Gong, D. C.
examples from the Tunisian clothing and textile industries. (2014). Data sharing: A collaborative model for a green
Journal of Business and Industrial Marketing, 25(5), 372– textile/clothing supply chain. International Journal of
382. doi: 10.1108/08858621011058133. Computer Integrated Manufacturing, 27(3), 266–280. doi:
[14] Adler, U. (2004). Structural change: The dominant 10.1080/0951192X.2013.814157.
feature in the economic development of the German [27] Anwar, S. T. (2017). Zara vs. Uniqlo: Leadership strategies
textile and clothing industries. Journal of Fashion in the competitive textile and apparel industry. Global
Marketing and Management, 8(3), 300–319. doi: Business and Organizational Excellence, 36(5), 26–35.
10.1108/13612020410547815. doi: 10.1002/joe.21805.
[15] Parrish, E. D., Cassill, N. L., Oxenham, W. (2006). Niche [28] Guarnieri, P., Trojan, F. (2019). Decision making on supplier
market strategy in the textile and apparel industry. Journal selection based on social, ethical, and environmental
of Fashion Marketing and Management, 10(4), 420–432. criteria: A study in the textile industry. Resources,
doi: 10.1108/13612020610701956. Conservation and Recycling, 141, 347–361.
[16] Truett, L. J., Truett, D. B. (2019). Challenges in the [29] Ã, Y. L., Wang, Y., Yu, C. (2010). Int. J. production
Portuguese textile and clothing industry: A fight for economics investigating the drivers of the innovation
survival. Applied Economics, 51(26), 2842–2854. doi: in channel integration and supply chain performance :
10.1080/00036846.2018.1558362. A strategy orientated perspective. Intern. Journal of
[17] Lu, S. (2018). Trans-Atlantic Trade and Investment Production Economics, 127(2), 320–332. doi: 10.1016/j.
Partnership: an opportunity or a threat to the EU textile ijpe.2009.08.009.
and apparel industry? Journal of the Textile Institute, [30] Djokaj, A., Vatin, N. (2015). Logistics in the Function
109(7), 933–941. doi: 10.1080/00405000.2017.1388345. of Customer Service – Relevance for the Engineering
[18] Kilduff, P., Chi, T. (2007). Analysis of comparative Management, 117, 802–807. doi: 10.1016/j.
advantage in the textile complex: A study of Eastern proeng.2015.08.255.
European and former Soviet Union nations. Journal of [31] Ngai, E. W. T., Peng, S., Alexander, P., Moon, K. K. L.
Fashion Marketing and Management, 11(1), 82–105. doi: (2014). Decision support and intelligent systems in the
10.1108/13612020710734427. textile and apparel supply chain: An academic review of
[19] Giannini, V., Iacobucci, D., Perugini, F. (2019). Local variety research articles. Expert Systems with Applications, 41(1),
and innovation performance in the EU textile and clothing 81–91.
industry. Economics of Innovation and New Technology, [32] Marsillac, E., Johnson, E. (2010). Global supply chain
28(8), 841–857. doi: 10.1080/10438599.2019.1571668. adaptations to improve financial performance Supply base
[20] De Jorge-Moreno, J., Carrasco, O. R. (2015). Technical establishment and logistics integration, 22(2), 204–222.
efficiency and its determinants factors in Spanish textiles doi: 10.1108/17410381111102225.
industry (2002–2009). Journal of Economic Studies, 42(3), [33] Kalchschmidt, M., Birolini, S., Cattaneo, M., Malighetti,
346–357. doi: 10.1108/JES-06-2013-0085. P., Paleari, S. (2020). The geography of suppliers and
[21] Wu, H. L., Chen, C. H., Chen, L. T. (2012). Determinants retailers. Journal of Purchasing and Supply Management,
of Foreign Trade in China’s Textile Industry. 26(4), 100626. doi: 10.1016/j.pursup.2020.100626.
International Trade Journal, 26(2), 112–138. doi: [34] Vlachos, I., Dyra, S. C. (2020). Theorizing coordination,
10.1080/08853908.2012.657586. collaboration and integration in multi-sourcing triads (B3B
[22] Arienti, P., Casale, M., Lee, V., Scaramuzzi, V., Sahu, triads). Supply Chain Management, 25(3), 285–300. doi:
P., et al. (2019). Global powers of luxury goods 2019: 10.1108/SCM-01-2019-0006.
Bridging the gap between the old and the new. Deloitte [35] Uluskan, M., Godfrey, A. B. (2018). Business environment-
Touche Tohmatsu Limited., 1–46. Retrieved from https:// supply chain framework and benchmarking supply chain
www2.deloitte.com/content/dam/Deloitte/ch/Documents/ structures: Haiti versus China. Benchmarking, 25(8),
consumer-business/deloitte-en-cip-global-powers-of- 3021–3044. doi: 10.1108/BIJ-11-2017-0293.
luxury-goods-2019-report.pdf. [36] Phadnis, S. S., Fine, C. H. (2017). End-to-end supply chain
[23] Jaforullah, M. (1999). Production technology, elasticity strategies: A parametric study of the apparel industry.
of substitution and technical efficiency of the handloom Production and Operations Management, 26(12), 2305–
textile industry of Bangladesh. Applied Economics, 31(4), 2322. doi: 10.1111/poms.12779.
437–442. doi: 10.1080/000368499324147. [37] Fung, Y.-N., Chan, H.-L., Choi, T.-M., Liu, R. (2021).
Sustainable product development processes in fashion:
Supply chains structures and classifications. International
Journal of Production Economics, 231. doi: 10.1016/j.
ijpe.2020.107911.
http://www.autexrj.com/ 9AUTEX Research Journal, DOI 10.2478/aut-2021-0021
[38] Roy, V., Silvestre, B. S., Singh, S. (2020). Reactive and [41] Ha-Brookshire, J. E., Hawley, J. M. (2013). Envisioning
proactive pathways to sustainable apparel supply chains: the Clothing and Textile-Related Discipline for the 21st
Manufacturer’s perspective on stakeholder salience and Century Its Scientific Nature and Domain From the Global
organizational learning toward responsible management. Supply Chain Perspective. Clothing and Textiles Research
International Journal of Production Economics, 227. doi: Journal, 31(1), 17–31. doi: 10.1177/0887302 x12470024.
10.1016/j.ijpe.2020.107672. [42] Dai, H., Tseng, M. M. (2011). Determination of production
[39] Pal, R., Harper, S., Vellesalu, A. (2018). Competitive lot size and DC location in manufacturer-DC-retailer
manufacturing for reshoring textile and clothing supply supply chains. International Journal of Logistics
chains to high-cost environment: A Delphi study. Systems and Management, 8(3), 284–297. doi: 10.1504/
International Journal of Logistics Management, 29(4), IJLSM.2011.038988.
1147–1170. doi: 10.1108/IJLM-10-2017-0270. [43] Biadała, A., Sadowski, A., Więcek, J. (2009). Prognozy
[40] Ye, Y., Lau, K. H., Teo, L. K. Y. (2018). Drivers and barriers rozwoju przemysłu skórzanego na tle innych sektorów
of omni-channel retailing in China: A case study of the gospodarki. Przegląd Włókienniczy-Włókno, Odzież,
fashion and apparel industry. International Journal of Skóra, 39–42.
Retail and Distribution Management, 46(7), 657–689. doi:
10.1108/IJRDM-04-2017-0062.
http://www.autexrj.com/ 10You can also read