POLITICAL UNCERTAINTY, MARKET STRUCTURE AND THE FORMS OF STATE CAPTURE
←
→
Page content transcription
If your browser does not render page correctly, please read the page content below
P OLITICAL U NCERTAINTY, M ARKET S TRUCTURE
                           AND THE F ORMS OF S TATE C APTURE

                          Nathan Canen, Rafael Ch and Leonard Wantchekon
              University of Houston, New York University, and Princeton University & ASE

         A BSTRACT. A vast literature has shown the existence of many different forms of state capture by
         firms: from more direct strategies including patronage or appointments to the bureaucracy, to more
         complex and indirect methods such as lobbying. This paper studies when and why do firms prefer
         a more direct to a more indirect means of capture. Using a novel database on contractual arrange-
         ments between politicians, political brokers and businessmen in Benin, we find that an increase in
         political uncertainty is associated with an increase in direct forms of capture. We rationalize our
         findings through a principal-agent model under political uncertainty. Firms induce market distor-
         tions that benefit them by making transfers to incumbents. Direct capture acts as an insurance for
         the firm, guaranteeing that its paid for distortions are kept in place even when the incumbent is
         displaced. We structurally estimate our model and find that incumbents and younger legislators are
         more easily captured by firms, consistent with the importance of connections and career concerns.
         Finally, we show that policies thought to decrease state capture, such as improved bureaucrat selec-
         tion, can have little to no effect once substitution towards indirect control are accounted for. As a
         result of our findings, even though electoral competition could contribute to democratic consolida-
         tion through political turnover, it can lead to worsening corruption and economic outcomes through
         increasing state capture by business elites.

         JEL C LASSIFICATION : D72, D78, H57, O17.

      Date: March 31st, 2020.
      We acknowledge generous funding from DFID (UK) managed by ADE. Lazare Kovo provided superb research
assistance, as well as support from the Institute of Empirical Research in Political Economy (IERPE). We thank Perry
Carter, Gabor Nyeki and seminar participants at various institutions for valuable comments.

Canen: Department of Economics, University of Houston.
Email: ncanen@uh.edu

Ch: Wilf Family Department of Politics, New York University.
Email: rafael.ch@nyu.edu

Wantchekon Department of Politics and Woodrow Wilson School of Public & International Affairs, Princeton
University; and African School of Econommics.
Email: lwantche@princeton.edu - Corresponding author.
                                                          1
2
1. Introduction
The influence of firms on politics is the subject of much discussion and scrutiny by both the pub-
lic and the media. Interest in this subject has only increased with recently revealed cases that have
shaken the economic performance and stability of many governments around the world. Salient
examples include the billions received by the Gupta brothers under the Jacob Zuma government
in South Africa and the influence obtained by Odebrecht and JBS in the Brazilian government
and development banks, with its effects spreading across South America and parts of Africa. The
developed world is not immune, as the Siemens bribery scandal, the SNC Lavalin case in Canada,
and ongoing investigations about the influence of U.S. conglomerates on regulation and policy
show, amongst others.1
These issues are studied in academia, with a vast literature showing the existence of multiple
forms of state capture and firm strategies to influence politicians, as well as how these strategies
respond to incentives in different environments. The evidence spans more direct mechanisms
of capture, such as bribes to politicians (Rose-Ackerman, 1975; Svensson, 2003), bureaucratic
control (see Dal Bó, 2006 for a review of the regulatory case) and favorable loans and campaign
financing (e.g. Hall and Wayman, 1990; Faccio, 2006; Khwaja and Mian, 2005; Acemoglu et
al., 2016; Claessens et al., 2008, amongst others), to more indirect ones, including lobbying
through advertisement and media (DellaVigna et al., 2016), career concerns and revolving doors
(Mattozzi and Merlo, 2008; i Vidal et al., 2012; Fisman et al., 2014), charitable donations to
organizations in one’s district (Bertrand et al., 2019) and even a hidden chain of influence through
secondary firms and charities that affects legislation (Bertrand et al., 2018).2 While this important
literature has focused on the existence and magnitude of these different mechanisms, it has left
largely unexplained how businesses choose amongst the different forms of interactions, and how
those choices respond to the political environment. Why do firms sometimes prefer to capture
politicians in a more direct or indirect way? When is one type of strategy preferable? What are
the welfare implications of these choices, and how can state capture be curbed in this setting?
The present work fills this gap.
1
For further details, for example, see:
“State capture: how the Gupta brothers hijacked South Africa using bribes instead
of bullets”, Vanity Fair (March, 2019). https://www.vanityfair.com/news/2019/03/
how-the-gupta-brothers-hijacked-south-africa-corruption-bribes
“Brazil’s Odebrecht corruption scandal explained”, BBC (April 17, 2019). https://www.bbc.com/news/
business-39194395
“At Siemens, Bribery Was Just a Line Item”, New York Times (December 20, 2008). https://www.nytimes.com/2008/
12/21/business/worldbusiness/21siemens.html
“What you need to know about the SNC-Lavalin affair”, CBC (February 13, 2019). https://www.cbc.ca/news/
politics/trudeau-wilson-raybould-attorney-general-snc-lavalin-1.5014271
“The Corporate Capture of the United States”, Harvard Law School Forum on Corporate Gover-
nance & Financial Regulation (January 5, 2012). https://corpgov.law.harvard.edu/2012/01/05/
the-corporate-capture-of-the-united-states/.
2
The aforementioned empirical evidence stretches through many settings, including the U.S., Pakistan, Uganda,
Italy, Brazil among others.3
We collect a novel database on contractual arrangements between politicians and firms in Benin
- a country that exemplifies a democracy subject to firm influence and capture.3 Using a variety
of statistical methods to appropriately sample this data, including chain-referral (snowballing)
techniques and a list experiment, we create a dataset of more than 300 Beninese politicians
(Deputies, Ministries, Mayors, etc.) covering Benin’s 12 departments, 20 of the 24 electoral dis-
tricts (circumscriptions) and 52 of the country’s 77 communes. One main innovation in this data
is the availability of the types of relationships between businesses and politicians: whether they
are direct (e.g. bureaucratic control, patronage, public procurement), or more indirect (support
for future candidates, financial refunds). This variable is matched to politician and commune-
level characteristics. We use this information to show that higher political uncertainty for mayors,
such as those due to an increase in electoral competition, is associated with: more direct capture,
more control of the government by firms, less transfers from the government to corporations, and
lower spending preferences over non-visible public goods.
While a first specification is based on observed correlations controlling for many local factors,
a second identification strategy explores variation introduced by a nationwide electoral reform
that collapsed the number of parties across the country from hundreds to only two. This re-
form, designed at the national level, affected electoral uncertainty differently across communes,
depending on their previous electoral environment. We use it to compare communes that had
multiple parties competing for office and, suddenly, were affected by the reform (our treatment
group, with higher electoral competition) to communes that already had a de-facto two-party
system (our control). As before, we find that those communes that experience an increase in
electoral uncertainty face an increase in firms’ preference for direct forms of state capture. Our
results are robust to this second variation and a variety of controls and placebo tests.
We rationalize these findings with a principal-agent model of a profit-maximizing firm and a
politician running for election (e.g. an incumbent mayor). A firm wishes to capture the mayor,
who is able to affect market distortions in exchange for payments/rents. These distortions in-
crease the firm’s profit, at the cost of decreasing consumer surplus and market efficiency. Examples
of such distortions include regulations and taxes that primarily affect only a firm’s competitors,
which would increase the competitors’ marginal costs, similar to the wedges in Hsieh and Klenow
(2009). This would increase profits to the connected firm and decrease entry in that market.
However, political uncertainty implies that payments made by the firm to the incumbent might be
lost - the incumbent might be removed in an election before (s)he is able to implement the agreed
upon market distortions. In this setting, more direct forms of state capture “complete the con-
tract” between firms and the state, insuring the firm that distortions will be maintained even if the
incumbent loses. Intuitively, if the firm has its own preferred bureaucrats appointed in the state,
having an incumbent lose an election is less damaging to its profits since their preferred policies
can still be implemented by the bureaucrats themselves. Direct control is then more valuable
when electoral uncertainty is higher, since the value of this insurance is higher. This rationalizes
3
In the next section, we provide institutional background about Benin, and the influence of firms on government
in this environment, as well as background on the electoral reform used in one identification approach.4
our empirical finding that government control by firms increases in times of higher electoral com-
petition. On the other hand, the amount that is transferred from firms to politicians increases in
times of low electoral uncertainty, as the incumbent is able to extract more compensation from
the firm’s rents to implement market distortions. Finally, we provide a microfoundation for the
model whereby direct control can be interpreted as a firm is directly incentivizing bureaucrats to
implement their desired distortions themselves, without the legislator forcing them to do so. For
instance, a firm can capture a bureaucrat directly, or appoint one from among its former employ-
ees for that goal (i.e. using revolving doors). Those bureaucrats implement a firm’s preferred
distortions even if the incumbent is removed.
We structurally estimate our model with the goal of quantifying the trade-offs in the choices
of the forms of state capture, as well as welfare effects of counterfactual policies. Exploring the
equilibrium structure of our model for identification, we find that, all else constant, younger
politicians and incumbents are more likely to be captured by firms. This is consistent with them
having preferences weighing consumers’ ‘welfare less relative to firms’. One interpretation for the
first set of results is the role of career concerns (e.g. Mattozzi and Merlo, 2008), as relationships
with firms are more desirable for future campaign financing and political careers for younger
politicians. For incumbents, the results are consistent with firms having higher values of being
connected with them. We also find evidence that direct forms of capture are more prominent in
communes with larger population and lower amounts of state capacity. Higher population can
be a proxy for market size, suggesting that larger markets are more attractive to firms, possibly
because of higher profits. As a result, market distortions are more desirable and there is a higher
risk from losing them. Meanwhile, lower state capacity would imply higher amount of rents for
legislators and firms, possibly through lower monitoring of local-firm contractual arrangements
and their consequences on consumer surplus.
We then show that policies suggested to decrease state capture, including improved selection of
competent bureaucrats and legislators, might not actually accomplish those goals. This is because
we introduce another margin through which businesses can react: it is not just the amount of state
capture, but “how” this control is implemented. When firms can switch the form of government
capture, they can react to undo the effects of these policies, leaving the level of capture close to
intact.4
We draw a novel insight from these findings: democracies that have high levels of competi-
tion and high political turnover, traits often viewed as desirable and healthy for a democracy,
might allow more direct and more damaging state capture by special interest groups. As long
as businesses are able to influence political decision making and policy, our findings suggest the
possibility of a democratic backslide of increasing state capture and instability provoked by this
environment, with perverse consequences for trust in institutions and economic growth (Fisman
4
In addition to the aforementioned literature on the different types of (mutually beneficial) relationships between
firms and politicians, our paper also contributes to the literature on crony capitalism and state capture (e.g. Bai et al.,
2014), by focusing on firms’ strategic responses to political uncertainty, as well as of clientelistic contracts between
politicians and brokers (see Larreguy et al., 2016, for example) by focusing on firms’ active role in this process.5
and Svensson, 2007). This conclusion brings into question whether voter information is suffi-
cient to restore full accountability (as those found in Ferraz and Finan, 2008, 2011; Fujiwara and
Wantchekon, 2013, for example). While voters can hold legislators accountable through reelec-
tion in our setting, electoral turnover is insufficient to curb state capture and can, instead, increase
distortions. Hence, being able to remove an incumbent through voting is insufficient as a mech-
anism for improving welfare when firms are able to switch among forms of government control.
Our counterfactuals indicate an improved route is through policies that improve the selection of
politicians, regardless of political competition. This suggests a role for grassroots movements, for
example, that can select candidates, keep incumbents accountable and provide a countervailing
force to firms’ influences.
In the next section, we provide a brief overview of the institutional background which guides
our empirical methodology, followed by details of the data collection. Our reduced form results
based on this data motivate the model which is presented and then structurally estimated.
2. Benin’s Institutional Background: A very brief review of History, Politics
and the 2018 Electoral Reform
The Republic of Benin, previously the Kingdom of Dahomey, was colonized by France in 1894
and became independent in 1960. A political turmoil period following independence lasted until
1972, with Mathieu Kerekou’s eighteen-year dictatorship. In 1990, Benin became the first African
country to transition democratically from a dictatorship, a transition regarded as a model for Sub-
Saharan Africa. A representative assembly of all political factions was convened by the military
regime due to mass protests and French economic pressure. The result was the creation of a
new constitution and a multiparty system with regular elections for local mayors and councils,5
parliament (83 members directly elected under proportional representation with closed-lists in 24
multi-member constituencies or districts, two for each of the country’s 12 departments)6 and the
presidency (a simple majority with runoff elections if no candidate reaches majority in the first
round), from 1990 onwards. Voting is not compulsory.
Benin has over 3,000 villages (rural) or quartiers (urban) in 77 communes, and they vary
widely in the type of productive activities as well as in their political competition. Benin has been
5
There are 77 communes governed by a mayor. Communes are divided into local arrondisements led by a chief.
Mayors, delegates and deputies are appointed by communal councils made of members elected by majority each which
represents a local district. Similarly, chiefs are appointed by village councils. Citizens can vote freely for different
parties for the communal and village-level councils. However, the norm is to ‘vote the list’ and choose the same
political party. If a party wins by majority, they take all council positions; without majority, multi-party governments
are formed.
6
Party lists at the district level have the same number of candidates as seats to be filled. Seats are allocated to
the different lists through a department level (simple) quotient. The remaining seats are allocated using the greatest
remainder rule. For more detail on Benin’s National Assembly, see the description of the Inter-Parliamentary Union at
http://archive.ipu.org/parline-e/reports/2033_B.htm6
characterized by a high level of corporate capture of local and national politics, while experiencing
what has been labeled as a successful democracy in the past decades.7
Starting with the new constitution in 1990, Benin’s electoral system had over 200 parties in a
country with a population of approximately 12 million, of which over 5 million were registered
to vote.8 The large majority of them were weak and small, with coalitions and party alliances
commonplace (Creevey et al., 2005; Gisselquist, 2008, 2014). This was partly a result of electoral
rules, whereby a party or coalition could only participate in an electoral contest if it presented a
candidate list in each district. Party switching became commonplace resulting in a highly fluid
party system, centered around public figures rather than political programs.9 Once elected to Par-
liament, groups formed larger blocs as a result of negotiation between leaders and the president.
Since 1991, all national executives have secured majority in the legislature. However, in Sep-
tember 2018, the National Assembly (Benin’s Unicameral Parliament) passed an electoral reform
that increased the barriers to register political parties in national and local-level elections. Among
many changes, the reform raised the monetary deposit required for the registration of candidates
in lists from USD$15,000 (8.3 million CFA) to USD$440,000 (249 million CFA), decreased the
amount of state resources to fund campaigns by 50% for local-level elections, introduced cam-
paign caps and restricted former custom officers and forest agents to run for legislative seats
unless they had resigned one year prior to the election (Duerksen, 2019).10 Furthermore, the
reform established a 10% threshold for party lists to win representation in parliament, forcing
small parties to form alliances.
The 2018 reform collapsed the number of parties to just 10. However, only 5 of those achieved
registration status. After registration, the Constitutional Court disallowed 3 out of the 5 remaining
parties to compete for seats at the National Assembly since they lacked a “certificate of confor-
mity” issued by the Ministry of Interior albeit unstipulated in electoral laws. As a result, only two
political options were available for the April 2019 elections: the Republican Bloc and the Pro-
gressive Union, two movements close to President Talon. After the elections, these two coalitions
fully controlled the National Assembly with 56.2% (47 seats), and 43.8% of the vote (36 seats),
respectively (Election Guide, Democracy Assistance and Elections News, 2019).
The reform’s origins can be traced to a change in the Charter of Political Parties by the National
Assembly in July 2018 that forced political parties to cover the national territory and expand the
7
Benin has been pointed out as a case of thriving democratization mixed with weak governance and varying but
low level of local state capacity. Figure 1 shows that the median winning margin for local elections is close to one digit
(10.7%). Competitiveness decreases for legislative elections.
8
In 1991, 79 parties registered for elections; in 1998, the number increased to 118 (Gisselquist, 2014); by 2015
more than 200 parties held registration.
9
Parties/coalitions hold similar ideological platforms and are better identified by their ethnic and regional voter
base. For more detail on the party system see Gisselquist (2014).
10
See also the news articles “The Fall of a Model Democracy,” The Atlantic, May 29, 2019,
https://www.theatlantic.com/international/archive/2019/05/benin-west-africa-model-democracy-fall/
590377/, and
“How Benin’s democratic crown has slipped”, BBC, May 6, 2019,
https://www.bbc.com/news/world-africa-481500067
presence of ethnic and regional associations.11 Parties had to recruit 15 founding members in
each of the 1,155 communities nationwide. Legislators then passed the September 2018 electoral
reform law. Supporters argued it was a necessary legislation to combat political party fragmen-
tation, to promote larger political blocs and to promote legislative and local effectiveness. The
restrictions it imposed led to the main opposition parties failing to gather the required documen-
tation within the established deadline and, as a consequence, they did not participate in the April
28th, 2019 elections. According to President Talon, democracy did not seem at risk since the two
blocs allowed were formed by a large number of of parties that allowed for a good enough level
of representativeness.12
Opponents of the reform have noted that the entry barriers and campaign costs it promoted led
to a strengthening of government control over Parliament and local elections, and a decrease in
turnout (from 65% in 2015 to only 27% in 2019). During the election, opposition parties moved
to boycott the elections through mass demonstrations, facing government repression and Internet
shut down increasing the country’s political tension. The result were multiple deaths and over
200 reported post-election incidents. Voting was prevented in 39 out of 546 districts in Benin.13
Regarding campaign financing, candidates can request reimbursements for campaign expenses
from the state. However, in practice this does not happen (Gisselquist, 2014) and party funding
laws are constantly violated (Akpovo, 1997). As a result, a large proportion of campaign financing
comes from corporations and is kept off the books (Bako-Arifari, 1995; Bierschenk, 2009). In
Appendix A, we give further details about the institutional and symbiotic relationship between
businesses, politicians and campaign financing.
3. Data
To test how political competition affects firms’ preference for more direct forms of state capture,
we collect data of international and domestic companies and electoral politics at national and local
levels in Benin which covering the 2015 and 2019 elections. We rely on a database on contractual
arrangements between politicians, political brokers and firms in Benin. As noted by Wantchekon
(2003), the country’s institutional development has allowed for clientelistic promises to narrow
groups of citizens and favored private use of local government resources.
11
Présidence de la République,“Loi No. 2018-23 du 17 septembre 2018 portant charte des partis politiques en
République du Bénin,” 17 septembre 2018: https://sgg.gouv.bj/doc/loi-2018-23/.
12
President Patrice Talon in “Le moment politique,” a Beninese television program (Youtube 2019).
13
See, for example, the articles:
“How Benin’s democratic crown has slipped”, BBC, May 6, 2019, https://www.bbc.com/news/
world-africa-48150006
“Benin: Internet shutdown on election day is a blunt attack on freedom of expression”,
Amnesty International, April 28, 2019, https://www.amnesty.org/en/latest/news/2019/04/
benin-internet-shutdown-on-election-day-is-a-blunt-attack/
Republic of Benin. Election Guide, Democracy Assistance and Elections News, http://www.electionguide.org/
countries/id/24/
“Record low turnout at Benin polls with no opposition”’, France 24 from Agence France-Presse, May 1, 2019,
https://www.france24.com/en/20190501-benin-election-record-low-turnout-no-opposition-boycott.8
To measure contractual choice, we carried out structured interviews of key players including
campaign managers, local brokers and politicians and candidates, among others. These were
conducted by the Institute of Empirical Research in Political Economy (IERPE). A copy of the
questionnaire that was administered is available on the authors’ personal websites.14 The result
is a sample of more than 300 Beninese politicians (Deputies, Ministries, Mayors, etc.) as well as
political brokers covering Benin’s 12 departments, 20 of the 24 electoral districts, and 52 out of
the country’s 77 communes. For many of our main specifications, we will focus on the subset of
mayors, who have control over policy and direct relationships with firms, while comparing their
results to Deputies who face a different set of incentives.
Data collection took place in Beninese constituencies between February 6th and February 21st,
2019. Given the difficulty in identifying potential subjects to survey, a snowball sampling tech-
nique (or chain-referral sampling) was used, i.e. a non-probability sampling technique where
existing politicians surveyed recruit future subjects from among their acquaintances. Prior to
the interviews, the comptroller arranged an appointment with the politician via a phone call to
establish the contact between the latter and his enumerators to prepare the interview. Then, enu-
merators met the politician either alone, or in a team of two or three, depending on the category
(national or local) and/or the agenda of the latter to conduct the interviews.
Reconstructing contractual arrangements between politicians and firms based on recall has
multiple difficulties. A salient one is the presence of measurement error due to imperfect recall
and biased reporting due to sensitive information. To address such challenges, firm owners, firm
managers as well as political campaign managers were used to cross-validate the responses of
politicians and brokers. Cross-validation from eyewitnesses in the presence of social desirability
bias has proven to yield reliable information in past studies (see Sanchez de la Sierra, 2020, for
instance, where survey responses are contrasted to on the ground specialists in order to detect
and correct reporting biases). We describe further details in Appendix. An additional concern
is selection bias based on respondents’ location. Appendix Table D-2 shows that this does not
appear to be the case: we find no statistically significant differences in socio-economic or political
characteristics between the 52 communes in our sample and the 25 not covered by our sampling
technique.15
A total of 311 political actors and brokers were surveyed and had cross-referenced responses:
256 politicians in total and 55 brokers (18% of the full sample). 68.5% (213) of the full sample
planned to run as candidates in the subsequent commune or legislative election. Among those,
55% (117 politicians) planned to run for mayor in the 2020 commune-level election, while the
14
See, for example, sites.google.com/site/njcanen/research.
15
The only significant differences between covered and missing communes in our database are population and voter
turnout. However, having one or two covariates reject the null of equal means with a 10% significance level is to be
expected when comparing 19 covariates. Furthermore, these differences should not affect our reduced form estimates
below since we control for them in equations (4.1) and (4.2). Finally, these differences do not appear to be an issue for
additional specifications for which we have balance in politician characteristics between control and treated communes
(see Table 4), suggesting limited selection bias at the respondent level.9
remainder (96) planned to compete in the 2019 legislative one. We use the former for our main
estimates in the paper, and the latter for robustness checks.16
Summary statistics for the sample of mayors are shown in Table 1 while descriptive statistics
for the full sample can be found in Appendix Table D-1. On average, surveyed individuals are
47 years old and the majority hold either an undergraduate or post-graduate degrees. Moreover,
the vast majority of politicians are members of a political party (98%), but only 27% are first
time candidates, and only 38% say they have held private positions in the past. Those who have
run in multiple elections have often done so at multiple levels, from commune-level ones up to
presidential-level elections. The summary statistics also confirm our description in Section 2 that
Benin has a highly dynamic electoral environment, since over half of surveyed politicians have
switched political parties. In our data, the main reason for these switches is their opposition to
party platform change. This contrasts to an alternative where this is done due to opposition to
their former political parties themselves.
Apart from the descriptive statistics, an important feature of the data is that we collect infor-
mation about politicians-firm contracts, including their characteristics (such as funding amounts,
funding sources and timelines). To check and possibly correct for social desirability bias (as some
politicians might prefer not to answer truthfully), we conduct a list experiment on the survey
question regarding politicians’ affiliations with firms . The results of this experiment are shown
in Appendix Table B-1. We find that 83% of respondents running for mayor in 2020 are affili-
ated/connected to a corporation, similar in magnitude to those running for MP in 2019 in either
side of treatment in this list experiment.17
The key innovation of this dataset is the collection of variables that characterize different types
of firm-politician contracts. Contract types range from more indirect state capture demands in-
cluding concessions on policy and procurement and political platforms during campaign periods,
to more direct ones including direct appointments of firms’ acquaintances to state offices, inter-
ventions through control of budget lines or the control of key bureaucratic positions. More specif-
ically, we ask respondents in the questionnaire “what are the specific requirements of economic
operators (from firms) in return of amount and resources transferred to your campaign or the
one you worked for?” We asked them about 9 items: the promotion of specific policies; targeting
public goods to specific markets/sectors; the promotion of the political career of friends or family
members close to corporations; the appointment to bureaucratic positions of persons suggested
by corporations; support for a future candidate nominated by the company; modification of the
political program in accordance to local or national company interests; refund/reimbursement
of funding granted during the electoral campaign; bureaucratic recruitment control, such as cus-
toms, judges, etc.; and whether they request a budget line at the national, commune or village
level. We aggregate capture demands into an index, categorizing their responses in the follow-
ing way: financial refunds get a value of 0; promotion of specific policies and program changes
a value of 1; targeting public goods to specific market/sector a value of 2; support for a future
16
Results are robust to using the subsample of politicians running for office, leaving political brokers aside.
17
More details on the list experiment itself are presented in Appendix B.10
candidate close to firms’ interests a value of 3; control of a budget line a value of 4; patronage
5; and, lastly, bureaucratic recruitment control a value of 6. We construct a direct capture index
at the respondent-level that averages across categories since a respondent may have pointed to
more than one requirement made by firms. Given that the survey may contain more than one
respondent by commune, we average responses within responder to construct a commune-level
direct capture index. By construction, the index ranges from 0 to 6, with 6 the highest degree
of direct capture.18 We follow the same procedure to construct a direct capture index for respon-
dents running for MP in 2019 averaging responses at the electoral district level. This index is
based on a natural ordering of what constitutes a more direct form of capture of government:
patronage, bureaucratic control are more direct interventions than support for policies or candi-
dates in a campaign (without guarantee they will win), or targeting of public goods to a general
sector. Nevertheless, due to the novelty of the data and questions addressed in this paper, there
is an undeniable degree of subjectivity in this ranking even if it is based on previous literature
and qualitative evidence. To get past this, we show that all our specifications in the next section
are robust to collapsing this index into coarser “direct/indirect” groupings, as well as to switching
the order of contiguously ranked items. Furthermore, as we discuss below, we conduct a large
variety of cross-validation exercises for the dataset in as comprehensive and cohesive approach as
we could conduct.
Summary statistics on the contractual relationship between firms and politicians are shown in
Table 2. Requesting public goods to specific markets or sectors is the most prevalent petition made
by firms (78%), followed by promotion of specific policies (42%) and the nomination of a crony
to a bureaucratic position (38%). Both political program modifications and requesting refunds
and reimbursements are among the less frequent demands made by firms to politicians (10 and
3%, respectively). The distribution of the prevalence of the forms of state capture is not strikingly
different between respondents running for mayor and MP positions, despite the differences in the
responsibility and oversight of each position.19
To study the effect of electoral uncertainty on the form of state capture and their effects on
market structure, we use electoral data from previous elections. While our main reduced form
results focus on the respondents’ answer related to the 2019 campaign outcomes, we must use
2015 electoral to construct measures of electoral uncertainty since our data was collected prior
to the final 2019 election results. The two measures we construct are winning margins and
the number of political candidates contending for office. Both constitute benchmark measures of
electoral competition - one based on results, while the other is based on the supply of competitors.
18
As noted in Appendix B, it is highly likely that respondents suffer from social desirability bias in the answers to
these questions due to the sensitivity of exposing contractual arrangements with firms. However, we should expect
that underreporting would be stronger in more direct rather than indirect forms of capture. This would imply that our
results in the next section would be biased downwards.
19
Our data also includes information about campaign finance, which we describe in more detail in Appendix A. The
main takeaway from this part of the data is a relatively large amount of money spent by firms in political deals for this
context.11
To measure the number of political candidates by commune, we use Molinar’s effective number
of parties index.20
Meanwhile, we compute the winning margin by the difference in vote share between the first
placed and second placed party21 in commune-level elections. We consider winning margin to be
a proxy for electoral competition in a “bottom-up” electoral aggregation system where citizens
vote on local councils by majority who then appoint mayors (see Section 2). In proportional rep-
resentation systems as Benin, there is no incentive for strategic voting. Thus, we measure winning
margins as the difference between the vote share of the leading party and the main opposition
party runner at the commune level, despite the presence of other parties that may still win leg-
islative seats. We do so for multiple reasons. First, it is our experience in the field communicating
with local voters, politicians and brokers, that this winning margin is precisely the one interpreted
by both voters and MPs as the main competitive difference. Second, as noted by Fujiwara and
Sanz (2019), albeit in a different context, being labeled as the most voted party represents higher
bargaining power to form government or sustain coalition majorities in legislative bodies.
To further cross-validate our dataset, we test the relationship between political uncertainty and
politicians’ spending preferences and electoral strategies to win votes. We focus on identifying
how transfers to citizens, firms, and public goods, as well as vote buying attempts are affected by
different degrees of electoral competition. We then compare findings to established results in the
literature and the case of Benin. Following Cruz (2018) and Cruz et al. (2019), politicians were
given a picture worksheet with a list of ten options that they could allocate a hypothetical budget.
The options were: (1) public health; (2) public education; (3) cash or transfers to employment
or household accidents; (4) water and sanitation infrastructure; (5) road construction and reno-
vation; (6) construction of municipal facilities (basketball court, multipurpose rooms, etc.); (7)
business loans and actions to develop the private sector; (8) agricultural aid; (9) defense and
security; and (10) events and festivals. Enumerators informed them of the amount of their local
development fund and gave them 20 tokens, with each token representing 5% of their available
budget. Respondents were then asked to allocate their tokens freely, according to their own pref-
erences. We use their answers to compare how much they planned to spend on citizen-specific
goods relative to firm-specific ones by aggregating the answers into four measures of preferences:
the first over citizens non-conditional transfers (options 3 and 10), the second over visible public
goods (options 1, 2, 5, 6, 8 and 9), the third non-visible public goods (option 4) and, lastly, trans-
fers to firms (option 7). We also rely on additional survey questions on vote buying attempts by
respondents.
20
Molinar (1991) computes the effective number of parties as one plus the square of the number of parties times the
sum of the squared of each party’s vote share. Benefits of Molinar’s index include avoiding to over-count larger parties
and reduce the sensitivity of smaller ones. Given Benin’s highly fractionalized party system but highly concentrated
(see party-level Herfindhal-Hirschman Index of Figure 1) it is important to correct for both features.
21
Benin has a one-candidate-one-party system.12
4. Reduced Form (Motivating) Evidence
First, we analyze the relationship between winning margins and firms’ state capture preference
as stated in contractual arrangements. In particular, we estimate the following Ordinary Least
Squares (OLS) specification:22
(4.1) yi,c = α + γD + βWinning Marginc + X0c Φ + Wi0 Θ + i,c
where yi,c is the direct capture index in commune c from respondent i in 2019; Winning Marginc is
a continuous variable on the winning margin in commune c in the 2015 elections; Xc is a vector of
commune-level control variables including voter turnout and Molinar’s effective number of parties
in 2015,23 executed fiscal expenses in 2013 to proxy for local state revenues and capacity,24 and
population in 2015 (estimated using the Global Human Settlement 2015 raster file). Wi is a
vector of politician-level characteristics listed in Table 1, including age, university education,25
a dummy to account for switching parties since last election, if the respondent is not part of
the President’s coalition, and whether (s)he is an incumbent;26 we also include a department
fixed-effect, γD (a geographical level above communes), to account for any department-level
time-invariant heterogeneity. Thus, our estimates account for the change in firms’ preferences
for direct forms of state capture in communes that experienced high electoral uncertainty as
proxied by smaller winning margins. The variation compares such communes within departments.
Throughout our specifications, standard errors are clustered at the department level.
Table 3 shows the estimates from this first specification. Our main parameter of interest, β,
captures the effect of electoral competition - measured by winning margins - on firms’ preference
for direct capture. Our results are in terms of “beta” coefficients, as we standardize the variables.
Column (1) controls for commune-level covariates; column (2) adds department fixed effects,
and column (3) includes additional politician-level characteristics. These three columns suggests
that our results are not driven by overfitting, despite the large amount of variables relative to
22
Very preliminary results of a subset of the reduced form evidence in this section were reported in a policy brief by
Ch et al. (2019).
23We control for the number of parties since electoral uncertainty as proxied by a small winning margin and large
number of parties differs from one with a smaller number of parties. The second scenario increases the predictability
of the results and, thus, political uncertainty in the commune.
24We also have data on nighttime luminosity to proxy for economic activity. Luminosity has been shown to be a
good approximation of national and local economic activity, particularly in Africa (Henderson et al., 2011; Bleakley
and Lin, 2012; Michalopoulos and Papaioannou, 2013; Storeygard, 2012; Weidmann and Schutte, 2016). However,
we do not use it in our main specifications for two main reasons. Since fiscal expenses and luminosity are highly
correlated, we must choose one or the other. While the results are robust to using luminosity (see Appendix Table
D-4 for this specification), we do not believe they provide the best results. As Benin is generally a poor country,
luminosity can only be detected in a very small fraction of daily pictures in the year. Correction techniques to account
for this sparse measurement only consider stable lights or pixels that appear lit above certain threshold. Applying
these techniques would lead to dropping 7 communes from our sample. While we could use non-corrected luminosity,
this measure suffers from multiple problems including geographic misalignment, abnormal fluctuations across time,
overglow across space and spatial correlation (see Ch et al. (2020) for more detail and correction procedures).
25University education is perfectly correlated with elementary/college education. We keep the former.
26Results are robust to the inclusion of the characteristics listed in Table 1.13 the sample size. Our preferred specification in column (3) shows that a one standard deviation increase in the winning margin leads to a -0.84 standard deviation decrease in the preference for forms of direct capture. This result is significant at the 1% level, mapping to a decrease of 20.1% in the direct capture index. In column (4) we carry out a placebo test using the winning margin between the second and third placed party as a proxy of electoral competition instead. As expected, we find null results for this effect. We do not expect that changes in competition lower down the list represent increases in commune-level electoral uncertainty and, thus, they should not affect preferences for direct capture. Columns (5) and (6) show the results of a second placebo test. There, we test whether the same effects are present in legislative elections. Elections for MPs in Benin provide an ideal placebo as these legislators neither hold control over national or regional level procurement and budgeting, nor do they have say on national or regional bureaucratic positions. This is contrary to other settings. MPs in Benin are not allocated to relevant committees in Parliament in charge of budgeting, but instead rely on party and executive lines for general voting patterns in the Assem- bly (see Lassou et al., 2019, as well as the official protocol from Ministère des Finances, 2000). Thus, electoral shocks that modify the overall electoral uncertainty faced by MPs should not lead to firms’ stronger preference towards more direct forms of state capture or the appointment of cronies to key government positions. This is indeed what we find in Table 3. Winning margins hold a positive and non-significant effect for MPs. One concern with this first set of results is due to campaign funding. It could be that such funding varies in close and non-competitive elections. In turn, this could potentially bias our results as campaign funding is important in this context. Appendix Table A-3 shows that our baseline results are robust to controlling for reported campaign funding. Another concern regards the different samples across columns. Appendix Table D-3 shows that our results are unchanged when focusing on the subsample from Table 3 column (4) for all specifications. To account for the small number of clusters (12 departments) that could affect inference, Table D-5 reports provides 95% confidence intervals using the wild bootstrap, following Cameron et al. (2008), with 1,000 replications. Additionally, we conduct a sensitivity analysis on the construction of the direct capture index. We pool items in pairs, triads and quartets, as well as swap the ordering of contiguous items. These changes preserve the structure of having the easily defined more direct forms of capture as higher values than the indirect ones, but shows that our results do not rely on the exact ordering of individual items. The results are still present when we pool the answers into the coarser “direct” and “indirect” groupings, and does not particularly depend on ranking “patronage” below “capture of the bureaucracy. These results are shown in Appendix Table D-9, Panel A. Last but not least, our results are not driven by outlier communes: our results remain quantitatively similar when we use a jackknife-type estimator that sequentially delete a single commune from the sample each time.27 27Results available upon request.
14
To cross-validate our direct capture index and further check the effect of electoral uncertainty
on firms’ strategic decision making, we ran a simple survey experiment. We asked all 117 re-
spondents planning to run for commune-level elections how firms’ demands would “change next
electoral campaign if the number of candidates increases?”. Appendix Table D-6 reports the dif-
ference in means from a two-sided t-test between the firms’ demands used under the status quo
(control) and the potential demands if the number of candidates increase (treatment). Results
show an increase from 2.995 to 4.333 on firm’ preference for direct capture on a scale of 0 to 6.
This effect is statistically significant at the 1% level. This effect is driven by statistically significant
increases in the demands for reimbursements/refunds (5.1%). Demands for bureaucratic recruit-
ment control (5.1%), budget lines (2.6%), and changes in policies and campaign platforms (6%
and 4.3%, respectively) also increase, although those effects are noisier. Meanwhile, the targeting
of public goods to specific sectors decreases by 17.9%. This exercise validates the findings in Table
3 without requiring computation of a proxy for electoral competition (such as winning margins).
While intuitive, this first specification does not rule out time-variant explanations. It does not
account fora feedback of previous state capture on current electoral competition, for example.
It simply shows that increasing political uncertainty is associated with increasing direct capture,
even after controlling for politician and local level characteristics. To further probe these results,
we use quasi-exogenous variation introduced by the Electoral Reform in Benin in 2018 as a second
reduced-form identification strategy.
Among other features, the 2018 Electoral Reform described in Section 2 collapsed the existent
multiparty system to a two-party block competition. The reform forced parties to merge into a
block to compete, with no more than two blocks being able to contend for any political position
in the country. For our identification strategy, we compare communes that in 2015 had multiple
parties competing for office and suddenly faced party collapse, decreasing electoral competition
(the treatment group), to those communes that where already under a de facto two-party system
(our control).28 These two groups are balanced in politician observable characteristics as shown
in Table 4.
The effect of the electoral uncertainty induced by this reform on firms’ strategies of govern-
ment capture in 2019 can be explored by estimating the following equation for commune-level
elections:
(4.2) yi,c = α + γD + βTreated Electoral Reformc + X0c Φ + Wi0 Θ + i,c ,
where T reated Electoral Ref orm takes the value of 1 if commune c had a number of effective
parties larger than 2.5 as measured by Molinar’s effective number of parties index, 0 otherwise.
For our main specification we control for the same politician and commune-level covariates used
28Molinar’s effective number of parties is negatively correlated with winning margin (ρ = −0.429) and voter turnout
(ρ = −0.524) in the commune-level 2015 elections. As such, it represents a proxy for electoral competition. Similar
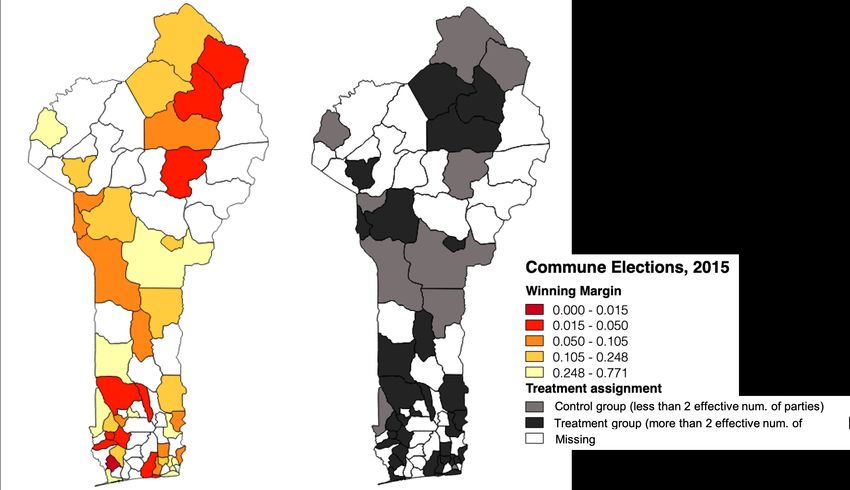
correlations are found using Laasko-Taagepera and Golosov indices.15 in Table 3, except for Molinar’s Index, naturally.29 In this set-up, our identification is based on cross-sectional data: it compares communes that had a 2 party system pre-reform (and were unaffected, at least in terms of numbers of candidates and perceived electoral competition), to those that were affected by a change in electoral competition. The latter group serves as a valid comparison, as long as absent treatment and conditional on covariates, both groups would have had the same expected outcomes. The comparison across these groups is made within districts once we use department fixed effects. Our identifying restrictions explores the motivation for these reforms which was national and did not directly target specific communes. It also exploits that electoral uncertainty variation occurs due to a quasi-exogenous shock conditionally indepen- dent from future firms’ capture demands.30 Figure 2 shows evidence that such restrictions appear valid. There does not appear to be any particular spatial correlation in treatment assignment or targeting of the reform to communes with specific winning margins. Table 5 presents the estimates of equation (4.2). The results are expressed in standardized beta coefficients. Our preferred specification in column (3) shows that the effect of a decrease in electoral uncertainty (i.e. a decrease in political competition) decreases firm capture index by -0.469 standard deviations, significant at the 5% level. Appendix Table A-4 show that results are robust to controlling for self-reported campaign financing. Panel B of Appendix Table D-9 reproduces the robustness analysis to the exact construction of the direct capture index from our previous specification. We see that the results for our quasi-natural specification are also robust to minor reordering in the construction of the direct capture index (including collapsing the index into two larger groups - “direct” and “indirect capture”, and to switching the order of contiguously defined responses). These changes preserve the natural order of what is considered direct and indirect forms of capture, and add to the validation of our findings. Since the Electoral Reform is allocated at the commune and not at the legislative circumscrip- tion level, we cannot run a placebo test on legislative level as done in Table 3. Instead, we perform a placebo test that checks whether the results are being driven by other mechanisms that are not our treatment. We run 1000 simulations following equation (4.2) and the specification of column (3) of Table 5. In each simulation, we randomly assign each commune to “Treatment” or “Control” using a random Bernoulli draw, where the success rate is equal to the proportion of treated communes by the Electoral Reform (74.36%). In other words, we randomly assign treat- ment following the observed treatment incidence. We then re-estimate our parameter of interest in each placebo simulation using the full subsample of respondents of Table 5. Figure 3 shows the resulting distribution of the 1,000 estimated beta coefficients across simulations. The average estimated effect of our placebo test is very close to zero, and it is highly statistically unlikely that our estimate from Table 5 column (3) (blue line) could have been drawn from such a distribution. 29We include the winning margin in 2015 to assess the effect of a decrease in the number of parties solely, and to rule out local political system dynamics pre-2019. 30This set-up is different than a difference-in-differences design which would compare changes in outcomes due to changes in competition in treated and control communes. Unfortunately, we do not have reliable historical data on the outcomes prior to 2019, so we explore the variation valid in the absence of time-series data.
16

   We conduct one final analysis to validate our results. The empirical evidence on clientelism
in Benin has pointed that regional and incumbent candidates benefit more from clientelistic ap-
peals than challengers. This occurs at the expense of public good provision Wantchekon (2003).
One mechanism consistent with this is the increased availability of information to incumbents
(Wantchekon, 2007), but this would not be as effective for the opposition. As Vicente and
Wantchekon (2009) conclude in their assessment of multiple field experiments in West Africa,
“while clientelism works particularly well for incumbents, vote buying seems to be more effec-
tive for challengers”, possibly due to incumbents’ disproportionate control of public resources.31
Thus, according to this evidence, we should expect that as electoral uncertainty decreases (fa-
voring the incumbent), transfers from politicians to voters should increase while vote buying
attempts decrease. Moreover, public good provision should decrease. Using the aforementioned
budget experiment of Cruz (2018); Cruz et al. (2019), Appendix Table D-8 shows that transfers
from politicians to voters increase while vote buying attempts decrease. Although the results
are noisy due to our sample limitations, it is reassuring to find point estimates consistent with
the predictions found in the literature. While overall public good provision does not decrease as
expected, we find the expected negative effect on non-visible public goods including water and
sewage systems. Column (5) is also noteworthy as it shows a decrease in the amount of transfers
to corporations when the amount of electoral certainty increases.
   To rationalize the observations discussed in Section 4, we present a model of state capture and
political uncertainty, where firm’s decisions affect market structure.

5. Theoretical Framework
5.1. General Outline

    We present a model that integrates three features that are observed, but understudied: (i)
state capture, and the multiple ways it occurs (i.e. more and less complex/direct forms of state
capture), (ii) state capture affects market structure (distortions created through the relationship
between firms and politicians affect which firms are in a market, how much they produce, market
concentration and consumer surplus); and (iii) the role of political uncertainty in affecting (i)-(ii).
    The model captures the results discussed in the previous section: most notably that higher po-
litical uncertainty is associated with increasing state capture (government control) and increasing
direct forms of control. It also provides additional results on what we do not observe, including
rents from firms to politicians. Finally, the model captures a mechanism that can explain these
results, and it can be structurally estimated for further quantification of policy exercises. In a
later section, we use this exact model to study how standard policies to curb state capture affect
welfare and the forms of government control by firms.

     31Similar results are found by Vicente (2014) in São Tomé and Prı́ncipe.
17
5.2. Environment
We consider a politician and, for simplicity, a single market of firms and consumers. A firm i
interacts with the politician/government to try to distort the market through capture. Capture
means that the firm offers a payment to the politician, w(µ) that induces observable (to the firm)
effort/distortions µ ∈ R+ .32 The benefit of these distortions is an increase in the firm’s profits,
πi (µ), at the cost of a decrease to consumer surplus S(µ). As previously described, one can think
of these distortions as being taxes and regulations that would increase costs on the connected
firm’s competitors.
We assume that a politician is risk-neutral and has preferences for both rents, w(µ), and con-
sumer surplus, S(µ). Their utility is given by w(µ) + γS(µ), where γ represents the weight for
consumers’ welfare relative to his own rents. The politician has an outside option given by ū.
We assume that S(µ) is decreasing and πi (µ) is increasing in µ, and π(µ) + γS(µ) is increasing,
differentiable and concave in µ for all µ.33
Electoral uncertainty is modeled as a discrete random variable. With probability p > 1/2,
the politician is (re)elected and is able to enforce promised distortions µ in the second period,
yielding profits πi (µ) to firm i.34 With probability 1 − p, the incumbent is removed and the firm
might lose its payment to the politician, as we explain shortly below.35 This p can be interpreted
as the probability the incumbent politician is replaced by one who has no connections to the firm,
possibly resulting from strategic interaction outside of the model.
The final piece of this model is the existence of different forms of state capture: while µ repre-
sents the effort the incumbent can make for the firm (or that the opposition promises it can make),
firms can also choose how this µ is implemented. Is it through a more direct or indirect form of
32The crucial part for our set-up is that only one set of distortions, µ∗ is chosen. One could consider a scenario
in which firms agree on a decision rule among themselves for who picks, µ. It follows that assuming only one firm
interacts with the government instead of an agreed upon coalition is for simplicity of exposition only. If we allow for
each firm to have a choice over distortions, we would have to understand how individual preferences over market
distortions are aggregated across firms, in a setting where those distortions have externalities. Adding these features
would only make the model more complex, and obfuscate the main mechanisms we describe below. Meanwhile, in
contrast to Hsieh and Klenow (2009); Huneeus and Kim (2018), we do not focus on aggregate distortions - only
distortions within a market.
33In Appendix C.1, we provide a microfoundation for profits and consumer surplus based on a model of Cournot
competition among firms with heterogeneous marginal costs. The connected firm’s distortions increases the marginal
costs of its competitors. This is reminiscent of the wedges among firms in a market of Hsieh and Klenow (2009). In
this microfoundation, distortions affect market structures in two salient ways. First, state capture increases the market
shares of the connected firm by making their competitors’ production relatively more costly. Second, such distortions
(e.g. tax regulation) can induce exit in the market - some firms might not have enough profit to sustain entry given
their higher marginal costs. Altogether, these increase profits of i and distort consumer surplus. In Appendix C.1, we
further show that this microfoundation under a parametrization of consumer demand satisfies the assumptions we
imposed above on the functions πi (·), S(µ).
34p captures the incumbency effect. p > 1/2 is useful only for comparative statics, as the variance p(1 − p) decreases
with p for p > 1/2. In this case, an increase in p can be interpreted as an increase in electoral certainty. This uncertainty
is a driving force in the model, as it makes w(µ) depend on whether distortions are more/less likely to persist over
elections.
35Note that w(µ) is always paid: even though the firm pays a politician, the uncertainty means the latter might
not be present in the future to guarantee the distortions are in fact implemented. This is analogous to an incomplete
contract set-up.You can also read