Pollution and Human Capital: Evidence from India - Center for ...
←
→
Page content transcription
If your browser does not render page correctly, please read the page content below
Pollution and Human Capital: Evidence from India∗
                               Magda Tsaneva†and Uttara Balakrishnan‡

                                               January 6, 2020

                                                    Abstract

          Health and well-being during childhood are vital for shaping human capital accumulation. In
      India, exposure to pollution is increasingly one of the greatest public health challenges facing the
      country. In this context, we examine the impact of air pollution exposure in India on children’s
      learning outcomes. Using a large scale panel of 5-16 year olds’ test scores, we causally estimate
      the short- and medium-run impacts of air pollution on human capital, using thermal inversions
      as an instrument for air pollution. We show that high levels of contemporaneous air pollution
      significantly reduce varying levels of reading outcomes by 0.57 - 1.67 percentage points and math
      outcomes by 1.37 - 1.43 percentage points, with girls and older children witnessing a larger de-
      cline. There is significant inter-state variation with most of the results being driven by the highly
      polluted northern and eastern states of India. We find that the main mechanism explaining these
      impacts is a physiological one. During periods of high air pollution, student attendance in school
      is lower suggesting health effects of pollution. Further, the cumulative effect of pollution in the
      past two to three years is larger than contemporaneous impacts. Our results suggest that air
      pollution is a significant threat to human capital in India.

      JEL codes: O12, O13, I38, J22, J31, R14
      Keywords: air pollution, human capital, thermal inversions, physiology; India

  ∗
     We thank ASER India for sharing their data. We also use data from Young Lives, a 15-year study of the changing
nature of childhood poverty in Ethiopia, India, Peru, and Vietnam (www.younglives.org.uk). Young Lives is funded
by UK aid from the Department for International Development (DFID). The views expressed here are those of the
author(s). They are not necessarily those of ASER, Young Lives, the University of Oxford, DFID, or other funders.
For comments and suggestions, we would like to thank Kartik Misra. All errors are our own.
   †
     Department of Economics, Clark University; mtsaneva@clark.edu
   ‡
     IMPAQ International; uttara.balakrishnan@gmail.com
1 Introduction
Does air pollution affect learning outcomes for school aged-children in India? This question is of
particular importance given increased global warming and lack of access to clean fuels for most
people in India, on the one hand (WHO, 2008), and the steady decline of education productivity
in India on the other (ASER, 2018). The effects of air pollution are wide ranging from increased
mortality and lower productivity to weaker ecosystems and costly remediation (Maas and Grennfelt
(2017)).1 Worldwide, around 3 million people died prematurely from outdoor air pollution in 2010.
For extremely polluted countries like India and China, with large populations, premature deaths due
to pollution are expected to be around 20 million by 2060 (OECD, 2016). There is extensive literature
documenting the impact of air pollution on a wide range of outcomes including worker productivity;
life expectancy; illness; dementia; and child health. However, the evidence on how air pollution
impacts human capital, especially in developing countries, is scarce. Further, all the evidence is
limited to low and moderately polluted areas like the U.S., Singapore; and Israel (Ebenstein et al.
(2016); Zweig et al. (2009), Stafford and Brain (2015); and Chew et al. (2018)). In this context,
our paper fills this knowledge gap by estimating the causal impact of air pollution on human capital
production for school-aged children in India.
In this paper, we examine the short- and medium-run effects of air pollution on learning outcomes
of almost 3.5 million children in primary and secondary schools in India, from 2007 - 2014. The Indian
context is important for two main reasons. First, India has one of worst levels of air pollution around
the world. Pollution in India has been consistently above the World Health Organization (WHO)
recommended levels for the past decade (see Figure 1).2 Premature deaths due to poor quality are to
the tune of 2.1 billion life years (Greenstone and Hanna (2014)). According to the World Bank (2016),
the economic cost of air pollution in terms of poor health and higher mortality is almost 8 percent of
GDP for India. This is compounded by weak environmental regulations (Duflo, Greenstone, Pande,
et al. (2013)) and stiff resistance and lobbying by industry for any move to strengthen them (Bloom
et al. (2010)). The second important reason to examine the Indian context, is India’s large learning
deficit. According to the 2005 ASER report, almost 44 percent of primary school-aged children
enrolled in school could not read a basic paragraph and 50 percent could not do simple subtraction
(Chakraborty and Jayaraman (2019)). Nationwide productivity of education has declined by 18
percent between 2008 and 2018 (ASER, 2018). While India has been successful in getting children
into school (national enrollment rate in 2018 was 96 percent), large sections of children are lacking
basic skills. In this context, exposure to high levels of air pollution has the potential to significantly
weaken human capital accumulation and future capabilities of these children.
1
There are two main types of air pollution - ambient air pollution (outdoor pollution) and household (or indoor)
air pollution. Outdoor air pollution originates from natural (e.g. dust storms) and anthropogenic sources (e.g. fuel
combustion, heat and power generation, industrial facilities, residential cooking). Indoor air pollution refers to pollution
generated by household combustion of fuels (caused by burning fuel such as coal, wood or kerosene) using open fires
or basic stoves in poorly ventilated spaces. Both indoor and outdoor air pollution can contribute to each other, as air
moves from inside buildings to the outside, and vice versa. In this paper we focus on ambient air pollution.
2
WHO recommended safe air quality guidelines are 10µg/m3 for maximum yearly average and 25µg/m3 for maximum
24-hour average.
1Estimating the causal impact of air pollution on learning outcomes is not straightforward for two
main reasons as highlighted by Hansen-Lewis (2018). First, there is lack of consistent nation-wide
data on air pollution. Air pollution in India is monitored by the Central Pollution Control Board
(CPCB). As of 2016, air pollution monitors were limited to 342 operating stations in 127 cities across
India (Van Donkelaar et al. (2014)). Further, monitors are clustered around bigger cities like Delhi
and state capitals. Thus, ground level monitoring of air pollution is not widely and evenly distributed.
Second, even if data on pollution was widely available, there is a simultaneity problem in estimating
the relationship between pollution and learning outcomes. This is because changes in both, pollution
and human capital may simply reflect overall economic conditions. For instance, increased economic
growth will increase pollution through higher vehicular and industrial emissions (Hettige et al. (2000);
Oates (2006); Myers and Kent (2004); Shafik (1994)), but can also increase learning outcomes through
higher incomes (Psacharopoulos (1985); Goldin and Katz (2007); Goldberg and Pavcnik (2007)).
To overcome these concerns, in this study, we examine the impact of air pollution on learning
outcomes in an instrumental variables (IV) framework. Specifically, we use thermal inversions to
instrument for air quality. Ordinarily, temperature drops with rising altitude. However, a thermal
inversion occurs when there is a mass of hot air on top of a mass of cold air. Thermal inversions occur
exogenously and trap pollutants. A growing literature uses inversions to instrument for pollution
(Arceo et al. (2016); Hicks et al. (2016); Jans et al. (2018); Chen, Oliva, et al. (2017); Sager (2019);
and Molina (2016)). Additionally, to overcome the concern of inconsistent and uneven pollution
monitoring, we employ satellite data to measure air pollution. Specifically, we use air quality measures
from the Moderate Resolution Imaging Spectroradiometer (MODIS) Aerosol Optical Depth (AOD) to
proxy for particulate matter (Dey, Di Girolamo, et al. (2012); Hansen-Lewis (2018); Gendron-Carrier
et al. (2018)). Van Donkelaar et al. (2014) estimates that a one unit increase in mean AOD, results in
an average change in mean PM2.5 by 108 µg/m3 . Data for AOD is available, at fine spatial resolution,
for the entire time period of the study, 2007 - 2014. We show that thermal inversions are strongly
positively correlated with our measure of pollution, AOD. Further, consistent with the simultaneity
bias between human capital and pollution, the IV estimates display more negative impacts on human
capital than OLS estimates. Our main outcome of interest is reading and math outcomes for children
aged 5-16 years which comes from a large repeated cross-sectional dataset from India, the Annual
Status of Education Report (ASER). The ASER survey has been conducted annually from 2005
onwards and has a wide geographic coverage, covering almost all rural districts in India, and surveying
over 4,00,000 school-aged children annually. ASER administers learning assessments of basic literacy
(reading skills) and numeracy (number recognition and arithmetic skills) to all children aged 5-16
years.
There are four main findings of this study. First, we show that both reading and math outcomes
are impacted adversely by air pollution. A 0.01 unit increase in annual AOD (one µg/m3 in PM2.5)
reduces reading outcomes by 0.57 - 1.67 percentage points. Similarly, math outcomes decline by
1.37 - 1.43 percentage points. Even basic skills like probability of reading a letter and probability
of reading a word for reading and probability of counting from 10 - 99 for math, are impacted. We
2corroborate these findings using the Young Lives Survey (YLS) in India - a rich 16-year longitudinal
study conducted in Andhra Pradesh. Estimates from the YLS data are larger in magnitude indicating
stronger effects. To put these effects into perspective, Shah and Steinberg (2017) analyze the cognitive
effects of exposure to drought in utero from India and find that exposure to drought in utero is
associated with being 2 percentage points less likely to recognize numbers in childhood.
Second, we examine heterogeneous impacts by state and find almost all the impacts are driven by
the north and eastern states of India namely Punjab, Haryana, Uttar Pradesh, Bihar, West Bengal,
and Rajasthan. Since the north and eastern states of India are land-locked, poor quality air gets
trapped, leading to extremely high particulate matter levels. To compound matters, these states
witness high levels of crop stubble burning after the rice and wheat sowing season. We also examine
heterogeneous impacts by age and gender. Girls witness a larger decline than boys for both math
and reading outcomes in the ASER data. The same pattern is also evident in the YLS data. This
is unsurprising since girls have lower reading and math scores to begin with. Worryingly we find
that girls in households with a larger number of siblings are worse off. On the other hand, boys in
smaller and larger households fare about the same. With respect to age, older children in general,
have larger declines due to poor air quality. One plausible explanation for this is that older children
in rural areas are more exposed to polluted air, while attending school and plausibly while working
on or off the farm (Shah and Steinberg, 2019).
Third, there are large cumulative effects of poor air quality on human capital. In general, the
effect becomes larger as the duration of exposure to air pollution increases. Specifically, a 0.01 unit
cumulative change in AOD (one µg/m3 in PM2.5) over the last two years leads to a decline in reading
and math outcomes by 0.71 - 1.99 percentage points, while exposure for 3 years leads to a decline in
reading and math outcomes by 0.79 - 2.73 percentage points.
Finally, we find that the main mechanism driving the impacts is a physiological one. Changes in
learning outcomes could arise both, from pollution directly affecting children’s brain development or
from changes in health which could impact attendance and drop out rates. We find that attendance
on a random day is lower in districts with high levels of current year AOD. We also find that children
are less likely to be “on-track” (correct grade for their age) and are more susceptible to falling
behind. We do not find any evidence of air pollution impacting drop out behavior. We corroborate
the findings using attendance information from several rounds of the National Sample Survey (NSS)
data. Additionally, we also find evidence that the physiology of teachers also matters. We explicitly
test the impact of AOD on teacher attendance and find that cumulative exposure to pollution leads
to marginally higher teacher absences. Thus, pollution is doubly deterimental for children, both
through impacts on their own health, and through impacts on the health of their teachers.
We also run a series of robustness checks that ascertain the validity of our main findings. First,
we examine whether our results are robust to estimating impacts only for ‘on-track’ children i.e.
children who were the right grade-for-age. Second, we test the robustness of our results using alternate
temperature layers to define a thermal inversion. Specifically, instead of using the two pressure levels
closest to the ground (1000hPa and 925hPa) to identify inversion episodes, we use the temperature
3difference between the second and third pressure levels i.e. 925hPa and 850hPa to identify inversion
episodes. Third, since the ASER tests are administered between September to November in different
villages across the country, we test if exposure in current year, defined as the 12 months prior to the
test, impacts learning outcomes. Specifically, we define current year as September - September, as
opposed to a calendar year. Fourth, to ensure that the inclusion of state-specific linear time trends
are not biasing our results, we estimate impacts omitting these trends. Finally, we test the robustness
of our main results by including season specific fixed effects in addition to survey year fixed effects.
Specifically, we include indicators for each of the four seasons.
The burden of air pollution is not shared equally. Poor and marginalized communities around the
world, including in India, face the highest burden of air pollution (Lipfert (2004); Dasgupta et al.
(2003); Rozelle et al. (1997); Duraiappah (1998)).3 It is also children from these very communities
who tend to have the worst learning rates and highest chances of dropouts. High levels of air
pollution, thus, impose a double penalty on the poor. First, air pollution leads to worse short-run
health outcomes for the poor both, because of higher exposure levels due to agricultural and informal
work which happens outdoors, and because of the inability to access proper health care or mitigating
equipment like home air purifiers (Houston et al. (2004); Gwynn and Thurston (2001); Osseiran and
Chriscaden (2016); Reardon and Vosti (1995)). Second, as shown in this study, air pollution also
impacts human capital accumulation of children. The largest impacts in this study come from some
of the poorest states in India of Uttar Pradesh, Bihar, and West Bengal. Lack of proper coping
strategies, makes poorer children even worse off. The results in this paper imply that impacts on
human capital disadvantage the poor even in the long run because by impacting human capital
accumulation, pollution impacts long-run capabilities (Sen, 1999) and restricts upward mobility.
This paper contributes to several strands of literature. First, this paper presents the first large-
scale evidence on the impact of air pollution on human capital production in India. Existing evidence
on the impacts of air pollution in cognitive performance is nascent and comes mostly from low and
moderately polluted areas like the U.S., Singapore; and Israel (Ebenstein et al. (2016); Zweig et al.
(2009), Stafford and Brain (2015); and Chew et al. (2018)). Cognitive impacts of air pollution, on the
scale being witnessed in India have not been examined previously. Importantly, these prior studies
examining the short-run effects of pollution assume that the variations in air quality are exogenous.
However, as outlined above, this might not necessarily be the case. We use an instrumental variables
approach in this paper to address the simultaneity bias arising from human capital and pollution.
Second, we contribute to the broader literature examining the economic impacts of air pollution
in various domains including physical and mental health and firm and worker productivity. Studies
examining the impact of particulate matter on worker productivity include Graff Zivin and Neidell
(2012); Adhvaryu et al. (2014); and Fu et al. (2017). Studies on air pollution and health include:
Currie, Zivin, et al. (2014); Borja-Aburto et al. (1998); Loomis et al. (1999); Foster et al. (2009);
and Tanaka et al. (2012). Other literature includes impacts on life expectancy (Chay and Greenstone
3
According to the World Data Lab (2018), until recently India had the largest number of people living in extreme
poverty. This co-exists with India having 14 of the 20 most polluted cities in the world.
4(2003)); illness (Cohen et al. (2005)); and dementia (Chen, Kwong, et al. (2017), Cacciottolo et al.
(2017)). There is also a limited literature examining the impact of air pollution on cognitive outcomes
from countries with low to moderate pollution levels like U.S., Singapore, and Israel (Ebenstein et al.
(2016); Zweig et al. (2009), Stafford and Brain (2015); and Chew et al. (2018)). Studies examining
the impact of air pollution on human capital from developing countries is limited. In one of the
few studies in this domain, Zhang et al. (2018) examines the impact of air pollution in China on
the cognitive functioning amongst older adults. Our paper adds to this literature by examining the
human capital costs of air pollution in India, a developing country, facing a massive challenge with
respect to air pollution.
Finally, we add to the literature examining the impacts of air pollution in India. Greenstone and
Hanna (2014) examine air pollution regulations in India and find that while air pollution regulations
improve air quality, they have only a modest impact on infant mortality. Pullabhotla (2018) finds
that fires arising due to agricultural activity in India lead to a higher incidence of neonatal mortality
and infant mortality relative to the average mortality rates, resulting in 96,000 additional under-
five deaths per year.4 Hansen-Lewis (2018) examines the impact of air pollution on manufacturing
productivity and finds that air pollution substantially lowered productivity among industries with
labor intensive technologies, but had little average effect across all industries. Other studies have
examined the impact of indoor air pollution in India. Krishnamoorthy et al. (2018) find that indoor
air pollution significantly impacts cognitive functioning of adults in their sample from South India.
Duflo, Greenstone, and Hanna (2008) find that providing households with improved cooking stoves
only had short-run impacts on smoke inhalation. None of these studies examine ambient air quality
and its impact on human capital outcomes for children in rural India.
The rest of the paper is organized as follows. Section 2 outlines the context and Section 3, describes
the data used in this paper. Section 4 outlines our main methodology and Section 5 discusses the
main findings. Section 6 explores potential mechanisms. Finally, in Section 7 we provide concluding
remarks.
2 Context
2.1 Air Pollution and Learning Outcomes
High levels of exposure to air pollution is increasingly becoming an epidemic in both, developed and
developing counties. Ambient levels of air pollution in many cities exceed more than 10 to 15 times
the clean air guidelines laid down by the WHO (Kilian and Kitazawa (2018)). Major sources of air
pollution around the world include, traffic and industrial emissions, agriculture, and burning of fuels
for cooking and heating (Craig et al. (2008); Karagulian et al. (2015)). It is estimated that more than
92 percent of people across the world live in areas exceeding the WHO recommended safe air quality
guidelines of 10µg/m3 for maximum yearly average and 25µg/m3 for maximum 24-hour average.
4
Previous estimates, based on studies from developing countries, underestimate the true mortality cost of pollution
exposure (Lelieveld et al. (2018)).
5Air quality in developing countries is much worse, with India and China frequently experiencing
annual average PM2.5 levels over 120µg/m3 (Van Donkelaar et al. (2014)).5 Globally, the WHO has
attributed over 3 million premature deaths to poor air quality in 2012.
While there is a vast literature in economics that studies the relationship between air pollution
exposure and human health, similar studies from economics on the effects of pollution on learning
outcomes are more limited.6 In contrast, there are many epidemiological studies that examine the
impacts of pollution on human capital. For instance, Porta et al. (2016) and Suades-Gonzalez et
al. (2015) examine in-utero exposure to pollution on later life cognitive outcomes. A combination
of vehicular emissions, NO2 exposure, and PM2.5 exposure are commonly associated with decreased
cognitive ability of children if exposed in-utero. Another study from Taiwan found that SO2 exposure
during the second and third trimester (when the brain develops) is associated with impaired gross
motor skills among infants (Gou et al. (2016)). Other studies examining in-utero exposure to pollution
on cognitive impairment include (Molina, 2016); (Tang et al., 2008); and (Harris et al., 2016). Studies
have also examined impacts of air pollution exposure in childhood on cognitive functioning. A
longitudinal study from Spain found that exposure to high levels of NO2 impaired the gross motor
skills of 5-year old children (Freire et al., 2010). Several other studies from developed countries
examine the impact of exposure to air pollution during childhood including Jedrychowski et al.
(2015); and Kicinski et al. (2015). There is limited evidence from developing countries apart from
two studies in Mexico and China. A study from Quanzhou province in China found that 8-10-year-old
children from heavily polluted areas had increased risk of coordination problems (Wang et al., 2009).
In another study, children in Mexico city were compared with children living in a rural province on
Mexico. Children in Mexico city which is heavily polluted performed worse on multiple tests of IQ
and vocabulary (Calderón-Garcidueñas and Torres-Jardón, 2012).
2.2 Air Pollution in India
India is one of the fastest growing economies in the world and aims to reach the five-trillion-dollar
mark by 2025. However, according to the World Bank, the country lost over 8.5 percent of its GDP
in 2013 due to air pollution (World Bank, 2016). Air pollution in India is responsible for 12.5 per
cent of all deaths in India (Balakrishnan et al. (2014)). Particulate matter exposure levels in India
are more than five times that of the United States (Greenstone and Hanna (2014)). Accounting for
almost 17 percent of the world’s population, such high exposure levels pose a serious threat to the
health of both, current and future generations in India.
5
In November 2019, particulate levels in India’s capital city, Delhi, were more than 20 times the WHO maximum
(https://www.bbc.com/news/world-asia-india-50258947).
6
Poor air quality has been found to lead to a heightened risk of heart disease, stroke, and lung cancer (Dockery and
Pope (1996); Chay and Greenstone (2003); Arceo et al. (2016); and Deryugina et al. (2016)). It has been found that
particulate matter is small enough to penetrate the thoracic region and form deposits in an individuals airways. It can
also lead to inflammation of the airways and worsen respiratory conditions like asthma and bronchitis (Pope 3rd et al.
(1995); Nel (2005); Ghio and Devlin (2001); Graff Zivin and Neidell (2012)). In addition to impacts on an individual’s
respiratory system, according to the WHO, pollution also increases the probability of heart attacks, with the exact
causal pathway being unclear (WHO, 2006).
6Crop burning, vehicular emissions, dust storms due to construction activity, and industrial emis-
sions are the four most common sources of pollution in India (Guttikunda et al. (2014); Bikkina et al.
(2019)). Meteorology over the Indo-Gangetic plains plays a strong role in the observed seasonal cycle
of air pollution in cities in this region with the winter time highs (due to high inversion) and the
summer time lows (due to rains). Since the north and eastern states of India are land-locked, poor
quality air gets trapped, leading to extremely high particulate matter levels. The problem is not
restricted to one or two cities in India. Apart from Delhi, dozens of other Indian cities are dealing
with severe pollution. For instance, out of the twenty most polluted cities in the world, 14 are in
India, according to a 2016 WHO study.
Further, pollution is not merely an urban phenomenon in India. Exposure to PM2.5 is roughly
equal across urban and rural India and rural areas accounted for 75 percent of air pollution related
deaths in 2015 (Group et al. (2018)). Households in rural areas are also impacted by crop stubble
burning (in fact, much of urban air pollution originates in rural areas due to agricultural practices like
crop burning).7 Additionally, households in villages also rely largely on biomass burning for heating
and cooking which also leads to unhealthy air quality (Bikkina et al. (2019)).
Air pollution is having a particularly devastating impact on children in India. The noxious air
hanging over India’s towns and cities kills more than 100,000 children under five every year (Varughese
et al. (2009)). This is the highest number of deaths due to pollution in this age bracket across all
countries. Further, in the age bracket of 5-14 years, India also saw the deaths of 4,360 children in
2016 (Adair-Rohani (2018)). As highlighted above, children are impacted by pollution both in-utero
and after birth. In developing countries, this is compounded by the fact that young children spend
more time indoors and inhale smoke generated from wood stoves. Thus children are impacted by
both outdoor and indoor air pollution.
Studies examining air pollution and its impact on child outcomes in India are scarce. Moreover,
most studies have focused on health and mortality impacts. Greenstone and Hanna (2014) examine
air pollution regulations in India and find that while air pollution regulations improve air quality,
they have only a modest impact on infant mortality. A recent study has found that fires due to
crop burning increased neonatal mortality by 9.2% and infant mortality by 7.7%, resulting in 96,000
additional under-five deaths per year (Pullabhotla, 2018).8 Other studies examining the impact of
indoor air pollution in India include, Krishnamoorthy et al. (2018) who find that indoor air pollution
significantly impacts cognitive functioning of adults in their sample from South India. None of these
studies examine ambient air quality and its impact on human capital outcomes for children in rural
India.
7
The rice and wheat crop grown in the states of Punjab and Haryana are the major culprits of crop fires. At end of
the harvest season in October, farmers burn the left-over crop stubble to prepare their land for the next sowing season.
This large scale burning of crop stubble leads to crop fires which leads to pollution in large parts of northern India
(Pullabhotla (2018); Venkataraman et al. (2006)).
8
These mortality costs are nearly twice the number compared to previous estimates (Lelieveld et al. (2018)) that
apply exposure-response functions based on studies mostly focused on developed countries to estimate mortality costs
of pollution exposure.
73 Data
3.1 Annual Status of Education Report (ASER)
We use student-level data from the Annual Status of Education Report (ASER) - a household-based
survey from most rural districts in India. This annual survey began in 2005 and collects information
on reading and arithmetic skills for all school-aged children, irrespective of their schooling status on
an annual basis. The survey takes place in the middle of the school year - from end of September to
end of November, limiting any spatially systematic seasonality in data collection.
The ASER data is administered only in rural areas and is a repeated cross-section, representative
at the district level. The ASER surveyors ask each child, in his or her native language, four potential
questions in reading and math. Reading comprehension tests taken during the survey show whether
the child can read a letter, a word, a paragraph, or a story. The highest level of reading corresponds
to grade 2 curriculum. Mathematics tests show whether the child can recognize numbers from 1 to
9, 10 to 99, can do subtraction, or do division, with the highest level of arithmetic corresponding to
grade 3 or grade 4 curriculum, depending on the state.
We use all the ASER rounds currently available in the public domain, 2007 - 2014. In each round
of the ASER data, the sample size is large, around 4,00,000 observations, implying over 3 million
children for the entire study period. ASER is administered at home, on weekends, and thus includes
both, children enrolled in school, out of school children, and children who were never enrolled. This
allows us to measure effects on test performance without confounding selection related to school
attendance or access to schools. Since the ASER is only administered in rural areas, we are unable
to use ASER to get estimated of urban pollution on human capital.
Table 1 presents summary statistics for the study sample from 2007 - 2014.9 We present summary
statistics for four levels of reading and math outcomes and individuals characteristics used as controls
in the main empirical specification. With respect to reading, around 91 percent children can read a
letter in 2007 and this decline to 85 percent by 2014. There is a general decline in all reading levels
fro 2007 to 2014. Further, the harder the reading level, the lower the proportion of children who can
complete it. For instance, only 45 (43) percent of children could read Grade 2 text in 2007 (2014).
The story is almost identical with respect to math outcomes, with all math outcomes witnessing a
monotonic decline from 2007 to 2014. Finally, average age across all rounds is 10 years and roughly,
half the sample is male.
3.2 Young Lives Survey (YLS)
As a robustness check to our main results, we use a rich longitudinal dataset from India. The Young
Lives dataset is a longitudinal panel which surveys two cohorts of children (younger cohort born
in 2001-02 and older cohort born in 1994-95). Data was collected from children and their families
in 2002, 2006, 2009, and in 2013/14. YLS tracks about 12,000 children in four different countries:
9
We only include states which have data for all years from 2007 - 2014. Consequently, the states of Jammu &
Kashmir and Manipur are excluded from the sample because these states were not included in the 2007 ASER.
8India, Ethiopia, Peru, and Vietnam. In India the study has been conducted in the state of Andhra
Pradesh. The study includes the districts of Cuddapah, Anantapur, Mahbubnagar, Karimnagar,
West Godavari, and Srikakulam and also the capital city of Hyderabad. These districts were chosen
in a way to cover the different climactic and geographic variations in the state.
Similar to ASER, the YLS data also collects data on cognitive achievement in all rounds of the
survey. Unlike the ASER, however, tests often varied form round to round to better reflect the age of
the child and school curriculum in the state. Tests in the YLS were also longer in duration than the
ASER, with the math test including 30 questions and the reading test having almost 100 questions.
In this paper we use data from the younger cohort consisting of approximately 2011 children since
we have data on test scores from at least three survey rounds for them (2007, 2009, 2013/14). The
main advantage of using the YLS is that the same child is tracked in each survey (as opposed to the
ASER). This allows us to account for prior human capital accumulation (Garg et al., 2017). The
overall rate of sample attrition is low with only about 4 percent of children lost over a seven-year
period. We use cognitive outcomes from the math test and the peabody picture vocabulary test
(PPVT).10 Table 2 presents summary statistics from the YLS data for the three rounds used in this
study.
3.3 Pollution Data
The Central Pollution Control Board (CPCB) routinely monitors air quality in India through its
network of air pollution monitors across the country (Dey, Di Girolamo, et al. (2012)). However,
the numbers of monitoring stations are too few for a complete and accurate assessment of regional
health risks given the very high spatial and seasonal variability of aerosol loading (Dey & DiGirolamo,
2010). Moreover, most of the CPCB sites are concentrated in the urban areas, leaving the large rural
population unchecked.
Thus, we use satellite data to measure air quality which has the advantage of universal coverage.
Satellite data can be useful for examining global air quality in the absence of a robust database of
in-situ PM2.5 (e.g. Van Donkelaar et al. (2014); Xin et al. (2014)). Following Hansen-Lewis (2018),
we proxy air pollution with Aerosol Optical Depth (AOD) using data from Moderate Resolution
Imaging Spectroradiometer (MODIS). The MODIS aboard the Terra and Aqua satellites measure
AOD twice a day and the data have a spatial resolution of approximately 10 x 10 kilometers. AOD
is measured on a log scale of 0 to 5 and measures the fraction of incoming light reflected by the air
column before reaching the ground. The resulting estimates have been shown to be good predictors
of particulate matter (PM) of different sizes (Chu et al. (2003); Gupta et al. (2006); Kumar et al.
(2007)).
As highlighted in Dey, Di Girolamo, et al. (2012), AOD differs from traditional pollution moni-
toring data since AOD only measures suspended particulates, as opposed to monitoring data which
collect data on a variety of pollutants including ozone or sulfur and nitrogen oxides. Prior research
10
The PPVT is a test for assessing receptive vocabulary. The test requires respondents to select the pictures that
best represent the meaning of a series of stimulus words read out by the examiner.
9examining the impact of air pollution on economic outcomes in developing countries has used AOD
as a proxy for pollution (Foster et al. (2009); Greenstone, Nilekani, et al. (2015); Gendron-Carrier
et al. (2018)). Van Donkelaar et al. (2014) examine the extent to which AOD correlates with PM2.5
levels in India and find that there is a strong correlation between ground level PM2.5 and AOD.11
Environmental and atmospheric science studies have also extensively used AOD as a measure of air
quality (see e.g. Guazzotti et al. (2003); Dey and Di Girolamo (2010); Dey, Di Girolamo, et al.
(2012); Ten Hoeve and Jacobson (2012)). Using multiple regression analysis, Shaw and Gorai (2018)
found that there was a strong correlation between AOD data from the MODIS Aqua satellite and
PM2.5 and PM10 concentrations in different parts of India.
Hansen-Lewis (2018) demonstrates that the AOD data are consistent with the main descriptive
features of air pollution in India. Across India, AOD exceeds the clear air level of 0.1. Due to
inversions and inland accumulation, air pollution is much worse in the northern and eastern states
of Punjab, Haryana, Rajasthan, Uttar Pradesh, Bihar, and West Bengal. Figure 2 examines the
trend in AOD from 2002 - 2014. In line with rising particulate matter pollution in India, mean AOD
in India has risen from around 0.37 µg/m3 in 2002 to close to 0.45 µg/m3 in 2014. For the years
included in this study i.e. 2007 - 2014, AOD has largely remained between 0.40 - 0.45, with the mean
AOD being 0.41 (Table 3).
3.4 Thermal Inversions
Normally, at higher altitudes, temperatures are lower. A thermal inversion occurs when this process
reverses and a mass of hot air is present above a mass of cold air (Arceo et al., 2016). Broadly
inversions are of three types: (a) radiation inversions, which take place at night when the ground
and the air in touch with the ground are cooled faster than air layers located higher above, (b)
subsidence inversions, which occur from vertical air movements when a layer of cold air descends
through a layer of hot air, and (3) marine inversions which take place when air above the sea, which
is cooler than the air above land, flows inland and pushes the warm inland air upward. While thermal
inversions by themselves do not pose a health risk, when they are accompanied by high levels of air
pollution (either vehicular or through industrial emissions) there can be a temporary accumulation of
pollutants. Specifically, inversions can lead to a higher concentration of various pollutants including
particulate matter (Jacobson and Jacobson (2002); Arceo et al. (2016)) and studies have shown that
strong inversions are associated with the worst reported pollution events in history (Malek et al.
(2006); Iacobellis et al. (2009); Bailey et al. (2011)).
We identify thermal inversions in India using reanalysis data from the NCEP/NCAR data, which
provides air temperatures at a 2.5 x 2.5 degree grid (roughly 250kms by 250kms).12 The NCEP/NCAR
data provides temperature in 17 layers, defined by air pressure in that layer. We use the temperatures
for the two pressure levels closest to the ground available in the NCEP/NCAR data (1000hPa and
11
(Van Donkelaar et al., 2014) show that a one-unit increase in AOD increases PM2.5 by 108µg/m3 . Thus, a 0.01
unit change in AOD is approximately equal to one µg/m3 .
12
https://www.esrl.noaa.gov/psd/data/gridded/data.ncep.reanalysis.pressure.html
10925hPa) to identify inversion episodes. Such reanalysis data has been supported in the literature
as generating a consistent best-estimate of weather in a grid-cell and has been used extensively in
economics (Garg et al. 2018; Hansen-Leiws, 2018; Schlenker and Roberts, 2009; Schlenker and Lo-
bell, 2010; Auffhammer et al., 2013). The 1000hPa layer temperature corresponds to the surface
conditions and 925hPa layer measure conditions at approximately 600m above sea level. We use the
temperature differences between these two layers to identify inversion episodes and inversion strength.
During normal conditions (inversions), the temperature decreases (increases) with altitude and hence,
the temperature difference between the 925hPa and 1000hPa air layer is negative (positive). While
the data is collected four times in a day, in our analysis, like Jans et al., (2014) and Molina (2018) we
focus on only nighttime inversions. This is because, given the high variation across space and time,
nighttime inversions have a stronger correlation with pollution in the first stage of the IV strategy
described below. Further, nighttime inversions are less susceptible to endogenous behavior changes
since they are less visible than daytime inversions.
To construct the thermal inversion variable, for each day in a year, we create an indicator equal
to 1 if the nighttime temperature in the 1000hPa pressure level is higher than the nighttime tem-
perature in the 925hPa pressure level (where nighttime temperature is observed at 12am). We then
average this over each district-year. Table 3 shows the mean and standard deviation for our inversion
measure. There are about 70 daily nighttime inversions on average, annually across India. Alter-
natively, approximately 70 days in a year witness a nighttime inversion episode.13 The variation is
large (standard deviation is 76) from 0 nighttime inversions to some places witnessing 264 nighttime
inversions in a year.14
3.5 Other Weather Data
Similar to previous literature, to improve the precision of our estimates, we employ data on tempera-
ture, precipitation, wind velocity, and relative humidity. Data on precipitation and temperature are
obtained in 0.5 degree grids from the University of Delaware (Willmott and Matsuura (2015)). Data
on surface wind velocity and relative humidity was constructed using the ECMWF ERA-Interim and
ECMWF ERA-5, respectively (Dee et al., 2011). Controlling for humidity and wind velocity are
important since they can impact both, air pollution levels and health. Table 3 reports descriptive
statistics of AOD, thermal inversions, and other weather controls. Our main weather controls in all
specifications include: mean temperature, precipitation, wind velocity, and relative humidity; and
their squares.
13
Since we measure inversion at only one point in a day i.e. night, the total number of inversions in a year is equivalent
to the total days in a year an inversion episode occurred.
14
There is wide variation in the literature on the annual daily number of inversion episodes. Arceo et al. (2016) report
that average number of inversions (combining inversions in a whole day) in a year are approximately 87.36. Fu et al.
(2017) report 157 daily inversions in a year in their sample.
114 Empirical Methodology
4.1 Ordinary Least Squares (OLS)
To examine the effect of air quality on child learning outcomes, we start by first estimating an
OLS specification. The main goal of estimating an OLS specification is to demonstrate that OLS
estimates of air quality on human capital may not represent causal impacts. Specifically, we estimate
the following OLS regression model:
Yidt = β0 + β1 AirQuality dt + γXidt + δZdt + πa + αt + ηd + ηs,t + idt (1)
where Yidt is the outcome of interest (e.g. reading or math outcome) for student i in district d
in survey year t = 2007 - 2014. AirQuality dt is the ambient air quality defined by AOD in district
d in survey year t.15 We include district fixed effects, ηd to control for time invariant district level
heterogeneity. We also include state-specific linear time trends, ηs,t , to control for unobservable
factors correlated with education that vary linearly over time within states. Finally, we control for
child age fixed effects, πa , to account for cohort-specific effects, and year of interview fixed effects, αt ,
to account for common trends in education. Individual controls, Xidt , include an indicator for male,
household size, and an indicator for mother having attended school. We also include a vector of time
varying district level weather controls, Zdt , which include controls for precipitation, temperature,
wind velocity, relative humidity, and their squares. Finally, standard errors are clustered at the
district level to allow for correlation of the error term within a district.
Given the large inequalities between girls and boys in India, we also present heterogeneous effects
for girls and boys separately. In addition, in the standard human capital model, children and parents
are forward-looking and view schooling as an investment with financial returns. However, children of
different ages have different levels of vulnerability to poor air quality due to their differing roles in
the household. Older children, both boys and girls are more likely to engage in paid work outside the
household, compared to younger children who would perform domestic duties within the household.
Exposure to pollution for younger children may come from attending school. For older children, it
may be a combination of going to school and from not attending school and instead being exposed
to pollution during work on or off the farm. Thus, we study separately the effect of air quality on
children between the ages of 6 and 10 and older children ages 11 to 16.
4.2 Instrumental Variables (IV) Framework
Variations in pollution levels across time and space are not quasi-random. Additionally, households
living in areas with high pollution are different on observable and unobservable characteristics than
households who live in cleaner neighborhoods. To address this endogeneity problem, we use thermal
inversions as an instrument for air quality to provide causal estimates of the short-term effects of poor
15
We follow Gendron-Carrier et al. (2018) and do not express the independent variable, AOD, in logarithmic terms.
This is because AOD is already a logarithm (see Section 3.3).
12air quality on children’s human capital. Thermal inversions occur when a mass of hot air situates
above a mass of cold air. During inversion episodes, the temperature follows a non-monotonic pattern
in altitude. The temperature first increases with altitude up to the inversion layer, and then decreases
with altitude. This leads to a sharp deterioration of air quality in the ground level air layer since
pollutants are trapped under the inversion layer. Using the NCEP/NCAR data described in Section
3.4, we identify daily inversion episodes for 2007 - 2014. Our main instrument is number of daily
nighttime inversions. We estimate the following two-stage least squares (2SLS) specification:
AirQuality dt = α0 + α1 Inversionsdt + γXidt + δZdt + πa + αt + ηd + ηs,t + dt (2)
Yidt = β0 + β1 AirQuality dt + γXidt + δZdt + πa + αt + ηd + ηs,t + idt (3)
where Equation 2 and Equation 3 are the first and second-stage equations. Inversionsdt is our
main instrumental variable which is equal to the number of daily nighttime inversions occurring in
district d in year t = 2007 - 2014. All other variables are defined as before.
The relationship between thermal inversions and other meteorological factors might also impact
the validity of the instrument. To address this we include controls for ground level temperature,
precipitation, relative humidity, and wind velocity and their squares as described above. Controlling
for these weather variables is important since inversions have a clear seasonal pattern and temperature
may independently affect infant mortality (Deschênes and Greenstone (2007); Arceo et al. (2016)).
This is demonstrated in Figure 3, which shows the average number of daily nighttime inversions by
month of year for our study period, 2007 - 2014. Inversions are concentrated in the winter months
of November - March. However, inversions also occur in the summer months i.e. April and October,
when there is relatively little rain. Flexibly controlling for temperature enables us to dientangle the
effects of temperature from that of pollution.
5 Results
5.1 OLS Estimates
We start by first examining the relationship between air quality and human capital in an OLS
framework. Specifically, we estimate Equation 1 in Table 4. The OLS estimates imply that AOD
has very small to no impact on learning outcomes. In particular, there is no statistically significant
impact on reading outcomes. With respect to math outcomes, t7here is a small decline in the ability
to do subtraction. That is, a 0.01 increase in AOD (one µg/m3 in PM2.5) results in a 0.07 percentage
point decline in the probability of being able to subtract. These impacts are quite small in absolute
terms. This is not unexpected because we expect OLS estimates to be biased upward toward or
above zero because of simultaneity bias. Consequently, we next turn to examining the impacts of air
quality on learning outcomes in an IV framework.
135.2 IV First Stage
Turning next to the IV framework, we first examine the relationship between the number of daily
nighttime inversions and our measure of pollution, AOD. This comprises the first stage of our IV
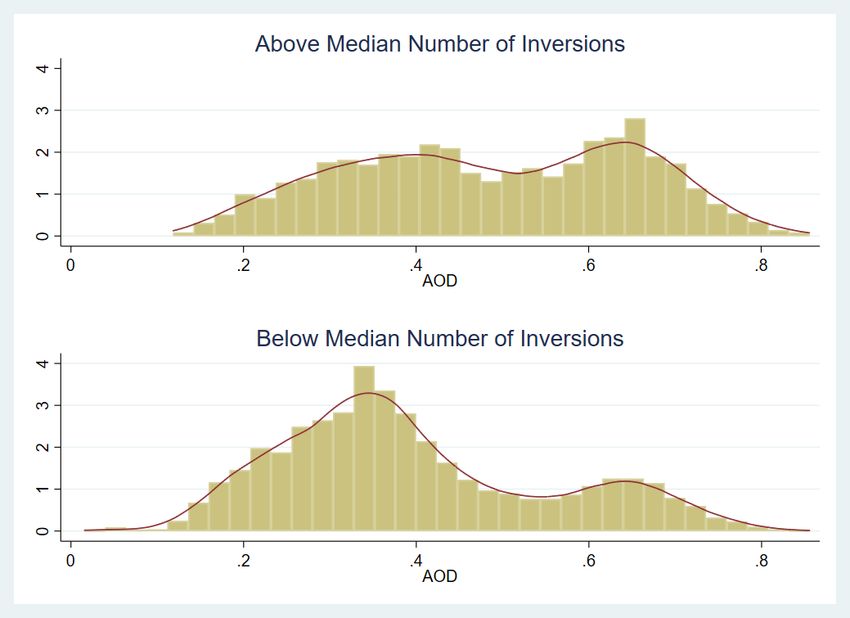
strategy. In Figure 4 we present annual mean AOD separately for districts with above and below the
median level of annual nighttime inversions. The frequency of high AOD is concentrated in districts
witnessing higher than the median number of nighttime inversions (top panel), suggesting a positive
relationship between the average annual daily nighttime inversions and AOD.
We also provide corresponding regression analysis in Table 5. Specifically, we present coefficient
estimates from Equation 2. In column (1) we include district fixed effects, survey year fixed effects,
and weather, and individual level controls. In column (2), we also include state-time linear trends. As
suggested by the figure, the number of inversions have a positive and statistically significant effect on
average annual AOD. One additional nighttime inversion, on average, results in an increase in AOD by
0.0002 units (roughly 0.02µg/m3 ).16 These are big effects. This implies that a one standard deviation
increase in daily nighttime thermal inversions increases AOD by 0.015 units (roughly 1.5µg/m3 or
3.4%).17,18
We test the robustness of the first stage relationship by estimating the first stage relationship in
the bottom panel of Table 5 using an alternate measure of inversions, namely ‘inversion strength’.
Inversion strength is defined as the temperature difference between the ground level air layer and the
air layer just above it.19 We find that using this alternate definition of inversion strength, the first
stage is still positive and statistically significant.
The main identifying assumption underlying the IV approach is that the exclusion restriction
i.e. thermal inversions impact human capital only through their impact on AOD. This identifying
assumption could, be violated if inversion episodes also change children’s outdoor activities. We
examine if individuals can change their behavior by predicting pollution increases due to nighttime
inversions. Even if individuals endogenously move to locations with less pollution, they will not
be able to avoid changes in pollution arising from thermal inversions since they will not be able to
control or anticipate those changes. Following Hansen-Lewis (2018), in Table 6, we run the first stage
regression where future AOD is the dependent variable. The trend shows that an additional daily
nighttime inversion does not change the trend in AOD next year.
5.3 IV Estimates using ASER Data
We next present results from the main instrumental variable specification in Table 7. Results are
presented for four levels of reading outcomes: can read a letter, can read a word, can read grade
1 text, can read grade 2 text; and four levels of math outcomes: can count numbers 1 - 9, can
16
Van Donkelaar et al. (2014) show that a one-unit increase in AOD increases PM2.5 by 108µg/m3 . This implies a
change of 0.0002 units translates to 0.02µg/m3 .
17
The Angrist-Pischke F-statistics are above the Stock-Yogo 10 percent threshold for weak instruments.
18
Standard deviation of thermal inversions = 75.79. Thus, a one standard deviation (S.D.) increase in daily nighttime
inversions will increase AOD by 75.79*0.0002 = 0.015 units.
19
In Table 3 we present the mean and standard deviation of the ‘inversion strength’ variable.
14count numbers 10 - 99, can do subtraction, and can do division. All outcome variables are indicator
variables taking the value 0/1. Similar to the literature, we present results in terms of a 0.01 unit
increase in AOD which equals one µg/m3 increase in PM2.5.
On average, both reading and math outcomes decline significantly due to poor air quality. All
four reading levels witness a decline, with the decline being smallest for the lowest level of reading.
Specifically, for a 0.01 unit increase in AOD (one µg/m3 in PM2.5), the probability of reading a letter
declines by 0.57 percentage points (significant at the 10 percent level). This is unsurprising because
almost 90 percent children at baseline can read letters. The probability of reading level 1 text and
the probability of reading level 2 text witnessed the largest declines. For a 0.01 unit increase in AOD
(one µg/m3 in PM2.5), the probability of reading level one text and the probability of reading level
two text declines by 1.67 and 1.40 percentage points, respectively (significant at the 1 percent and 5
percent levels).
With respect to math outcomes, there is no impact on the lowest level of math scores i.e. counting
numbers from 1 to 9. Higher levels of math are significantly impacted by poor air quality. The
probability of counting numbers from 10 - 99 and the probability of subtraction decline by 1.37
percentage points and 1.43 percentage points, respectively, for a 0.01 unit increase in AOD (one
µg/m3 in PM2.5).
We also examine heterogeneous effects by age and grade. Regression estimates in Table 8 are
presented separately for boys and girls and also separately for children of primary school age (6-10
years) and older children (11-16 years), as they might respond differently to changes in air quality.
For younger children, poorer air quality (or a higher AOD) is associated with a lower likelihood
of recognizing letters and words. The effect is present for both boys and girls. The estimated
effect implies that a 0.01 one unit increase in AOD (one µg/m3 in PM2.5), significantly reduces the
probability of recognizing letters for boys (girls) by 1.09 (0.94) percentage points. The impact on
recognizing words is stronger - for a 0.01 unit increase in AOD, the probability of recognizing words
significantly reduces by 1.90 (2.38) percentage points for boys (girls). Young girls also have strong
negative impacts on being able to read grade 1 and grade 2 text. Specifically, for girls, a 0.01 unit
increase in AOD (one µg/m3 in PM2.5) reduces the probability of being able to read grade 1 text
and grade 2 text by 2.33 and 1.31 percentage points, respectively. The effect for boys is smaller
- the probability of reading grade 1 text reduces by 1.25 percentage points (significant at the 10%
level). With respect to math outcomes, we find that the probability of recognizing double digit
numbers (10 - 99) declines by 1.63 (2.15) percentage points for boys (girls), for a 0.01 unit increase
in AOD (one µg/m3 in PM2.5). No other math outcome for young children is impacted significantly.
This is unsurprising since more complex math problems like division are taught only from grade 5
onwards, relevant for only the 9-10-year-old children in the sample of 6-10-year-old children. Apart
from probability of reading a letter, among younger children, girls witness a larger decline for all
other reading and math outcomes.
For older children between the ages of 11 - 16 years, we find stronger effects. An increase in current
year AOD by 0.01 units (one µg/m3 in PM2.5) reduces all reading outcomes for boys, significant at
15the 1% level. The strongest effect is on the ability to read grade 2 text which declines by 1.83
percentage points. Similarly, for girls, all reading outcomes decline, with the decline being larger for
more advanced reading outcomes. An increase in AOD by 0.01 units (one µg/m3 in PM2.5) reduces
the probability of girls being able to read grade 2 text by 2.48 percentage points. With respect to
math outcomes, we once again find a steady decline in all math outcomes, with the more advanced
math outcomes witnessing a larger decline. Specifically, an increase in AOD by 0.01 units (one µg/m3
in PM2.5) reduces the probability of doing division by 1.85 (2.50) percentage points for boys (girls),
respectively. For both math and reading outcomes, like for younger children, older girls witness a
larger decline.
Putting these effects into perspective - Chakraborty and Jayaraman (2019) find that a one-month
exposure to a school feeding program increases the probability that 6-10-year-old children are able
to read a word or recognize double-digit numbers by 0.2 percentage points.20 This suggests that our
estimates for younger children are similar to the effect of exposure to more than one year of school
feeding. Alternatively, Shah and Steinberg (2017) analyze the cognitive effects of exposure to drought
in utero from India and find that exposure to drought in utero is associated with being 2 percentage
points less likely to recognize numbers in childhood. Further, Spears and Lamba (2013) find that
moving from 0 latrines per capita to 1 latrine per capita in India improves young children’s ability to
recognize letters or better by 0.72 percentage points. For older children, the effects are larger. They
are comparable to those found in other studies. For instance, Barham (2012) estimates the effect
on cognitive outcomes of a maternal and child health, family planning, and vaccination program in
Bangladesh and finds that early life exposure to the program caused a 0.39 standard deviation in a
measure of cognitive functioning when children were 8 to 14 years old.
5.4 Heterogeneous Effects by State
As documented in Figure 2 in Hansen-Lewis (2018), the most polluted districts in India i.e. the ones
with the highest levels of AOD lie in 6 states. These are: Rajasthan, Punjab, Haryana, Uttar Pradesh,
Bihar, and West Bengal. Mean AOD in districts in these states is 0.57 compared to the national
average of 0.41. We classify these 6 states as ’polluted states’ and examine impacts separately for
these states and other states. Intuitively, we would expect that impacts would be stronger in states
with her levels of AOD.
Table 9 presents our main specification with the current year AOD variable interacted with whether
the district is in a polluted state or not. We present results for all our variables of interest: four
levels of reading outcomes and four levels of math outcomes. As expected, there seems to be almost
no effects beyond the polluted states. All the impacts of air pollution exposure on learning outcomes
are coming from these 6 states. In terms of reading outcomes, the impact in polluted states of
air pollution exposure ranges from a decline of 0.89 percentage points for letter recognition to 2.65
20
The median educational intervention leads to impacts between 0.08 and 0.15 S.D. (McEwan (2015); Garg et al.
(2017)). Educational interventions such as school construction programs and other programs from India and other
countries have found large effects on learning outcomes: 0.4 S.D. (Akresh et al. (2013)), 0.65 S.D. (Burde and Linden
(2013)); 0.5 S.D. (Banerjee et al. (2007)), 0.2 S.D. (Glewwe et al. (2009)), and 0.3 S.D. (Muralidharan et al. (2019)).
16You can also read