Polycab India (POLYCAB IN) - Rewiring into a B2C giant
←
→
Page content transcription
If your browser does not render page correctly, please read the page content below
Polycab India (POLYCAB IN)

                                      Rating: BUY | CMP: Rs1,034 | TP: Rs1,247

Rewiring into a B2C giant
Paarth Gala paarthgala@plindia.com | 91-22-66322242

Amnish Aggarwal amnishaggarwal@plindia.com | 91-22-66322233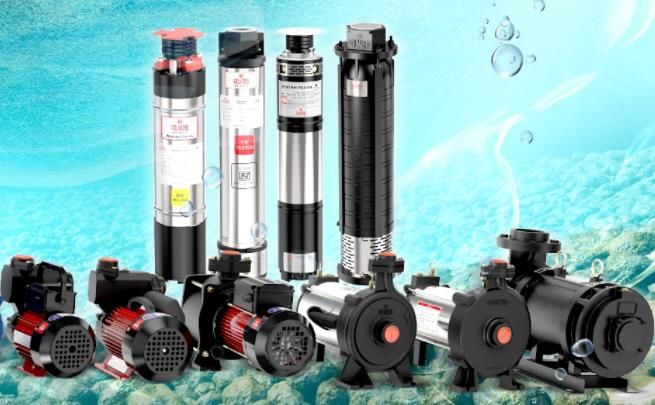
Polycab India

                  Contents

                                                                                                      Page No.
                  Polycab – Evolving into a formidable FMEG player ............................................... 4
                  Story in charts ........................................................................................................ 5
                  FMEG – Premium positioning with focus on large categories ................................ 6
                     FMEG CAGR of 28.8% over FY21-23 to improve B2C mix ............................... 6
                        FMEG margins to improve by 600bps over FY20-23E ................................... 8
                     Fans (40-45% of FMEG sales): Increasing premium offerings ......................... 10
                     Lighting (20-25% of FMEG sales): Innovation remains a key to success ......... 11
                     Switches & Switchgears (15% of FMEG sales): Immense growth potential ..... 12
                     Others (15% of FMEG sales): Achieving meaningful scale across categories
                     remains key ...................................................................................................... 13
                  Market leader in wires & cables ........................................................................... 14
                     EPC business: Focus on projects with 40-60% cabling requirement ............... 16
                     Wires & Cables (85% of total sales): Looking to enter new product
                     segments/markets ............................................................................................ 17
                        Govt. capex of Rs111 lakh crore for Infra Development under NIIP ............. 17
                  Housing market revival to aide electrical demand ............................................... 18
                  Strong distribution network .................................................................................. 19
                        Investing in distribution expansion/ automation ............................................ 20
                  Polycab has Atamnirbhar Focus .......................................................................... 21
                  Channel check takeaways ................................................................................... 23
                  Financials & Valuations ....................................................................................... 24
                     Estimate CAGR of 16.7% in Sales over FY21-23 ............................................ 24
                     Commodity prices are near term headwind ...................................................... 25
                     EBITDA and PAT CAGR of 16.5% and 15% over FY21-23 ............................. 26
                     Valuations: Rising B2C mix can re-rate the stock ............................................ 28
                  Annexure: ............................................................................................................ 30
                     Board of Directors & KMP ................................................................................ 30

January 4, 2021                                                                                                                           2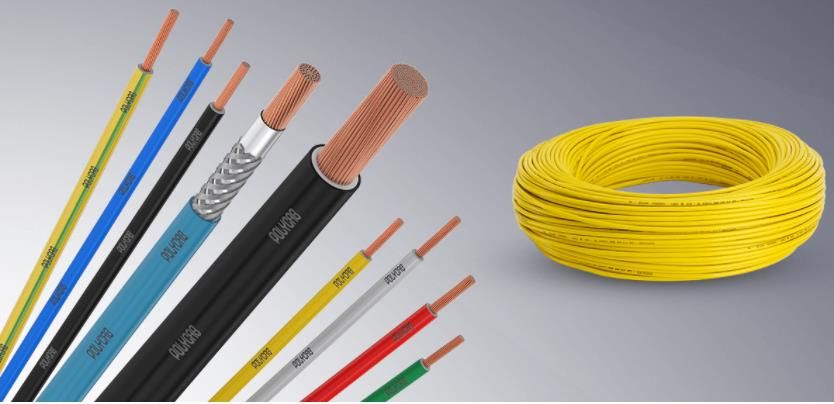
January 4, 2021 Polycab India (POLYCAB IN)
Company Initiation
Rating: BUY| CMP: Rs1,034 | TP: Rs1,247
Rewiring into a B2C giant
We initiate coverage on Polycab with a BUY rating and target price of Rs1,247
Key Financials - Consolidated
on SOTP basis. We believe Polycab is fast emerging as a B2C player given 1)
Y/e Mar FY20 FY21E FY22E FY23E
strong potential in FMEG and Retail wires segment 2) sustained investments
Sales (Rs. m) 88,300 85,207 1,02,459 1,16,035
EBITDA (Rs. m) 11,350 11,249 13,246 15,261 in brand building and 3) steadily increasing distribution network. We believe
Margin (%) 12.9 13.2 12.9 13.2 Polycab is well placed to capitalize on uptick in demand for housing
PAT (Rs. m) 7,591 7,792 8,888 10,310 construction given wide product range in Cables, Wires, Switchgear,
EPS (Rs.) 51.0 52.3 59.7 69.3 Switches, Conduit Pipes, Lighting, Fans and Water heaters etc.
Gr. (%) 44.1 2.7 14.1 16.0
DPS (Rs.) 7.0 9.0 11.0 13.5 We estimate 13% and 24% CAGR in sales of B2C wires and FMEG which will
Yield (%) 0.7 0.9 1.1 1.3
increase sales contribution mix (currently at 40%) to ~50% over next 5 years.
RoE (%) 22.7 18.2 17.5 17.5
Increase in scale of operations and improved mix will improve FMEG margins
RoCE (%) 30.5 24.4 23.5 23.6
EV/Sales (x) 1.7 1.7 1.4 1.2 by 600bps over FY20-23. We estimate Sales/PAT to grow at a CAGR of 16.7%/
EV/EBITDA (x) 13.4 12.8 10.7 9.0 15% over FY21-23E led by 14.4% and 28.8% sales CAGR for wires and cables
PE (x) 20.3 19.8 17.3 14.9 and FMEG segments and 30bps margin expansion led by scale/mix. We value
P/BV (x) 4.0 3.3 2.8 2.4 the stock on SOTP basis and arrive at a target price of Rs1,247(derived PE of
18x FY23 EPS; W&C/ FMEG valued at 18x/ 25x). Polycab trades at 14.9x FY23
EPS, which is at a premium to Finolex/KEI (12.4x/11.6x), but at a significant
discount to ECD players like Havells/Crompton (46.8x/ 35x). Steady increase
in B2C mix will likely rerate the stock in long term. We initiate coverage with
Key Data POLC.BO | POLYCAB IN BUY rating.
52-W High / Low Rs. 1,182 / Rs. 570
Sensex / Nifty 47,869 / 14,019 Investment Arguments
Market Cap Rs. 154 bn/ $ 2,108 m
Shares Outstanding 149m
3M Avg. Daily Value Rs. 904.85m Fast emerging as a B2C player: Polycab has evolved itself from being B2B
player to a fast growing B2C brand, given increase in FMEG share by 680bps
to 9.4% over FY15-20. B2C mix (FMEG/ retail wires), currently at 40% is set to
breach 50% in the medium term given 1) strong growth potential in FMEG and
& Retail wires segment 2) investments in brand building and 3) increase in
Shareholding Pattern (%) distribution reach (from 100,000 to 137,000). We believe presence in large
Promoter’s 68.53 FMEG categories like Fans, Lighting, Switchgear, Switches, Pumps and
Foreign 15.60 Appliances (Coolers, Water heaters and Irons) will enable sales to grow at a
Domestic Institution 2.73
CAGR of 28.8% over FY21-23.
Public & Others 13.14
Promoter Pledge (Rs bn) -
Market leader in Wires & Cables with most versatile range: Polycab is
India's largest and most versatile manufacturer of Wires and Cables (12%/ 18%
overall/ organized share) with presence across segments like Power cables,
Control cables, Optic fiber cables, Instrumentation cables and Solar cables.
We expect W&C segment sales CAGR of 14.4% over FY21-23 led by 1)
Stock Performance (%)
1M 6M 12M
Infrastructure schemes (like Smart Cities, Housing for all etc.) 2) Entry into
Absolute 7.7 29.6 4.0 newer segments (like EVs, defence) and 3) Distribution led export model.
Relative 0.4 (4.1) (10.2)
Valuation & Outlook: We estimate Sales/PAT CAGR of 16.7%/ 15% over
Paarth Gala FY21-23 led by 1) improving business mix, 2) gains from operating leverage
paarthgala@plindia.com | 91-22-66322242 and cost optimizing initiatives 3) sustained investments in brand building and
Amnish Aggarwal 4) increasing distribution reach. At current valuations of 14.9x FY23 earnings,
amnishaggarwal@plindia.com | 91-22-66322233
it trades at a premium to Finolex/KEI (12.4x/ 11.6x), but at a significant discount
to ECD players like Havells/Crompton (46.8x/ 35x). Steady increase in B2C
mix will rerate the stock in long term. Initiate coverage with a BUY rating and a
SOTP derived target price of Rs1,247, a 21% upside.
January 4, 2021 3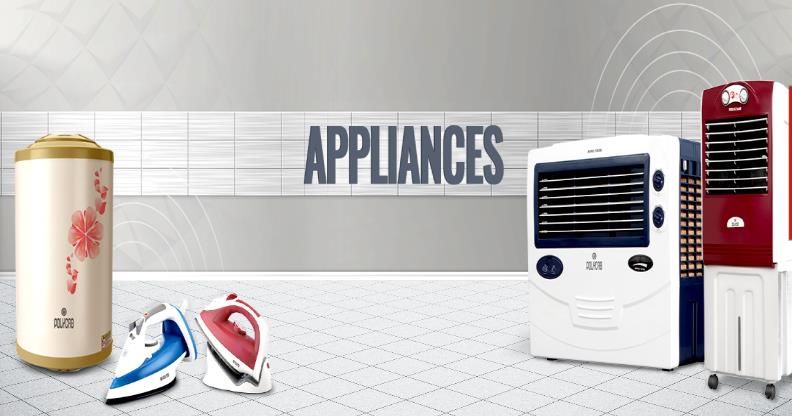
Polycab India
Polycab – Evolving into a formidable FMEG player
Polycab is India’s largest player in wires and cables (W&C) segment with formidable
brand presence. It is one of the fastest growing FMEG (Fast Moving Electrical
Goods) player, aiding its transformation from a B2B company to a B2C company.
Polycab is a market leader in domestic wires & cables (W&C) segment with
over 12% market share (18% organized market share).
A forward extension to its W&C business, Polycab is also present in EPC
business bidding for projects with ~40-60% cabling requirement.
In 2014 Polycab entered FMEG space by selling fans, lights, switches,
switchgears, irons, water heaters, coolers, solar, pumps and conduit pipes etc.
Polycab’s fundamental strategic priorities are built around five axes: 1)
strengthening business and product offerings 2) growing distribution network
3) enhancing technological competence 4) augmenting brand visibility &
customer satisfaction and 5) improving operational efficiency
Polycab manufactures majority of its products in-house through 25 plants (4 for
FMEG) across 7 locations. High degree of backward integration enables it to
maintain full control over quality and supply chain, lower operational costs and
deliver products at competitive prices.
Contribution of B2C business increased from 30% since few years ago to
present 40%. We expect it to breach 50% in medium term led by 24%+ growth
in FMEG business and 13% growth in Polycab branded wires business.
Over FY15-20, Polycab’s sales grew at a CAGR of 13.4% with W&C segment
growing by 11.4% and FMEG by 46.7%. Within W&C, Polycab is focused on
consolidating its presence by entering in new categories (special cables) while also
establishing a distribution led export business. In FMEG, focus is on improving the
mix and profitability by introducing more premium offerings in large categories (like
fans, lights, switches, switchgears) and achieving scale in remaining categories.
FMEG now contributes 9.4% of sales while EBIT contribution is at 1.6%
Others Sales mix - FY20 Others EBIT mix - FY20
6% FMEG 8%
FMEG
2%
9%
Wires &
Cables Wires &
85% Cables
91%
Source: Company, PL Source: Company, PL
January 4, 2021 4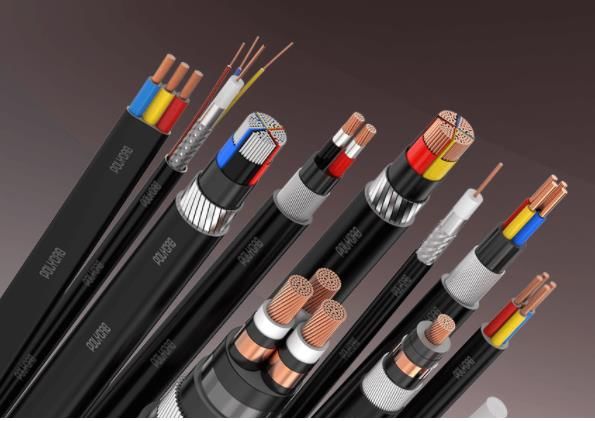
Polycab India
Story in charts
Revenues to grow at 16.7% CAGR over FY21-23E FMEG contribution to increase to 13.3% in FY23
Revenue (Rs bn) YoY gr % (RHS) Revenue mix %
23.1
140 20.2 25.0 Wires & Cables FMEG Copper Others
120 17.9 4% 6% 6% 4% 4% 4%
20.0 100%
100 13.3 4% 4% 4%
10.6 15.0 80% 7% 8% 9% 11% 12% 13%
80
85
10.0 60%
60
5.0 40%
40
102
116
20 -3.5 - 20%
68
80
88
89% 86% 85% 81% 80% 79%
- -5.0 0%
FY18 FY19 FY20 FY21E FY22E FY23E FY18 FY19 FY20 FY21E FY22E FY23E
Source: Company, PL Source: Company, PL
Margins to expand by 30bps over FY20-23E PAT to grow at a CAGR of 15% over FY21-23E
EBITDA (Rs bn) margin % (RHS) Adj.PAT (Rs bn) YoY gr % (RHS)
12.9 13.2 12.9 13.2
18.0 14.0 12.0 53.9 51.9 60.0
11.9
16.0 10.8 12.0 10.0 50.0
14.0 39.6
10.0
12.0 8.0 40.0
8.9
8.0
7.8
10.0
6.0 30.0
8.0 6.0
14.1 16.0
6.0 4.0 20.0
4.0
4.0
11.4
11.2
13.2
15.3
10.3
7.3
9.5
3.6
5.0
7.6
2.0 2.0 2.7 10.0
2.0
- - - -
FY18 FY19 FY20 FY21E FY22E FY23E FY18 FY19 FY20 FY21E FY22E FY23E
Source: Company, PL Source: Company, PL
FMEG margins to expand by 6% over FY20-23 FMEG contribution to rise to 9.1% by FY23
EBIT margins % EBIT Mix %
Wires & Cables FMEG Copper Wires & Cables FMEG Copper Others
12 13 12 12
14 12 100% 1% 1%
10 11 11 1% 2% 8% 4% 4% 4%
12 10
95% 3% 4% 4%
10 8 2%
7 90% 5%
8 7%
5
6 9%
85%
4 2 2
1 80%
2 - - - 97% 97% 91% 88% 86% 83%
- 75%
FY18 FY19 FY20 FY21E FY22E FY23E FY18 FY19 FY20 FY21E FY22E FY23E
Source: Company, PL Source: Company, PL
January 4, 2021 5
Polycab India
FMEG – Premium positioning with focus on large
categories
Polycab is India’s largest wires and cables manufacturer with Pan-India distribution
network offering strong suite of products. In a bid to enlarge its product bouquet
and move away from B2B focused strategy, in 2014, leveraging their strong brand
recall/distribution reach in electrical industry, Polycab forayed into high potential
Fast Moving Electrical Goods (FMEG) segment.
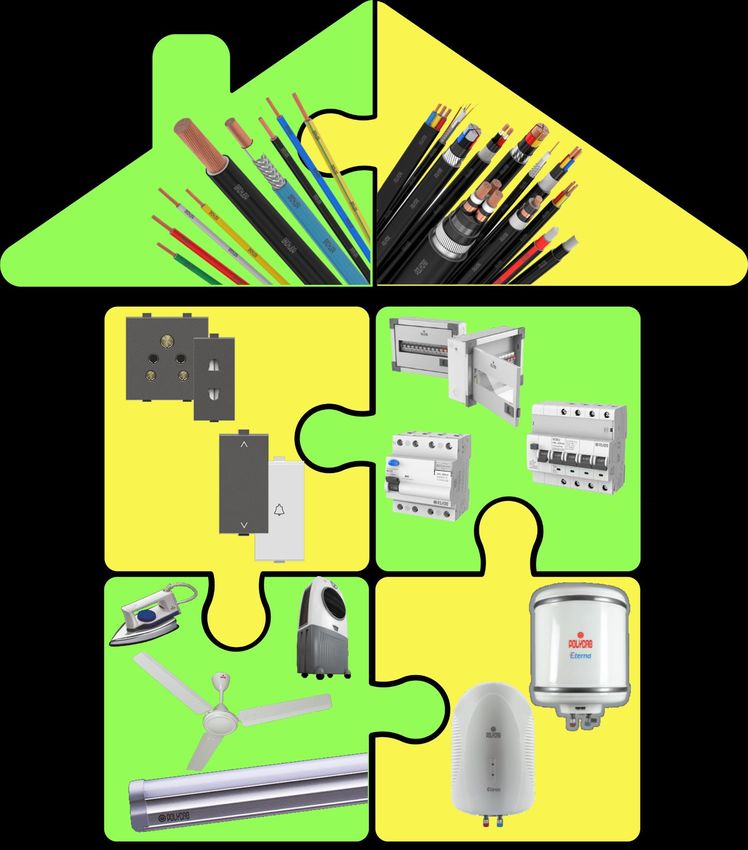
Diverse Product Basket: Under FMEG, Polycab currently sells Fans, Lighting
Luminaries, Switches, Switchgears, Water Heaters, Pipes, Conduits, Agro
Pumps, Solar, Air Coolers, Irons etc. Apart from Kitchen Appliances and Home
Appliances Polycab is present across all major categories with target market
size of Rs700bn currently.
Positioned as a mass premium brand: After initially venturing into economy
categories across segments, Polycab gradually expanded its product range in
mass-premium and premium segments. Its products are generally priced at a
5-10% discount to leading brands. However, having made their mark in FMEG
space, Polycab is focused on augmenting innovation and improving
penetration of premium products in large categories like Fans, Lighting,
Switches and Switchgears.
Polycab is present across large range of product categories; Fans/Lighting/Switches/Switchgear key categories
Players Fans Lightings Switches Switchgears Water Heaters Home App Kitchen App
Bajaj Electricals Ltd
Crompton Consumer
Finolex Cables Ltd
Havells India Ltd
Orient Electric Ltd
Philips India
Polycab India Limited
Surya Roshni Ltd
TTK Prestige Ltd
Usha International Ltd
V-Guard Industries Ltd
Source: Company, PL
FMEG CAGR of 28.8% over FY21-23 to improve B2C mix
Over past six years, Polycab evolved itself from being majorly a B2B player to a
fast growing B2C brand. Contribution of B2C mix (FMEG and retail wires) improved
to c.40% in H1FY21 (35% in FY20). Over FY15-20 FMEG revenues grew 6.8x at a
CAGR of 46.7% to Rs8.4bn, which currently contribute 9.4% of revenues. We
expect B2C mix to further increase, led by 28.8% sales CAGR in FMEG revenues
over FY21-23.
Strong growth potential in FMEG and Retail wires: Growth opportunities in
the Indian FMEG industry remain high, aided by improving macro drivers like
1) rising consumer aspirations 2) increasing awareness 3) rising income levels
4) rural electrification 5) urbanization and 6) digital connectivity
January 4, 2021 6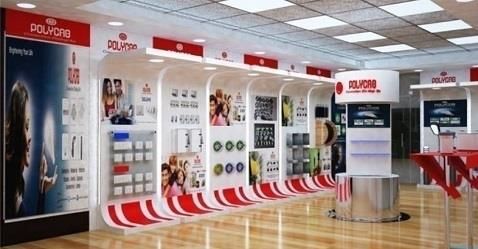
Polycab India
Revenues CAGR of 28.8% over FY21-23E FMEG to contribute 13.3% of FY23 sales
FMEG (Rs bn) YoY growth % (RHS) FMEG contribution to sales (%)
18 71 80 FMEG
16 61 70
14 60 15% 13%
12 43 12%
50 11%
10 33 30 31 9%
27 40
8 10% 8%
6 30 7%
12 20 6%
2
4
12
16
10 5% 3%
3
5
6
8
9
2
- -
FY16
FY17
FY18
FY19
FY20
FY21E
FY22E
FY23E
0%
FY16 FY17 FY18 FY19 FY20 FY21E FY22E FY23E
Source: Company, PL Source: Company, PL
Sustained investments in brand building: Polycab enjoys a powerful legacy
in electrical industry owing to its wires business. Over past few years, Polycab
further fortified its brand positioning via sustained investments in marketing and
brand promotional activities. Focus has been on increasing brand awareness
and customer loyalty through creative promotions and new age marketing,
using both digital and traditional channels. Polycab’s continued association
with IPL since 2016 has also provided a huge fillip towards brand visibility and
has expanded their reach to wider audiences, across the country. Since FY17,
Polycab has spent c.3.5% of its annual B2C sales on A&P.
A&P spends at c.3.5% of B2C sales
A&P Spends (Rs mn) % of B2C sales (RHS)
1,200 4.2 4.5
4.0
1,000 3.3 3.3 3.4
3.5
800 3.0
2.5
600
2.0
400 1.5
1.0
200
0.5
581 937 966 1,087
- -
FY17 FY18 FY19 FY20
Source: Company, PL *B2C (FMEG + Retail Wires)
Increase in distribution reach: Polycab focused on increasing its distribution
network which has increased from 3,133 dealers in FY19 to present 3,650, of
which 52% are exclusively for FMEG while 18% are common for both FMEG
and Wires & Cables. Their dealer network reduced from FY16 to FY19 as the
company made a strategic decision to discontinue some smaller dealers and
instead focus on larger distributors, who in turn would cater to these smaller
dealers. Number of dealers for FMEG are set to rise as apart from exclusive
dealer addition, we also expect conversion of some dealers selling exclusively
Wires & Cables going ahead. The 3,650 distributors serve over 137,000 retail
touchpoints (up from 100,000 in FY18).
January 4, 2021 7
Polycab India
FMEG and common dealers on a rise 52% dealers exclusively sell FMEG products
Wires & Cables FMEG Common for both Wires & Cables FMEG Common for both
4,000 100%
19% 17% 15% 16% 16% 18%
726 639 657
521 560 80%
3,000 501
1,381
1,603
36% 44% 46%
1,547
1,750
60%
1,898
49% 50% 52%
2,000 1,535
40%
1,718
1,436
1,000
1,304
1,190
45%
1,095
1,097
20% 39% 39% 35% 34% 30%
- 0%
FY16 FY17 FY18 FY19 FY20 H1FY21 FY16 FY17 FY18 FY19 FY20 H1FY21
Source: Company, PL Source: Company, PL
Focus on quality: Polycab has ensured un-relented focus on product quality.
The company has been offering extra wattage LED lighting in comparable sizes
and claims to have heavier motors and blades in fans which provide superior
performance. This enabled Polycab to garner better market reception than
most new entrants, in recent years.
FMEG margins to improve by 600bps over FY20-23E
Over FY15-20, Polycab invested in laying down groundwork for its FMEG business
by setting up 1) manufacturing facilities 2) distribution network and 3) brand
building. Thus profits remained subdued with less than 2% EBIT margins and 2%
contribution to overall company’s EBIT in FY20. However, with Polycab having
achieved 1) minimum scale in some large categories like fan, lighting, switches and
switchgear 2) change in mix led by premiumisation and 3) increased channel
financing coverage, we expect margins to improve by 600bps over FY20-23.
FMEG EBIT to improve by 6% over FY20-23E FMEG to contribute 9.1% of EBIT by FY23
FMEG (Rs mn) margins % (RHS) FMEG contribution to EBIT %
1,400 13.0 FMEG
8.0
1,200 6.5
1,000 5.1 8.0
800 1.8 1.2 2.0 9%
1.0 10%
600 3.0 7%
-202
400 6% 5%
-2.0
200 2%
1,245
1% 1% 1%
- 2%
168
478
799
-10.2 -7.0
35
88
75
-200
-400 -12.0 -2% -5%
FY16
FY17
FY18
FY19
FY20
FY21E
FY22E
FY23E
-6%
FY16 FY17 FY18 FY19 FY20 FY21E FY22E FY23E
Source: Company, PL Source: Company, PL
Changing business mix led by premiumisation: Having made their mark in
bigger segments like Fans, Lighting, Switches & Switchgears, Polycab is
focusing on stepping up on innovation pedal and introducing more premium
products using IOT. In smaller segments like pipes, pumps etc. focus remains
on quickly achieving the scale.
January 4, 2021 8
Polycab India
Operating efficiencies to kick in with improving scale of operations:
Polycab manufactures c.80% of products in-house. Fans, lighting(JV),
switches and switchgears are all manufactured in-house while balance
products are sourced from third parties. With major upfront investments
completed, we expect operating efficiencies to kick in with improved scale of
operations.
FMEG manufacturing facilities Sustained investments in FMEG facilities
Manufacturing Facilities Location State Annual Capacity
FMEG (Rs mn) % of total capex
Lighting & Luminaires Chhani Gujarat 18.2mn units
24%
Switches & Switchgears Nashik Maharashtra 7.2mn units 600 25%
Fans Roorkee Uttarakhand 3.1mn units 500 20%
Source: Company, PL 400
12% 12% 15%
300
69
6% 10%
200 6%
3%
5%
538
202
350
100
178
0%
166
7
- 0%
FY14 FY15 FY16 FY17 FY18 FY19 FY20
Source: Company, PL
Increased channel financing coverage: Having entered FMEG space only
in 2014, channel financing remains only amongst high teens compared to 60-
65% in Wires & Cables. Polycab is focused on improving this on a sustained
basis and get it at par with Wires & Cables segment. In addition to this, the
company is also working on optimizing its inventory levels which can help
reduce working capital cycle and thereby improve profitability.
Polycab to be fastest growing FMEG player over FY21-23; Margins to improve with scale of operations
CAGR % CAGR %
Particulars (Rs mn) FY16 FY17 FY18 FY19 FY20 FY21E FY22E FY23E
FY16-20 FY21-23
FMEG Revenues
Bajaj Electricals 25,975 23,142 22,285 27,408 30,846 30,783 36,525 41,959 4.4 16.7
Crompton Consumer 18,117 40,167 41,051 44,789 45,120 44,561 52,488 59,368 25.6 15.4
Havells 33,160 39,104 41,627 49,776 48,447 50,040 60,249 69,101 9.9 17.5
Polycab 1,981 3,384 4,853 6,433 8,356 9,567 12,529 15,863 43.3 28.8
FMEG EBIT (Rs mn)
Bajaj Electricals 1,204 990 1,087 1,801 2,082 2,555 3,287 4,196 14.7 28.1
margin % 4.6 4.3 4.9 6.6 6.8 8.3 9.0 10.0
Crompton Consumer 2,465 5,941 6,820 7,230 7,411 8,202 9,693 11,043 31.7 16.0
margin % 13.6 14.8 16.6 16.1 16.4 18.4 18.5 18.6
Havells* 9,779 11,755 13,130 15,481 14,741 14,671 17,881 20,631 10.8 18.6
margin % 29.5 30.1 31.5 31.1 30.4 29.3 29.7 29.9
Polycab -202 35 88 75 168 478 799 1,245 NA 61.3
margin % -10.2 1.0 1.8 1.2 2.0 5.1 6.5 8.0
Source: Company, PL *Havells Contribution Margins
January 4, 2021 9
Polycab India

Fans (40-45% of FMEG sales): Increasing premium offerings

              Since its launch in 2014, Polycab has gained 3-5% share in the highly competitive fans market
    Product       Market size (Rs bn) Polycab's share (%)              Competitors                    Organized Penetration Level
     Fans                 93                 3-5%             Crompton, Havells, Orient, Bajaj                    High
Source: Company, PL

              Polycab has stepped up launches in premium segment through its Anti-Germs series

Source: Company, PL

Fans: Industry eying Premiumisation                                    Strategy/Outlook: Increase premium offerings; profitability
Crompton leads with an overall market share of ~25-27%,                Fans are the single largest category for Polycab that accounts
whereas Havells has redefined category with premium offerings          ~40-45% of FMEG sales. Ever since its launch in 2014, the
in an otherwise well penetrated and laid back category. On the         company gained 3-5% market share and is currently at 7-8th
other hand, industry dynamics are changing as all key players like     position on attributes like heavy motors and blades which
Crompton and Orient etc. have started focusing on premium              provider superior performance. After successfully making its mark
segment with multiple offerings. We expect industry to witness         as a premium economy brand, Polycab is now looking to make
steady demand as rural electrification, better power availability,     dents in the premium segment with launch of IoT enabled
rising disposable income and increasing consumer awareness             products.
remain key triggers.

                                                    Polycab has made a considerable stride in fans segment by augmenting its fans
                                                    portfolio with additional SKUs, thereby offering variety of products in terms of design
                                                    and price points. With consumers now placing emphasis on aesthetics, design,
                                                    efficiency and technology, Polycab is constantly reworking on its portfolio right
                                                    through its economy to premium offerings. We expect Polycab to continue making
                                                    rapid strides in the fans segment given 1) strong brand recall 2) sustained brand
                                                    investments 3) increasing distribution reach 4) in-house manufacturing to benefit
                                                    from increasing scale and 5) consumer meaningful innovations (like Anti-Germ
                                                    fans) & IOT enabled products. Fans will be a key driver for margin improvement in
                                                    FMEG, given that it is most scaled up segment for Polycab.

 January 4, 2021                                                                                                                        10
Polycab India
Lighting (20-25% of FMEG sales): Innovation remains a key to success
Polycab has its work cut out in an industry plagued by intense competitive intensity
Product Market size (Rs bn) Polycab's share (%) Competitors Organized Penetration Level
LED 223 c.1% Philips, Crompton, Bajaj, Wipro, Havells Medium
Source: Company, PL
Polycab is focusing on launching innovative products like RGBW bulbs, Emergency Bulb
Source: Company, PL
Competitive Landscape: Intense competitive rivalry Strategy/Outlook: Innovation and Penetration a focus area
Phillips, Crompton, Havells, Syska & Wipro are some large With the industry witnessing substantial price reduction (some
players in the market. LED is now dominant lighting technology respite over past 6 months) & competitive intensity, Polycab
across all applications as sustained reduction in prices and Govt reconstructed its product mix by focusing on more profitable &
push (Ban on fluorescent lamps and free/subsidised distribution) stable categories like Panels and Down lighters. Polycab is now
has resulted in consumer shift. Innovation, Premiumisation and making investments in developing new product pipeline with
aesthetics are key to offer a differentiated value proposition (Eg. focus on IoT and increasing its distribution reach. In addition to
Anti-bacterial bulbs by Crompton) in a market flushed with this, there will be renewed focus on B2B segment.
Chinese imports and easy product imitations.
Over the past few years’ rapid technological change in lighting is driving value
erosion and enhancing need for continuous re-evolution. Additionally, this being a
low entry-barrier business there is a constant deluge of new players thereby leading
to increased competitive intensity. With reduced private capex intensity and
slowdown in government orders due to Covid-19 pandemic, recovery in B2B
segment remains sluggish. Polycab has so far focused on categories which have
been less impacted such as panels and down lights. Going ahead, the company
will likely focus on improving sales mix with launch of premium products like
Emergency Bulbs and RGBW LEDs.
January 4, 2021 11Polycab India
Switches & Switchgears (15% of FMEG sales): Immense growth potential
Polycab launched all products within 18 months of launch
Product Market size (Rs bn) Competitors Organized Penetration Level
Switchgear 210 Havells, Legrand, Schneider High
Switches 46 Havells, Anchor, GM, Schneider Medium
Source: Company, PL
Initially launched with focus placed on economy segment; now looking to introduce more premium products
Source: Company, PL
Competitive Landscape: Long term growth positive Strategy/Outlook: Improve mix with more premium offerings
Switchgear: Havells, Legrand and Schneider are some of the With slump in residential and real estate market, Polycab had
largest players in the segment. Technology intensive nature of focused on building alternate channels such as panel builders,
the product has resulted in high share of organized players OEMs and large institutions.
(90%). Switchgear is a highly urbanised product which is yet to
Having initially launched as an economy brand, Polycab is now
enter small towns and rural India in a major way, which signifies
focusing on changing the mix more towards a technology focused
huge growth potential. Polycab is well placed as it had acquired
premium offerings. It has launched MCB changeover switch and
Datar Nouvea’s manufacturing and technology capabilities.
plans to enter new product categories in an attempt to plug gaps
Switches: Havells, Anchor, GM, Schneider are some of the in its product portfolio.
largest players in this segment. Rising disposable income &
Within switches, Polycab has increased its premium offerings
growing preference for aesthetically designed modular switches
through launch of new colored plate range, infrared sensors and
will enable 10% CAGR over FY20-25.
touch feel products and switches.
Switches and switchgears have been under pressure over the past 12-18 months.
However, their long term potential remains strong given 1) customer preference
towards modular switches/switchgears 2) demand for safe and secure products 3)
rising demand for various electrical appliances and 4) greater awareness towards
building automation and management. Polycab with its strong brand legacy within
electrical space, right technological investments (Datar Nouveau acquisition) and
increasing distribution reach remains well placed to tap this opportunity. We believe
smart pick up in real estate construction and housing augurs well for demand of
switches and switchgears, in the coming quarters.
January 4, 2021 12Polycab India
Others (15% of FMEG sales): Achieving meaningful scale across categories remains key
Polycab is also present in Pumps, Water Heaters, Air cooler, Iron, Solar, Pipes and Conduits segments
Product Market size (Rs bn) Competitors Organized Penetration Level
Pumps 75 Crompton, Shakti, Havells, Kirloskar Medium
Water Heater 18-20 Racold, Havells, Crompton, AO Smith Medium
Air Cooler 42 Symphony, Kenstar, Voltas, Crompton Low
Source: Company, PL
Pipes, Pumps, Water Heaters, Irons and Air Coolers major contributors to appliances segment
Source: Company, PL
Competitive landscape: Long term growth potential intact Strategy/Outlook: Achieving meaningful scale
Pumps: Crompton is the market leader in this Rs75bn industry. Pumps, Water Heaters, Air Coolers, Irons, Solar, Pipes and
Rising building construction and industrialisation activities, Conduits contribute the remaining 15% of FMEG sales for
increasing agriculture activities and depleting groundwater levels Polycab. The immediate focus remains on quickly growing these
will continue to drive demand for water pumps in the longer run. segments to Rs1bn each post which it will focus on improving
profitability in these segments.
Water Heaters: In the c. Rs20bn market where large players like
Havells, Racold, Crompton and Orient are increasing offerings
thereby increasing competition too. Rising disposable income
and energy-efficient products will drive growth in this segment.
Air Cooler: The residential air cooler market is largely
unorganized. Organized players are gaining share as they are
now offering technologically advanced and energy efficient
products. Symphony (50% market share) is the largest player in
the organized market. Other players include Orient Electric, V-
Guard, Crompton. Voltas & Blue Star are new entrants in this
space.
January 4, 2021 13Polycab India
Market leader in Wires & Cables
Polycab is India's largest manufacturer of wires and cables (85% of FY20 sales)
with an organized market share of 18% (12% overall). It is one of the most versatile
player with presence across high value added segments like power, marine, oil &
gas, telecom, nuclear energy, infrastructure, railways, metals etc. thereby serving
a wide customer base across industries. Over FY15-20, Wires & Cables revenues
have grown at CAGR of 11.4% to Rs75bn.
Diverse product portfolio catering to a large customer base across industries
Source: Company, PL
Cable and Wires offering vs peers
Flexible &
Control &
Power & Power Industrial Cables
Company Power Cable (EHV) Instrumentation House Wires
Control (LT/HT) incl specialty
Cables
cables
Apar Industries Ltd
Finolex Cables Ltd
Gupta Power Infrastructure Ltd
Havells India Ltd
KEC International Ltd
KEI Industries Ltd
Polycab India Limited
R R Kabel Ltd
V-Guard Industries Ltd
Source: Company, PL
Superior Product Availability: Polycab’s biggest USP has been availability
of products across SKUs. Our channel checks suggest that at any given point
of time, Polycab (including its top 100 distributors) holds inventory worth
Rs20bn which can fulfill customer requirements at the earliest. Products are
either 1) made to stock, produced based on demand forecasts given from
customers and/or internal estimates or 2) made to order – where Polycab
works closely with customers to develop customized products.
January 4, 2021 14Polycab India
Increasing share of Housing/Retail wires: Over the years, Polycab has
gradually increased proportion of housing/retail wires (B2C) from 60% to
current 75% of wires sales (Wires contribute 45% of segment sales). Rising
sales of margin accretive wires business has helped in increasing the segment
margins from 7.4% in FY16 to 12.3% in FY20. Leveraging its strong brand
legacy & benefitting from Govt’s focus on affordable housing/ smart cities, we
expect Polycab to register healthy double digit growth of 13% in this segment.
In-house manufacturing with high degree of backward integration:
Polycab manufactures several critical inputs in-house which allows it to provide
guarantee of quality, service and short-notice supply, that few competitors can.
In order to control its supply chain, there is a high level of backward integration
for key raw materials like aluminum rods, copper rods and various grades of
PVC, rubber, XLPE compounds, GI wire and strip.
Wires & Cables manufacturing capacity Incurred capex of Rs14.9bn over FY14-20
Manufacturing Facilities Location State Annual Capacity
W&C (Rs bn) % of total capex
Wires & Cables Halol/Daman Gujarat 3.7mn kms
Copper Rods Waghodia Gujarat 0.22mn tonnes 100% 97% 93%
3.0 89% 86% 84% 100%
Source: Company, PL 76%
2.5 80%
2.0
60%
1.5
40%
1.0
20%
1.9
2.1
1.8
2.5
1.5
2.4
2.7
0.5
- 0%
FY14 FY15 FY16 FY17 FY18 FY19 FY20
Source: Company, PL
Exports to be new leg of growth: Polycab has identified exports as a key
growth driver in the coming years. Out of the $145bn global cable markets
(Asia-Pacific contribution at 40%) nearly $40bn of cables are currently imported
from various countries. After successfully executing a large order from Dangote
refinery in FY20, Polycab is in the process of setting up its distribution network
in overseas markets starting with Africa, USA, Middle East and Australia. In the
medium term, Polycab expects double digit contribution from exports.
FY20 exports helped by Rs7.5bn Dangote order Exl Dangote exports contributed 9% of 1H sales
Exports (Rs bn) YoY growth % Exports ex Dangote (% of sale)
12.0 11.0 400 Dangote Project (% of sales)
341 350 14.0
10.0
300 12.0
8.0 250 3.9
10.0
200
6.0 8.0
150
3.5 3.6 3.3 6.0 9.0
4.0 3.1 100
2.5 8.4
50 4.0
2.0 14 5.3 5.7 5.1
9 3 - 2.0 3.1
-31 1.5
- -50 - - - - -
FY16 FY17 FY18 FY19 FY20 H1FY21 FY16 FY17 FY18 FY19 FY20 H1FY21
Source: Company, PL Source: Company, PL
January 4, 2021 15Polycab India
Long standing relationship with distributors: Most of 3,650 dealers catering
to over 137,000 retail touchpoints, have been associated with Polycab for over
3 generations. Many of whom are solely dependent on Polycab for their
turnover. Our channel checks suggest that Chairman & MD – Mr Inder
Jaisinghani remains in direct touch with largest distributors. Well entrenched
distribution with long standing relationships and stickiness is one of the major
strengths of Polycab. We believe Asian paints (the largest paint company) has
similar strength in distribution, which enabled it to withstand rising competition
and increase share from 40-42% to current levels of ~50%.
Polycab’s Wires & cables sales have Polycab reported higher margin improvement over peers
grown at a CAGR of 9.3% over FY16- Particulars (Rs mn) FY16 FY17 FY18 FY19 FY20
CAGR %
20. Margins expanded by 490bps. FY16-20
Polycab has scope of further margin Wires & Cables Revenues
expansion given superior scale over Finolex Cables 24,816 25,463 27,831 29,833 27,701 2.8
peers Havells 24,595 26,756 26,834 32,346 29,942 5.0
KEI 20,062 22,197 28,139 35,017 41,235 19.7
Polycab 52,634 56,082 62,423 69,295 75,192 9.3
Wires & Cables EBIT
Finolex Cables 3,713 3,647 4,229 4,474 4,035 2.1
margin % 15.0 14.3 15.2 15.0 14.6
Havells* 3,089 3,256 4,380 5,217 4,887 12.2
margin % 12.6 12.2 16.3 16.1 16.3
KEI 2,313 2,732 3,035 3,755 4,501 18.1
margin % 11.5 12.3 10.8 10.7 10.9
Polycab 3,886 3,983 6,407 8,351 9,255 24.2
margin % 7.4 7.1 10.3 12.1 12.3
Source: Company, PL *contribution margin
EPC business: Focus on projects with 40-60% cabling
requirement
Polycab diversified into EPC business as a part of strategic forward integration,
seeking to bag orders with at least 40-60% cabling requirement. It is also looking to
enter into EHV segment which has entry barriers involving long approval cycle plus
an EPC set up. Polycab’s EPC exposure aids in setting a base in this segment.
EPC sales to grow at 20.9% CAGR over FY21-23 Margins to settle around 11% by FY23
Others (Rs bn) YoY growth % (RHS) Others (Rs mn) margins % (RHS)
86.2
6 100.0 1,000 15.2 18.0
14.5 14.0
80.0 800 12.8 16.0
5 44.3 44.8 60.0 11.0 11.0 14.0
4 30.0 600 12.0
198
12.8 12.5 40.0
400 10.0
81
3 20.0
2 200 8.0
2 - 4.3 6.0
-39.1 -36.2 - 3.2
-20.0 4.0
411
219
797
467
477
536
1 -40.0 -200
3 2 5 5 3 4 5 2.0
- -60.0 -400 -
FY16
FY17
FY18
FY19
FY20
FY16
FY17
FY18
FY19
FY20
FY21E
FY22E
FY23E
FY21E
FY22E
FY23E
Source: Company, PL Source: Company, PL
January 4, 2021 16Polycab India
Wires & Cables (85% of total sales): Looking to enter new product segments/markets
Polycab is the market leader enjoying 12% overall market share (18% organized sector)
Product Market size (Rs bn) Polycab's share (%) Competitors Organized Penetration Level
Wires & Cables 500-550 12%* Havells, Finolex, KEI High
Source: Company, PL *18% organized market share
Polycab is focusing on launching environment friendly power cables, rubber cables, green wire etc.
Source: Company, PL
Competitive Landscape: Strong infrastructure spends Strategy/Outlook: Diversify into new segments, exports
Polycab is the largest player in Wires & Cables industry enjoying In addition to further consolidating its position in existing
12% market share (18% organized). Finolex, KEI and Havells are segments, Polycab is looking to enter into special cables which
the other large players in the industry. We expect, Wires & Cables are utilized in EVs and defense (currently imported), a high
to grow in low teens over the coming few years led by 1) growing margin business. It is also looking to enter into high entry barrier
infrastructure & housing investments 2) national infrastructure EHV segment. Polycab is also focusing on penetrating the
pipeline 3) strong thrust on electrification 4) BharatNet project 5) exports market by following a distribution led model starting with
rising disposable income countries like USA, Australia, Middle East and Africa.
Increase in technology & product complexities, promotion/
branding by large players to increase organized share
Govt. capex of Rs111 lakh crore for Infra Development under NIIP
Indian Government has announced expenditure of Rs111 lakh crore in
infrastructure sector over next 5 years, as part of National Infrastructure Pipeline,
under which:
Energy, railways, urban & infrastructure will cover 72% of the expenditure.
Total energy capacity is expected to be 583 GW by 2025 (current 356 GW).
Housing for All by 2022, targeting 31mn households in urban and rural areas.
100% electrification of existing railway network, mass rapid transit system and
availability of public charging infrastructure.
100% population coverage for telecom and high quality broadband services
and laying optical fiber cables across the nation under Bharat Net project.
Polycab continues to dominate the domestic market led by 1) strong brand legacy
2) distribution reach 3) in-house manufacturing capabilities with R&D focus. It is
trying to drive innovations through environmentally friendly products like Green
Wire. We like the company’s strategy of exploring newer markets (exports) and
niche segments (EVs, defense, EHV) which can be margin accretive.
January 4, 2021 17Polycab India
Housing market revival to aide electrical demand
Affordability Index of HDFC suggests that the combination of low interest rates,
tax benefits, lower stamp duty, attractive developer schemes and low property
prices are positive for housing demand growth in near to medium term.
Channel checks & industry data from companies in Cement, Paint, Building
Materials & Housing Finance Companies disbursement suggest strong activity
in individual home construction, more so inter tier 2/3 cities & small towns.
Property affordability index improving – Positive for Housing & housing related products demand
25.0 22.0 Affordability (Property Value/ Annual Income)
20.0
15.6
15.0
11.1
10.0 8.3
6.6 5.9
5.3 5.1 4.7 5.1 5.1 4.5 5.7 4.8 4.6 4.7 4.6 4.4
4.3 4.7 5.0 4.1 3.8 3.7 3.5
5.0 3.3
0.0
1995
1996
1999
2000
2003
2004
2007
2010
2011
2014
2015
2018
2019
1997
1998
2001
2002
2005
2006
2008
2009
2012
2013
2016
2017
2020
Source: HDFC, PL
Downward revision in home loan rates in 1 year GoI initiatives aiding housing finance demand
Interest rates Jan'20 Mar'20 Apr'20 Jun'20 Nov'20 Fiscal Incentives Tax Incentives on interest and principal
SBI 7.9% - - - 7.0% Interest rate subsidy under the Credit Linked
HDFC 8.2% - 8.1% 7.6% 6.9% Interest subvention Subsidy Scheme (CLSS) to include middle-income
groups
LICHF - - 7.4% 6.9% 6.9% Scheme Extension of timeframe and rationalization of
conditions under the CLSS
Source: Company, PL
Incentives to developers to build affordable
housing
Supply Side Infrastructure’ status accorded to affordable
Incentives housing
External Commercial Borrowings/Rupee
Denominated Bonds Issued Overseas
Source: Company, PL
We believe rising housing demand will have a positive impact on housing
related products and could lead to increase in demand for essentials like Wires
& Cables, switchgears, switches, lighting, fans and water heaters. Given its
product portfolio, Polycab is well positioned to benefit from this.
Wires & Water
Switchears Switches Lighting Fans
Cables Heaters
January 4, 2021 18Polycab India
Strong distribution network
In addition to its strong brand legacy, Polycab’s Pan-India distribution network has
been a key enabler in the company’s growth. Polycab products are currently being
sold through 3,650+ distributors covering 137,000+ retail touchpoints. Widening of
the distribution network in a targeted manner through addition of new distributors,
dealers and retailers remains at the core of company’s growth strategy.
Polycab’s retail touchpoints up from 100k in FY18 to 137k in 1H21
Retail touchpoints (nos)
2,50,000
2,20,000
2,00,000
1,50,000
1,50,000 1,37,000
1,25,000
1,10,000
1,00,000
1,00,000
50,000
-
Bajaj Crompton Finolex Havells Orient Polycab
Source: Company, PL
Of the total 3,650 distributors 30% exclusively cater to Wires & Cables segment,
52% to FMEG segment while the balance 18% are common for both. Going ahead,
management expects the common mix to increase further. In terms of country
coverage, south dominates with 30% followed by north (27%), west (22%) and east
(21%). Although the distribution network is more or less evenly spread out Pan
India, west and south dominate revenue throughput followed by north and east. 60-
65% of wires & cables network is under channel financing, whereas for FMEG it
stands in higher teens.
Distributor expansion on track post FY16-19 rationalisation
The dealer network reduced from
FY16 to FY19 as Polycab made a Wires & Cables FMEG Common for both
strategic decision to discontinue
4,000
some smaller dealers and to focus
instead on larger distributors who in 726 639
560 657
turn would also cater to these smaller 3,000 521
dealers 501
1,381
1,603
1,547
1,750
1,898
1,535
2,000
1,718
1,000
1,436
1,304
1,190
1,097
1,095
-
FY16 FY17 FY18 FY19 FY20 H1FY21
Source: Company, PL
January 4, 2021 19Polycab India
FMEG & Common distributors have been on rise Distribution network spread across the country
Wires & Cables FMEG Common for both East North South West
100% 100%
21%
21%
22%
23%
24%
24%
19% 17% 15% 16% 16% 18%
80% 80%
31%
31%
30%
31%
31%
31%
60% 36% 44% 46% 49% 50% 60%
52%
22% 26%
40% 40%
21% 27%
20% 27%
21% 25%
21% 24%
20% 24%
20% 45% 39% 39% 20%
35% 34% 30%
0% 0%
FY16 FY17 FY18 FY19 FY20 H1FY21 FY16 FY17 FY18 FY19 FY20 H1FY21
Source: Company, PL Source: Company, PL
Polycab Bandhan Star Investing in distribution expansion/ automation
Polycab views technology as an enabler & continues to invest in solutions aimed at
improving efficiency, optimise inventory levels & streamline supply chain thereby
reducing dead stock with trade/company and improve receivables. It uses online &
mobile based applications to bring customers & partners closer.
Project Bandhan – Loyalty Program: A Customer Relationship Management
(CRM) programme, Bandhan provides sales incentives to retailers and
electricians, key consumer decision influencers, thereby aiding sales. Currently
154,000+ electricians and 47,000+ retailers are covered under this program.
Project josh: A strategic initiative aimed at increasing market share in retail
wires and FMEG segment. Polycab undertakes detailed mapping to better
identify and understand 1) market positioning 2) customers and 3) spot gaps
in customer/product segments, after which corrective actions are taken.
Implemented in 125 locations, there has been a meaningful increase in the
number of distributors & retailers.
Distributor Management System: This platform links Polycab’s internal
systems with authorised dealers and distributors thereby providing visibility on
Polycab Connect
secondary sales and automates replenishment of inventories with distributors.
This aides efficient inventory management and optimizes supply chain.
Sales force Automation: Enables sales tracking through mobile app, right
from retailers to salesmen and ensures effective sale process. Along with
distributor management system, this tool is linked to distributor’s billing
software which helps in tracking order fulfilments.
Pilot project to drive semi-urban/rural reach: There has been an increase
in demand from semi-urban/rural areas on the back of increasing awareness
and affordability. To tap into this growing opportunity, Polycab has hired a
consultant to develop an active distributor network in towns below 5 lakh
population. The pilot project has been launched in 3 states, wherein all Polycab
products (FMEG or wires) will be available across key markets in those states.
Depending on the learnings from this pilot, it will be replicated Pan-India.
January 4, 2021 20Polycab India
Polycab has Atamnirbhar Focus
Polycab has strong manufacturing base with 25 manufacturing facilities at seven
locations, which are designed to secure a complete supply chain for its product
range, starting from raw materials to end-products. 4 out of these 25 facilities
manufacture FMEG products. Polycab has incurred a capex of Rs16.7bn over
FY14-20, including plants for FMEG.
Out of the 25 facilities, 4 are for FMEG products
Manufacturing Facilities - FY20 Location State Annual Capacity
Wires & Cables Halol/Daman Gujarat 3.7mn kms
Lighting & Luminaires Chhani Gujarat 18.2mn units
Switches & Switchgears Nashik Maharashtra 7.2mn units
Fans Roorkee Uttarakhand 3.1mn units
Copper Rods Waghodia Gujarat 0.22mn tonnes
Total - 25 7
Source: Company, PL
Over FY14-20, incurred capex of Rs16.7bn c.10% being spent on FMEG segment
Capex (Rs mn) Wires & Cables % FMEG % Others %
2% 4% 1%
3,500 100% 6%
2,829 2,814 2,891 3% 24% 12% 6%
3,000 6% 12%
80%
2,500 2,213 2,290
1,928
2,000 1,743 60%
1,500 40%
1,000
100%
20%
97%
76%
89%
86%
84%
93%
500
- 0%
FY14 FY15 FY16 FY17 FY18 FY19 FY20 FY14 FY15 FY16 FY17 FY18 FY19 FY20
Source: Company, PL Source: Company, PL
Polycab has spent 3-8x more than peers Copper constitutes 50-60% of total RM costs
Backward Integration
W&C capex (Rs mn)
Polycab Finolex Cables KEI Industries
FY15-20 Copper Rods Copper Rods PVC compounds
13.0 Aluminum Rods PVC compounds
14.0
PVC, XLPE
12.0 Optical Fibre
compounds
10.0
Rubber FRP rods
8.0
GI Wire & strip
6.0 3.8 4.0
4.0 1.7 Source: Company, PL
2.0
-
Finolex Havells KEI Polycab
Source: Company, PL
January 4, 2021 21Polycab India
High Degree of backward integration: Comprehensive backward integration
of operation remains main priority which has helped Polycab to build
manufacturing facilities for all key raw materials, including aluminum rods,
copper rods, and various grades of PVC, rubber, XLPE compounds, GI wire
and strip. Polycab acquired remaining 50% stake in Ryker JV (copper rod
plant) having begun commercial operation in Q1FY20. Backward integration in
manufacturing enables them to maintain full control over quality and supply
chain, lower operational costs as well as deliver products at competitive prices.
All copper and aluminum related materials required for making wires and
cables, which form 65-70% of total RM cost (copper 50-55%), are
manufactured in-house by Polycab. Apart from Polycab, Finolex Cables also is
backward integrated for new raw material requirements like Copper Rods, PVC
compounds, while KEI manufactures PVC compounds in-house.
Manufacturing process of LT cables (LHS) and HT Cables (RHS)
Source: Company, PL
In house R&D with innovation capabilities: Polycab’s R&D centre at Halol
has nearly 100 engineers and technicians. The R&D team places emphasis on
upgrading technology used in production process and customer
centric/consumer meaningful innovations. In 2017, launched Green wire – an
energy efficient and environment friendly product. In order to keep pace with
the emerging industry trends and consumer preferences, Polycab intends to
invest more in the development of energy efficient and other specialised
products.
January 4, 2021 22Polycab India
Channel check takeaways
Availability of products one of the biggest USPs: One of the biggest USPs
for Polycab has been availability of products across SKUs. Our channel checks
indicate, at any given point of time between the Company and its top 100
distributors, together hold inventory worth Rs20bn (Rs10bn each). This
enables Polycab to fulfil maximum orders, faster than its peers.
Personal emotional bond with distributors: Many of the 3,650 distributors
have been associated with Polycab over multiple generations. Our interaction
with one of the top distributor for Polycab indicates that, Mr Inder Jaisinghani –
MD, has an emotional bonding with many distributors. In fact, top distributors
remain in direct touch with the MD and many of their distributors are only
dealing in Polycab products.
Demand continues to improve MoM since resumption of activities: After
resumption of activities post nationwide lockdown, demand has progressively
improved MoM led by housing wires. Demand momentum witnessed at the end
of 2Q has sustained in October and November as well. Our discussions with
distributors across the country has indicated return to pre-covid turnover, with
housing wires exhibiting healthy growth. Smaller towns continue to lead
growth.
Rising RM prices lead to price hike of 5-20%: With rising prices of key
commodities like copper, aluminium, steel, ABS (plastic) up by c.10-20% in the
last 3 months (ABS up by 2x), Polycab hiked prices of Wires & Cables to the
tune of 15-20% and FMEG products by 5-10%.
FMEG – Quality products, competitive rates, higher margins: Our channel
checks indicated that Polycab’s FMEG products are of good quality offering
similar features and are priced at competitive rates vs peers. Polycab is
incentivizing the channel by offering higher margins (c.25%) on products
compared to other brands. This along with the strong brand legacy is enabling
customer acquisition.
Polycab Experience centres – Offering entire range of Polycab Products; Currently in Mumbai, Pune, Kerala
Source: Company, PL
January 4, 2021 23Polycab India
Financials & Valuations
Estimate CAGR of 16.7% in Sales over FY21-23
We expect revenues to grow at a CAGR of 16.7% over FY21-23 with Wires &
Cables sales growing at a CAGR of 14.4%, while FMEG will continue to outperform
(albeit on a lower base) industry growth rates and grow at 28.8% CAGR.
Wires & Cables: Benefitting from 1) growing infrastructure/ housing
investments 2) national infrastructure pipeline 3) thrust on electrification 4)
BharatNet project 5) rising disposable income 6) increased focus on exports,
we expect Wires & Cables sales to grow at a CAGR of 14.4% over FY21-23.
FMEG: We expect Polycab to continue leveraging its strong brand legacy and
benefit from the growing opportunities in the FMEG space given 1) rising
consumer aspirations and disposable income 2) increasing brand spends and
3) rising distribution network. We expect FMEG segment to continue growing
faster than industry at 28.8% over FY21-23. We expect the four larger
segments (fans, lighting, switches and switchgear) to grow in excess of 25%.
Copper: With rising scale of operations from the Ryker plant, we expect
revenues to grow at a CAGR of 15.4% over FY21-23
Others (EPC): With EPC being more of a tactical play, we expect revenues to
be around 4-5% of total sales and remain flattish around Rs5bn over FY20-23
Revenues to grow at a CAGR of 16.7% over FY21-23
Revenues (Rs bn) YoY growth %
140 25
20
120 18 20
100 13
15
11
80 85
10
60
5
40
20 -4 -
80 88 102 116
- -5
FY19 FY20 FY21E FY22E FY23E
Source: Company, PL
FMEG to lead revenue growth; Wires & Cables to recover in FY22
Revenues (Rs mn) FY19 FY20 FY21E FY22E FY23E
Wires & Cables 69,295 75,192 70,044 82,476 91,711
YoY gr. 11.0% 8.5% -6.8% 17.7% 11.2%
FMEG 6,433 8,356 9,379 12,285 15,557
YoY gr. 32.6% 29.9% 12.3% 31.0% 26.6%
Copper* 3,317 3,923 4,414
YoY gr. NA 18.3% 12.5%
Others 4,637 5,230 3,334 4,335 4,877
YoY gr. 86.2% 12.8% -36.2% 30.0% 12.5%
Source: Company, PL *Acquired balance 50% stake from Ryker JV in FY21
January 4, 2021 24Polycab India
Commodity prices are near term headwind
Even with an inflationary commodity price environment over FY16-20, Polycab’s
gross margins improved by c.450bps due to 1) improving business mix (Retail
Wires, Exports, FMEG) and 2) improving operational efficiencies. Key commodity
prices- Copper/ Aluminum/ Brent Crude have increased at a CAGR of 5%/ 4.5%/
6.4% over FY16-20.
Covid-19 pandemic resulted in global lockdowns, commodity prices crashed over
Jan20 highs in April/May. However, with resumption of economic activities,
commodity prices inched up and in some cases are even traded above pre-Covid
levels. Spot copper/aluminum prices are up by 27%/11.5% over Jan20 highs. Brent
Crude prices are down 26% over Jan20 highs.
Even with an inflationary commodity environment, we expect Polycab’s gross
margins to expand by 30bps over FY20-23 given 1) increasing share of B2C and
premium products and 2) gains from cost optimizing initiatives.
Copper price have risen by 60% over Mar20 lows Aluminium price up by 33% over May20 lows
Copper Spot (INR/MT) Aluminium Spot (INR/MT)
6,50,000 1,80,000
6,00,000
1,60,000
5,50,000
5,00,000 1,40,000
4,50,000 1,20,000
4,00,000
3,50,000 1,00,000
3,00,000 80,000
2,50,000
2,00,000 60,000
Jun-18
Jun-19
Jun-20
Feb-18
Feb-19
Feb-20
Apr-18
Oct-18
Apr-19
Oct-19
Oct-20
Apr-20
Dec-17
Dec-18
Dec-19
Dec-20
Aug-18
Aug-19
Aug-20
Jun-18
Jun-19
Jun-20
Feb-18
Feb-19
Feb-20
Oct-18
Oct-19
Oct-20
Apr-18
Apr-19
Apr-20
Dec-17
Dec-18
Dec-19
Dec-20
Aug-18
Aug-19
Aug-20
Source: Company, PL Source: Company, PL
Crude price still down by 26% over Jan20 high INR appreciated by 4.9% since Apr20
80 USD/INR
Brent Crude (US$/barrel)
100 75
80
70
60
40 65
20
60
30-Apr-18
31-Oct-18
30-Apr-19
31-Oct-19
30-Apr-20
31-Oct-20
31-Dec-17
31-Dec-18
31-Dec-19
31-Dec-20
30-Jun-18
31-Aug-18
30-Jun-19
31-Aug-19
30-Jun-20
31-Aug-20
28-Feb-18
28-Feb-19
29-Feb-20
-
30-Apr-18
31-Oct-18
30-Apr-19
31-Oct-19
30-Apr-20
31-Oct-20
30-Dec-17
31-Dec-18
31-Dec-19
31-Dec-20
30-Jun-18
31-Aug-18
30-Jun-19
31-Aug-19
30-Jun-20
31-Aug-20
28-Feb-18
28-Feb-19
29-Feb-20
Source: Company, PL
Source: Company, PL
January 4, 2021 25Polycab India
EBITDA and PAT CAGR of 16.5% and 15% over FY21-23
We estimate EBITDA CAGR of 16.5% over FY21-23 led by improving revenue mix
based on rising contribution from B2C (FMEG and retail wires) and various cost
efficiency measures. We estimate margins to improve by 30bps over FY20-23. We
estimate PBT to grow by 15.5% CAGR over FY21-23 helped by improving mix and
lower interest burden. With acquisition of Ryker JV, we estimate lower share of JV
losses and expect Adj. PAT to grow at a CAGR of 15% over FY21-23.
FMEG margins to grow by 600bps over FY21-23
Revenues (Rs mn) FY19 FY20 FY21E FY22E FY23E
Wires & Cables 8,351 9,255 9,101 10,202 11,421
Margin 12.1% 12.3% 13.0% 12.4% 12.5%
YoY gr 30.3% 10.8% -1.7% 12.1% 11.9%
FMEG 75 168 478 799 1,245
Margin 1.2% 2.0% 5.1% 6.5% 8.0%
YoY gr -15.6% 125.8% 184.3% 66.9% 55.9%
Copper* - - 335 432 486
Margin - - 10.1% 11.0% 11.0%
YoY gr - - NA 28.8% 12.5%
Others 198 797 467 477 536
Margin 4.3% 15.2% 14.0% 11.0% 11.0%
YoY gr 145.0% 302.8% -41.4% 2.1% 12.5%
Source: Company, PL
Revenue/PAT to grow at CAGR of 16.7%/15% over FY21-23E
Particulars (Rs mn) FY19 FY20 FY21E FY22E FY23E
Revenue from Operations 79,856 88,300 85,207 1,02,459 1,16,035
YoY gr. 17.9% 10.6% -3.5% 20.2% 13.3%
Gross Profit 20,196 24,613 23,805 28,667 32,698
Margin 25.3% 27.9% 27.9% 28.0% 28.2%
Other Expenses 10,668 13,263 12,556 15,421 17,437
% of sales 13.4% 15.0% 14.7% 15.1% 15.0%
EBITDA 9,528 11,350 11,249 13,246 15,261
Margin 11.9% 12.9% 13.2% 12.9% 13.2%
YoY gr. 30.7% 19.1% -0.9% 17.8% 15.2%
Other Income 638 928 1,363 1,130 1,222
Depreciation 1,414 1,609 1,735 1,897 2,097
Interest 1,167 495 475 492 501
PBT 7,584 10,174 10,403 11,987 13,886
Tax 2,558 2,444 2,538 3,021 3,499
ETR 33.7% 24.0% 24.4% 25.2% 25.2%
Profit before JV/Associate 5,026 7,730 7,865 8,966 10,386
Share of JV/Associate -23 -74 -17 -20 -15
Non-controlling interest 6 66 56 59 61
Adj PAT 4,997 7,591 7,792 8,888 10,310
Margin 6.3% 8.6% 9.1% 8.7% 8.9%
Exceptional item 0 0 937 0 0
Reported PAT 4,997 7,591 8,728 8,888 10,310
Adj EPS (Rs) 35.4 51.0 52.3 59.7 69.3
YoY gr. 39.6% 44.1% 2.7% 14.1% 16.0%
Source: Company, PL
January 4, 2021 26You can also read