Population structure, genetic diversity and genomic selection signatures among a Brazilian common bean germplasm
←
→
Page content transcription
If your browser does not render page correctly, please read the page content below
www.nature.com/scientificreports
OPEN Population structure, genetic
diversity and genomic selection
signatures among a Brazilian
common bean germplasm
Jessica Delfini1,2, Vânia Moda‑Cirino2, José dos Santos Neto1,2, Paulo Maurício Ruas3,
Gustavo César Sant’Ana4, Paul Gepts5 & Leandro Simões Azeredo Gonçalves1*
Brazil is the world’s largest producer of common bean. Knowledge of the genetic diversity and
relatedness of accessions adapted to Brazilian conditions is of great importance for the conservation
of germplasm and for directing breeding programs aimed at the development of new cultivars. In this
context, the objective of this study was to analyze the genetic diversity, population structure, and
linkage disequilibrium (LD) of a diversity panel consisting of 219 common bean accessions, most of
which belonging to the Mesoamerican gene pool. Genotyping by sequencing (GBS) of these accessions
allowed the identification of 49,817 SNPs with minor allele frequency > 0.05. Of these, 17,149 and
12,876 were exclusive to the Mesoamerican and Andean pools, respectively, and 11,805 SNPs could
differentiate the two gene pools. Further the separation according to the gene pool, bayesian analysis
of the population structure showed a subdivision of the Mesoamerican accessions based on the origin
and color of the seed tegument. LD analysis revealed the occurrence of long linkage blocks and low
LD decay with physical distance between SNPs (LD half decay in 249 kb, corrected for population
structure and relatedness). The GBS technique could effectively characterize the Brazilian common
bean germplasms, and the diversity panel used in this study may be of great use in future genome-
wide association studies.
The common bean (Phaseolus vulgaris L.) is one of the five cultivated species of the Phaseolus genus and is one
of the most consumed legumes worldwide. It is the most important legume grain for direct human consumption
and the main source of protein and micronutrients in several countries1. Globally, around 31 million tons of
bean grains are produced per year, with the Americas accounting for 32.4% of the total production. Brazil is the
world’s largest producer of common bean, and other countries that are among the largest producers are India,
Myanmar, China, United States, and M exico2.
The common bean is known to have originated in Mexico and the Southern Andes, where it was domesticated
independently to give rise to two gene pools, i.e., the Andean and Mesoamerican groups, which are morphologi-
cally and genetically different3–6. Different parts of the world prefer either the Andean or Mesoamerican grains.
The Mesoamerican common beans are more common in North America, Central America, and the lowland part
of South America, whereas the Andean common beans are preferred in parts of Africa, Europe, and Andean
part of South America7,8. In Brazil, Mesoamerican common beans are preferred, of which the carioca and black
beans represent the most consumed commercial g roups9,10. Carioca beans are the most widely produced in Bra-
zil, accounting for approximately 70% of the national common bean production, whereas black beans represent
about 15% of the total production11.
Genetic diversity studies are of great importance for breeding programs, as they provide valuable information
for effective conservation and application of available germplasm12. Such studies facilitate the understanding of
genetic relationships between accessions, identification of redundancies and admixtures in the germplasm, and
determination of genitor pairs with adequate genetic distance.
1
Agronomy Department, Universidade Estadual de Londrina (UEL), Londrina 86051‑900, Brazil. 2Plant Breeding,
Instituto de Desenvolvimento Rural do Paraná-Iapar-Emater (IDR-Paraná), Londrina 86047‑902, Brazil. 3Biology
Department, Universidade Estadual de Londrina (UEL), Londrina 86051‑900, Brazil. 4Tropical Melhoramento and
Genética (TMG), Londrina 86188‑000, Brazil. 5Section of Crop and Ecosystem Sciences, Department of Plant
Sciences, University of California, Davis 95616‑8780, USA. *email: leandrosag@uel.br
Scientific Reports | (2021) 11:2964 | https://doi.org/10.1038/s41598-021-82437-4 1
Vol.:(0123456789)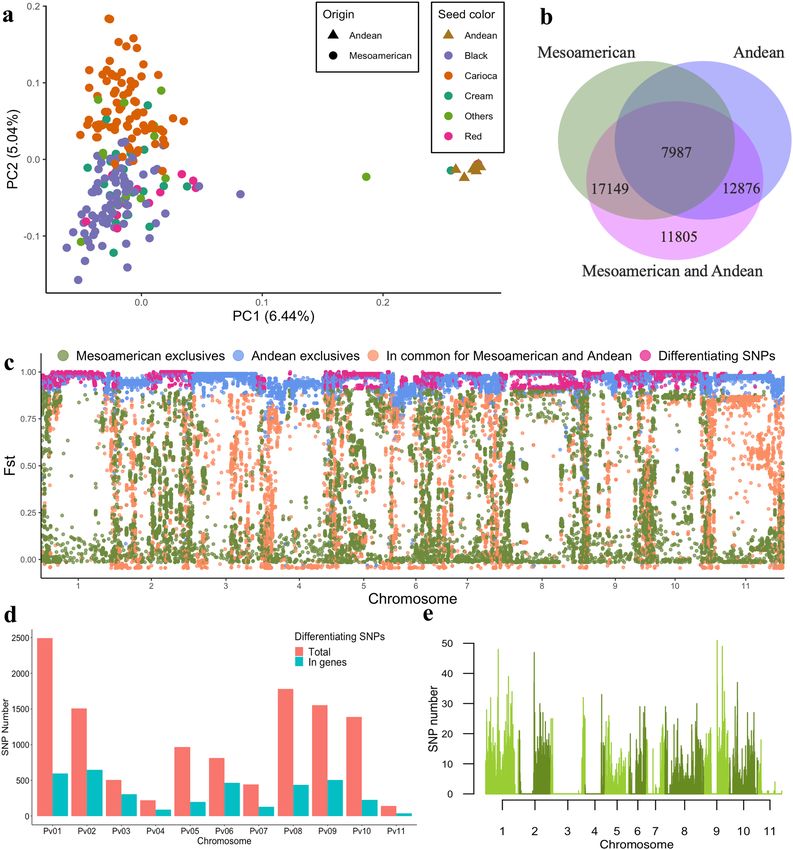
www.nature.com/scientificreports/
Molecular markers have been widely used in plant breeding programs. Several different types of markers
are available; however, their applications have been restricted in the past due to limitations such as low density,
labor intensity, technical requirements, and high cost of large-scale a nalysis13,14. The advent of next-generation
sequencing (NGS) technologies has resulted in an exponential increase in the number of genetic variants that can
be discovered in a single e xperiment15. The publication of the complete genome sequence of the common bean
by Schmutz et al.5 facilitated the discovery of single nucleotide polymorphisms (SNPs) and genetic mapping,
further allowing the construction of maps from short reads of different genotypes using the genome sequence
as a r eference16.
Among the NGS methods, the genotyping by sequencing (GBS) technique has emerged as a new approach
to mitigate the constraints of previously employed m arkers17. GBS is a robust, high-performance, cost-effective,
and simple technique for obtaining thousands of markers from a large number of individuals, and allows the
identification of SNPs using a reduced representation library18–20. SNPs are the most abundant and universal
sequence variations in all genomes, which makes them very useful markers for genetic analyses in plants21.
The GBS technique is often employed in plant breeding, and is frequently used in genetic diversity studies,
mapping (linkage and association) studies, and genomic selection (GS)13. Genome-wide association studies
(GWAS) are a powerful tool for identifying candidate genomic regions associated with traits of interest. Some
of the most important parameters for successful GWAS are the representativity of the diversity panel, the size of
the panel, the levels and genomic distribution of linkage disequilibrium (LD), and the population structure or
genetic relationships among i ndividuals22–24. The diversity panel should represent most of the available genetic
and phenotypic diversity, and LD should be analyzed to determine the density of markers required for GWAS25.
Studies on genetic diversity and population structure have already been conducted for several crops, includ-
ing wheat26–28, flaxseed29, pepper30 and rice31. Several diversity panels have also been developed for the common
bean crop, including accessions from different regions of the world32–37. Based on these initial studies, several
GWAS have further been conducted for different traits of interest, such as yield, plant architecture, nutritional
content of grains, cooking time, resistance to diseases, and tolerance to abiotic factors7,32,37–47. Some GWAS have
been conducted in Brazil37,40,48, however, panels consisting of different genotypes, can contribute to a better
understanding about the genetic diversity and relationships of the germplasm available for genetic breeding.
In view of the above, the objective of the present study was to analyze the genetic diversity, population struc-
ture, and LD of the Brazilian Diversity Panel (BDP), which is a common bean diversity panel representing a large
proportion of the genetic diversity of Brazilian common bean populations. It is composed mainly of materials
from the carioca and black bean commercial groups, which are the most consumed cultivars in the country, and
is expected to be used for GWAS in the future.
Results
Genotyping by sequencing. Using the GBS method optimized for common beans by Ariani et al.18, a
total of 392,585,199 good barcoded reads were obtained from the sequenced accessions, of which 364,454,550
could be aligned with the Andean reference genome ( G198335), resulting in an average mapping rate of 93%.
Initially, 461,199 SNPs were obtained, of which 49,817 SNPs were retained after filtering. Eleven accessions had
a low rate of genotyping (less than 10% of genotyped positions) and were excluded from the BDP, for this reason
219 accessions were used in the subsequent analyses.
SNPs were unevenly distributed throughout the genome, and fewer SNPs were observed in regions near
the centromere than in regions near the telomeres on the chromosome (Fig. 1a). The mean number of SNPs
per chromosome was 4528, ranging from 3361 to 5910 SNPs on the Pv06 and Pv02 chromosomes, respectively
(Table 1). Physical chromosome length was positively correlated with the number of SNPs (r = 0.74, p < 0.01).
Of the total SNPs obtained, 33.8% were located in intragenic regions (17.5% in intron and 16.3% in exons),
12.5% in coding DNA sequences, 1.2% in 5′ UTR regions, and 2.6% in 3′ UTR regions (Fig. 1b). Thirty percent of
the annotated genes in the reference genome of Phaseolus vulgaris v2.0 were tagged by at least one SNP (tagged
genes) (Table 1). A positive correlation between the number of genes and tagged genes per chromosome was
observed (r = 0.96, p < 0.01).
Of the different types of polymorphism, transitions (63.1%) were more frequent than transversions (36.9%),
resulting in a transition/transversion rate of 1.71 (Fig. 1c). The percentages of A/G and C/T transitions were very
similar (32% and 31%, respectively), as were those of polymorphism due to A/T, A/C, G/T, and G/C transver-
sions (11%, 9%, 9%, and 8%, respectively). Considering only the SNPs inside genes the transition/transversion
rate was 1.27, smaller compared to the overall rate, for the reason that the percentage of transversions (44.1%)
was greater than the overall.
Genetic diversity and population structure. The population structure of all accessions included in the
BDP were analyzed using 819 SNPs that were retained after LD filtering (r2 < 0.2). The results of the principal
component analysis (PCA) showed that the accessions could be segregated into two distinct groups, based on the
gene pools (Andean and Mesoamerican) (Fig. 2a).
The two gene pools were also segregated in the Bayesian population structure analysis. However, based on
the ΔK49 criterion, the number of groups (K) with the highest value of ΔK was three (K = 3), which demonstrated
a subdivision of the Mesoamerican group (Fig. 3). Based on the membership coefficient (≥ 0.6), 90.9% of the
accessions could be assigned to a specific group, and only 20 accessions were categorized as admixtures. The
accessions of Andean origin formed a group, and the Mesoamerican accessions were divided into two distinct
groups and the admixture group. In the two Mesoamerican groups formed solely by individuals with a mem-
bership coefficient ≥ 0.6, the accessions were distinguished by the color of the seed tegument; one group was
composed primarily of carioca-type grain accessions, whereas the other group included accessions with black,
Scientific Reports | (2021) 11:2964 | https://doi.org/10.1038/s41598-021-82437-4 2
Vol:.(1234567890)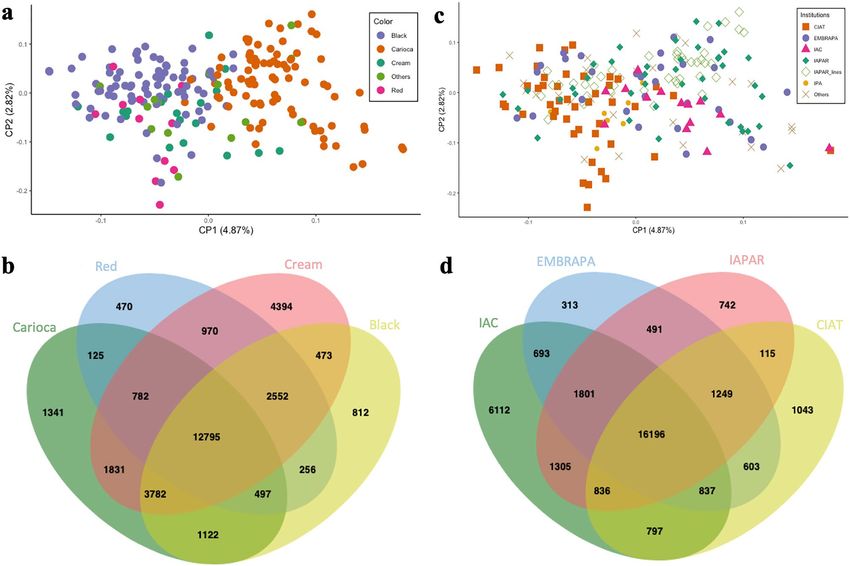
www.nature.com/scientificreports/
Figure 1. Identification and annotation of 49,817 single nucleotide polymorphisms (SNPs) obtained from the
genotyping of 219 common bean accessions. (a) Distribution of SNP density along the common bean genome in
a 200 kb sliding window. (b) Annotation of SNPs and proportion of genomic traits. (c) Transversion/transition
ratio. Figure produced in R v.4.0.
Chromosome Physical length (Mb)a Number of g enesa Total number of SNPs Tagged genes
Pv01 52.20 2779 4718 787
Pv02 49.04 3435 5910 1111
Pv03 52.28 3058 4983 874
Pv04 45.96 1890 4650 596
Pv05 40.82 1928 4321 529
Pv06 31.97 2295 3361 721
Pv07 51.75 2895 3903 853
Pv08 59.66 3023 5635 914
Pv09 37.47 2719 3735 716
Pv10 43.27 1721 3939 512
Pv11 50.37 2253 4662 653
Total – 27,996 49,817 8266
Table 1. Number of SNPs in each of the 11 common bean chromosomes in the set of 219 accessions from the
Brazilian Diversity Panel. a Information obtained from the EnsemblPlants website (https://plants.ensembl.org).
purple, red, cream, and other tegument colors. The admixture group comprised accessions that had resulted
from hybridization between the previous two groups. The accessions of commercial groups other than black
and carioca (i.e., purple, red, cream, and others) were predominantly grouped with the black commercial group;
however, there was a tendency to cluster according to the color of the flower, which is purple in the black group,
white in the carioca group, and variable (white, pink, and purple) in other accessions. Three accessions initially
identified as Mesoamerican were assigned to the Andean group in these analyses and were therefore treated as
Andean in subsequent analyses.
Removal of accessions of Andean origin from the panel left 207 accessions of the Mesoamerican origin.
Among these 207 accessions, 25,136 SNPs with MAF > 0.05 could be identified, i.e., the number of SNPs per
chromosome was reduced on average by 50% relative to the number of SNPs identified when the Andean acces-
sions were included in the panel. The chromosomes exhibiting the greatest reduction in the number of SNPs
were Pv05 and Pv11, whereas Pv09 and Pv01 presented the smallest reduction.
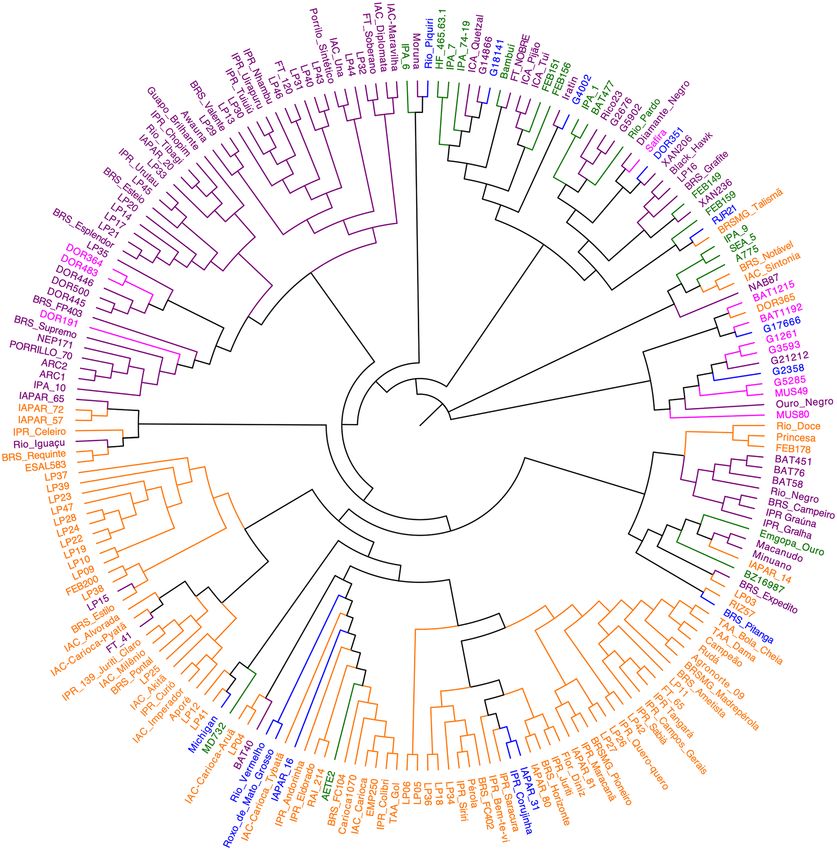
Genetic differentiation between Andean and Mesoamerican gene pools. The two gene pools
shared 7987 SNPs, whereas 17,149 and 12,876 SNPs were unique to the Mesoamerican and Andean groups
(Fig. 2b), respectively. The mean pairwise fixation index (Fst) for each of these SNP groups was 0.39, 0.34, and
0.94, respectively (Fig. 2c). A total of 11,805 SNPs differentiating the Andean and Mesoamerican groups were
detected, with a mean Fst of 0.97. The mean Fst between the Andean and Mesoamerican pools was 0.77 when all
Scientific Reports | (2021) 11:2964 | https://doi.org/10.1038/s41598-021-82437-4 3
Vol.:(0123456789)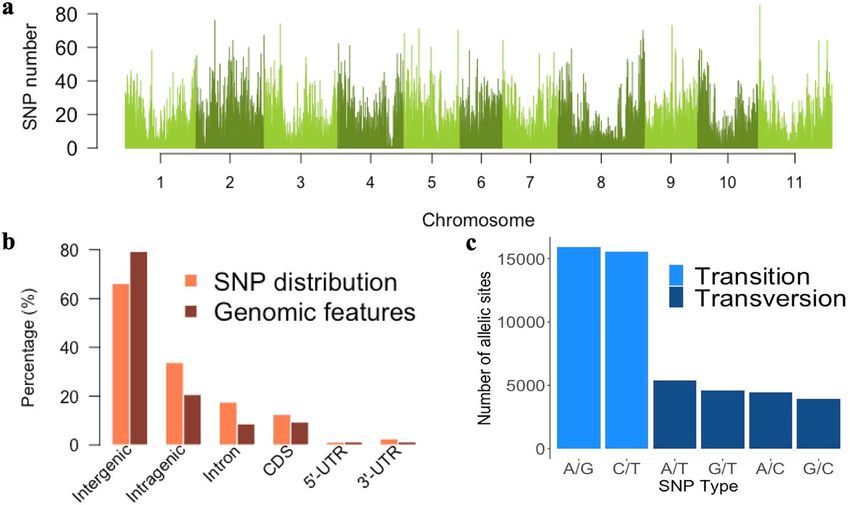
www.nature.com/scientificreports/
Figure 2. Genetic differentiation between Andean and Mesoamerican gene pools. (a) Principal component
analysis of 219 accessions of Andean and Mesoamerican origin including different commercial groups (black,
carioca, cream, red, etc.). (b) Venn diagram of the total set of SNPs and SNPs belonging to the Andean and
Mesoamerican groups. (c) Distribution of the Fst values of each SNP (colored according to the population in
which they occur). (d) Total number of differentiating SNPs on each chromosome and number of differentiating
SNPs located within genes. (e) Distribution of the 11,805 differentiating SNPs of the Andean and Mesoamerican
groups along the common bean genome in a 200 kb sliding window. Figures (a), (c), (d) and (e) produced in R
v.4.0 and Figure b produced in JVENN (http://jvenn.toulouse.inra.fr).
the SNPs were included. The Mesoamerican group showed greater mean nucleotide diversity (π = 0.31) than the
Andean group (π = 0.22). Regarding Tajima’s D, the Mesoamerican gene pool showed a positive value (D = 1.50),
while the Andean gene pool showed a negative value (D = − 0.50) (Table 2).
Most SNPs that differentiate the Andean and Mesoamerican pools were located on chromosomes Pv01
(2492 SNPs), Pv08 (1781 SNPs), Pv09 (1554 SNPs), Pv02 (1506 SNPs), and Pv10 (1387 SNPs) (Fig. 2d,e), and
30.8% were located within genes, with 2187 genes including at least one differentiating SNP. Most of these SNPs
Scientific Reports | (2021) 11:2964 | https://doi.org/10.1038/s41598-021-82437-4 4
Vol:.(1234567890)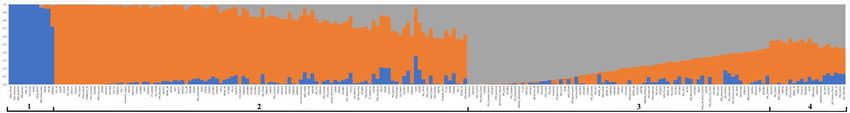
www.nature.com/scientificreports/
Figure 3. Analysis of the population structure using 219 accessions belonging to the Brazilian common
bean diversity panel with K = 3: (1) corresponds to the group of common beans of Andean origin; (2) mostly
formed by Mesoamerican accessions of black, cream, red, and other seed tegument colors; (3) mostly formed
by Mesoamerican accessions from the carioca commercial group; and (4) mostly formed by Mesoamerican
accessions with membership coefficient < 0.6 for the previous groups. Figure produced in R v.4.0.
N SNPs π D Fst1
Origin Andean
Mesoamerican 207 25,136 0.31 1.50 0.77
Andean 12 20,863 0.22 − 0.50
Seed tegument color Black Red Cream
Cream with brown stripes (Carioca) 85 22,275 0.32 1.32 0.12 0.22 0.12
Black 78 22,289 0.31 1.23 0.10 0.03
Red 11 18,447 0.35 0.69 0.08
Cream 19 27,579 0.29 0.40
Institutions of origin2 EMBRAPA IAC IAPAR
CIAT 45 21,676 0.34 1.28 0.06 0.12 0.09
EMBRAPA 29 22,183 0.34 1.08 0.09 0.01
IAC 14 28,577 0.30 0.44 0.06
IAPAR 84 22,735 0.32 1.35
Table 2. Nucleotide diversity (π), Tajima’s D and weighted Fst estimated in the Brazilian common bean
diversity panel in relation to different centers of origin, seed colors, and institutions of origin. N number
of accessions, SNPs number of SNPs, π nucleotide diversity, D Tajima’s D statistics. 1Weir and Cockerham,
1984. 2CIAT International Center for Tropical Agriculture (Centro Internacional de Agricultura Tropical),
EMBRAPA Brazilian Agricultural Research Corporation (Empresa Brasileira de Pesquisa Agropecuária), IAC
Agronomic Institute of Campinas (Instituto Agronômico de Campinas), IAPAR Rural Development Institute of
Paraná–IAPAR–EMATER (Instituto de Desenvolvimento Rural do Paraná).
inside genes were located on chromosomes Pv02 (648 SNPs), Pv01 (595 SNPs), Pv09 (504 SNPs), Pv06 (476
SNPs), and Pv08 (435 SNPs) chromosomes (Fig. 2d). Among the SNPs located in coding regions, 26% were
synonymous SNPs and 74% were non-synonymous (being 68% missense variants). Of the genes containing the
differentiating SNPs, 279 were putative candidates for domestication, of which 179 are known to be involved in
the domestication of the Mesoamerican group, 91 in that of the Andean group, and 9 in the domestication of
both these g roups5.
Genetic differentiation among the Mesoamerican accessions. As seen in the PCA and Bayesian
analysis of population structure, the accessions of Mesoamerican origin were also segregated into two main
groups in the phylogenetic tree, based on the tegument color, with one group consisting of the carioca commer-
cial group and the other including the accessions with black, cream, red, white and purple tegument (Figs. 4a, 5).
The separation of Mesoamerican individuals by seed color showed that each group had a variable number
of SNPs, and only 12,795 SNPs were common to all these color groups (Fig. 4b). The cream-colored accessions
exhibited the highest number of SNPs (27,579) and the lowest π (0.29) value. The red-colored group had the
highest π (0.35), whereas π values of the carioca and black groups were similar (0.32 and 0.31, respectively)
(Table 2). According to Fst, the carioca and red groups were the most different, with an Fst value of 0.22, whereas
comparisons between the other colors yielded low Fst values. The Tajima’s D values were all positive in relation
to the seed tegument color as well as for the institution of origin (Table 2).
Regarding the institution of origin, a clustering trend was observed for the accessions of the International
Center for Tropical Agriculture (CIAT), Agronomic Institute of Pernambuco (IPA), and the more recent inbred
lines of the Rural Development Institute of Paraná—IAPAR–EMATER (IAPAR) (Fig. 4c). The number of SNPs
was variable for each institution; however, the π was similar. A total of 16,196 SNPs was shared in the accessions
of all institutions, whereas 8210 were exclusive, i.e., belonged to only one institution (Fig. 4d). The Agronomic
Institute of Campinas (IAC) accessions presented the highest number of exclusive markers (6112), whereas
the Brazilian Agricultural Research Corporation (EMBRAPA) accessions included only 313 unique markers.
Comparison of the accessions from different institutions did not yield high differentiation indexes (Fst), with the
Scientific Reports | (2021) 11:2964 | https://doi.org/10.1038/s41598-021-82437-4 5
Vol.:(0123456789)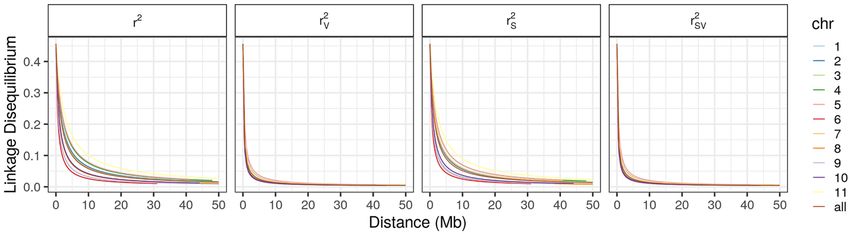
www.nature.com/scientificreports/
Figure 4. Principal component analyses and Venn diagrams. (a) Principal component analysis of 207
accessions of common beans of Mesoamerican origin with different seed tegument colors. (b) Venn diagram for
the different sets of SNPs related to seed tegument color. (c) Principal component analysis of 207 accessions of
common beans from different research institutions. (d) Venn diagram for the different sets of SNPs related to
the institutions of origin. Figure (a) and (c) produced in R v.4.0 and Figures b and d produced in JVENN (http://
jvenn.toulouse.inra.fr).
highest value being observed between CIAT and IAC (0.12) and the lowest value between IAPAR and EMBRAPA
(0.01) (Table 2).
Linkage disequilibrium. LD decay and half-decay distances were calculated for individual chromosomes
and for the whole genome. In both cases, the differences between conventional r2 and population structure-
corrected r2 (r2s) were small. Considering the whole genome (all chromosomes), the half-decay distance was
1361 kb and 1180 kb for r2 and r2s, respectively. The r2 was remarkably different when compared with r2v (r2
corrected for relatedness) and r2vs (r2 corrected for population structure and relatedness) (Fig. 6). The latter two
measures exhibited very similar decay values, with half-decay occurring at 249 kb.
In the analysis of r2v and r2vs of individual chromosomes, the half-decay distance ranged from 183 to 397. The
highest decay values were noted for chromosomes Pv10, Pv08, Pv01, and Pv06 chromosomes (183, 187, 193 and
198 kb, respectively), whereas the lowest decay values were presented by chromosomes Pv05, Pv04, Pv07, and
Pv09 (397, 322, 317 and 310, respectively) (Fig. 6).
Discussion
The common bean is a very important crop in Brazil and is cultivated in all states of the country, mainly by family
farmers. Considering the history of common bean cultivation in the country, domesticated common beans are
iversity50,51. In this context, the present study was devel-
highly diverse, although Brazil is not a primary center of d
oped to understand the genetics and population structure of a newly created common bean diversity panel that
includes a large part of the diversity of the most consumed common bean types in Brazil. These results will assist
future GWAS for determining genomic regions or genes associated with several economically important traits.
The GBS methodology proposed by Ariani et al.18 was used in this study, which could effectively detect
numerous SNPs in the analyzed accessions. These authors found that the CviAII enzyme was more effective than
the commonly used ApeKI enzyme. As a methylation-insensitive enzyme, CviAII exhibited a higher number
of restriction sites and acted preferentially on non-repetitive parts of the genome, allowing the identification
of thousands of markers spaced unevenly throughout the common bean genome, with a density distribution
resembling that of the distribution of genes.
Scientific Reports | (2021) 11:2964 | https://doi.org/10.1038/s41598-021-82437-4 6
Vol:.(1234567890)www.nature.com/scientificreports/
Figure 5. Dendrogram showing the genetic relatedness among 207 common bean accessions belonging to
the Brazilian Diversity Panel. The different colors identify the accessions according to the color of the seed
tegument. Purple = black tegument, Orange = carioca-type tegument, Green = cream tegument, Pink = red
tegument, and Blue = others. Figure produced in FigTree v1.4.4.
Initially, 461,199 SNPs were identified. However, 89% of the markers did not satisfy the filtering criteria (Non-
biallelic, indels, MAF < 0.05, coefficient of inbreeding < 0.9 and less than 10% of genotyped positions) and were
not used in subsequent analyses. Polymorphisms were widely distributed across the 11 chromosomes and were
highly correlated with the length and number of genes on each chromosome. The transition/transversion rate
was consistent with that observed in other studies on common bean and other species28,35,52,53. Transitions are
usually more frequent than transversions in several species, which indicates that the former are better tolerated
during natural selection, which may be due to the fact that they are synonymous mutations in protein-coding
sequences29,54.
Because LD may affect the inference of the population structure, an LD filter was further applied, which
resulted in a decrease of the number of SNPs. This is due to the fact that the common bean is an autogamous
plant with very long blocks of markers in LD35,55,56.
Scientific Reports | (2021) 11:2964 | https://doi.org/10.1038/s41598-021-82437-4 7
Vol.:(0123456789)www.nature.com/scientificreports/
Figure 6. Analysis of linkage disequilibrium (LD) decay as a function of physical distance without correction
(r2), and after correcting for population structure (r2s), relatedness (r2v), and for both population structure and
relatedness (r2vs). Figure produced in R v.4.0.
Genetic differentiation between common bean accessions based on the gene pool has been well documented
in several previous studies3,34,35,57–60. The relationship between the genetic similarity of the Mesoamerican acces-
sions and the color of the seed tegument was also observed by Valdisser et al.61 and Gioia et al.62. In Brazil, breed-
ing programs for the carioca and black commercial groups have different objectives63. Moreover, genetic breeding
of the carioca group is much more advanced than that of the black group, because of its greater importance in
the country due to consumers and market preferences. Efforts to improve the carioca bean are directed towards
the grain size traits, to satisfy the consumers’ preference for larger grains. However, the grain size is negatively
correlated with yield, in case of the black group, selection is based mainly on yield, resulting in cultivars with
smaller grains64.
Several SNPs exclusive to either of the gene pools were observed, in addition to the differentiating SNPs
between the two pools. Other authors have also reported that the proportion of polymorphic loci tends to be
higher in populations composed of accessions from the two centers of origin, and it tends to decrease when they
are studied separately61,65,66. The two gene pools differ in both phenotypic and molecular characteristics, which is
supported by the high rates of genetic differentiation obtained in the present analysis and in other s tudies50,51,61,67.
In addition, the Mesoamerican gene pool exhibits higher nucleotide diversity than the Andean, possibly because
a strong bottleneck occurred during the dispersal of Southern Andean common beans from Mesoamerica, which
drastically reduced its nucleotide d iversity4,5,33,34,60,67.
To identify genomic signatures of selection between the Andean and Mesoamerican pools, the Fst was esti-
mated for each SNP. The Fst of nucleotide positions that were polymorphic only when the two gene pools were
studied together was close to 1, and these SNPs were therefore highly discriminating between the gene pools.
The Fst of SNPs present only in the Andean group was also high, similar to that of the discriminating markers.
This may be due to the small number of Andean accessions included in this study.
There is significant evidence supporting the independent domestication of the Andean and Mesoamerican
gene pools. Schmutz et al.5 identified 1835 candidate genes for domestication in the Mesoamerican group and
748 candidate genes in the Andean group. Of these, only 59 genes were common to both groups. These genes are
mainly located on chromosomes Pv01, Pv02, Pv07, Pv09, and Pv10. In the present study, 11% of all the candidate
genes for domestication harbored differentiating SNPs. These genes have also been identified in other studies
aimed at finding selection signatures between the Andean and M esoamerican34,35 accessions. The candidate genes
for domestication are directly or indirectly associated with the main characteristics that distinguish the two gene
pools, such as flowering time, plant size, and seed size.
The low rate of differentiation of the accessions based on the institution of origin may be related to the
protocols of the breeding programs. Breeding programs tend to be conservative and almost always employ the
Mesoamerican germplasm, with little exploration of exotic germplasms; in addition, they use a selected group
of elite parents, which further narrows the genetic b ase57,61–63. Because of significant exchange of germplasm
between institutions, there was no formation of well-defined groups among the accessions from the different
institutions of o rigin57, only a trend for clustering was observed for accessions belonging to CIAT, IPA, and the
more recent inbred lines of IAPAR.
LD measurement is very important in association mapping studies for identifying loci associated with quan-
titative traits. Importantly, the population structure and relatedness between the analyzed accessions may cause
a bias in LD estimation. Frequent selection, admixture of populations, and crossing of a small number of culti-
vars in breeding programs reduces genetic diversity and affects LD p atterns68. These factors can affect different
genomic regions in several ways, which can introduce heterogeneity of LD through the genome. This makes the
resolution and power achieved in GWAS dependent on the species and the population under study. LD decay
is slower in autogamous species, such as common bean and soybean, in which recombination is less effective
than in allogamous species68,69.
In this study, the LD corrected for population structure (r2s) was not significantly different from the conven-
tional r2. However, r2v and r2vs exhibited a faster LD decay when compared with the conventional r2. The fact
that r2v was considerably lower than conventional r2 demonstrates the need to remove the effect of relatedness
to reduce the overestimation of LD. The similarity between the estimated r2 and r2s (LD half-decay with 296 kb)
shows that the BDP is not highly structured, which is consistent with the results of other studies on common
bean diversity p anels40,51,57. As observed by Diniz et al.57 in panels composed mainly of improved genotypes, the
degree of relatedness between individuals was very high.
Scientific Reports | (2021) 11:2964 | https://doi.org/10.1038/s41598-021-82437-4 8
Vol:.(1234567890)www.nature.com/scientificreports/
The present study demonstrated that GBS is a powerful approach for analyzing the population structure and
genetic diversity in common bean. The newly developed diversity panel, which represents a large proportion of
the Brazilian common bean diversity, exhibited high genetic diversity, and was shown to be adequate for future
studies to identify genomic regions related to traits of interest (GWAS).
Methods
Plant material. The BDP, including 230 common bean accessions that represent a large component of the
common bean genetic diversity in Brazil, was used in this study (Table S1). The diversity panel is composed
of modern and old cultivars developed between 1968 and 2019 by different research institutions (Table 2), in
addition to inbred lines and landraces, all of which belong to the germplasm bank of the Rural Development
Institute of Paraná –IAPAR–EMATER (IAPAR). Among the CIAT accessions present in this panel, most of them
are inbred lines from breeding programs directed to the needs of Brazil and/or are accessions that compose the
genealogy of cultivars developed by Brazilian institutions. Most accessions in this panel are of Mesoamerican
origin, which exhibit significant diversity in the color of the seed tegument and include different commercial
classes, with the carioca and black bean groups being the most representative. In addition, 10 accessions of
Andean origin were included in this study for comparison.
Genotyping by sequencing (GBS). DNA extraction and the preparation of GBS libraries for sequencing
was performed following the protocol developed for common bean by Ariani et al.18. DNA was extracted from
lyophilized leaves collected from a single plant of each accession grown in a green house. The extracted DNA
was purified using the Genomic DNA Clean and Concentrator kit (Zymo Research, CA, USA), according to the
manufacturer’s instructions. The DNA quality was checked using NanoDrop Lite (Thermo Fisher Scientific),
and only samples with an absorbance ratio (A260/A280) greater than 1.7 were used for preparing the libraries.
Genomic DNA was quantified using Quant-iT PicoGreen dsDNA Assay Kit (Thermo Fisher Scientific), and
100 ng of the DNA from each genotype was used for preparing the libraries.
The genomic DNA was digested using the restriction enzyme CviAII (recognition site C’ATG); after the
preparation process, the samples were multiplexed into two libraries with up to 144 accessions each, including
as control a blank sample and the genotype of P. vulgaris used to construct the reference genome (G19833) in
each of the two libraries67. The presence of adapter dimers in the sequencing libraries was checked using DNA
High Sensitivity Kit (Agilent 2100 Bionalyzer, Agilent Technologies).
The genomic libraries were sequenced using the Illumina HiSeq 4000 sequencer (Illumina, San Diego, CA,
USA) with the 100-bp-single-end protocol, at the DNA Technologies and Expression Analysis Core Laboratory,
located in the Genome Center, University of California, Davis, CA.
Analysis of sequencing data. SNPs were called using the Tassel-5-GBS pipeline version 2 70, with the
standard software settings, except for the minimum quality score (-mnQs 20) and minimum count (-c 10)
parameters. The obtained sequences were aligned with the reference genome of Phaseolus vulgaris v2.0 obtained
from the Phytozome website (https://phytozome.jgi.doe.gov, accessed on March 10, 2019), using the Burrows-
Wheeler Alignment (BWA) (-aln option) tool version 0.7.1071. Non-biallelic SNPs, and SNPs with indels, minor
allele frequency (MAF) < 0.05, coefficient of inbreeding < 0.9, and those SNPs and accessions containing < 10%
of genotyped positions were removed using VCFtools version 0.1.1572. Because common bean is an autogamous
species, after the initial filtering, the occurrence of heterozygotes was insignificant, but heterozygous SNPs were
treated as missing data, as they may indicate sequencing errors. After filtering, the SNPs were imputed using
Beagle software version 573, and only SNPs anchored to chromosomes in the common bean reference genome
were used.
The SNPs were annotated according to the common bean genomic annotation (GFF3 file, version 2.1) avail-
able on the Phytozome website (https://phytozome.jgi.doe.gov, accessed on January 10, 2019), using a custom
R74 script developed by Hu et al.75 (https://github.com/zhenbinHU/Sorghum_SNP_dataset, accessed on June
17, 2019).
Genetic diversity and population structure. The 219 accessions belonging to the BDP that passed by
the quality control mentioned above were included in the initial analyses. The population structure was inferred
using the Bayesian clustering algorithm in Structure v2.3.476 software from the command line python program
StrAuto77. The admixture model with 50,000 burn-ins, 200,000 MCMC, and 10 replications for hypothetical
numbers of subpopulations (K) between 1 and 10 was used. The statistical parameter ΔK49 was used to determine
the number of groups. Only the accessions with a membership coefficient equal or higher than 0.6 were assigned
to a genetic group, and those with membership coefficient lower than 0.6 were clustered in the admixture group.
The admixture model assumes that the markers are not strongly linked; hence, the SNPs were filtered based on
LD, using the indep-pairwise option of the PLINK78 software, and only SNPs with LD ≤ 0.2 were retained for
population structure analysis. These data filtered for LD were also used for PCA, using the snpgdsPCA function
of the S NPRelate79 package in R.
After verifying the center of origin, only individuals of Mesoamerican origin were retained, and the SNPs were
again filtered to exclude monomorphics, SNPs with MAF < 0.05 and LD ≥ 0.2, using VCFtools version 0.1.1572
and PLINK78. These data were then used for PCA and population structure analysis, as previously described.
In addition, phylogenetic inference was estimated using TASSEL v580, based on identity-by-state (IBS) distance
and using Neighbor-Joining as the clustering method. The generated tree was customized using FigTree v1.4.481.
To detect molecular differences in relation to the center of origin, color of the seed tegument, and institution
of origin, new files were created from the initial file (including all SNPs) containing the different groups, and only
Scientific Reports | (2021) 11:2964 | https://doi.org/10.1038/s41598-021-82437-4 9
Vol.:(0123456789)www.nature.com/scientificreports/
polymorphic SNPs and those with MAF > 0.05 were retained. Subsequently, a Venn diagram was constructed to
detect the differentiating SNPs for each of the three parameters using the JVENN t ool82. Fst index83, nucleotide
diversity (π) and Tajima’s D 84, were also calculated using VCFtools version 0.1.1572 and averaged on 100-kb
genomic bins.
Linkage disequilibrium. LD between SNPs was estimated using the L DcorSV85 package in R. This package
corrects for the bias due to population structure and relatedness while estimating LD. In addition to the conven-
tional r2, r2 corrected for population structure (r2s), r2 considering kinship (r2v), and r2 including both population
structure and kinship (r2vs) were calculated. Only individuals belonging to the Mesoamerican group were used
for these calculations. The STRUCTURE result at K = 2 for common beans of Mesoamerican origin was used as
the population structure, and for relatedness the kinship matrix was calculated using the rrBLUP86 package in
R. LD decay was calculated using the nonlinear method proposed by Hill and W eir87, and adjusted with the nls
function in R.
Received: 18 August 2020; Accepted: 7 January 2021
References
1. Broughton, W. J. et al. Beans (Phaseolus spp.)—model food legumes. Plant Soil 252, 55–128 (2003).
2. FAO, F. and A. O. FAOSTAT: FAO Statistical Databases. http://www.fao.org/faostat/ (2020).
3. Kwak, M. & Gepts, P. Structure of genetic diversity in the two major gene pools of common bean (Phaseolus vulgaris L., Fabaceae).
Theor. Appl. Genet. 118, 979–992 (2009).
4. Bitocchi, E. et al. Molecular analysis of the parallel domestication of the common bean (Phaseolus vulgaris) in Mesoamerica and
the Andes. New Phytol. 197, 300–313 (2013).
5. Schmutz, J. et al. A reference genome for common bean and genome-wide analysis of dual domestications. Nat. Genet. 46, 707–713
(2014).
6. Vlasova, A. et al. Genome and transcriptome analysis of the Mesoamerican common bean and the role of gene duplications in
establishing tissue and temporal specialization of genes. Genome Biol. 17, 1–18 (2016).
7. Oladzad, A. et al. Single and multi-trait GWAS identify genetic factors associated with production traits in common bean under
abiotic stress environments. G3 Genes Genomes Genet. 9, 1881–1892 (2019).
8. Cichy, K. A., Caldas, G. V., Snapp, S. S. & Blair, M. W. QTL analysis of seed iron, zinc, and phosphorus levels in an andean bean
population. Crop Sci. 49, 1742–1750 (2009).
9. Ribeiro, N. D. et al. Evaluation of special grains bean lines for grain yield, cooking time and mineral concentrations. Crop Breed.
Appl. Biotechnol. 14, 15–22 (2014).
10. Perseguini, J. M. K. C. et al. Developing a common bean core collection suitable for association mapping studies. Genet. Mol. Biol.
38, 67–78 (2015).
11. MAPA, Ministerio da Agricultura Pecuária e Abastecimento. Plano nacional de desenvolvimento da cadeia do feijão e pulses
(2018).
12. Cheng, J. et al. Development of a SNP array and its application to genetic mapping and diversity assessment in pepper (Capsicum
spp.). Sci. Rep. 6, 1–11 (2016).
13. He, J. et al. Genotyping-by-sequencing (GBS), an ultimate marker-assisted selection (MAS) tool to accelerate plant breeding. Front.
Plant Sci. 5, 484 (2014).
14. Bhattarai, U. & Subudhi, P. K. Identification of drought responsive QTLs during vegetative growth stage of rice using a saturated
GBS-based SNP linkage map. Euphytica 214, 1–17 (2018).
15. Stapley, J. et al. Adaptation genomics: The next generation. Trends Ecol. Evol. 25, 705–712 (2010).
16. Gujaria-Verma, N. et al. Gene-based SNP discovery in tepary bean (Phaseolus acutifolius) and common bean (P. vulgaris) for
diversity analysis and comparative mapping. BMC Genomics 17, 239 (2016).
17. Siadjeu, C., Mayland-Quellhorst, E. & Albach, D. C. Genetic diversity and population structure of trifoliate yam (Dioscorea dume-
torum Kunth) in Cameroon revealed by genotyping-by-sequencing (GBS). BMC Plant Biol. 18, 1–14 (2018).
18. Ariani, A., Bern y Miery Teran, J. C. & Gepts, P. Genome-wide identification of SNPs and copy number variation in common bean
(Phaseolus vulgaris L.) using genotyping-by-sequencing (GBS). Mol. Breed. 36, 87 (2016).
19. Elshire, R. J. et al. A robust, simple genotyping-by-sequencing (GBS) approach for high diversity species. PLoS ONE 6, 1–10 (2011).
20. Schröder, S. et al. Optimization of genotyping by sequencing (GBS) data in common bean (Phaseolus vulgaris L.). Mol. Breed. 36,
1–9 (2016).
21. Wang, S. et al. Sequence-based ultra-dense genetic and physical maps reveal structural variations of allopolyploid cotton genomes.
Genome Biol. 16, 108 (2015).
22. Burghardt, L. T., Young, N. D. & Tiffin, P. A guide to genome-wide association mapping in plants. Curr. Protoc. Plant Biol. 2, 22–38
(2017).
23. Korte, A. & Ashley, F. The advantages and limitations of trait analysis with GWAS: A review Self-fertilisation makes Arabidopsis
particularly well suited to GWAS. Plant Methods 9, 29 (2013).
24. Zhang, D., Bai, G., Zhu, C., Yu, J. & Carver, B. F. Genetic diversity, population structure, and linkage disequilibrium in U.S. elite
winter wheat. Plant Genome J. 3, 117 (2010).
25. Nicolas, S. D. et al. Genetic diversity, linkage disequilibrium and power of a large grapevine (Vitis vinifera L) diversity panel newly
designed for association studies. BMC Plant Biol. 16, 1–19 (2016).
26. Bhatta, M., Morgounov, A., Belamkar, V., Poland, J. & Baenziger, P. S. Unlocking the novel genetic diversity and population structure
of synthetic Hexaploid wheat. BMC Genomics 19, 1–12 (2018).
27. Eltaher, S. et al. Genetic diversity and population structure of F3:6 Nebraska Winter wheat genotypes using genotyping-by-
sequencing. Front. Genet. 9, 1–9 (2018).
28. Alipour, H. et al. Genotyping-by-sequencing (GBS) revealed molecular genetic diversity of Iranian wheat landraces and cultivars.
Front. Plant Sci. 8, 1–14 (2017).
29. Luo, Z. et al. Genetic diversity and population structure of a Camelina sativa spring panel. Front. Plant Sci. 10, 1–12 (2019).
30. Pereira-Dias, L., Vilanova, S., Fita, A., Prohens, J. & Rodríguez-Burruezo, A. Genetic diversity, population structure, and relation-
ships in a collection of pepper (Capsicum spp.) landraces from the Spanish centre of diversity revealed by genotyping-by-sequencing
(GBS). Hortic. Res. 6, 54 (2019).
Scientific Reports | (2021) 11:2964 | https://doi.org/10.1038/s41598-021-82437-4 10
Vol:.(1234567890)www.nature.com/scientificreports/
31. Xu, Q. et al. The genetic diversity and structure of indica rice in China as detected by single nucleotide polymorphism analysis.
BMC Genet. 17, 1–8 (2016).
32. Moghaddam, S. M. et al. Genome-wide association study identifies candidate loci underlying agronomic traits in a middle Ameri-
can diversity panel of common bean. Plant Genome 9, 1–21 (2016).
33. Cichy, K. A. et al. A Phaseolus vulgaris diversity panel for Andean bean Improvement. Crop Sci. 55, 2149–2160 (2015).
34. Campa, A., Murube, E. & Ferreira, J. J. Genetic diversity, population structure, and linkage disequilibrium in a Spanish common
bean diversity panel revealed through genotyping-by-sequencing. Genes (Basel) 9, 518 (2018).
35. Lioi, L., Zuluaga, D. L., Pavan, S. & Sonnante, G. Genotyping-by-sequencing reveals molecular genetic diversity in Italian common
bean landraces. Diversity 11, 1–14 (2019).
36. Raggi, L., Caproni, L., Carboni, A. & Negri, V. Genome-wide association study reveals candidate genes for flowering time variation
in common bean (Phaseolus vulgaris L.). Front. Plant Sci. 10, 1–14 (2019).
37. Perseguini, J. M. K. C. et al. Genome-wide association studies of anthracnose and angular leaf spot resistance in common bean
(Phaseolus vulgaris L.). PLoS ONE 11, 1–19 (2016).
38. Tock, A. J. et al. Genome-wide linkage and association mapping of halo blight resistance in common bean to race 6 of the globally
important bacterial pathogen. Front. Plant Sci. 8, 1–17 (2017).
39. Katuuramu, D. N. et al. Genome-wide association analysis of nutritional composition-related traits and iron bioavailability in
cooked dry beans (Phaseolus vulgaris L.). Mol. Breed. 38, 44 (2018).
40. Resende, R. T. et al. Genome-wide association and Regional Heritability Mapping of plant architecture, lodging and productivity
in Phaseolus vulgaris. G3 Genes Genomes Genet. 8, 2841–2854 (2018).
41. Moghaddam, S. M. et al. Genetic architecture of dietary fiber and oligosaccharide content in a middle american panel of edible
dry bean. Plant Genome 11, 1–11 (2018).
42. Kamfwa, K., Cichy, K. A. & Kelly, J. D. Genome-wide association study of agronomic traits in common bean. Plant Genome 8,
1–12 (2015).
43. Cichy, K. A., Wiesinger, J. A. & Mendoza, F. A. Genetic diversity and genome-wide association analysis of cooking time in dry
bean (Phaseolus vulgaris L.). Theor. Appl. Genet. 128, 1555–1567 (2015).
44. Kamfwa, K., Cichy, K. A. & Kelly, J. D. Genome-wide association analysis of symbiotic nitrogen fixation in common bean. Theor.
Appl. Genet. 128, 1999–2017 (2015).
45. Zuiderveen, G. H., Padder, B. A., Kamfwa, K. & Song, Q. Genome-wide association study of anthracnose resistance in Andean
beans (Phaseolus vulgaris). PLoS ONE https://doi.org/10.1371/journal.pone.0156391 (2016).
46. Soltani, A. et al. Genetic architecture of flooding tolerance in the dry bean middle-American diversity panel. Front. Plant Sci. 8,
1–15 (2017).
47. Soltani, A. et al. Genetic analysis of flooding tolerance in an Andean diversity panel of dry bean (Phaseolus vulgaris L.). Front.
Plant Sci. 9, 767 (2018).
48. Valdisser, P. A. et al. Genome-wide association studies detect multiple QTLs for productivity in Mesoamerican diversity panel of
common bean under drought stress. Front. Plant Sci. https://doi.org/10.3389/fpls.2020.574674 (2020).
49. Evanno, G., Regnaut, S. & Goudet, J. Detecting the number of clusters of individuals using the software STRUCTURE: A simula-
tion study. Mol. Ecol. 14, 2611–2620 (2005).
50. Burle, M. L., Fonseca, J. R., Kami, J. A. & Gepts, P. Microsatellite diversity and genetic structure among common bean (Phaseolus
vulgaris L.) landraces in Brazil, a secondary center of diversity. Theor. Appl. Genet. 121, 801–813 (2010).
51. Valdisser, P. A. M. R. et al. In-depth genome characterization of a Brazilian common bean core collection using DArTseq high-
density SNP genotyping. BMC Genomics 18, 1–19 (2017).
52. Gaur, R. et al. High density linkage mapping of genomic and transcriptomic SNPs for synteny analysis and anchoring the genome
sequence of chickpea. Sci. Rep. 5, 1–11 (2015).
53. Pavan, S. et al. A distinct genetic cluster in cultivated chickpea as revealed by genome-wide marker discovery and genotyping.
Plant Genome 10, 1–9 (2017).
54. Guo, C. et al. Transversions have larger regulatory effects than transitions. BMC Genomics 18, 1 (2017).
55. Berny Mier y Teran, J. C. et al. Root and shoot variation in relation to potential intermittent drought adaptation of Mesoamerican
wild common bean (Phaseolus vulgaris L.). Ann. Bot. https://doi.org/10.1093/aob/mcy221 (2018).
56. Blair, M. W. et al. Uneven recombination rate and linkage disequilibrium across a reference SNP map for common bean (Phaseolus
vulgaris L.). PLoS ONE 13, 1–21 (2018).
57. Diniz, A. L. et al. Evidence for strong kinship influence on the extent of linkage disequilibrium in cultivated common beans. Genes
(Basel) 10, 1–16 (2019).
58. Pipan, B. & Meglič, V. Diversification and genetic structure of the western-to-eastern progression of European Phaseolus vulgaris
L. germplasm. BMC Plant Biol. 19, 1–16 (2019).
59. Raatz, B. et al. Analyses of African common bean (Phaseolus vulgaris L.) germplasm using a SNP fingerprinting platform: Diversity,
quality control and molecular breeding. Genet. Resour. Crop Evol. 66, 707–722 (2019).
60. Valentini, G., Gonçalves-Vidigal, M. C., Elias, J. C. F., Moiana, L. D. & Mindo, N. N. A. Population structure and genetic diversity
of common bean accessions from Brazil. Plant Mol. Biol. Rep. 36, 897–906 (2018).
61. Valdisser, P. A. M. R. et al. SNP discovery in common bean by restriction-associated DNA (RAD) sequencing for genetic diversity
and population structure analysis. Mol. Genet. Genomics 291, 1277–1291 (2016).
62. Gioia, T., Logozzo, G., Marzario, S., Zeuli, P. S. & Gepts, P. Evolution of SSR diversity from wild types to U.S. Advanced cultivars
in the Andean and Mesoamerican domestications of common bean (Phaseolus vulgaris). PLoS ONE 14, 1–21 (2019).
63. Delfini, J. et al. Distinctness of Brazilian common bean cultivars with carioca and black grain by means of morphoagronomic and
molecular descriptors. PLoS ONE 12, e0188798 (2017).
64. Delfini, J. et al. Estimation of genetic parameters and prediction of genotypic values in common beans using mixed models. Emir-
ates J. Food Agric. 30, 1026–1035 (2018).
65. Cortés, A. J., Chavarro, M. C. & Blair, M. W. SNP marker diversity in common bean (Phaseolus vulgaris L.). Theor. Appl. Genet.
123, 827–845 (2011).
66. Blair, M. W. et al. A high-throughput SNP marker system for parental polymorphism screening, and diversity analysis in common
bean (Phaseolus vulgaris L.). Theor. Appl. Genet. 126, 535–548 (2013).
67. Ariani, A., Mier Teran, J. C. B. & Gepts, P. Spatial and temporal scales of range expansion in wild Phaseolus vulgaris. Mol. Biol.
Evol. 35, 119–131 (2017).
68. Contreras-Soto, R. I., de Oliveira, M. B., Costenaro-da-Silva, D., Scapim, C. A. & Schuster, I. Population structure, genetic related-
ness and linkage disequilibrium blocks in cultivars of tropical soybean (Glycine max). Euphytica 213, 173 (2017).
69. Flint-Garcia, S. A., Thornsberry, J. M. & Buckler, E. S. Structure of linkage disequilibrium in plants. Annu. Rev. Plant Biol. 54,
357–374 (2003).
70. Glaubitz, J. C. et al. TASSEL-GBS: A high capacity genotyping by sequencing analysis pipeline. PLoS ONE 9, e90346 (2014).
71. Li, H. & Durbin, R. Fast and accurate long-read alignment with Burrows–Wheeler transform. Bioinformatics 26, 589–595 (2010).
72. Danecek, P. et al. The variant call format and VCFtools. Bioinformatics 27, 2156–2158 (2011).
73. Browning, B. L., Zhou, Y. & Browning, S. R. A one-penny imputed genome from next-generation reference panels. Am. J. Hum.
Genet. 103, 338–348 (2018).
Scientific Reports | (2021) 11:2964 | https://doi.org/10.1038/s41598-021-82437-4 11
Vol.:(0123456789)www.nature.com/scientificreports/
74. R Core Team. R: A language and environment for statistical computing (2020).
75. Hu, Z., Olatoye, M. O., Marla, S. & Morris, G. P. An integrated genotyping-by-sequencing polymorphism map for over 10,000
sorghum genotypes. Plant Genome 12, 180044 (2019).
76. Pritchard, J. K., Stephens, M. & Donnelly, P. Inference of population structure using multilocus genotype data. Genetics 155,
945–959 (2000).
77. Chhatre, V. E. & Emerson, K. J. StrAuto: Automation and parallelization of STRUCTURE analysis. BMC Bioinform. 18, 1–5 (2017).
78. Purcell, S. et al. PLINK: A tool set for whole-genome association and population-based linkage analyses. Am. J. Hum. Genet. 81,
559–575 (2007).
79. Zheng, X. et al. A high-performance computing toolset for relatedness and principal component analysis of SNP data. Bioinformat-
ics 28, 3326–3328 (2012).
80. Bradbury, P. J. et al. TASSEL: Software for association mapping of complex traits in diverse samples. Bioinformatics 23, 2633–2635
(2007).
81. Rambaut, A. FigTree v1.4.4 (2018).
82. Bardou, P., Mariette, J., Escudié, F., Djemiel, C. & Klopp, C. SOFTWARE Open Access jvenn: An interactive Venn diagram viewer.
BMC Bioinform. 15, 1–7 (2014).
83. Weir, B. S. & Cockerham, C. C. Estimating F-statistics for the analysis of population structure. Evolution (N.Y.) 38, 1358–1370
(1984).
84. Tajima, F. Statistical method for testing the neutral mutation hypothesis by DNA polymorphism. Genetics 123, 585–595 (1989).
85. Desrousseaux, D., Sandron, F., Siberchicot, A., Cierco-Ayrolles, C. & Mangin, B. LDcorSV: Linkage disequilibrium corrected by
the structure and the relatedness. R package version 1.3.2 (2017).
86. Endelman, J. B. Ridge regression and other kernels for genomic selection with R package rrBLUP. Plant Genome J. 4, 250 (2011).
87. Hill, W. G. & Weir, B. S. Variances and covariances of squared linkage disequilibria in finite populations. Theor. Popul. Biol. 33,
54–78 (1988).
Acknowledgements
The authors would like to thank the Instituto de Desenvolvimento Rural do Paraná (IDR-Paraná) and the Uni-
versity of California, Davis (through the Gepts’ Lab) for support this research and the Coordenação de Aper-
feiçoamento de Pessoal de Nível Superior – Brasil (CAPES) for the scholarship in Brazil and abroad (Finance
Code 001).
Author contributions
J.D., V.M.C. and L.S.A.G. conceived and designed the study; J.D. and J.S.N. collected plant material, extracted
DNA and performed the genotyping; J.D., G.C.S. and L.S.A.G. performed bioinformatics and statistical analyses;
J.D. drafted the manuscript; J.D., V.M.C., J.S.N., P.M.R, G.C.S., P.G., and L.S.A.G. edited and revised the final
manuscript. All authors read and approved the final manuscript.
Competing interests
The authors declare no competing interests.
Additional information
Supplementary Information The online version contains supplementary material available at https://doi.
org/10.1038/s41598-021-82437-4.
Correspondence and requests for materials should be addressed to L.S.A.G.
Reprints and permissions information is available at www.nature.com/reprints.
Publisher’s note Springer Nature remains neutral with regard to jurisdictional claims in published maps and
institutional affiliations.
Open Access This article is licensed under a Creative Commons Attribution 4.0 International
License, which permits use, sharing, adaptation, distribution and reproduction in any medium or
format, as long as you give appropriate credit to the original author(s) and the source, provide a link to the
Creative Commons licence, and indicate if changes were made. The images or other third party material in this
article are included in the article’s Creative Commons licence, unless indicated otherwise in a credit line to the
material. If material is not included in the article’s Creative Commons licence and your intended use is not
permitted by statutory regulation or exceeds the permitted use, you will need to obtain permission directly from
the copyright holder. To view a copy of this licence, visit http://creativecommons.org/licenses/by/4.0/.
© The Author(s) 2021
Scientific Reports | (2021) 11:2964 | https://doi.org/10.1038/s41598-021-82437-4 12
Vol:.(1234567890)You can also read